 Scott Moyer*
 Dork Sahagian
- Department of Earth and Environmental Sciences, Lehigh University, Bethlehem, PA, United States
Lava flows have presented the greatest hazard to human property during the most recent eruptions of Hawaiian volcanoes, and lava fountains are a source of these lava flows. The height of Hawaiian lava fountains reflects the exsolved gas content of the magma that controls eruption intensity. However, fountain height is not always observed, so we sought a proxy to estimate fountain heights of eruptions that were older or otherwise unobserved. Here, methods are described to empirically derive a relationship between the modal diameter of vesicles within Pele’s tears and spheres and lava fountain height, using samples of Pele’s tears produced during the last eruptions of Kīlauea Iki (1959) and Mauna Ulu (1969). The tears used to develop these relationships were approximately 1 to 4 mm in diameter. Additionally, since lava fountains 50–580 m high were used, the relationships we describe may only describe lava fountains in this height range. The strongest empirical relation follows the trendline Hmax = −2575d + 820, where Hmax is maximum lava fountain height and d is modal vesicle diameter. This empirical relationship may be applied to sub-Strombolian eruptions of tholeiite basalt that were not directly measured or observed to assess long-term shifts in lava fountain heights and thus the exsolved gas contents of a volcanic system. While the same conceptual framework can be applied beyond Hawai’i, the quantitative empirical relation may be slightly different in different systems, depending on total dissolved volatiles, magma chemistry and other factors.
Introduction
The Hawaiian hotspot (Wilson, 1963) produces tholeiitic basalts (MacDonald and Katsura, 1964) characteristic of the Hawaiian style of volcanic eruptions (Houghton et al., 2016), commonly erupted as lava fountains. In a lava fountain, pyroclasts are typically large enough to travel ballistically to fall back and be deposited proximally rather than becoming entrained in a convective plume (Head and Wilson, 1987). Those that are still incandescent upon ground impact form lava flows or collect in a pond or lava lake around the vent or weld into spatter ramparts (Capaccioni and Cuccoli, 2005). However, lava fountains can also produce finer ash and pyroclasts. These clasts can become entrained in the rising cloud of gases above the main lava fountain and are carried greater distances downwind (Parfitt and Wilson, 1999). While lava fountains are typically associated with Hawai’i, they have also been observed at volcanoes around the world, including those in Iceland, Italy, and Chile (Moune et al., 2007; Porritt et al., 2012; Romero et al., 2018). Bubbles grow within melt droplets during the eruption by diffusion and decompression of dissolved gas (Proussevitch et al., 1993; Proussevitch and Sahagian, 1998; Toramaru, 2014). At the vent, shear deformation and bubble bursting separates much of the gas from the melt. As such, lava fountains are driven by the steady discharge of magma and gas (Head and Wilson, 1987; Wilson et al., 1995), erupting as a two-phase flow of droplets of melt entrained in a gas phase (Housley, 1978), and show a wide range of eruptive heights reflecting exsolved gas content (Head and Wilson, 1987; Stovall et al., 2012; Romero et al., 2018).
Hawaiian lava fountains have been observed ranging from tens to hundreds of meters tall (Richter et al., 1970; Swanson et al., 1979; Lockwood et al., 1985; Head and Wilson, 1987; HVO, 2022), while Mount Etna in Italy and Volcán Villaricca in Chile have also been known to produce high lava fountains (Stovall et al., 2012; Romero et al., 2018). These high, continuously fountaining eruptions produce plumes with entrained clasts that result in widespread dispersal of tephra (Branca and Carlo, 2005). On the island of Hawai’i, the most recent eruption that caused high loss of property was the 2018 eruption of Kīlauea, which saw partial collapse of the summit caldera and effusive eruption of lava in the lower east rift zone. This eruption produced lava fountains of only 20–80 m in height, with the greatest hazard coming from lava flows (Patrick et al., 2019) While tephra dispersal from lava fountains does not always disrupt heavily populated areas, the destruction of forests adjacent to volcanoes and the risk posed to tourists (Swanson et al., 2979) highlight a practical need to understand the overall dynamics of lava fountains.
The main determinant of lava fountain height is the exsolved gas content from the melt (Head and Wilson, 1987; Wilson et al., 1995). Most eruptions of Hawaiian volcanoes since 1924, including those in the East Rift Zone near Kīlauea, were driven by type-II CO2-poor, H2O-rich gases (Gerlach, 1986). Gases such as CO2 and SO2 exsolve and escape while the magma still resides in the summit chamber, so that final ascent from the magma chamber and fountaining of lava is driven primarily by the exsolution of relatively more soluble H2O (Gerlach, 1986; Head and Wilson, 1987; Wilson et al., 1995; Kennedy et al., 2016). The depth of bubble nucleation and magmatic fragmentation for eruptions that produce lava fountains is highly variable between volcanic systems. Spectroscopy of gas from lava fountains on Mount Etna indicates that the fragmentation of the magmatic foam occurs at depths of up to 1.5 km (Allard et al., 2005). Estimates for depth of bubble nucleation in Hawaiian volcanoes such as Pu’u ‘Ō’ō are about 120 m or shallower, with fragmentation occurring near the surface due to ductile deformation of a magma still behaving as a liquid (Wilson et al., 1995; Mangan and Cashman, 1996; Sahagian, 1999; Giordano et al., 2008).
High lava fountains are produced when the gas phase and melt phase are well-coupled, behaving as a two-phase flow after fragmentation (La Spina et al., 2021). Exsolved gas content controls the elevation at which 90% of the erupted mass falls out of the eruptive column (Parfitt and Wilson, 1999). Head and Wilson (1987) used the heights of lava fountains produced during eruptions of Pu’u ‘Ō’ō in Hawai’i between 1983 and 1987 to estimate the amount of gas exsolved during the eruptions. Exsolution of 0.6–0.8 weight percent H2O drove the highest fountains, while more typical fountain heights were produced by exsolution of 0.4 weight percent H2O (Head and Wilson, 1987). However, it cannot be assumed that exsolution progresses to the point of chemical equilibrium at atmospheric pressure (0.6–0.8 bars, depending on vent elevation) before fragmentation of the magma, so there can still be exsolving gas within melt droplets within the lava fountains. Other factors that influence the total height of the lava fountain include the erupted mass flux, the vent geometry, and the amount of lava ponding above the vent (Head and Wilson, 1987; Wilson et al., 1995).
Lava fountains typically persist for less than an hour, but longer episodes do occur (Romero et al., 2018). Recent eruptions of Hawaiian volcanoes have displayed multiple lava fountaining episodes, separated by calmer periods of slower degassing and effusive eruption of lava (Stovall et al., 2012; Parcheta et al., 2013). Lava fountaining tends to grow in intensity and height during a fountaining episode, before ceasing abruptly (Head and Wilson, 1987). The lower fountain heights early in an episode are thought to be due to partial gas escape from magma still in the conduit between episodes, before more gas-rich magma is introduced from below for later portions of fountaining (Head and Wilson, 1987).
With the known link between lava fountain heights and exsolved gas content (Head and Wilson, 1987; Wilson et al., 1995), in addition to current understanding of complicating factors such as conduit shape and lava pond depth, it should be possible to assess the exsolved gas contents of eruptions that predate modern observation methods if a proxy for lava fountain height can be developed. Other information useful for modelling eruptions, such as exit velocity, may be deduced using this proxy as well. As the exsolved gas content increases, the exit velocity at the vent will increase (Housley, 1978). If the lava fountain height is known, the exit velocity can be calculated by (Housley, 1978; Head and Wilson, 1987):
where H is the lava fountain height, ve is the exit velocity at the vent, and g is acceleration due to gravity. The exit velocity is equivalent to the sonic velocity of the two-phase flow of pyroclasts and gas exiting the vent and has been directly observed for recent eruptive episodes (Housley, 1978; Mangan and Cashman, 1996; Porritt et al., 2012). The eruptive velocities of flows that occurred before modern observations remain unknown, but can be calculated if lava fountain height is measured (Housley, 1978).
Previous work has used computer simulations of ash deposits and preserved lava flows to estimate exsolved gas content. For example, Parfitt and Wilson (1999) varied the exsolved gas content in their computational model until the output for ashfall deposits was similar to the observed ashfall associated with the 1959 eruption of Kīlauea Iki in Hawai’i, but they acknowledge that this method relies on large portions of the ashfall being preserved for observation. This could be unlikely in a volcanic system where active lava flows would cover large portions of the deposits from a previous eruption, or in cases where a large portion of the pyroclasts land in active lava flows as the eruption is taking place. Additionally, the application of this method is limited by the availability of field data on the exact thicknesses of ashfall and lava flows for all but a few eruptions (Parfitt and Wilson, 1999). These caveats lead to the need for an alternative method to assess lava fountain height.
Other studies qualitatively describe lava fountain heights using individual pyroclasts from deposits left behind after an eruption. For example, methods using individual pyroclasts have identified patterns in the total vesicularity and vesicle shape in reticulites from high, medium, and low lava fountains (Stovall et al., 2012; Parcheta et al., 2013). These patterns arise due to differences in ascent velocity in the conduit, with faster ascent (shorter times) allowing for less coalescence of bubbles and resulting in a greater number of bubbles of uniform size (Stovall et al., 2012; Parcheta et al., 2013). This relationship is an excellent tool which uses quantitative data to qualitatively describe lava fountain heights, but the qualitative classification of high, medium, or low lava fountains is too coarse a resolution to quantitatively determine the exsolved gas content of an eruption using methods described by Head and Wilson (1987) and Wilson et al. (1995). Additional studies have assessed the water content which remained dissolved in the glass phase of pyroclasts following eruptions and the oxidation ratios of the pyroclasts. Analysis of pumice from the 1959 eruption of Kīlauea Iki performed by Friedman (1967) showed an inverse relationship between lava fountain height and water content of the glass. Swanson and Fabbi (1973) arrived at a similar conclusion for pumice and lava originating in the 1969 eruption of Mauna Ulu. This is consistent with other results (Head and Wilson, 1987; Wilson et al., 1995) in that the partitioning between exsolved and dissolved gas controls fountain height for a given pre-eruptive dissolved water content. Swanson and Fabbi (1973) also discovered a positive correlation between lava fountain height and the oxidation ratio in pumice, with pumice from high lava fountains having a longer flight time and more opportunity to oxidize in flight. However, each of these relationships were identified using freshly erupted material. Hydration and oxidation reactions occurring after deposition could significantly alter the water content or oxidation ratios of the pyroclasts, so these methods are probably not useful for assessing lava fountain height in older, unobserved eruptions.
Pele’s spheres and tears
Pele’s spheres and tears are a type of basaltic clast associated with lava fountain eruptions in Hawaiian volcanoes (Porritt et al., 2012; Wygel et al., 2019), and may be a valuable tool for assessing lava fountain height. Pele’s tears are teardrop-shaped clasts that have been partially rounded by surface tension forces, while Pele’s spheres are typically a smaller variant that have been completely rounded (Figure 1; Moune et al., 2007; Porritt et al., 2012). In this paper, we will refer to Pele’s tears as also including the completely spherical Pele’s spheres.
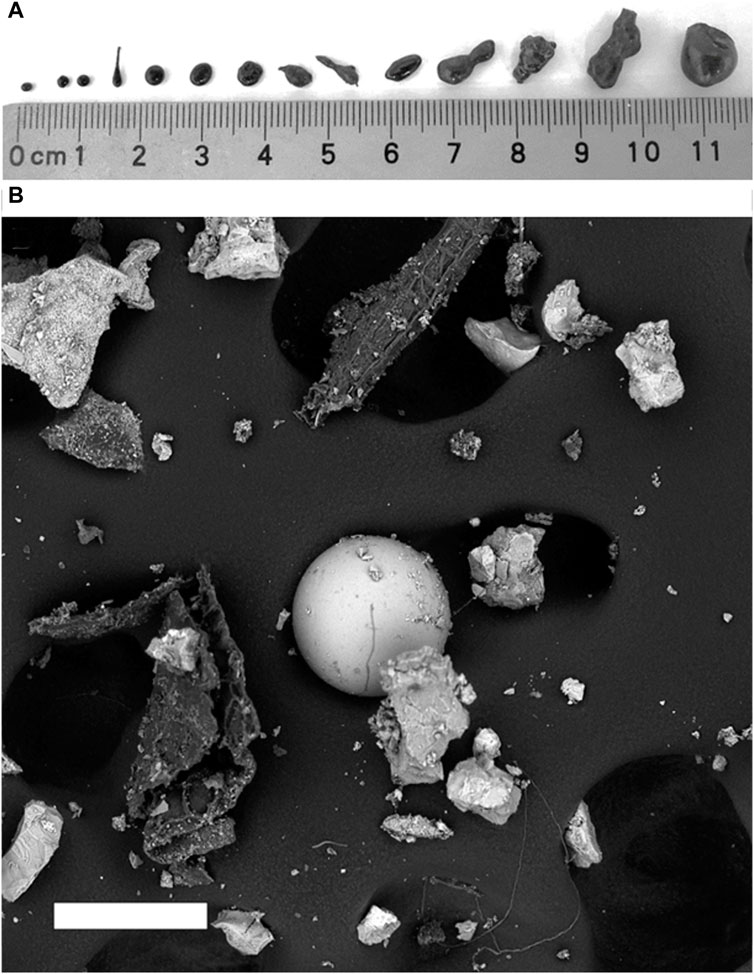
Figure 1. (A) Examples of the external morphology of Pele’s tears and spheres. Smaller particles tend towards a more spherical shape, though there are exceptions. After Porritt et al. (2012). (B) An example of Pele’s spheres at the microscopic level. Scale bar is 100 microns.
Examples of Pele’s tears have been found at many other basaltic volcanoes such as Réunion, Etna, Masaya, and the Azores, among others (Moune et al., 2007; Porritt et al., 2012). Pele’s tears were even found on the lunar surface during the Apollo 15 and Apollo 17 missions, indicating that lava fountaining occurred during eruptions at some point in the moon’s distant past (Housley, 1978; Rutherford and Paolo, 2009). Pele’s tears can survive for prolonged periods in tephra deposits. On Hawai’i they have been identified in the ∼ 1600 year old Kulanaokuaiki tephra (Helz et al., 2014), while deposits up to 350 ka have been found in Australia (Boyce et al., 2014) and possibly tens of millions of years old in India (Siddaiah & Kumar, 2007).
Pele’s tears range widely in size. The smallest examples (<100 μm diameter) have been observed using scanning electron microscopes (Wygel et al., 2019), while the largest (several mm) can be observed with the naked eye. At diameters greater than 2 mm, Pele’s spheres generally grade into the irregular shapes of Pele’s tears (Figure 1; Porritt et al., 2012), but tear shapes can exist in smaller clasts as well.
The external morphologies of Pele’s tears are shaped by surface tension forces while they are still liquid within the column of hot erupting gases within the lava fountain. The temperatures inside lava fountains are greater than the glass transition temperature of basaltic lavas (about 650°C), allowing surface tension forces to act on droplets within the fountain (Porritt et al., 2012). The lava entrained in a lava fountain is nearly 1200°C (Ault et al., 1961), but the incandescent regions of Hawaiian lava fountains as a whole are about 900°C due atmospheric entrainment (Porritt et al., 2012). At 1200°C the surface tension of a basalt is approximately 0.36 - 0.38 N/m (Walker and Mullins, 1981). Figure 1 shows examples of the external morphology of some large Pele’s tears, and the smooth glassy exterior of these clasts is readily apparent in this image.
Bubbles form within Pele’s tears due to the diffusion of oversaturated volatiles in the melt phase (Zhang and Stolper, 1991; Proussevitch and Sahagian, 1996), resulting in vesicularities of approximately 30% (Porritt et al., 2012). Vesicles within Pele’s tears are typically perfectly spherical, regardless of the external shape of the clast (Moune et al., 2007; Porritt et al., 2012). Quenching must be rapid enough to cease bubble growth within the clasts; otherwise, sustained nucleation and bubble growth would cause fracturing and fragmentation of the tears (Porritt et al., 2012). Spherulites observed beneath the glassy crust of Pele’s tears may also be indicative of rapid quenching (Moyer and Sahagian, 2023). Quenching occurs due to a combination of radiative cooling and forced convection in cold atmospheric air (Mastin, 2007; Porritt et al., 2012; Namiki et al., 2021; Jones et al., 2022).
Using vesicle properties to constrain lava fountain heights
Given the widespread occurrence of Pele’s tears, we suggest using them as a tool to calculate lava fountain height and exsolved gas content. This proxy method is not restricted by the problems associated with previous methods of estimation and should yield quantitative estimates of lava fountain heights, and therefore the exsolved gas content of the melt. We examined vesicles within Pele’s tears from observed eruptions and obtained an empirical relation with lava fountain height. Ultimately, in instances where the fountain height can be estimated and conduit width and lava ponding depth are known or estimated, the exsolved gas content of the magma could be calculated using the relationships developed here in conjunction with the findings of Head and Wilson (1987) and Wilson et al. (1995), providing insight into the long-term trends and possibly the future eruption dynamics of a specific basaltic volcanic system.
Methods
Sample collection
Samples of Pele’s tears from deposits associated with recent Hawaiian eruptions of Kīlauea Iki (1959) and Mauna Ulu (1969) were targeted for the purposes of this study because they have well-documented lava fountain heights and erupted tephra is readily available for study (Richter et al., 1970; Swanson and Fabbi, 1973; Swanson et al., 1979; Porritt et al., 2012; Parcheta et al., 2013). In general, we focus on Pele’s tears produced from lava fountains with relatively steady heights. Samples were collected from permitted pits dug at several locations proximal to the vents of each volcano. Samples from Kīlauea Iki were collected from two sample pits and samples from Mauna Ulu were collected from four sample pits (Figure 2). At least ten samples per layer were collected when practicable. In instances when intact tears were unavailable or numbered few, fragments of tears were collected instead. The stratigraphy of each sample pit was recorded and compared with the findings of Stovall et al. (2012) and Parcheta et al. (2013) so that samples could be correlated to the lava fountaining episode of the eruption which produced them.
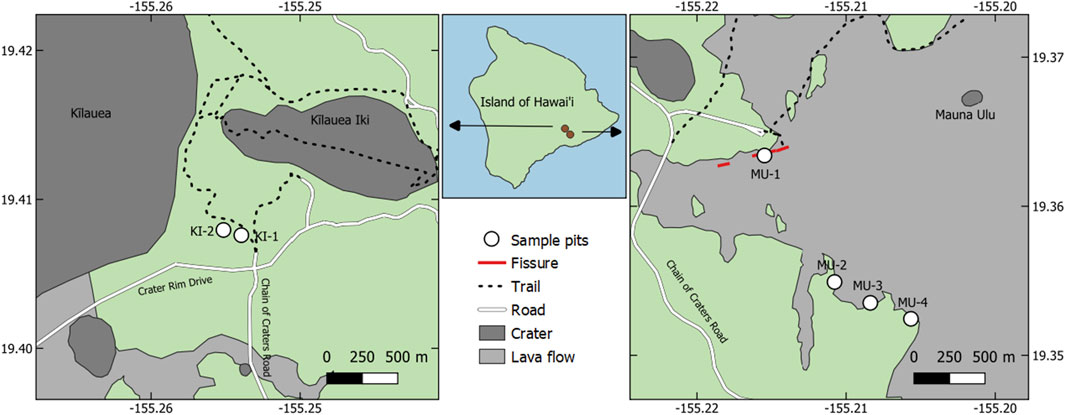
Figure 2. Locations of sample pits used to collect Pele’s tears produced during eruptions of Kīlauea Iki (left) and Manua Ulu (right). Basemap from Google Maps satellite imagery.
Assessment of tephra deposits and corresponding lava fountain episodes
Two sample pits were dug in tephra associated with the 1959 eruption of Kīlauea Iki. Each of these pits contained a layer several centimeters thick which was rich in Pele’s tears approximately 50–60 cm below ground surface. Stovall et al. (2012) indicate this as the boundary between lava fountaining episodes 15 and 16 of the eruption. The material below this layer is believed to have originated in lava fountaining episode 15, while everything above the base of the layer rich in Pele’s tears was produced in lava fountaining episode 16. Lava fountaining episode 17 of the 1959 eruption only produced low lava fountains (Stovall et al., 2012), so material from that episode would not have been transported ∼600 m to the sample pits dug for this study.
Pele’s tears from the first fountaining episode of the 1969 eruption of Mauna Ulu were collected from a singe sample pit. This episode was a fissure style eruption (Swanson et al., 1979; Parcheta et al., 2012; Parcheta et al., 2013). While fissure style eruptions can have great variation in fountain height along strike, this episode only reached a maximum height of 50 m (Swanson et al., 1979; Parcheta et al., 2012; Parcheta et al., 2013) and was the lowest fountaining episode we examined. For unobserved eruptions, variation in fountain height along strike may also be a variable which cannot be determined. For these reasons we treated Mauna Ulu episode 1 as a basic fountain with a maximum height of 50 m.
Tephra deposit maps presented by Parcheta et al. (2013) indicate that Pits MU-2, MU-3, and MU-4 should contain material from Mauna Ulu 1969 episode 10. Since episode 10 was only 30 m high, the only tephra that could have been carried 1.6 km to the sample pits by the wind would have been Pele’s hair associated with gas bursts during this stage of the eruption (Swanson et al., 1979). Examination of the bulk samples collected from depths just above the characteristic deposits of episode 9 (Parcheta et al., 2013) show that this layer is devoid of Pele’s hair, leading to the interpretation that episode 10 is not represented in these sample pits. Rather, Pele’s tears collected in the next layer above episode 9’s deposits correspond with episode 11, which had a much greater fountain height of approximately 300 m (Swanson et al., 1979). Specific sample locations and notes are indicated in photographs of the sample pits included in Supplementary Material.
A similar analysis can be applied to Mauna Ulu 1969 episode 12. Swanson et al. (1979) break this episode into two distinct phases, episodes 12A and 12B, separated by approximately 4.5 h of calmer eruptive behavior. Given that episode 12A only produced lava fountains 75 m high (Swanson et al., 1979), it is unlikely that Pele’s tears would be carried the approximate 1.6 km to the sample pits that were dug for this study. On the other hand, episode 12B’s lava fountains were measured at 390 m (Swanson et al., 1979). Therefore, the uppermost deposits from sample pits MU-3 and MU-4 are considered to have originated in episode 12B.
Vesicle imaging and stereology
Pele’s tear interiors were imaged using X-ray CT scanning techniques. Generally, Pele’s tears with long-axis diameters less than 4 mm were selected for analysis. This screening of sample size served the purpose of removing an additional variable from the dataset. Samples were mounted for scanning using methods described by Cooperdock et al. (2019), and were scanned on a Zeiss Xradia 620 Versa scanner in the University of Texas at Austin’s High-Resolution X-ray CT Facility. This method reduced each set of Pele’s tears into about 1300 individual slices (plus or minus 100 slices for any given set), each comparable to a thin section (Figure 3). Each slice is approximately 3 microns (1 voxel) thick. Vesicles and phenocrysts are easily identified in these slices of tears from ten different lava fountaining episodes. CT scans made it possible to perform multiple stereological analyses for each sample.
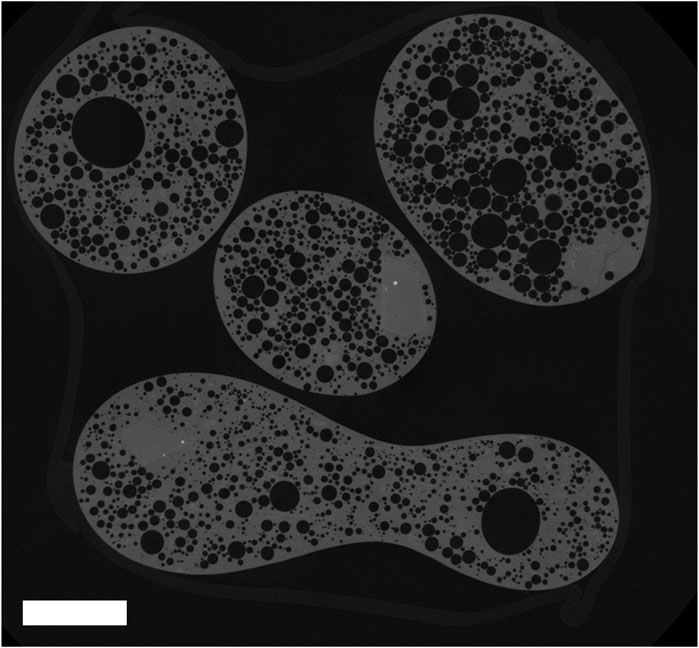
Figure 3. A single CT slice of Pele’s tears from Pit KI-2, depth 70–75 cm. Phenocrysts are visible as polygonal areas which are slightly lighter gray and lack vesicles. Interconnected vesicles must be separated for stereological analysis in order to calculate total vesicularity, bubble number density (BND), and vesicle volume distribution (VVD). Scale bar is 1 mm.
Stereology was performed on CT slices using the FOAMS Matlab program (Shea et al., 2010), which is based on methodology deveoloped by Sahagian and Proussevitch (1998). Photoshop was used to edit the slices before they were fed into FOAMS, using methods described by Shea et al. (2010). Interconnected vesicles were manually separated so that they would not be counted as one large vesicle, which would result in incorrect binning and vesicle volume distributions (VVDs). Phenocrysts were given the same grayscale value as the vesicles and background but connected to the background through the glass matrix by use of a thin line (Figure 4). This way, they would not be recognized as objects by FOAMS since they were not completely surrounded by glass (Shea et al., 2010), and would thus not be included in the vesicle area calculations.
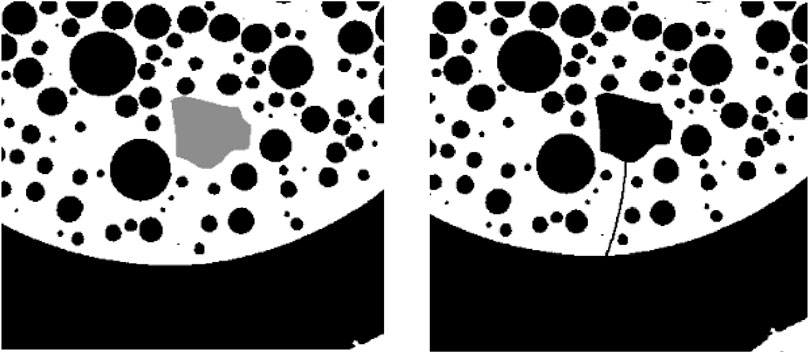
Figure 4. Examples of phenocrysts identified using methods described by Shea et al. (2010) (left), and by connecting them with the background so they would be excluded from area calculations (right).
FOAMS was then used to define what grayscale value constituted a vesicles in each slice, before automatically calculating the three-dimensional vesicularity. We used a three voxel vesicle diameter as a minimum threshold for FOAMS analysis. Analysis was performed using the program’s built-in autonormalization function. This produced vesicle volume distributions, bubble number densities and total vesicularity values for each of the slices analyzed. 62 representative slices were chosen to be edited for analysis using FOAMS. The slices selected for analysis were concentrated near the equators of the tears so that their full interiors would be represented. 87 tears were represented in these slices. The original and edited slices are included in “Supplementary Material.”
Empirical relationships between Pele’s tear vesicularity, bubble number density, modal vesicle diameter and fountain height
Mean lava fountain height and maximum lava fountain height were considered for the development of the empirical relationships (Table 1). The maximum fountain heights of each fountaining episode from the 1959 eruption of Kīlauea Iki and the 1969 eruption of Mauna Ulu are all well-documented (Richter et al., 1970; Swanson et al., 1979; Stovall et al., 2012; Parcheta et al., 2013). Mean lava fountain height was estimated using the chronological narratives of each eruption published by the USGS (Richter et al., 1970; Swanson et al., 1979). For most lava fountaining episodes, clear timing of the lava fountain heights are indicated (Richter et al., 1970; Swanson et al., 1979). In some instances, however, few values are provided and the uncertainty of the mean height is greater as a result. Unless noted otherwise in the reports, shifts in lava fountain height were treated as increasing or decreasing linearly with time between reported values.
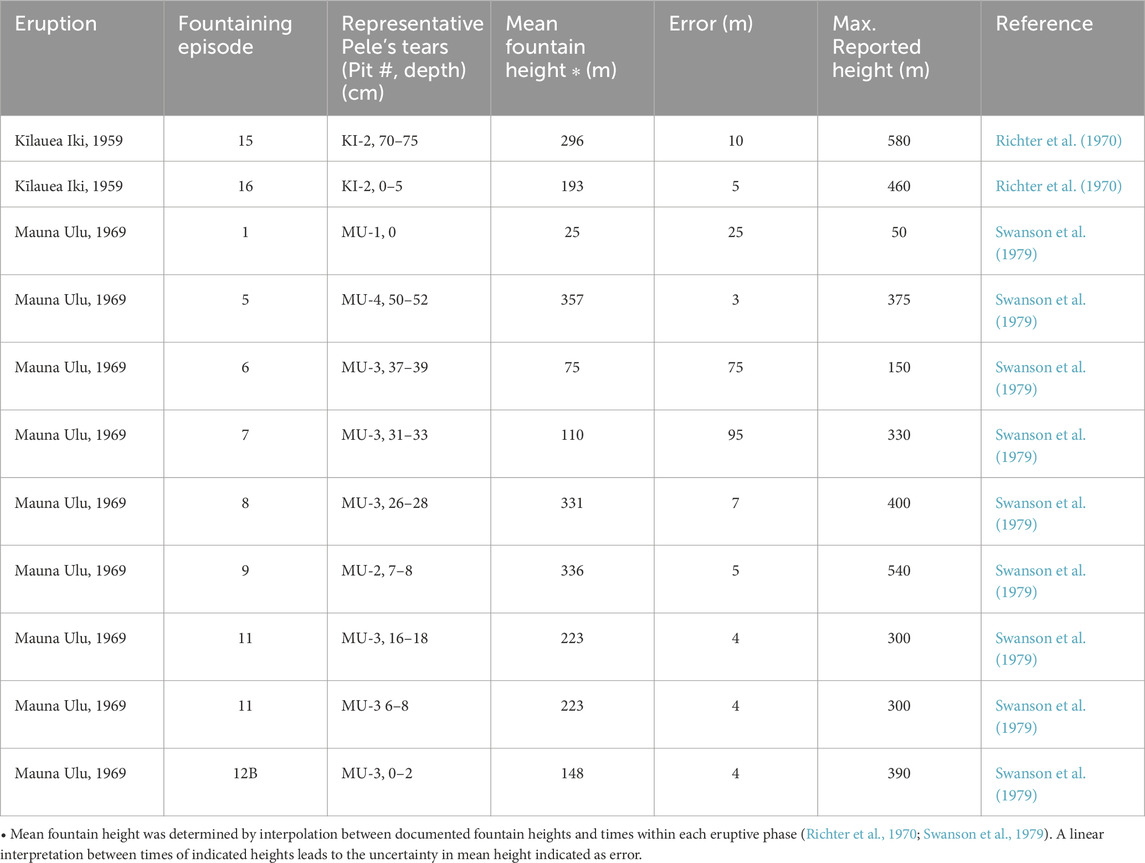
Table 1. Fountaining episodes represented by the tears examined in this study.
In addition to quantifications of total vesicularity and bubble number density (BND), vesicle volume distributions (VVDs) were also generated using FOAMS. The VVDs were plotted by FOAMS as histograms showing bins of equivalent vesicle diameter plotted as volume fraction of the total vesicularity (Figure 5; Shea et al., 2010). The bins of these histograms are geometric rather than linear so that very small bubbles are not excluded, as these are otherwise lost to noise in linearly distributed VVDs (Sahagian and Proussevitch, 1998; Shea et al., 2010). For each sampling pit stratigraphic depth, the VVDs of individual slices were combined and averaged to create a smoothed distribution of vesicle diameters for tears from each slice set (Supplementary Material). Using these smoothed histograms, the vesicle diameter for the bin that occupied the greatest volume fraction of each sample set was identified. Since FOAMS plots VVDs as volume fraction of bin sizes of equivalent diameter, the modal bin size represents vesicles of the diameter that take up the greatest volume fraction of a given tear. The modal vesicle diameter was selected rather than the mean vesicle diameter because the mean vesicle diameter can be unduly influenced by the presence of one or two large vesicles, while the mode is more robust (Sahagian et al., 2002; Sahagian and Proussevitch, 2007).
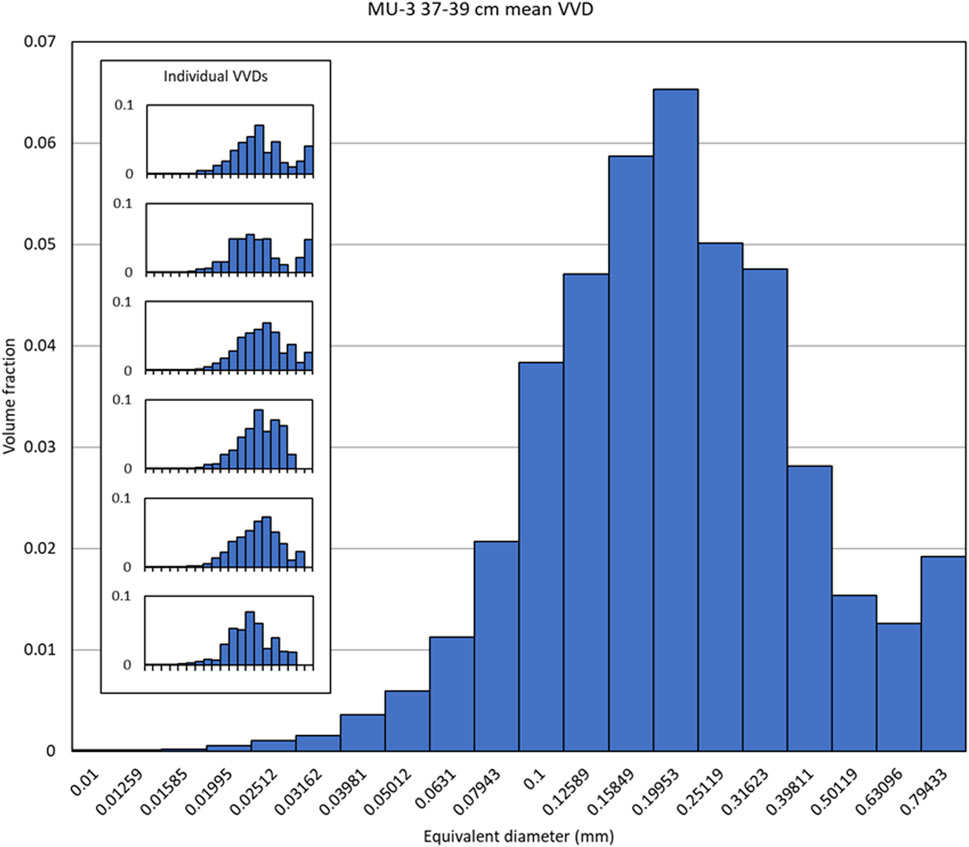
Figure 5. An example of combined VVDs for a single slice set from Pit MU-3 depth 37–39 cm. The VVDs resulting from each individual slice are listed in the Individual VVDs panel (inset). To generate a VVD of the combined set, the mean volume fraction of each bin diameter was taken and used to generate the large, combined histogram. In this example, the combined histogram shows that the bin with the greatest cumulative volume had an equivalent diameter of 0.1995 ± 0.017 mm.
Maximum lava fountain height and mean lava fountain height were plotted as a function of total vesicularity, bubble number density, and modal vesicle diameter (Figures 6–8). Type-1 linear regressions were performed to fit trendlines through each dataset. The equation of each trendline was then considered as a candidate of an empirical relationship that could be used to assess lava fountain height based on corresponding vesicle parameters. The R2 values of the trendlines were used to perform two-tailed t-tests for significance of the correlation.
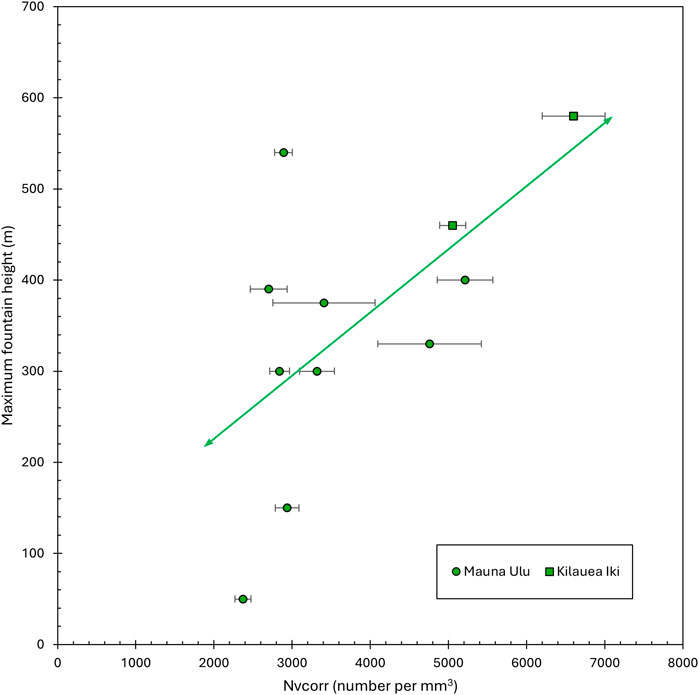
Figure 6. Linear regression of maximum lava fountain height as a function of bubble number density, Nvcorr (number per mm3, corrected for vesicularity), using vesicles found in Pele’s tears from the 1959 eruption of Kīlauea Iki (squares) and the 1969 eruption of Mauna Ulu (circles). Standard error was calculated using the bubble number density of each slice in a sample set. R2 = 0.37.
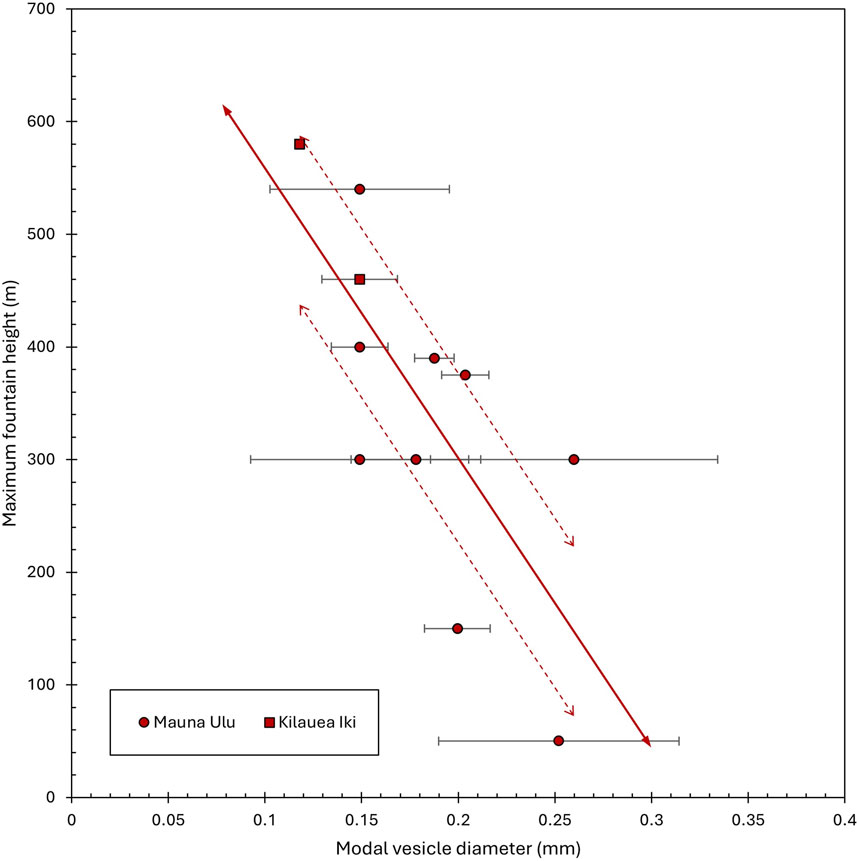
Figure 7. Linear regression of maximum lava fountain height as a function of modal vesicle diameter (solid line), using vesicles in Pele’s tears collected from tephra deposits associated with the 1959 eruption of Kīlauea Iki (squares) and the 1969 eruption of Mauna Ulu (circles). Standard error was calculated using the modal vesicle diameter for each slice in a sample set. Dotted lines represent bounds of 95% confidence. R2 = 0.55.
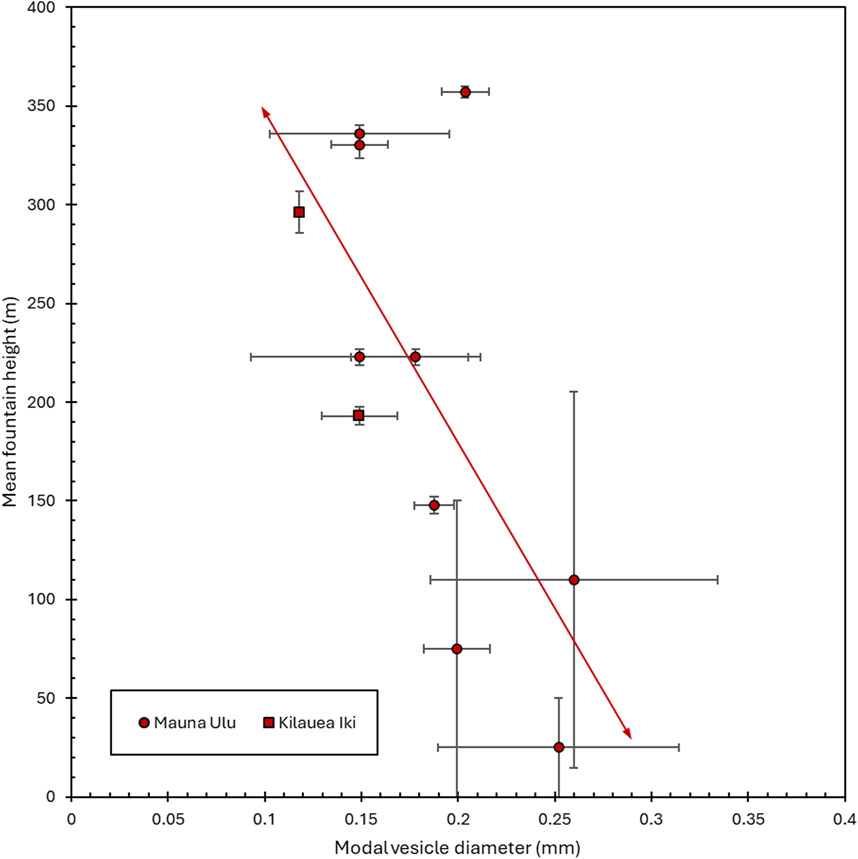
Figure 8. Linear regression of mean lava fountain height as a function of modal vesicle diameter, using vesicles in Pele’s tears collected from tephra deposits associated with the 1959 eruption of Kīlauea Iki (squares) and the 1969 eruption of Mauna Ulu (circles). Standard error was calculated using the modal vesicle diameter for each slice in a sample set. Vertical error was estimated using variations in the lava fountain heights indicated by Richter et al. (1970) for Kilauea Iki and by Swanson et al. (1979) for Mauna Ulu. R2 = 0.45.
The standard error of the total vesicularity values was calculated for the slice set for each sample scan. To propagate error of bubble number density and the modal vesicle diameter, the calculated bubble number density and modal diameter of each slice for a given set was used to calculate the standard error of the whole set. For the empirical relationships which calculate maximum fountain height, no error was propagated to the reported maximum fountain height values, since no error was reported by Richter et al. (1970) or Swanson et al. (1979). In the case of mean fountain height, error was calculated using the variations in fountain heights indicated in the USGS reports (Richter et al., 1970; Swanson et al., 1979).
Results
We tested the hypothesis that there is a strong correlation between the vesicle parameters of Pele’s tears and observed lava fountain height. More specifically, we expected that there would be more and larger vesicles in Pele’s tears from high lava fountains than from low lava fountains, following from previously determined correlations between exsolved gas content and fountain height (Head and Wilson, 1987; Wilson et al., 1995). However, we found that the opposite was actually the case.
Bubble number density calculated from individual slices ranged from to 1410 per cubic millimeter to 7040 per cubic millimeter, and the mean bubble number density for slice sets ranged from 2700 per cubic millimeter to 6601 per cubic millimeter. When plotted against the corresponding maximum lava fountain heights through a type-1 linear regression, there is a positive correlation (R2 = 0.37) described by:
where Hmax is maximum fountain height in meters and n is bubble number density per cubic millimeter (Figure 6). A two-tailed t-test indicates that the correlation between bubble number density and lava fountain height is significant at a 95% confidence interval (p = 0.048). These results align with those of previous studies on lava fountain vesiculary (Stovall et al., 2102),
The vesicle volume distributions of Pele’s tears from these eruptions generally show a distribution which favors large vesicles (Figure 5, Supplementary Material), indicating that nucleation of bubbles was continuous and accelerating (Shea et al., 2010). Many of the vesicle volume distribution histograms for individual slices also show a secondary peak of larger vesicles, which may be indicative of large, pre-eruptive bubbles. However, these secondary peaks can be indicative of different bins of equivalent bubble diameter for different slices of a set. When the VVD histograms of a sample set were combined to identify the modal vesicle diameter, these secondary peaks became much less pronounced, but usually did not disappear entirely. Modal vesicle diameters (corresponding to bin with greatest cumulative volume) range from 0.11 to 0.25 mm (Table 2).
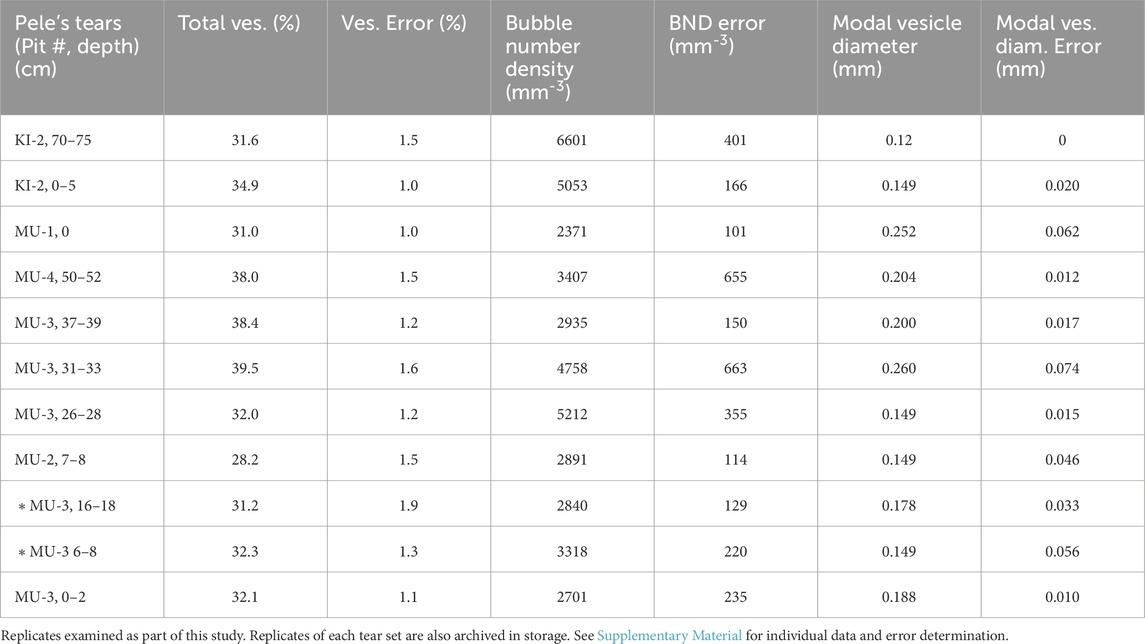
Table 2. Vesicularity, bubble number density, and modal vesicle diameters measured in Pele’s tears examined here.
When using modal vesicle diameter to plot maximum lava fountain height, a negative trend between fountain height and increasing values is apparent, indicating that low lava fountains produced Pele’s tears with a larger modal vesicle diameter than tears from high fountains. The R2 value for this correlation is 0.55, and the two-tailed t-test indicates that the correlation is significant at a 95% confidence interval (p = 0.009). The equation of the line produced by this type-1 linear regression is:
where d is modal vesicle diameter and once again Hmax is maximum lava fountain height (Figure 7). By this linear relationship the predicted maximum fountain height for these Hawaiian eruptions is 820 m.
When mean lava fountain heights are considered, there is no obvious correlation with bubble number density (see Supplementary Material). For modal vesicle diameter, a negative trend is still apparent, albeit with a smaller R2 value of only 0.45. A two-tailed t-test for this correlation indicates that it is significant at 95% confidence (p = 0.02). The equation for this trendline is:
where Hmean is mean lava fountain height and d is modal vesicle diameter (Figure 8).
Total vesicularity of the samples in individual slices ranged from 25.0% to 43.9%, while the mean total vesicularity for slice sets ranged from 28.2% to 39.5% (Table 2). The vesicularity of individual slices is included in Supplementary Material. The mean vesicularity for the tears collected from each sample depth was plotted against both the maximum and mean lava fountain heights of the corresponding eruption, and type-1 linear regressions were performed. No strong correlation was evident in these regressions. The results of these regressions are included in the Supplementary Material.
Discussion
Contrary to our original expectations, we found that modal vesicle diameter decreases with increasing lava fountain height. It had been hypothesized that as more water exsolved from the melt to drive high lava fountaining, more and larger vesicles would be preserved within Pele’s tears because of this increased exsolution. Had this been the case, a positive correlation between modal vesicle diameter and lava fountain heights would result. The linear regressions performed here instead demonstrate the opposite. We interpret this to mean that as more volatiles exsolve to drive high lava fountains, less volatiles remain dissolved to produce syn-eruptive bubbles within Pele’s tears themselves, hence the higher BND and lower modal vesicle diameter. This is consistent with the lower dissolved water content in glasses from high lava fountains observed by Swanson and Fabbi (1973). It is also comparable with the results for more energetic eruption columns (Toramaru, 2006; Genareau et al., 2013). The relationship between modal vesicle diameter found using the VVD distributions and lava fountain height follows a trend like that of total vesicularity and fountain height, albeit with a stronger correlation and greater statistical significance because the modal vesicle diameter is less dramatically influenced by the presence of one large bubble than total vesicularity would be (Sahagian and Proussevitch, 2007).
We suggest the following reconstruction of events inside lava fountains that produce Pele’s tears (Figure 9). First, the nucleation and growth of pre-eruptive bubbles triggers magma ascent. At depths of less than 120 m (Wilson et al., 1995; Mangan and Cashman, 1996; Sahagian, 1999), these pre-eruptive bubbles have grown to the point where the ascending magma fragments from a foam (continuous liquid phase) into a two-phase flow of gas and entrained melt droplets (continuous gas phase) (Housley, 1978). Depending on strain rates at the vent, fragmentation may occur as a brittle material (Namiki et al., 2021), but post-fragmentation in the lava fountain, sufficient time is available for ductile relaxation (Porritt et al., 2012). As the droplets are rounded by surface tension, decompression to atmospheric pressure triggers further nucleation of syn-eruptive bubbles within them. Droplets that remain inside the lava fountain for a prolonged period become scoria or reticulite as the bubbles expand and further fragment the droplets (Porritt et al., 2012). Droplets that exit the fountain before further fragmentation are rapidly cooled below their glass transition temperature and are preserved as Pele’s tears (Porritt et al., 2012). If a low fraction of dissolved volatiles exsolve during the ascent of the magma (low lava fountain), then a comparatively high amount of water remains dissolved when the melt droplets reach the surface. This promotes the nucleation and growth of more syn-eruptive bubbles, and increases the likelihood of a few large, pre-eruptive bubbles becoming preserved in Pele’s tears as well. Therefore, Pele’s tears from these low lava fountains have large modal vesicle diameter (∼0.2–0.25 mm). Conversely, when a greater amount of gas exsolves and drives high lava fountains, there is a greater amount of fragmentation within the conduit that will destroy most of the large pre-eruptive bubbles. Because of the greater exsolution in the conduit there is less gas remaining to exsolve within the melt droplets in lava fountain itself and there are fewer syn-eruptive bubbles that nucleate and grow within Pele’s tears. These tears have smaller modal vesicle diameter (∼0.1–0.15 mm).
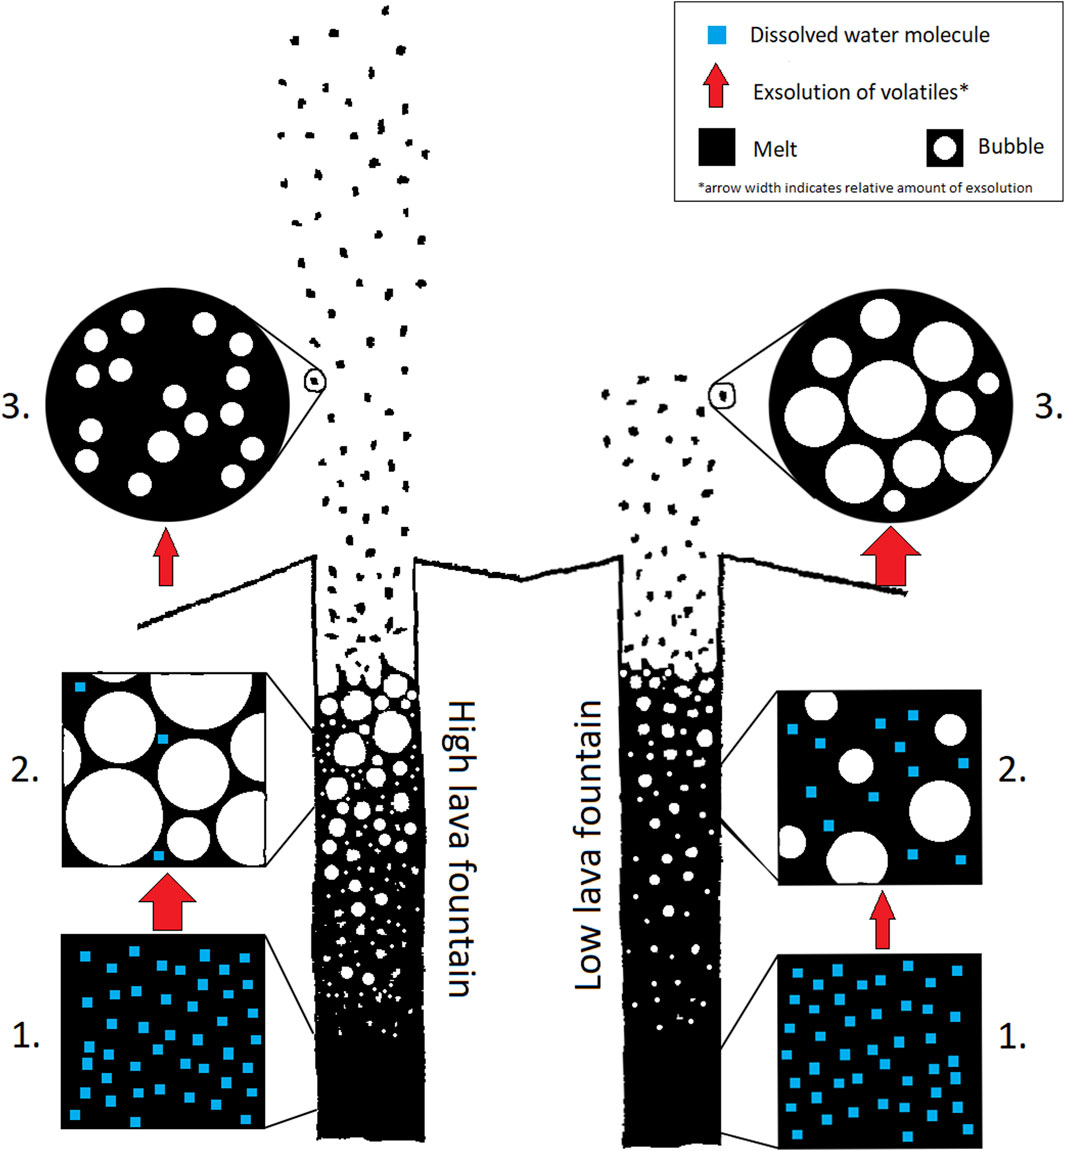
Figure 9. Conceptual cartoon of vesiculation in Pele’s tears from high lava fountains versus low lava fountains. At stage 1 each conduit contains magma with the same concentration of dissolved volatiles. At stage 2, volatiles have begun to exsolve from the magma into bubbles (Wilson et al., 1995; Mangan and Cashman, 1996). The conduit that will produce a high lava fountain sees more volatiles exsolve than the conduit that will produce a low lava fountain, so it has larger bubbles and less water remaining dissolved in the magma at stage 2. After the magmatic foam fragments and generates a lava fountain (Housley, 1978) syn-eruptive bubbles form within Pele’s tears at stage 3. Since there was more water still dissolved in the melt in the low lava fountain, more large bubbles form in Pele’s tears here than in high lava fountains. Consequently, Pele’s tears from low lava fountains are more vesicular and have larger modal vesicle diameters than tears from high lava fountains.
The modal vesicle diameter of a set of Pele’s tears from an eruption can therefore be used to assess the maximum lava fountain height of the eruption using Eq. 3. Eq. 2 (bubble number density) and Eq. 4 (modal vesicle diameter to describe mean lava fountain height) yield less robust results than Eq. 3. We suggest that mean fountain height is not a meaningful measure, as it can be influenced by potentially undocumented periods of relative quiescence, while maximum height is determined by the exsolved gas that drives the eruption and is reflected in the relative lack of syn-eruptive bubble growth within Pele’s tears. Further, most of the sample pits dug for this study were at least 600 m from the source vent, so it is likely that only tears from the highest fountains were transported these distances and are more representative of periods of maximum fountain heights. Further sampling from more proximal pits would be required to see if there is tighter correlation with mean fountain heights in tears at these sites. However, maximum lava fountain height is the more relevant quantity to assess because it reflects the exsolved gas content of magma which did not undergo significant degassing in the conduit prior to eruption. Head and Wilson (1987) highlighted that lava fountains tend to grow in intensity during an eruption until maximum height is reached since the first lava to erupt usually has some residence time in the conduit to degas before reaching the surface. Ponding lava at the vent can also decrease the total height of the lava fountain (Wilson et al., 1995). We posit that the maximum lava fountain heights are attained when lava that is most representative of the magma driving the eruption is ascending and at a time when ponding at the vent is at a minimum. This makes the period of highest fountaining during an episode the most indicative of the exsolved gas content of the magma and thus the pre-eruptive volatile content, so the maximum height is the most pertinent parameter. Further, for application of Eq. 3 to ancient or otherwise unobserved lava fountains (the primary application of this paper), ponding information will also not be available, and must be relegated to a potential source of error, that can be minimized by consideration of maximum height rather than average height.
Comparison of stereology and 3D image analysis methods
FOAMS was used to perform stereology on Pele’s tears since editing individual slices for analysis would be the easiest way to exclude phenocrysts from the vesicularity and bubble number density calculations. Using individual slices also mimicked using thin sections, which some researchers may prefer to use instead of CT scanning to reduce analysis costs. To show that the results returned by FOAMS are approximately equal to analysis of the full stack of slices for each sample set, we performed an analysis of the bubble number density sample set MU-3, 26–28 cm. To do this, we used the free software package, ImageJ. To process the sample stack, the image sequence was imported and the scale was set to 20%. The x and y scale was also set to 0.2 to make the image files easier to work with. The 16-bit image files were converted to 8-bit files to reduce the computational power needed to process them. Next, a 3D watershed split program was performed to separate interconnected vesicles, and the newly separated vesicles were counted and measured using the 3D ROI manager. Both the 3-D watershed split and the quantification used the 3D ImageJ Suite, and these steps are recorded in a macro included in the Supplementary Material. This method identified 6867 total vesicles present in the stack, with a volume of approximately 0.7 mm−3. Since ImageJ calculated the volume of the tears and vesicles in this stack was approximately 1.8 mm−3, this equates to a total vesicularity of 36.4% and a bubble number density of 3721 per mm3, which is approximately equal to the vesicularity of 31.8% and the BND of 3375 per mm3 calculated using FOAMS. Both these bubble number density values are uncorrected for vesicularity since the values of BND and vesicularity are so similar. Modal diameters are also similar (most frequently occurring diameter was within one bin diameter), so the more practical use of stereology through schemes such as FOAMS is recommended when resources are limited for the full 3D analysis.
Other considerations
When considering total vesicularity, if the first lava fountaining episode of the 1969 eruption of Mauna Ulu is excluded as an outlier, a weak negative trend (p = 0.07) emerges between total vesicularity and maximum lava fountain height. With maximum lava fountain heights of only 50 m, this episode was much lower than other lava fountains which produced Pele’s tears with similar vesicularities. Since this episode was the first fountaining episode of the eruption, we believe that the magma had a slower ascent to the surface and was able to degas as it approached the surface, with less H2O remaining to exsolve and drive high fountaining at the time of eruption. The H2O which remained dissolved in the melt was able to produce some syn-eruptive bubbles upon exit from the vent, producing Pele’s tears with comparatively low vesicularity values. The situation was likely further complicated due to the fissure-eruption style of this lava fountain episode and lava ponding above the vent (Swanson et al., 1979; Parcheta et al., 2012; Parcheta et al., 2013).
Weathering reactions have probably not altered Pele’s tears to the point that the empirical relationships developed here would significantly influenced. Examination of ash from several volcanoes by Wygel et al. (2019) indicated that microscopic samples of Pele’s spheres had their surface areas altered minimally during chemical leachate experiments, due to the lack of angular edges. With minimal change of surface area, the interiors of Pele’s tears should also not be significantly altered. While oxidation stains on a few tears examined here (typically within the five uppermost centimeters of each sample pit) indicate that some chemical weathering has taken place, the CT scans of the tear interiors show that this alteration is restricted to the exposed surfaces of the tears. Regardless, the process of manually separating interconnected vesicles before performing stereology (see methods) will correct for most internal weathering of the vesicles in all but the most degraded of Pele’s tears.
Limitations of the empirical relationships
The empirical relationships developed by this study are currently applicable to tholeiite basalt eruptions and Pele’s spheres and tears of a few mm in size. Using the y-intercept value of Eq. 3, the theoretical maximum height a lava fountain can obtain is 820. In Hawaiian volcanoes this seems like a reasonable estimate, since the highest contemporarily observed lava fountain heights in Hawai’i were approximately 580 m (Richter et al., 1970; Porritt et al., 2012; Stovall et al., 2012). Lava fountains from other volcanic systems with different magma chemistries have been observed to be higher. For instance, Chile’s Volcán Villaricca has produced lava fountains up to 1.5 km tall, but the magma which produced these lava fountains had a basaltic andesite composition (Romero et al., 2018). The differences in magma composition and the quantity of dissolved volatiles present in that eruption were probably able to produce lava fountains higher than those predicted possible by the empirical relation we develop here, which use Pele’s tears of a dry basaltic composition (Head and Wilson, 1987). An “effusive” eruption style is also the only kind described by these relationships; Strombolian or more violent activity cannot be modeled by the methods described here. The empirical relationship developed here can be applied to other basaltic systems such as Iceland and the Canary Islands. While the same conceptual framework can be applied elsewhere, the quantitative empirical relation may be slightly different in different systems, depending on total dissolved volatiles, magma chemistry and other factors. The empirical relationships we have developed here were made using Pele’s tears approximately one to 4 mm in diameter. Since we do not have data using smaller or larger tears, use of Pele’s tears outside that size range to assess lava fountain height may yield different results. Tears of this size range are fairly common in most deposits we observed.
Conclusions
We have developed a tool which can be used to assess lava fountain height of unobserved eruptions of Hawaiian volcanoes, using vesicle parameters of Pele’s tears. This tool involves empirical relationships capable of describing maximum lava fountain height using either total vesicularity or modal vesicle diameter. Eq. 3 may be used with modal vesicle diameter to calculate maximum lava fountain heights with 95% confidence. We suggest that the maximum lava fountain height is most indicative of the original volatile content of the magma, while the mean lava fountain height is variably influenced by periods of relative quiescence during the eruption. The Pele’s tear method is advantageous in that it requires only a few samples, and these can be collected by methods requiring minimal ground disturbance within sensitive areas such as national parks and fragile ecosystems. The methods required for analysis are inexpensive and require little in terms of computational power. Costs can further be reduced by use of thin sections for image acquisition rather than X-ray CT scans. When estimates of lava fountain height are obtained by these methods, they can be used to estimate the exsolved gas content of an eruption using the methods described by Head and Wilson (1987) and Wilson et al. (1995).
The empirical relationships between total vesicularity or modal vesicle diameter and maximum lava fountain height developed here may also be further refined and extended using Pele’s tears from other volcanoes. Volcanic systems that tap magmas from an ocean island basalt reservoir stand the greatest chance of being explained by this relationship, but Pele’s tears from other volcanoes will probably follow comparable trends. We hope that others will use the methods we developed here to analyze lava fountain heights of ancient volcanic eruptions so that long-term trends in the exsolved gas content of different volcanic systems may be assessed. This may allow for long-term trends to be identified, should they exist, and potentially aid in the modelling of future eruption intensity and prediction of future hazards.
Data availability statement
The original contributions presented in the study are included in the article/Supplementary Material, further inquiries can be directed to the corresponding author.
Author contributions
SM: Conceptualization, Data curation, Formal Analysis, Investigation, Methodology, Project administration, Software, Validation, Visualization, Writing–original draft, Writing–review and editing. DS: Conceptualization, Formal Analysis, Funding acquisition, Project administration, Resources, Supervision, Validation, Writing–original draft, Writing–review and editing.
Funding
The author(s) declare that financial support was received for the research, authorship, and/or publication of this article. Partial financial support was provided by NSF-NERC 2211680 and by Lehigh University Department of Earth and Environmental Sciences.
Acknowledgments
There are many people we would like to thank for their assistance in this project: Don Swanson, Jo Schmith, and Carolyn Parcheta of the Hawaiian Volcanoes Observatory for their assistance and guidance during sample collection; Jessica Maisano, Richard Ketcham, and Dave Edey of the University of Texas at Austin for their work to produce the CT scans used in this project; Thomas Shea of the University of Hawai’i at Manoa for his guidance in using the FOAMS program, Gray Bebout and Jill McDermott of Lehigh University for their comments and suggestions; and Linda Zaoudeh, Johanna M. Dela Cruz, and Tom Hanlon for their assistance. The samples utilized in this study were collected from Hawai’i Volcanoes National Park under study number HAVO-00743, authorized through permit number HAVO-2022-SCI-0032. The images utilized in this study were produced at the University of Texas High-Resolution X-ray CT Facility, which is supported by NSF EAR-1762458.
Conflict of interest
The authors declare that the research was conducted in the absence of any commercial or financial relationships that could be construed as a potential conflict of interest.
Publisher’s note
All claims expressed in this article are solely those of the authors and do not necessarily represent those of their affiliated organizations, or those of the publisher, the editors and the reviewers. Any product that may be evaluated in this article, or claim that may be made by its manufacturer, is not guaranteed or endorsed by the publisher.
Supplementary material
The Supplementary Material for this article can be found online at: https://www.frontiersin.org/articles/10.3389/feart.2024.1379985/full#supplementary-material
References
Allard, P., Burton, M., and Muré, F. (2005). Spectroscopic evidence for a lava fountain driven by previously accumulated magmatic gas. Nature 433, 407–410. doi:10.1038/nature03246
Ault, W. U., Eaton, J. P., and Richter, D. H. (1961). Lava temperatures in the 1959 Kilauea eruption and cooling lake. GSA Bull. 72 (5), 791–794. doi:10.1130/0016-7606(1961)72[791:LTITKE]2.0.CO;2
Boyce, J., Nicholls, I., Keays, R., and Hayman, P. (2014). Victoria erupts: the newer volcanics province of south-eastern Australia. Geol. Today 30 (3), 105–109. doi:10.1111/gto.12054
Branca, S., and Carlo, P. D. (2005). Types of eruptions of Etna volcano AD 1670–2003: implications for short-term eruptive behaviour. Bull. Volcanol. 67 (8), 732–742. doi:10.1007/s00445-005-0412-z
Capaccioni, C., and Cuccoli, F. (2005). Spatter and welded air fall deposits generated by fire-fountaining eruptions: cooling of pyroclasts during transport and deposition. J. Volcanol. Geotherm. Res. 145 (3-4), 263–280. doi:10.1016/j.jvolgeores.2005.02.001
Cooperdock, E. H. G., Ketcham, R. A., and Stockli, D. F. (2019). Resolving the effects of 2-D versus 3-D grain measurements on apatite (U-Th)/He age data and reproducibility. Geochronology 1, 17–41. doi:10.5194/gchron-1-17-2019
Friedman, I. (1967). Geological survey research 1967, chapter B. U.S. Geol. Surv. Prof. Pap. 575 (B), 120–127. doi:10.3133/pp575B
Genareau, K., Mulukutla, G., Proussevitch, A., Durant, A., Rose, W., and Sahagian, D. (2013). The size range of bubbles that produce ash during explosive volcanic eruptions. Appl. Volcanol. 2 (1), 4. doi:10.1186/2191-5040-2-4
Gerlach, T. M. (1986). Exsolution of H2O, CO2, and S during eruptive episodes at Kilauea volcano, Hawaii. J. Geophys. Res. Solid Earth 91 (B12), 12177–12185. doi:10.1029/JB091iB12p12177
Giordano, D., Russell, J. K., and Dingwell, D. B. (2008). Viscosity of magmatic liquids: a model. Earth Planet. Sci. Lett. 271 (1-4), 123–134. doi:10.1016/j.epsl.2008.03.038
Hawaiian Volcano Observatory (2022). Photo and video chronology- mauno loa- december 6. USGS. Available at: https://www.usgs.gov/observatories/hvo/news/photo-and-video-chronology-mauna-loa-december-6-2022.
Head, J. W., and Wilson, L. (1987). Lava fountain heights at Pu'u 'O'o, Kilauea, Hawaii: indicators of amount and variations of exsolved magma volatiles. J. Geophys. Res. Solid Earth 92 (B13), 13715–13719. doi:10.1029/JB092iB13p13715
Helz, R. T., Clague, D. A., Mastin, L. G., and Rose, T. R. (2014). Electron microprobe analyses of glasses from Kīlauea tephra units, Kīlauea volcano, Hawaii. U.S. Geological Survey Open-File Report. doi:10.3133/ofr20141090
Houghton, B. F., Taddeucci, J., Andronico, D., Gonnerman, H. M., Pistolesi, M., Patrick, M. R., et al. (2016). Stronger or longer: discriminating between Hawaiian and Strombolian eruption styles. Geology 44 (2), 163–166. doi:10.1130/G37423.1
Housley, R. M. (1978). Modeling lunar volcanic eruptions. Lunar Planet. Sci. Conf. Proc. 9, 1473–1484. Available at: https://adsabs.harvard.edu/pdf/1978LPSC.9.1473H.
Jones, T., Le Moigne, Y., Russle, J., Williams-Jones, G., Giordano, D., and Dingwell, D. (2022). Inflated pyroclasts in proximal fallout deposits reveal abrupt transitions in eruption behaviour. Nat. Comm. 13, 2832. doi:10.1038/s41467-022-30501-6
Kennedy, B. M., Wadsworth, F. B., Vassuer, J., Schipper, C. I., Jellinek, A. M., von Aulock, F. W., et al. (2016). Surface tension driven processes densify and retain permeability in magma and lava. Earth Planet. Sci. Lett. 433, 116–124. doi:10.1016/j.epsl.2015.10.031
La Spina, G., Arzilli, F., Llewellin, E. W., Burton, M. R., Clarke, A. B., de’ Michieli Vitturi, M., et al. (2021). Explosivity of basaltic lava fountains is controlled by magma rheology, ascent rate and outgassing. Earth Planet. Sci. Lett. 553, 116658. doi:10.1016/j.epsl.2020.116658
Lockwood, J., Banks, N., English, T., Grennland, P., Jackson, D., Johnson, D., et al. (1985). The 1984 eruption of Mauna loa volcano, Hawaii. Eos 66 (16), 169–171. doi:10.1029/EO066i016p00169-01
MacDonald, G. A., and Katsura, T. (1964). Chemical composition of Hawaiian lavas. J. Petrology 5 (1), 82–133. doi:10.1093/petrology/5.1.82
Mangan, M. T., and Cashman, K. V. (1996). The structure of basaltic scoria and reticulite and inferences for vesiculation, foam formation, and fragmentation in lava fountains. J. Volcanol. Geotherm. Res. 73 (1-2), 1–18. doi:10.1016/0377-0273(96)00018-2
Mastin, L. (2007). Generation of fine hydromagmatic ash by growth and disintegration of glassy rinds. J. Geophys. Res. Solid Earth 112 (B12). doi:10.1029/2005JB003883
Moune, S., Faure, F., Gauthier, P. J., and Simms, K. W. W. (2007). Pele’s hairs and tears: natural probe of volcanic plume. J. Volcanol. Geotherm. Res. 164 (4), 244–253. doi:10.1016/j.jvolgeores.2007.05.007
Moyer, S., and Sahagian, D. L. (2023). Cry me a Pele’s tear: new insights on the internal structures of Pele’s tears. Front. Earth Sci. 11, 1184027. doi:10.3389/feart.2023.1184027
Namiki, A., Patrick, M. R., Manga, M., and Houghton, B. F. (2021). Brittle fragmentation by rapid gas separation in a Hawaiian fountain. Nat. Geosci. 14, 242–247. doi:10.1038/s41561-021-00709-0
Parcheta, C. E., Houghton, B. F., and Swanson, D. A. (2012). Hawaiian fissure fountains 1: decoding deposits—episode 1 of the 1969–1974 Mauna Ulu eruption. Bull. Volcanol. 74, 1729–1743. doi:10.1007/s00445-012-0621-1
Parcheta, C. E., Houghton, B. F., and Swanson, D. A. (2013). Contrasting patterns of vesiculation in low, intermediate, and high Hawaiian fountains; a case study of the 1969 Mauna Ulu eruption. J. Volcanol. Geotherm. Res. 225, 79–89. doi:10.1016/j.jvolgeores.2013.01.016
Parfitt, E. A., and Wilson, L. (1999). A Plinian treatment of fallout from Hawaiian lava fountains. J. Volcanol. Geotherm. Res. 88 (1-2), 67–75. doi:10.1016/S0377-0273(98)00103-6
Patrick, M. R., Dietterich, H. R., Lyons, J. J., Diefenbach, A. K., Parcheta, C., Anderson, K. R., et al. (2019). Cyclic lava effusion during the 2018 eruption of Kīlauea Volcano. Science 366 (6470), eaay9070. doi:10.1126/science.aay9070
Porritt, L. A., Russell, J. K., and Quane, S. L. (2012). Pele’s tears and spheres: examples from Kilauea Iki. Earth Planet. Sci. Lett. 333-334, 171–180. doi:10.1016/j.epsl.2012.03.031
Proussevitch, A. A., and Sahagian, D. L. (1996). Dynamics of coupled diffusive and decompressive bubble growth in magmatic systems. J. Geophys. Res. Solid Earth 101 (B8), 17447–17455. doi:10.1029/96JB01342
Proussevitch, A. A., and Sahagian, D. L. (1998). Dynamics and energetics of bubble growth in magmas: analytical formulation and numerical modeling. J. Geophys. Res. Solid Earth 103 (B8), 18223–18251. doi:10.1029/98JB00906
Proussevitch, A. A., Sahagian, D. L., and Anderson, A. T. (1993). Dynamics of diffusive bubble growth in magmas: isothermal case. J. Geophys. Res. Solid Earth 98 (B12), 22,283–22,307. doi:10.1029/93jb02027
Richter, D. H., Eaton, J. P., Murata, K. J., Ault, W. U., and Krivoy, H. L. (1970). Chronological narrative of the 1959-60 eruption of Kilauea volcano. Hawaii: USGS, 73. (Professional Paper No. 537-E. doi:10.3133/pp537E
Romero, J., Vera, F., Polacci, M., Morgavi, D., Arzillli, F., Alam, M. A., et al. (2018). Tephra from the 3 march 2015 sustained column related to explosive lava fountain activity at Volcán villarrica (Chile). Front. Earth Sci. 6, 98. doi:10.3389/feart.2018.00098
Rutherford, M. J., and Paolo, P. (2009). Origin of basalt fire-fountain eruptions on Earth versus the moon. Geology 37 (3), 219–222. doi:10.1130/G25402A.1
Sahagian, D., and Proussevitch, A. (2007). Paleoelevation measurement on the basis of vesicular basalts. Rev. Min. Geochem. 66, 195–213. doi:10.2138/rmg.2007.66.8
Sahagian, D., Proussevitch, A., and Carlson, W. (2002). Analysis of vesicular basalts and lava emplacement processes for application as a paleobarometer/paleoaltimeter. J. Geol. 110, 671–685. doi:10.1086/342627
Sahagian, D. L., and Proussevitch, A. A. (1998). 3D particle size distributions from 2D observations: stereology for natural applications. J. Volcanol. Geotherm. Res. 84 (3–4), 173–196. doi:10.1016/S0377-0273(98)00043-2
Shea, T., Houghton, B. F., Gurioli, L., Cashman, K. V., Hammer, J. E., and Hobden, B. J. (2010). Textural studies of vesicles in volcanic rocks: an integrated methodology. J. Volcanol. Geotherm. Res. 190 (3–4), 271–289. doi:10.1016/j.jvolgeores.2009.12.003
Siddaiah, N. S., and Kumar, K. (2007). Discovery of a volcanic ash bed from the basal subathu formation (late paleocene-middle eocene) near kalka, solan district (himachel pradesh), northwest sub-himalaya, India. Curr. Sci. 92 (1), 118–125. Available at: http://www.jstor.org/stable/24096835.
Stovall, W. K., Houghton, B. F., Hammer, J. E., Fagents, S. A., and Swanson, D. A. (2012). Vesiculation of high fountaining Hawaiian eruptions: episodes 15 and 16 of 1959 Kilauea Iki. Bull. Volcanol. 74, 441–455. doi:10.1007/s00445-011-0531-7
Swanson, D. A., Duffield, W. A., Jackson, D. B., and Peterson, D. W. (1979). Chronological narrative of the 1969-71 Mauna Ulu eruption of Kilauea volcano, Hawaii. United States Geological Survey. Available at: https://pubs.usgs.gov/pp/1056/report.pdf.
Swanson, D. A., and Fabbi, B. P. (1973). Loss of volatiles during fountaining and flowage of basaltic lava at Kilauea volcano, Hawaii. Jour. Res. U. S. Geol. Surv. 1 (6), 649–658.
Toramaru, A. (2006). BND (bubble number density) decompression rate meter for explosive volcanic eruptions. J. Volcanol. Geotherm. Res. 154 (Issues 3–4), 303–316. doi:10.1016/j.jvolgeores.2006.03.027
Toramaru, A. (2014). On the second nucleation of bubbles in magmas under sudden decompression. EPSL 404, 190–199. doi:10.1016/j.epsl.2014.07.035
Walker, D., and Mullins, O. (1981). Surface tension of natural silicate melts from 1,200°–1,500° C and implications for melt structure. Contributions Mineralogy Petrology 76, 455–462. doi:10.1007/BF00371487
Wilson, J. T. (1963). A possible origin of the Hawaiian Islands. Can. J. Phys. 41 (6), 863–870. doi:10.1139/p63-094
Wilson, L., Parfitt, E. A., and Head, J. W. (1995). Explosive volcanic eruptions—VIII. The role of magma recycling in controlling the behaviour of Hawaiian-style lava fountains. Geophys. J. Int. 121 (1), 215–225. doi:10.1111/j.1365-246X.1995.tb03522.x
Wygel, C. M., Peters, S. C., McDermott, J. M., and Sahagian, D. L. (2019). Bubbles and dust: experimental results of dissolution rates of metal salts and glasses from volcanic ash deposits in terms of surface area, chemistry, and human health impacts. Geohealth 3, 338–355. doi:10.1029/2018GH000181
Keywords: Pele’s tears, lava fountain, Hawaiian eruptions, lava fountain height, basaltic pyroclasts, basaltic eruptions, vesicles, magma degassing
Citation: Moyer S and Sahagian D (2024) Use of Pele’s tears and spheres as an indicator of lava fountain height in Hawaiian volcanoes. Front. Earth Sci. 12:1379985. doi: 10.3389/feart.2024.1379985
Received: 31 January 2024; Accepted: 08 May 2024;
Published: 31 May 2024.
Edited by:
Stephen Self, University of California, Berkeley, United StatesReviewed by:
Atsuko Namiki, Nagoya University, JapanThomas J. Jones, Lancaster University, United Kingdom
Copyright © 2024 Moyer and Sahagian. This is an open-access article distributed under the terms of the Creative Commons Attribution License (CC BY). The use, distribution or reproduction in other forums is permitted, provided the original author(s) and the copyright owner(s) are credited and that the original publication in this journal is cited, in accordance with accepted academic practice. No use, distribution or reproduction is permitted which does not comply with these terms.
*Correspondence: Scott Moyer, c21zY290dG1veWVyQGdtYWlsLmNvbQ==