 Yang Li
 Jun Li3*
95% of researchers rate our articles as excellent or good
Learn more about the work of our research integrity team to safeguard the quality of each article we publish.
Find out more
ORIGINAL RESEARCH article
Front. Earth Sci. , 04 April 2024
Sec. Geohazards and Georisks
Volume 12 - 2024 | https://doi.org/10.3389/feart.2024.1378046
This article is part of the Research Topic Mechanism, Stability and Mitigation of Large-scale Reservoir Landslides View all 8 articles
The geological structure of the reservoir bank landslide is complex and intricate. After deformation and damage, it causes river blockage, surges, and loss of people’s lives and property, posing a huge threat. At present, in academia and engineering applications, a large number of techniques such as inclinometers, rain gauges, and surface GNSS deformation monitoring are still used for monitoring landslides on reservoir banks. This type of monitoring method has the problem of “point to surface” which can easily lead to missed detection and reporting in some areas, some disaster points are close to water and steep, difficult to reach, and equipment installation is difficult. This work designs and implements a non-contact video quantitative monitoring system for surface deformation of geological disaster. By constructing a deep learning neural network, deformation area recognition and displacement quantitative calculation are achieved; By obtaining continuous images for a long time, draw the surface displacement-time curve, and output the surface deformation data and landform changes of the disaster. Meanwhile, this work explores the impact of different lighting conditions on the recognition results of target areas. This work can provide non-contact monitoring methods and dynamic warning support for large-scale monitoring of geological disasters.
China is a country with a vast territory and a dense population. Due to the complexity of its geological structure, as well as the influence of factors such as climate and mineral development, China often faces the threat of geological disasters (Liu and Liu, 2012). Especially with the implementation of many major engineering construction projects, it further affects the surrounding geological environment and is more likely to lead to the occurrence of geological disasters. Among them, the geological hazards caused by the construction of large reservoirs on the reservoir banks have long been of concern to the academic community (Peng et al., 2006). Taking the Three Gorges Reservoir Area as an example, since the impoundment of the Three Gorges Project, many ancient (old) landslides have been deformed and revived due to fluctuations in reservoir water level and rainfall infiltration, posing a significant threat to the safety of people’s lives and property in the reservoir area, as well as the stable operation of waterways (Peng et al., 2004; Li et al., 2018; Tian et al., 2020).
Geological hazard monitoring and early warning is an important means of disaster prevention and reduction (He et al., 2019). In 2022, a total of 321 geological disasters were successfully predicted nationwide, avoiding 7,226 potential casualties due to the disaster. These successful cases of disaster prevention and reduction are mainly achieved by installing geological hazard monitoring and early warning instruments such as rain gauges (Rosone et al., 2018; Yin et al., 2018), crack gauges, GNSS (Zhang et al., 2020; Cina and Piras, 2015), inclinometers (Liu et al., 2020), and sound and light alarm systems on the disaster body, which belong to the contact based geological hazard monitoring method (Li et al., 2016; Kotta et al., 2011; Iten et al., 2008). Some scholars have also adopted advanced acoustic emission technology to monitor the underground deformation of landslides, which still faces challenges in data interpretation and optimization applications (Deng et al., 2024). Due to the steep slopes of some disaster areas, the construction of cement foundation, monitoring upright pole, and installation equipment on the disaster area will be constrained by the arrival conditions and installation conditions. Especially when monitoring the collapse of the reservoir bank, the installation method of spider man lifting is often used, which is highly dangerous and difficult to operate and maintain. Moreover, these contact monitoring devices can only monitor deformation within a few meters of the installation location. For disaster areas where monitoring instruments are not installed, this type of method is often prone to false alarms.
In recent years, with the development of technologies such as radar (Rohrbaugh, 2015; Wang et al., 2021; Xiao and He, 2019), laser (Spreafico et al., 2016; Kovshov, 2017), and video (Khairunniza-Bejo et al., 2004; Yang et al., 2019), non-contact monitoring methods have also been widely used in geological hazard monitoring. Interferometric Synthetic Aperture Radar (InSAR) technology and wavelet analysis are used to conducted a comparative analysis of the deformation processes of reservoir and non-reservoir landslides in the Jilintai area between 2017 and 2022 (Ye et al., 2024). Through practical applications, it has been demonstrated that the time-series InSAR method, LiDAR scanning method, and image comparison method can detect the deformation sequence of monitoring objects, verifying the effectiveness of non-contact monitoring methods for deformation monitoring of reservoirs, dams, buildings, disaster bodies, etc. The monitoring range is wider than the contact based “single point monitoring” and the monitoring range is wider. Smartphones have also been applied in rock slope deformation monitoring, providing an easy to implement and low-cost solution for non-contact video monitoring (Fang et al., 2024).
This work focuses on the monitoring of geological hazards on the reservoir bank caused by reservoir construction. Based on the photos of the disaster body captured by cameras, a digital image correlation method using artificial intelligence to solve the displacement field of landslides is proposed. The advantage of non-contact monitoring methods is that there is no need for construction operations on the disaster body, and the monitoring range can cover the entire disaster body, rather than the vicinity of a limited number of contact monitoring equipment. This can avoid warning omissions caused by improper equipment deployment, providing technical support for non-contact geological disaster monitoring and warning methods.
The non-contact video quantitative monitoring method is a non-contact monitoring method aimed at monitoring the deformation of the disaster body without installing any equipment or cooperative targets. This work obtained on-site images of disaster bodies through high-definition cameras, and identified the displacement information of the disaster body by comparing the differences in the images. Therefore, the system design has the following requirements: (1) In order to achieve day and night monitoring of disaster bodies, infrared laser compensation devices need to be installed to obtain clear night vision images of distant disaster bodies. (2) Due to the fixed resolution of the camera, the detection accuracy of the system is closely related to the size of the image. In some cases, image stitching is required, so it is also necessary to introduce pan tilt and slide rails. (3) In outdoor environments, solar power supply is required for power management and low-power design. (4) Long term image data takes up a large amount of space, and hardware requirements are high based on artificial intelligence and classical image solving algorithms. Therefore, it is necessary to use servers for image data storage and calculation. Based on the above requirements, the overall system design is shown in Figure 1.
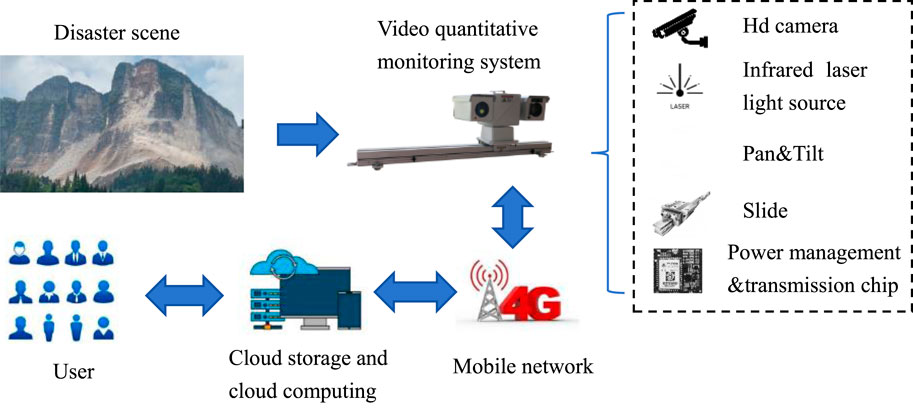
Figure 1. Overall architecture diagram of non-contact intelligent video quantitative monitoring system.
The non-contact video quantitative monitoring system first obtains images from the camera, and then transmits them to the server through the 4G network. Through the neural network deployed on the server, the displacement changes are calculated, and finally, warning information is issued through the warning service software. The perception layer integrates high-definition cameras, infrared laser compensation devices, gimbals, slides, and data transmission chips to achieve visual perception of disaster bodies. The transmission layer forms a complete closed loop through the transmission chip, 4G mobile network, and fixed IP of the server carried by the non-contact video quantitative monitoring system, which is used for image transmission and remote control. The data layer uses cloud servers for image storage, forming a sequence of disaster body images with timestamps. The application layer includes functions such as data solving, data analysis, result display, and user message reminders. The application layer is mainly completed through Cloud storage and cloud computing. All on-site photos and neural networks used for calculation are deployed in the cloud, and the calculation results are pushed to the monitoring and warning platform and users through the server. Through these four layers of architecture, the system can achieve functions such as non-contact perception, intelligent collection, quantitative calculation, and intelligent warning.
The front-end acquisition system includes a high-definition camera, infrared laser compensator, pan tilt, slide rail, and main control circuit board. The high-definition camera and infrared laser fill module are mounted on the gimbal and also receive logical control from the main control board. The main control circuit board mainly realizes functions such as image acquisition, image storage and transmission, acquisition logic control, power supply and low-power management. Due to the difficulty in providing electricity in the wild, this system uses a combination of solar panels and batteries. The principle of the front-end collection system is shown in Figure 2.
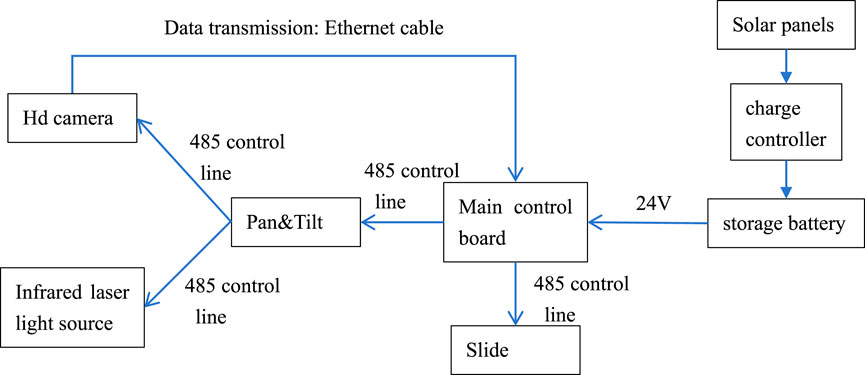
Figure 2. Front end collection system schematic diagram.
The system adopts RK3568 as the core control chip, which integrates a quad core Cortex-A55 processor and is equipped with a new Arm v8.2-A architecture, effectively improving overall performance. The GPU adopts the Mail G52 2EE dual core architecture, supporting 4 K decoding and 1080 P decoding, CBR, VBR, FixQp, AVBR, QpMap, and ROI encoding. The image API supports OpenGL ES3.2 and Vulkan1.1. The chip adopts advanced 22nm technology, with a main frequency of up to 1.8 GHz and low power consumption and high performance. Supports one click conversion of mainstream architecture models such as Caffe/TensorFlow/TFLite/ONNX/PyTorch/Keras/Darknet.
The main control chip is used to build the main control board, which has the following system characteristics: (1) High performance: adopting the quad core A55 scheme, with a main frequency of up to 1.8 GHz, supporting high-definition decoding in various formats such as 4KH.264/H.265. (2) Multiple network interfaces: Supports 2.4 GHz/5 GHz dual band WiFi, wired 100 Mbps Ethernet, 4G wireless network. (3) Rich extension interfaces: Supports USB, TTL, RS232, RS485, and I2C extension interfaces. (4) Supports Android and Linux systems, supports system optimization, development customization, and is suitable for APK development.
High definition network cameras have the characteristics of convenient and fast development, and are equipped with commonly used camera communication protocols. The main control board communicates through RS485 and controls high-definition cameras, infrared laser compensation devices, gimbals, slides, etc., in PELCO-D protocol format. The movement parameters can also be set and operated through the built-in operating system on the main control board, using IE controls or client configurations. PELCO-D communication data format: 1-bit start bit, 8-bit data, 1-bit stop bit, invalid check bit. Default communication baud rate: 9600B/S, default address 1.
All numerical values in the PELCO-D protocol are hexadecimal numbers, and the synchronization byte is always FFH; The address code is the logical address number of the camera, ranging from 00H to FFH, and the instruction code represents different actions; Data codes 1 and 2 represent horizontal and vertical velocities (00-3FH) respectively, while FFH represents “turbo” velocity; The checksum is MOD [(Byte 2 + Byte 3 + Byte 4 + Byte 5 + Byte 6)/100H]. A typical control command is shown in Table 1.

Table 1. Typical camera control command format.
RS-485 adopts balanced transmission and differential reception, therefore it has the ability to suppress common mode interference and is the preferred serial interface for long-distance transmission and multi station communication. The main control chip sends control commands and receives return data through RS485. The design of the transmission circuit is shown in Figure 3.
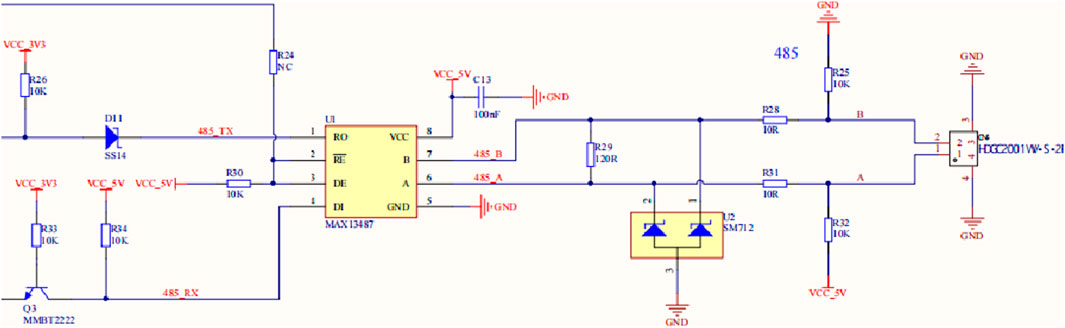
Figure 3. 485 communication circuit design schematic.
The power system includes: solar photovoltaic panels, solar charging control, battery and power management chip LM2596, to provide functions such as charging and energy storage, power supply stabilization, and low consumption management for the system. The low-power control board serves as the power management core, and in standby mode, all power consuming peripherals (such as the slide, pan tilt, camera, and RK3658 motherboard) will be disconnected from power to achieve complete zero power consumption of the peripherals. Moreover, when the power control board is in a non shooting state, it will enter a low power state, allowing the entire system to maintain low power consumption. The low-power control board will periodically wake up and provide power to RK3568 and enter normal working mode. The low-power control board carries a low-power 4G communication module and maintains communication with the server at all times to ensure that the entire workflow can be controlled through the server at any time.
The data module adopts the EC21 model for remote communication. EC21 Mini PCIe is an LTE Cat 1 wireless communication module designed for the transition from teleportation to M2M and IoT fields, using the PCI Express Mini Card standard interface. It can well meet the application needs of customers for high cost-effectiveness and low power consumption, and supports a downlink rate of 10 Mbps and a maximum uplink rate of 5 Mbps. The EC21 Mini PCIe series is suitable for stable and reliable LTE network connections. EC21 Mini PCIe is equipped with rich network protocols, integrates multiple industry standard interfaces, and supports various driver and software functions (such as USB to serial driver in Windows 7/8/8.1/10/11, Linux, Android and other operating systems); Greatly expanding its application scope in M2M and IoT fields.
The system sets the monitoring frequency according to actual needs. When the scheduled collection time is reached, the system automatically recovers from a low-power state to a normal working state. The system will turn on the power of peripheral components such as the slide rail and gimbal, and the gimbal will start self checking and the slide rail will begin to return to its original position. After preparation, adjust the camera’s horizontal and vertical posture, adjust the focal length to the preset position, perform focusing, and start shooting. The night system will automatically activate the infrared laser compensator. After taking a set of photos, the system will decide whether to start the next set of photos based on the settings until the shooting is completed. After the shooting is completed, the external device loses power, and the main control board packages and uploads the captured image files to the server for algorithm calculation as shown in Figure 4.
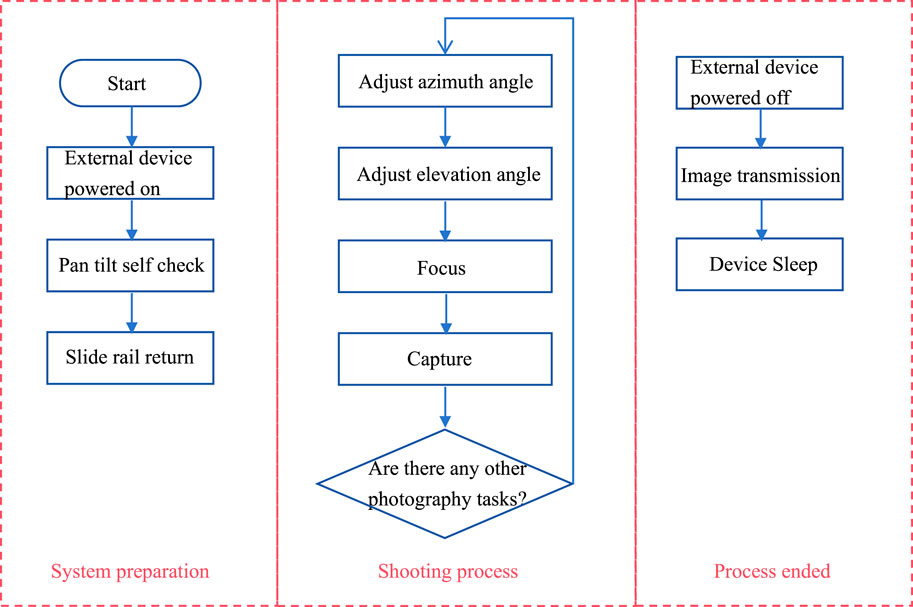
Figure 4. System data collection workflow.
After the image is transmitted to the server, the solution algorithm begins to perform quantitative displacement analysis on the image. Firstly, the algorithm will evaluate the image quality, including its clarity, jitter level, etc., Images that do not meet the calculation requirements will be discarded. The image that meets the calculation requirements will first undergo semantic segmentation, cutting out interference areas such as vegetation and sky in the image, and extracting features from the reserved areas (Hsieh et al., 2011). Then, the algorithm analyzes the surface terrain, identifies differences in the surface, and performs feature matching on manually selected monitoring areas to identify displacement in key areas. Figure 5 shows the algorithm flowchart.
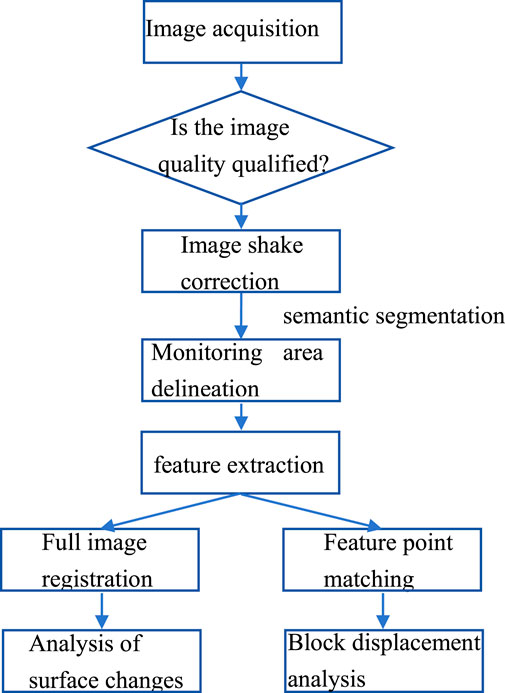
Figure 5. Algorithm solving process.
In order to eliminate the interference of vegetation and other factors on the measurement of the target area, a semantic segmentation method based on deep learning is adopted to automatically extract effective monitoring areas. Semantic segmentation is a classification at the pixel level, where pixels belonging to the same class are grouped together. Semantic segmentation is a method of understanding images from the pixel level. DeepLab v3 is currently a widely used semantic segmentation method, which is a semantic segmentation model based on deep convolutional neural networks, proposed by the Google Brain team in 2017 (Chen et al., 2017) as shown in Figure 6. The main feature of DeepLab v3 is its ability to effectively utilize multi-scale contextual information and low-level features for semantic segmentation, achieving excellent performance on multiple datasets.
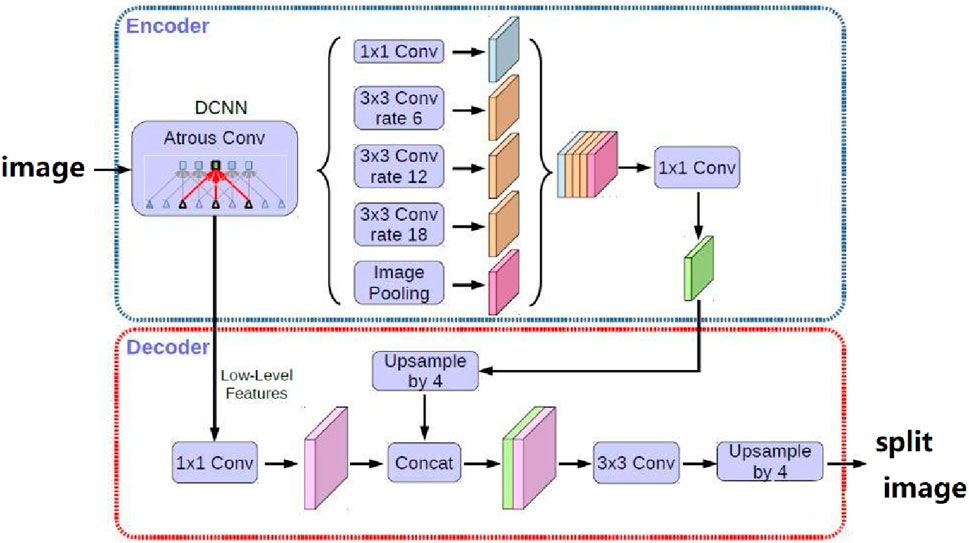
Figure 6. Semantic segmentation principle diagram.
DeepLab v3 uses deep convolutional neural networks such as ResNet or Xception as its backbone network to extract features from input images. After the backbone network, DeepLabv3 uses the ASPP module to extract multi-scale features from feature maps. The ASPP module includes multiple parallel convolutional layers, each of which uses different sizes of dilated convolution kernels to convolve feature maps to capture contextual information at different scales. After the ASPP module, DeepLabv3 uses the Decoder module to upsample and fuse feature maps to obtain more refined semantic segmentation results. The Decoder module includes an upsampling layer and a fusion layer, where the upsampling layer upsamples the feature map to the same size as the input image, and the fusion layer fuses the upsampled feature map with low-level features in the backbone network to improve the accuracy of semantic segmentation. Figure 7 shows the effect of removing some interference areas through semantic segmentation algorithm.
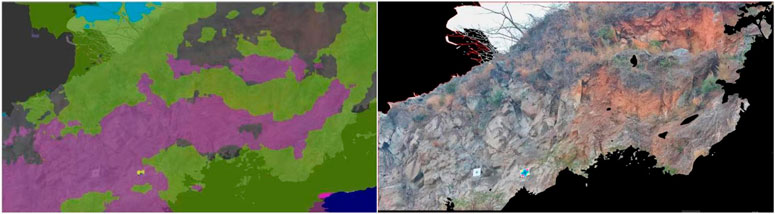
Figure 7. Monitoring area automatically extracted through semantic segmentation.
Most existing matching methods include three independent stages: feature detection, feature description, and feature matching. In the detection stage, prominent points such as corners are first detected from each image as points of interest. Then extract local descriptors around the neighborhood of these interest points. The feature detection and description stage generates two sets of interest points with descriptors, and then finds their point-to-point correspondence through nearest neighbor search or more complex matching algorithms. However, in low texture areas or when repetitive patterns occupy most of the field of view (especially in large soil cover layers, similar rock surfaces), the feature detector may not be able to extract enough points of interest. Research has found that compared to machine learning, humans are better at discovering corresponding relationships in areas with less distinct features, not only based on local neighborhoods, but also on larger global backgrounds. Therefore, the large receptive field in feature extraction networks is crucial (Choy et al., 2016; Rocco et al., 2018; Sun et al., 2021). This work adopts a new detector free local feature matching method, which provides a global acceptance domain that enables dense matching in areas with fewer textures.Its working principle is shown in Figure 8.
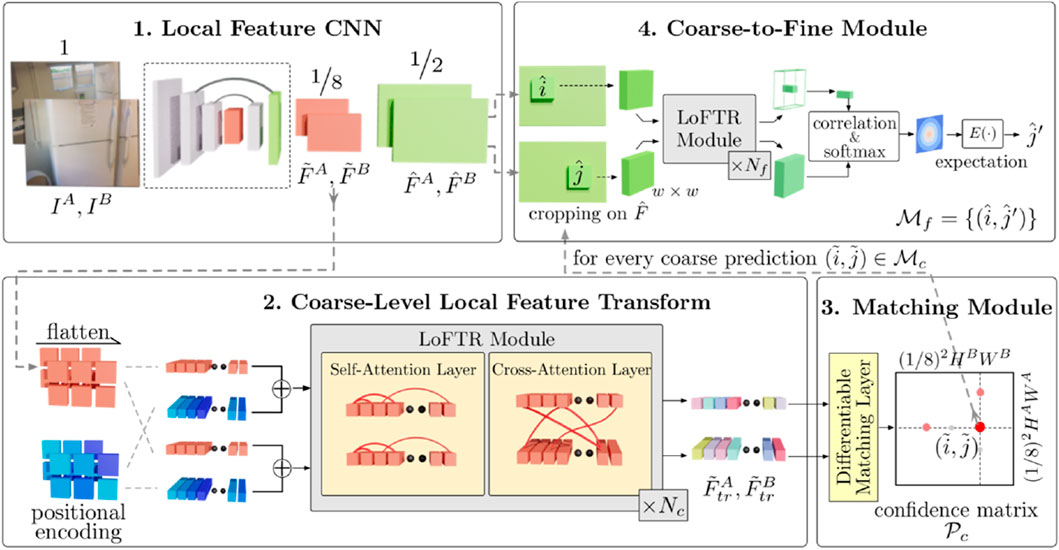
Figure 8. Working principle of local feature matching method.
The Qutangxia ancient boardwalk dangerous rock zone is widely distributed with a large number of small-scale loose dangerous rock, surface fractured zones, and dangerous rock masses as shown in Figure 9. There is a possibility of small-scale weathering and collapse, loose block collapse, and dangerous rock collapse. This time, non-contact surface deformation measurements were conducted on dangerous rock masses located in Groups 14 and 15 of Qutangxia Community, Kuimen Street, which have a certain scale and may form surging waves. The monitoring object is WY08, with the top elevation is 219 m, the bottom elevation is 168 m, and the overall slope is about 83°. The dangerous rock is 15 m wide, 62 m high, and 13 m thick, with a total area of about 930 m2 and a total volume of about 12090 m3. The terrain in the area is steep cliffs, with a steep slope on the banks of the Yangtze River. The cracks in the dangerous rock mass are well-developed and cut into blocks by cracks. The cracks are interconnected, and rainfall infiltration has a significant impact on the stability of the dangerous rock mass. Under rainfall, earthquakes, or artificial disturbances, it is prone to collapse and falling blocks, with potential threats to the Yangtze River waterway and some scenic boardwalks below, which may cause economic losses of about 6 million yuan (CNY).
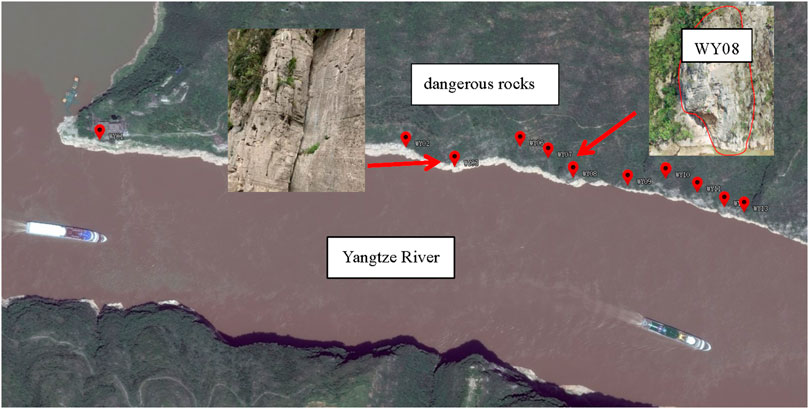
Figure 9. The geographical location of the Qutang Xiakou Dangerous Rock Zone.
In order to improve the calculation accuracy of non-contact video intelligent monitoring systems, this work adopts a dual template matching method, which establishes matching templates for different working conditions, and the algorithm automatically calculates the optimal matching result, thereby minimizing the impact of interference conditions. Tables 2, 3 show the matching templates for each monitoring area under different working conditions (Among them, Condition 1 is the template under morning lighting conditions, and Condition 2 is the template under afternoon lighting conditions. Due to different lighting angles, disasters will produce shadows of different sizes, which will affect the accuracy of monitoring area matching), and Figure 10 shows the matching results for each area in the actual photos taken. Left image of Figure 10 shows the region matching result after applying the template for working condition 1, and it can be seen that due to the influence of lighting, there are shadows in some areas. When applying the template of working condition 1, areas 1, 2, 4, and 7 all have deviations in the center coordinates of the identified areas. The actual situation is that there is no overall displacement of the disaster body, and the system has generated false alarms. The right figure in Figure 10 shows the matching result of the system automatically calling the template for working condition 2, and all 8 areas are successfully matched within the fluctuation range of 4 pixels, indicating that there is no displacement change in the target area, consistenting with the actual situation.
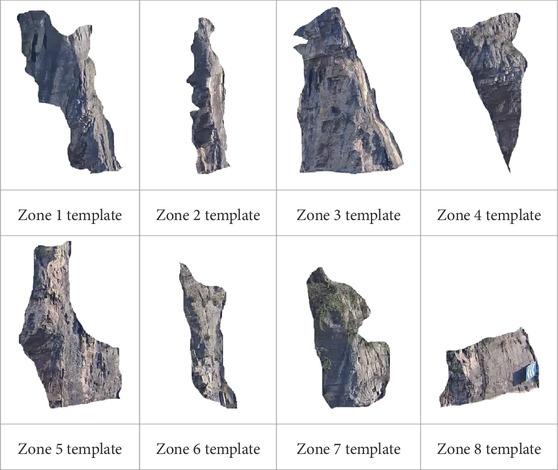
Table 2. Template for monitoring areas of disaster bodies (working condition 1).
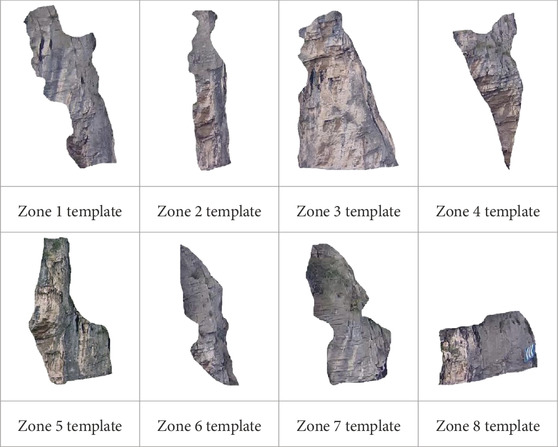
Table 3. Template for monitoring areas of disaster bodies (working condition 2).
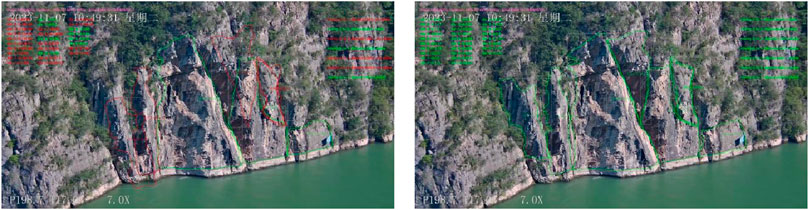
Figure 10. Comprehensive template matching improves matching success rate.
In practical applications, disaster bodies may produce shadows of different sizes and positions due to different angles of sunlight exposure. This is an unavoidable phenomenon, namely the different working conditions mentioned earlier. These varying degrees of shadows can affect the accuracy of region matching work. This work establishes multiple sets of lighting condition templates for different monitoring areas, selects the best matching results, and improves the robustness of the recognition algorithm, which can effectively overcome the impact of different lighting conditions.
The system uses an 8-megapixel camera as the image acquisition tool, with an image resolution of 3,840 * 2,160. The camera is 450 m away from the dangerous rock mass and sampling interval is 1 hour. After region matching, calculate the distances between each region separately and use this distance array as the initial monitoring value. In the subsequent monitoring process, if a certain distance changes, the specific deformation area can be analyzed based on the relative distance relationship. This method is particularly suitable for disaster body dumping, displacement, and regional displacement, as shown in Figure 11. We analyzed 72 sets of images from November 6th to 8 November 2023, for a total of 3 days, and the solution results were basically stable within 5 pixels. Despite all this, there are fluctuations near the 38th group of data. Based on the analysis of on-site photos, it should be caused by rock color changes caused by rainfall and imaging conditions changes caused by water mist in the air. After 6 h, the calculation results returned to normal levels.
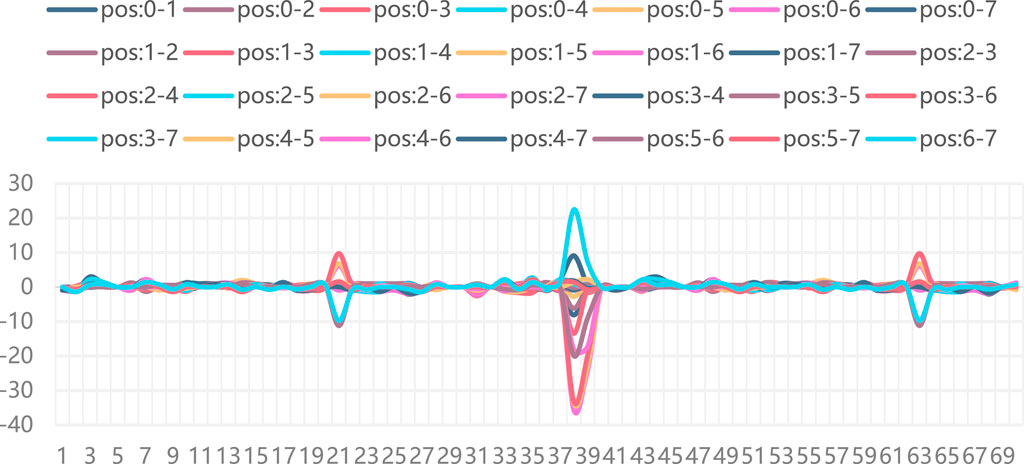
Figure 11. Calculation results of displacement in various monitoring areas.
This work designed and implemented a non-contact measurement system for geological hazard surface deformation based on video technology, detailed the design scheme and application process of the system, and implemented multi monitoring area matching and identification of displacement. The work has achieved the following results:
(1) By using artificial intelligence methods, disaster body features are automatically extracted and matched, without the need to install monitoring targets on the disaster body, achieving more thorough displacement monitoring without cooperative targets. Compared to traditional contact monitoring methods, using non-contact measurement methods can avoid construction and equipment debugging on disaster bodies, effectively reduce construction difficulty, save monitoring costs, and ensure personnel safety.
(2) Multiple displacement monitoring areas can be set up, and identify and match the monitoring areas in the captured images at different time periods, while returning the center coordinates of these areas. At present, the accuracy of the system is 5 pixels (pixel to actual distance calibration has not yet been carried out).
(3) Disaster photos can be transmitted in real-time to the data management server for synchronous calculation, providing effective data reference for geological disaster management personnel and emergency experts, reducing casualties and property losses.
Meanwhile, in subsequent research, there is room for further improvement in the system, mainly manifested in the following aspects:
(1) Changes in field lighting conditions can easily affect the imaging of disaster bodies, especially the shadows of rock masses, which pose great difficulties in image feature matching. This work proposes a comprehensive matching method using multiple templates to effectively overcome the influence of lighting, but reducing the mismatch of shadow areas on displacement calculation will still be an important research direction.
(2) The resolution, shooting distance, and focal length of the image can all affect the calculation results. The shooting distance is determined by objective monitoring of the scene. The image resolution is determined by the shooting camera and is a fixed parameter. Therefore, the larger the focal length, the larger the image field of view, and the lower the displacement measurement accuracy. Therefore, the selection of focal length during shooting is also a crucial parameter.
(3) In rainy and foggy environments, the clarity of the obtained images will significantly decrease. In this working condition, how to improve the system’s solving ability is also the main problem to be solved in the future.
More and more non-contact monitoring methods are being used for monitoring surface deformation. For example, using satellite images and interferometric synthetic aperture radar to analyze the retrogressive saw slump (RTS) activity of permafrost (Liu et al., 2024), as well as using unmanned aerial vehicle conducted four unmanned aerial system (UAS) surveys and created corresponding high resolution digital elevation models (HRDEMs) and telephotos in the Heifangtai loss tableland (Yang et al., 2021).These are successful cases of using non-contact measurement methods for surface deformation. The video monitoring method can conduct all-weather surface deformation monitoring, with advantages in data volume and frequency of data acquisition, strong timeliness, and is very suitable for monitoring and early warning of geological disasters. The monitoring area recognition and matching algorithm proposed in this work can improve traditional video monitoring into quantitative calculation, and has certain market application prospects.
The datasets presented in this study can be found in online repositories. The names of the repository/repositories and accession number(s) can be found in the article/Supplementary material.
YL: Conceptualization, Funding acquisition, Methodology, Project administration, Writing–original draft. JL: Data curation, Project administration, Writing–original draft. JP: Data curation, Methodology, Writing–original draft. WC: Conceptualization, Data curation, Visualization, Writing–original draft. GL: Data curation, Investigation, Writing–review and editing. GX: Investigation, Validation, Writing–original draft.
The author(s) declare that financial support was received for the research, authorship, and/or publication of this article. This work was supported by Geological Survey Projects of China Geological Survey (No. DD20230447).
The authors declare that the research was conducted in the absence of any commercial or financial relationships that could be construed as a potential conflict of interest.
All claims expressed in this article are solely those of the authors and do not necessarily represent those of their affiliated organizations, or those of the publisher, the editors and the reviewers. Any product that may be evaluated in this article, or claim that may be made by its manufacturer, is not guaranteed or endorsed by the publisher.
Chen, L. C., Papandreou, G., Schroff, F., and Adam, H. (2017). Rethinking atrous convolution for semantic image segmentation. Chinese. doi:10.48550/arXiv.1706.05587
Choy, C. B., Gwak, J. Y., Savarese, S., and Chandraker, M. (2016). Universal correspondence network. doi:10.48550/arXiv.1606.03558
Cina, A., and Piras, M. (2015). Performance of low-cost gnss receiver for landslides monitoring: test and results[J]. Geomatics, Nat. hazards risk 6 (5–7), 497–514. doi:10.1080/19475705.2014.889046
Deng, L. Z., Yuan, H. Y., Chen, J. G., Zhang, M. Z., Su, G. F., Zhou, Y., et al. (2024). Experimental investigation and field application of acoustic emission array for landslide monitoring. Landslide (21), 71–81. doi:10.1007/s10346-023-02119-2
Fang, K., Dong, A., Tang, H. M., An, P. J., Wang, Q. Y., Jia, S. X., et al. (2024). Development of an easy-assembly and low-cost multismartphone photogrammetric monitoring system for rock slope hazards. International Journal of Rock Mechanics and Mining Sciences (174), 105655. doi:10.1016/j.ijrmms.2024.105655
He, W., Zhang, L. Z., Cheng, H., and Liang, X. (2019). Research and application of big data information platform for geological disaster monitoring. Bulletin of Surveying and Mapping (01), 127–131. Chinese. doi:10.13474/j.cnki.11-2246.2019.0026
Hsieh, Y. T., Wu, S. T., Liao, C. S., Yui, Y. G., and Chung, Y. L. (2011). Automatic extraction of shadow and non-shadow landslide area from ads-40 image by stratified classification. IEEE. doi:10.1109/IGARSS.2011.6049860
Iten, M., Puzrin, A. M., and Schmid, A. (2008). Landslide monitoring using a road-embedded optical fiber sensor[C]. SPIE.
Jian, B. P. (2006). Some important problems to Be addressed in reserch of active tectinics and environmental disasters in China. J. Eng. Geol. (01), 5–12. Chinese.
Khairunniza-Bejo, S., Petrou, M., and Kovalev, V. A. (2004). Elastic image registration for landslide deformation detection. Proc. SPIE - Int. Soc. Opt. Eng. 5573, 344–355. doi:10.1117/12.565029
Kotta, H. Z., Rantelobo, K., Tena, S., and Klau, G. (2011). Wireless sensor network for landslide monitoring in nusa tenggara Timur. telkomnika. doi:10.12928/telkomnika.v9i1.640
Kovshov, K. S. V. (2017). Accuracy evaluation of terrain digital models for landslide slopes based on aerial laser scanning results. Ecol. Environ. Conservation 23 (2).
Li, Y., Fu, P., Ji, W. F., Shi, S. W., Zhang, Y., and Zhang, T. (2016). Predictive Method of Nonlinear System Based On Artificial Neural Network and Svm. Oxidation Communications (1A), 1226–1235.
Li, S. L., Xu, Q., and Tang, M. (2018). Study on spatial distribution and key influencing factors of landslides in three gorges reservoir area. Earth Science (01), 341–354. Chinese. doi:10.3799/dqkx.2017.576
Liu, C. Z., and Liu, Y. H. (2012). Some discussion on geo-hazards control and geo-environment sustainable development. Journal of Jilin University (Earth Science Edition) (05), 1469–1476. Chinese. doi:10.13278/j.cnki.jjuese.2012.05.028
Liu, X. Y., Fan, Z. Y., and Wu, J. (2020). Evolution of deformation and monitoring techniques of surface tilt for soil landslides using MEMS technique. The Chinese Journal of Geological Hazard and Control 31 (6), 69–77. doi:10.16031/j.cnki.issn.1003-8035.2020.06.09
Liu, Y., Qiu, H. J., Ulrich kamp, , Wang, N. L., Wang, J. D., Huang, C., et al. (2024). Higher temperature sensitivity of retrogressive thaw slump activity in the arctic compared to the third pole. Science of The Total Environment (914), 170007. doi:10.1016/j.scitotenv.2024.170007
Ming, Z. Z., Bing, Z., Weng, Y. Z., Xu, D. Y., and Li, H. X. (2020). Design and practice of high precision landslide displacement monitoring system based on VRS. Chin. J. Geol. Hazard Control (06), 54–59. doi:10.16031/j.cnki.issn.1003-8035.2020.06.07
Peng, J. B. (2006). Some important problems to be addressed in reserch of active tectinics and environmental disasters in China. Journal of Engineering Geology (01), 5–12. Chinese.
Peng, T., Xu, G., and Xia, D. (2004). Trend of geological hazards and countermeasure of disaster reduction in the three gorges reservoir area. Journal Of Mountain Science (06), 719–724. Chinese. doi:10.16089/j.cnki.1008-2786.2004.06.014
Rocco, I., Cimpoi, M., Arandjelovi, R., Torii, A., Pajdla, T., and Sivic, J. (2018). Neighbourhood consensus networks. doi:10.48550/arXiv.1810.10510
Rohrbaugh, N. B. (2015). A new technique for modeling the geomorphology of a slow moving, soft-slope landslide using terrestrial LiDAR.
Rosone, M., Ziccarelli, M., Ferrari, A., and Camillo, A. F. (2018). On the reactivation of a large landslide induced by rainfall in highly fissured clays[J]. Eng. Geol. 235, 20–38. doi:10.1016/j.enggeo.2018.01.016
Ru, Y. X., and Xiu, F. H. (2019). Deformation monitoring of reservoirs and dams using time-series InSAR. Geomatics Inf. Sci. Wuhan Univ. (09), 1334–1341. doi:10.13203/j.whugis20170327
Rui, W., Yu, L. X., Shi, Z. W., Yu, L. Z., and Ting, Z. (2021). Study on cumulative time series deformation monitoring in mining area based on DInSAR technology. Industrial Minerals Process. (11), 44–47+53. doi:10.16283/j.cnki.hgkwyjg.2021.11.008
Song, L. L., Qiang, X., Liang, M. T., and Dong, X. Z. (2020). Study on spatial distribution and key influencing factors of landslides in three Gorges reservoir area. Earth Sci. (01), 341–354. doi:10.3799/dqkx.2017.576
Spreafico, M. C., Francioni, M., Cervi, F., Stead, D., Bitelli, G., Ghirotti, M., et al. (2016). Back analysis of the 2014 san leo landslide using combined terrestrial laser scanning and 3d distinct element modelling. Rock Mechanics&Rock Eng. doi:10.1007/s00603-015-0763-5
Sun, J., Shen, Z., Wang, Y., Bao, H., and Zhou, X. (2021). LoFTR: detector-free local feature matching with transformers. Computer Vision and Pattern Recognition. IEEE. doi:10.1109/CVPR46437.2021.00881
Tao, P., Gang, X., and Da, Q. X. (2004). Trend of geological hazards and countermeasure of disaster reduction in the three Gorges reservoir area. J. Mt. Sci. (06), 719–724. doi:10.16089/j.cnki.1008-2786.2004.06.014
Tian, Y., Zhu, J. H., Li, Q., et al. (2020). Spatial and temporal distribution of soil conservation and its driving forces in the three gorges reservoir area. Chinese Journal of Ecology (04), 1164–1174. Chinese. doi:10.13292/j.1000-4890.202004.019
Wang, R., Xue, Y. L., Wan, S. Z., Zheng, Y. L., and Zhang, T. (2021). Study on cumulative time series deformation monitoring in mining area based on DInSAR technology. Industrial Minerals And Procession (04), 44–47. Chinese. doi:10.16283/j.cnki.hgkwyjg.2021.11.008
Wei, H., Lun, N. Z., Cheng, C. H., Xiao, L., and Lian, K. S. (2019). Research and application of big data information platform for geological disaster monitoring. Bull. Surv. Mapp. (01), 127–131. doi:10.13474/j.cnki.11-2246.2019.0026
Xiao, R. Y., and He, X. F. (2019). Deformation monitoring of reservoirs and dams using time-series InSAR. Geomatics and Information Science of Wuhan University (09), 1334–1341. Chinese. doi:10.13203/j.whugis20170327
Ya, L., Jun, H. Q., Ulrich, K., Wang, N., Wang, J., Huang, C., et al. (2024). Higher temperature sensitivity of retrogressive thaw slump activity in the Arctic compared to the Third Pole. Sci. Total Environ.914 (914), 170007. doi:10.1016/j.scitotenv.2024.170007
Yang, D. D., Qiu, H. J., Hu, S., Pei, Y. Q., Wang, X. G., Du, C., et al. (2021). Influence of successive landslides on topographic changes revealed by multitemporal high-resolution UAS-based DEM. Catena: An Interdisciplinary Journal of Soil Science Hydrology-Geomorphology Focusing on Geoecology and Landscape Evolution (202), 105229. doi:10.1016/j.catena.2021.105229
Yang, L., Pan, F., Wei, F. J., Sheng, W. S., Yong, Z., and Zhang, T. (2016). Predictive method of nonlinear system based on artificial neural network and svm. Oxid. Commun. (1A), 1226–1235.
Yang, Y. S., Shu, L. Y., Fu, C. H., Shao, W., Kui, N. W., Zhao, K., et al. (2019). Superpixel-based automatic image recognition for landslide deformation areas. Eng. Geol. 259, 105166. doi:10.1016/j.enggeo.2019.105166
Ye, B. F., Qiu, H. J., Tang, B. J., Liu, Y., Liu, Z. J., Jiang, X. Y., et al. (2024). Creep deformation monitoring of landslides in a reservoir area. Journal of Hydrology (632), 130905. doi:10.1016/j.jhydrol.2024.130905
Yin, Z. K., Liao, W. H., Lei, X. H., and Wang, H. (2018). Comparing the hydrological responses of conceptual and process-based models with varying rain Gauge density and distribution[J]. Sustainability 10 (9), 130905. doi:10.3390/su10093209
Yu, T., Jian, H. Z., Qi, L., Yuan, F., Chen, Y. L., and Weng, F. X. (2020). Spatial and temporal distribution of soil conservation and its driving forces in the Three Gorges Reservoir Area. Chin. J. Ecol. (04), 1164–1174. doi:10.13292/j.1000-4890.202004.019
Zhang, M. Z., Zhan, B., Zhao, W. Y., et al. (2020). Design and practice of high precision landslide displacement monitoring system based on VRS. The Chinese Journal of Geological Hazard and Control (06), 54–59. doi:10.16031/j.cnki.issn.1003-8035.2020.06.07
Keywords: geological hazards, non-contact monitoring, video monitoring, surface displacement, machine learning, artificial intelligence
Citation: Li Y, Li J, Pei J, Chen W, Luo G and Xia G (2024) Application of non-contact video quantitative measurement method in reservoir bank landslide monitoring. Front. Earth Sci. 12:1378046. doi: 10.3389/feart.2024.1378046
Received: 29 January 2024; Accepted: 12 March 2024;
Published: 04 April 2024.
Edited by:
Zhenwei Dai, China Geological Survey (Geosciences Innovation Center of Central South China), ChinaReviewed by:
Kun Fang, China University of Geosciences Wuhan, ChinaCopyright © 2024 Li, Li, Pei, Chen, Luo and Xia. This is an open-access article distributed under the terms of the Creative Commons Attribution License (CC BY). The use, distribution or reproduction in other forums is permitted, provided the original author(s) and the copyright owner(s) are credited and that the original publication in this journal is cited, in accordance with accepted academic practice. No use, distribution or reproduction is permitted which does not comply with these terms.
*Correspondence: Jun Li, c3hza3lsal83ODA2MThAMTI2LmNvbQ==
Disclaimer: All claims expressed in this article are solely those of the authors and do not necessarily represent those of their affiliated organizations, or those of the publisher, the editors and the reviewers. Any product that may be evaluated in this article or claim that may be made by its manufacturer is not guaranteed or endorsed by the publisher.
Research integrity at Frontiers
Learn more about the work of our research integrity team to safeguard the quality of each article we publish.