 Huaimin Dong
 Bin Luo3
 Peng Chi
- 1School of Geological Engineering and Geomatics, Chang’an University, Xi’an, China
- 2Key Laboratory of Western China’s Mineral Resources and Geological Engineering, Xi’an, China
- 3Research Institute of Petroleum Exploration and Development, Changqing Oilfield Company, Xi’an, China
- 4Department of Geology, Northwest University, Xi’an, China
- 5No.1 Oil Production Plant, Changqing Oilfield Company, Yan’an, China
- 6School of Geosciences, China University of Petroleum, Qingdao, China
The precise characterization of the rock microstructure is crucial for predicting the physical characteristics, flow behavior, and mechanical properties of rocks. This is particularly important for carbonate rocks, which depict a complex microstructure with multimodal pore radius distribution and natural fractures. Here, topological features that are typically ignored are taken into account to quantify the carbonate microstructure. Carbonate samples used are obtained from the Gaoshiti–Moxi block of the Sichuan Basin, which showed remarkable potential for oil and gas. Specifically, nuclear magnetic resonance (NMR), X-ray micro-computed tomography (micro-CT), and mercury injection capillary pressure (MICP) techniques are performed to describe the topological and geometric characteristics. The results indicate that NMR and MICP techniques can describe more rock pores than micro-CT. However, due to the presence of pore shielding in MICP tests, the pore radius obtained by MICP is smaller than that obtained by micro-CT and NMR. Furthermore, the effective method used for characterizing the pore structure is NMR technology. The hardest part is that the coefficient between the pore radius and T2 relaxation time is difficult to calculate. Therefore, a better calculation method must be found. In addition, micro-CT is an irreplaceable technique for obtaining a large number of topological and geometric features, and multi-phase or single-phase flow simulations can be conducted via digital rock models. However, for carbonates, micro-CT is not sufficient to describe the complete pore systems because macropores cannot be fully represented and sub-resolution micropores cannot be described. Those macropores and micropores have a very important effect on their seepage properties. Therefore, multi-scale digital rock modeling involving small and large pores is essential for complex rocks, which is of great significance for the analysis of pore systems and the simulation of rock physical properties.
1 Introduction
The microstructure characterization of subsurface systems is crucial for determining the permeable regions, petrophysical properties, and associated reservoir quality (Tahmasebi, 2017; Dong et al., 2023). These microstructural petrophysical properties of the rocks control the macroscopic properties and flow behavior (Daigle et al., 2017; Fagbemi et al., 2018; Tahmasebi and Kamrava, 2018), which include the topological and geometrical characteristics (Dong et al., 2017; Abro et al., 2019). In this context, carbonate rocks offer a relatively complex microstructure, which is attributed to a range of factors, including but not limited to multimodal pore radius distribution (e.g., micro-porosity and vugs) and mineral heterogeneity (e.g., the classic case of the Arab-D reservoir, where dolomitization leads to massive heterogeneous lithologies) (Arif et al., 2020; Chandra et al., 2021; Li et al., 2022).
A range of techniques have been applied to investigate the carbonate microstructure (Kibria et al., 2018; Gao et al., 2019), which can be categorized into direct imaging techniques, such as X-ray micro-computed tomography (micro-CT), scanning electron microscopy (SEM), and laser confocal scanning (Van Geet et al., 2001; Romero and Simms, 2008; Norbisrath et al., 2015; Zhang et al., 2021), and indirect techniques, such as nuclear magnetic resonance (NMR), mercury injection capillary pressure (MICP), small-angle neutron scattering (SANS), and gas adsorption (Yao et al., 2010; Okolo et al., 2015; Radlinski and Mastalerz, 2017; Yu et al., 2020; Hosseini et al., 2021). There are scores of previous studies that have characterized the carbonate microstructure using one or a combination of the techniques mentioned above; however, a majority of those typically aimed at the pores’ geometric characteristics only (Zhang et al., 2016; Sarkar et al., 2018), while the analysis of the pore systems’ topological characteristics is frequently ignored, although these parameters have important effects on the transport properties.
In this paper, for the sake of comprehensively characterizing the topological and geometrical characteristics of carbonate rocks, MICP, NMR, and micro-CT tests are performed on six carbonate samples. These samples were acquired from the Longwangmiao and Dengying formations in the Gaoshiti–Moxi field, Sichuan Basin, China, which is a significant discovery made in terms of hydrocarbon potential as evidenced in recent years (Otiede and Wu, 2011; Zhou et al., 2020). The samples’ preparation and experimentation are performed, followed by the fractal dimension calculation to examine the topological features.
2 Geological setting
The Gaoshiti–Moxi block is located in the middle of the gentle tectonic belt in the middle Sichuan area and the eastern part of the axis of the Leshan–Longnvsi ancient uplift in the Sichuan Basin, which included the Cambrian Longwangmiao Formation and Sinian Dengying Formation (Wei et al., 2015a; Zeng et al., 2023), and the structural map of the Sinian top in the study area is shown in Figure 1. The Gaoshiti–Moxi latent tectonic belt has experienced synsedimentation and denudation uplift from multi-cycle tectonic movement. It was controlled by the basement uplift of the middle Sichuan and Longmenshan mountains and represents a paleo-uplift with a certain inheritance (Du et al., 2014; Lai et al., 2023). During the Sinian period, the carbonate-striped platform was developed in the Sichuan Basin and its periphery, and the carbonate-slope-type platform was developed during the deposition period of the Longwangmiao Formation of Cambrian (Zou et al., 2014), forming complex fracture-cavity and pore-type carbonate reservoirs. The reservoir and percolation space of the Longwangmiao Formation are mainly fracture-pore/cave type, followed by pore type, which is well-matched with pore, cave, and fracture. The reservoir and percolation space of the Dengying Formation are fracture-pore/cave type and pore/cave type (Li et al., 2017; Yang et al., 2023). The average porosity of carbonate reservoirs in the second and fourth members of the Dengying Formation and the Longwangmiao Formation is 3.35%, 3.22%, and 4.28%, respectively, and the average permeability is 1.160 × 10⁻³ μm2, 0.593 × 10⁻³ μm2, and 0.966 × 10⁻³ μm2. The purpose of this study is to examine the deep carbonate rock fracture-cave reservoirs of the Sinian Dengying Formation and the Cambrian Longwangmiao Formation in the Gaoshiti–Moxi block of the Sichuan Basin.
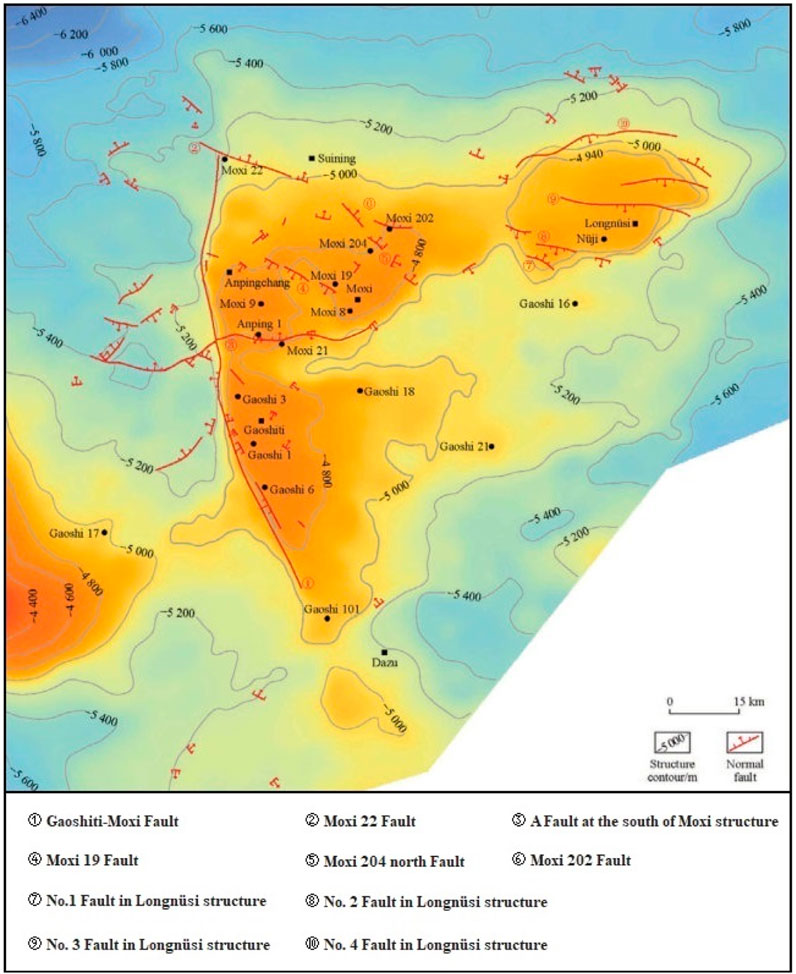
Figure 1. Geological map of the Sinian top in the Sichuan Basin (modified from Wei et al., 2015b).
3 Experiments and methods
3.1 Sample preprocessing and experiment preparation
Six carbonate samples are collected from the Longwangmiao Formation and Dengying Formation in the Gaoshiti–Moxi block, Sichuan Basin. All samples were tested by NMR, MICP, and micro-CT. After sample preprocessing, the samples were processed into cylinders with a length of 50 mm and a diameter of 25 mm. Subsequently, for NMR tests, these samples were processed into subsamples, and the length of the two cylinders is 30 mm and 18 mm. These cylinders with a length of 30 mm were used for MICP experiments, and the other tiny samples were prepared in cylinders with a length of 10 mm and a diameter of 3 mm for micro-CT experiments.
3.2 NMR measurements
The NMR technique is widely applied to the analysis of pore structures (Golsanami et al., 2019; Yan et al., 2019; Ouyang et al., 2023) and is especially useful for analyzing rock/fluid interactions (Ali et al., 2022; Isah et al., 2022; Wang et al., 2023), despite its limitations. The experiments were conducted at the China University of Petroleum (East China). First, six samples were dried for 48 h at 369.15 K. Next, the samples prepared were saturated with distilled water and centrifuged to achieve the state with different irreducible water. Simultaneously, the transverse relaxation time was measured using the MesoMR23-060H-1 nuclear magnetic instrument.
Regarding low-field NMR, there is a relationship, as expressed in Eq. 1.
where T2 is the transverse relaxation time; T2S, T2B, and T2D are the surface relaxation time, transverse relaxation time, bulk relaxation time, and diffusion relaxation time, respectively.
The bulk relaxation time is usually much larger than the transverse relaxation time, which can be ignored. Therefore, Eq. 1 is simplified to Eq. 2 as follows:
where ρ is the transversal surface relaxivity, μm/ms; V is the pore volume, μm3; and S is the pore surface area, μm2.
The correlation of the pore surface area and pore volume is expressed in Eq. 3.
where m is a constant, which is related to the pore’s shape; r is the pore radius. Thus, the correlation of the pore radius and transverse relaxation time is expressed in Eq. 4.
where n is a coefficient, which is related to ρ and m, μm/ms.
In addition, the conversion coefficient can be determined by comparing the cumulative probability curve of the pore radius in MICP experiments and that of the T2 spectrum in NMR tests when it is tangent, and finally, the purpose of characterizing the rock pore structure based on NMR technology can be realized (Dong et al., 2019).
3.3 MICP tests
The MICP method can measure the radius distribution of pores and throats (Okolo et al., 2015; Zhang et al., 2020; Yang et al., 2022), which was conducted at Shengli Oilfield using the Auto Pore 9500 automatic mercury injection instrument. First, the samples were washed to remove salt and oil, then dried for 48 h at 96°C, and stored in a vacuum. Then, mercury was injected into the pore systems at pressures ranging from 0 to 207 MPa, and relevant data were recorded. Finally, the pore radius can be obtained in Eq. 5 as follows:
where SHg is the mercury saturation; r is the pore radius; θ is the contact angle, °; σ is the interfacial tension, N/m; and Pc is the capillary pressure. Then, Eq. 6 can be obtained as follows:
where PDF represents the probability distribution function of the pore radius.
3.4 Micro-CT experiments
The micro-CT technique can perform non-destructive imaging, three-dimensional imaging, and so on (Mathews et al., 2017; Qi et al., 2023). The advancement in computational power and imaging analysis has led to the growth of digital rock analysis. In this investigation, all carbonate samples were scanned using the XTH high-resolution micro-CT imaging system. In the process of scanning, a series of X-ray photographs were uniformly recorded along the trajectory, with a resolution of 26.6 μm/voxel.
In micro-CT experiments, once the resolution is set, the micropores and ultra-micropores with a pore radius smaller than this value will not be covered. The representative elementary volume (REV) is an important parameter that needs to be determined in advance when using micro-CT for pore space analysis. During CT image processing, the REV is first extracted from the original gray-scale CT images; then, a median filter is applied, followed by combining with a threshold value to separate solid and pore space for interactive threshold segmentation. Then, smoothed pore space was obtained by using the closing algorithm. In the end, REV’s porosity was obtained. According to whether the pore space is connected, the pore space can be divided into isolated and connected pore spaces. The connected pore space refers to the connection between the pore bodies and other pore bodies through the throats. After separating the pore space, the maximal sphere algorithm was used to distinguish the pore and throat. Furthermore, the pore network model was extracted.
The specific Euler number and coordination number can characterize the topological features more clearly, which can help describe the connectivity of specific components. The maximal sphere algorithm is used to calculate the distribution of the coordination number. The specific Euler number was proposed by Vogel and Roth (2001), as expressed in Eq. 7.
where χ represents the conventional Euler number for a porous medium with volume V.
In addition, a two-point correlation function was applied to characterize the probability of selecting two voxels in the 3D pore space, and this parameter is defined in Eq. 8.
where I(x) is an indicator function, h is the magnitude of the vector, and x and x + h are two voxels; when x and x + h are in the void space, I(x + h)=1; conversely, I(x + h)=0, and I(x)I(x + h) represents the average of the multiplication of two indicator functions.
Assuming that the pores are an equivalent circle, the pore radius is calculated using Eq. 9 as follows:
where A is the pore surface area and r is the pore radius.
Indeed, many pores are not circular, and therefore, in order to obtain a more realistic result, the pore radius can be computed through the shape factor. Pore space can be obtained using the thresholding method. Then, the median filter is used for denoising, and the watershed algorithm is used to separate the connected pores. The pore and throat shape factors are the important parameters utilized for characterizing the morphology of the pore and throat. The shape factor of the pore can be calculated using Eq. 10 as follows:
where G is the shape factor, A is the area of the pore, and P is the perimeter of the pore. The shape factors of the equilateral circle, square, and triangle are 0.0796, 0.071, and 0.0481, respectively.
3.5 Fractal dimension calculation
For pores with fractal characteristics, the fragmentation and regularity of the pore system can be described by the fractal dimension (Han et al., 2023; Jiang et al., 2023). The relationship between pore radius and fractal dimension is expressed in Eq. 11 as follows (Li et al., 2017):
where r is the pore radius, Df is the fractal dimension, and N(r) is the number of pores with the pore radius greater than r. According to Eq. 11, the pore radius distribution function can be obtained, as expressed in Eq. 12.
Assuming that the pore volume and pore radius can be descripted in Eq. 13 as follows:
Thus, the cumulative pore volume of the pore with the radius greater than r can be calculated, as expressed in Eq. 14.
where a and b are constants related to the pores’ shape; rmax is the maximum pore radius. When r is equal to rmin, the entire pore volume can be obtained using Eq. 15 as follows:
Then, the pore volume accumulative frequency F(>r) can be calculated, as expressed in Eq. 16.
Since rmin ≪ rmax, Eq. 16 can be converted to Eq. 17.
Therefore, the pore radius is less than r, and the pore volume accumulation frequency is F(<r), as shown in Eq. 18.
In MICP experiments, when the pore radius is less than r, the pore volume accumulation frequency can be expressed as Eq. 19.
So, the following formula can be obtained:
Df can be determined by the slope of the log(1-SHg) and logPc in double-log plots. The fractal dimensions of pores with different radii were computed using Eq. 20.
where ϕ1, ϕ2, ϕ3, and ϕ4 are the porosity of the pores in descending order of radius, ϕ is the porosity of the entire pores, and Df1, Df2 Df3, Df4, and Df are the fractal dimensions of corresponding pores.
As for NMR tests, from Eqs 4 and 18, Eq. 22 can be obtained as follows:
Equation 22 is similar to Eq. 20, allowing for the calculation of the fractal dimension of NMR.
As for micro-CT experiments, the pores from this experiment cannot cover all pore types. Hence, the fractal dimensions of the images are calculated, which can be realized using commercial software Avizo (Mathews et al., 2011).
4 Results and discussion
4.1 Pore space features and pore radius distribution
4.1.1 MICP results
The MICP curves of the six carbonate samples showed that mercury began to be injected into the pores when the pressure reached 0.01 MPa. When the pressure reaches 1 MPa, the mercury content in samples S2 and S4 increases, which means that there are many large pores in these samples (Figure 2A). The pore radius distribution of each sample can be calculated using Eq. 6. Figure 2B shows that the pore radius distribution characteristics of S1, S2, S4, and S6 are similar, whose peak pore volume fraction is all greater than 0.04, while the peak pore volume fraction of S3 is approximately 0.12 and that of S5 is approximately 0.16. The main pore radius of S2, S4, and S6 is 0.008 ∼ 0.3, 0.4 ∼ 1.0, and 50.0 ∼ 200 μm, respectively. In addition, the median saturation radius of each sample is 0.15, 0.03, 0.51, 0.08, 1.52, and 0.23 μm, and the maximum throat radius is 3.81, 0.89, 3.81, 0.53, 21.32, and 1.52 μm.
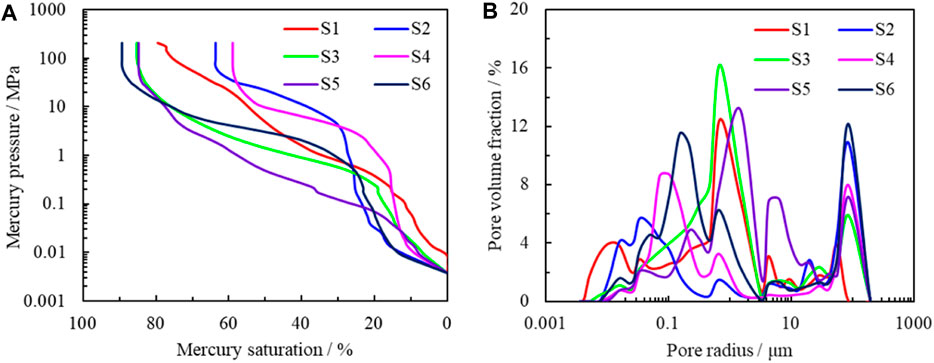
Figure 2. Test results of MICP. (A) MICP curves, and (B) pore radius distribution curves.
The pores can be divided into ultra-micropores, micropores, mesopores, and macropores, and the radius ranges are less than 0.1, 0.1 ∼ 1, and 1 ∼ 10 μm and greater than 10 μm, respectively. The porosity of these groups was calculated and shown in Table 1, which indicates that the proportion of macropores in S2 and S5 is higher than that of S1, S3, S4, and S6, which are all greater than 30%. The proportion of mesopores in S1, S3, and S5 is all greater than 10%, indicating that there are more mesopores in the pores. In addition, there are many ultra-micropores in S1, S2, and S4, which account for up to 25%, effectively connecting the pores and improving permeability.
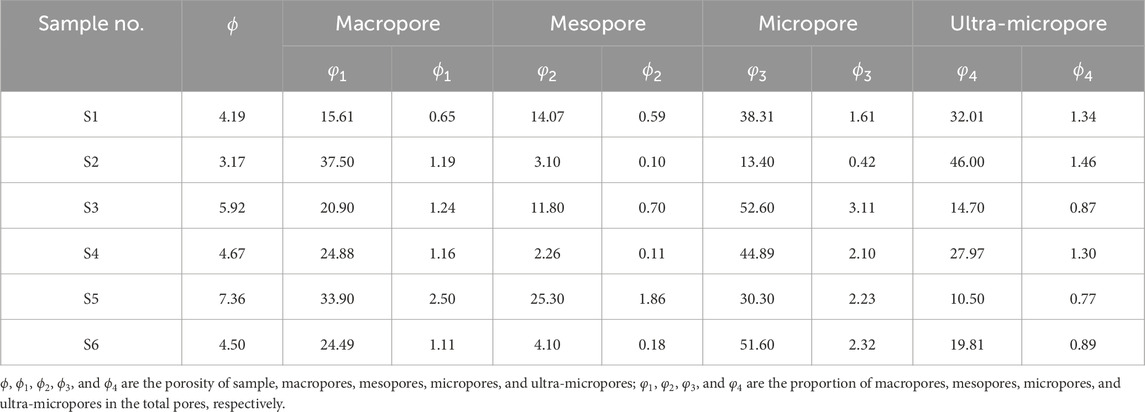
Table 1. Porosity of different pores in MICP tests.
4.1.2 NMR results
The results of NMR experiments are shown in Figure 3. It can be seen that S2, S4, and S6 are bimodal, and S3 is unimodal, and S1 and S5 are trimodal. The variation in porosity increment with relaxation time is similar for S1 and S5 and S2 and S6.
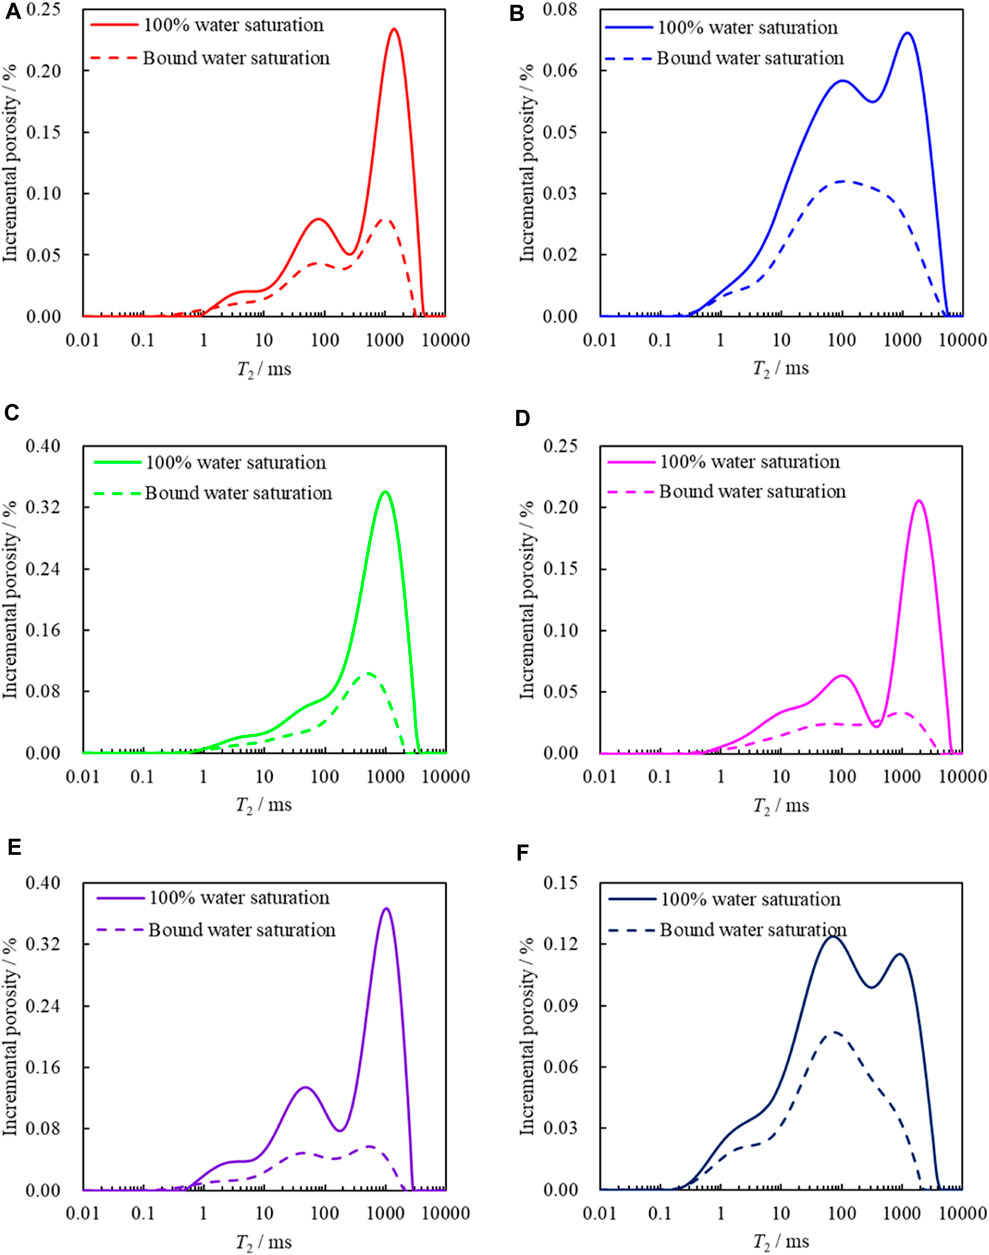
Figure 3. NMR relaxation time of samples with different states. (A–F) Porosity increment in samples S1 to S6.
One of the difficulties in the NMR characterization of the pore structure is the determination of the coefficient. The coefficient values of each sample are determined, as shown in Figure 4. The results are shown in Table 2, indicating that there is a large gap in the cumulative probability curve of the pore radius for NMR and MICP, which represents the heterogeneity characteristics, among which S2 and S4 have the strongest heterogeneity.
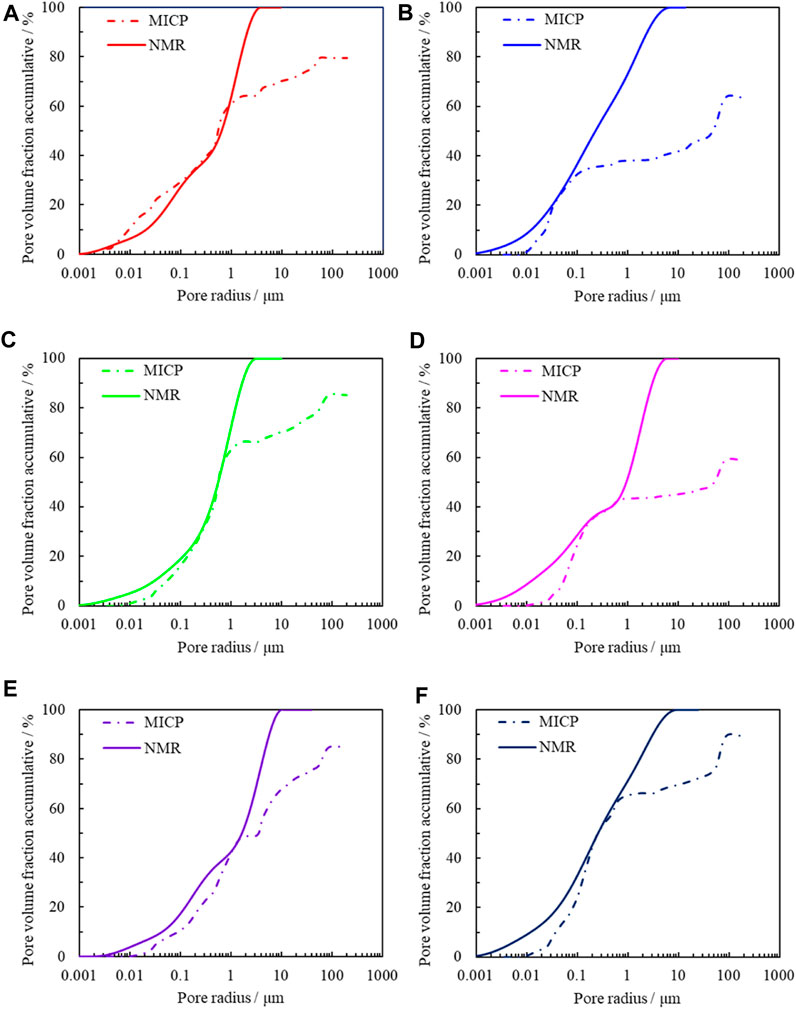
Figure 4. Cumulative probability curves of T2 relaxation time. (A–F) Distribution curves of pore volume fraction accumulative for S1 to S6.

Table 2. Coefficient values for the six carbonate samples.
The pore radius distribution of each sample can be obtained through Eq. 4, as shown in Figure 5, demonstrating that the curve of S3 is unimodal, the curves of S2, S4, and S6 are bimodal, and those of S1 and S5 are trimodal. The main pore radius of S2, S4, and S6 ranges from 7 μm to 50 μm, and the secondary peak ranges from 0.3 μm to 2 μm. Some pores with a pore radius up to 100 μm appeared in S5, which may be the cause of small fractures. Moreover, the pore radius corresponding to the peaks of S1∼S6 is 17.21, 17.23, 29.45, 20.13, and 2.06 μm. In addition, the proportions of pores with different radii are shown in Table 3.
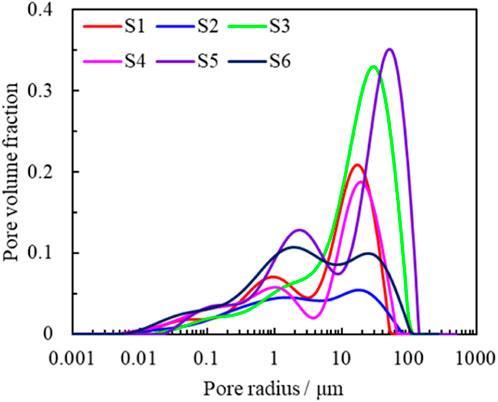
Figure 5. Pore radius distribution of all samples from NMR tests.
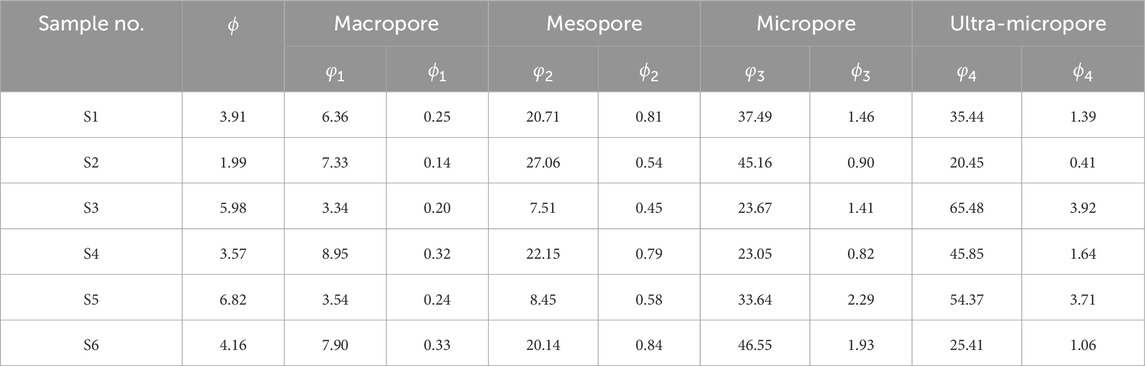
Table 3. Porosity of different types of pores obtained from NMR tests.
The parameters in this table are consistent with those observed in Table 1.
4.1.3 Micro-CT results
In this investigation, based on the variation of sub-volume porosity with its volume, as shown in Figure 6, a sample (500 × 500 × 500 voxels) is selected as the representative basic volume size. Taking samples S4, S5, and S6 as examples, the separated solids and pore space are as shown in Figure 7A, Figures 7B, D, Figures 7E, G, and Figure 7H, which indicates that the connectivity between S4 and S6 is poor. The reason is that ultra-micropores and micropores may connect mesopores and macropores, respectively, and micropores are not tested by micro-CT. After separating the pore space, the throats and pores were extracted, and then the pore network models were extracted, as shown in Figures 7C, F and Figure 7I.
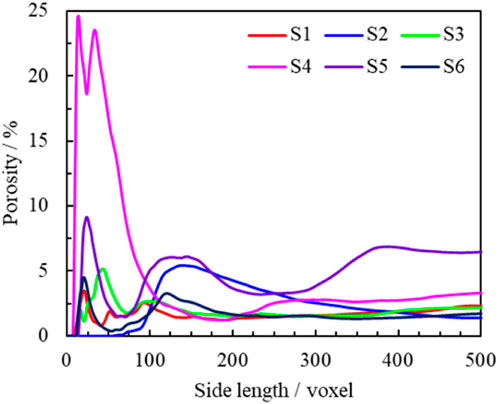
Figure 6. Petrophysical porosity of sub-volume varies with the volume.
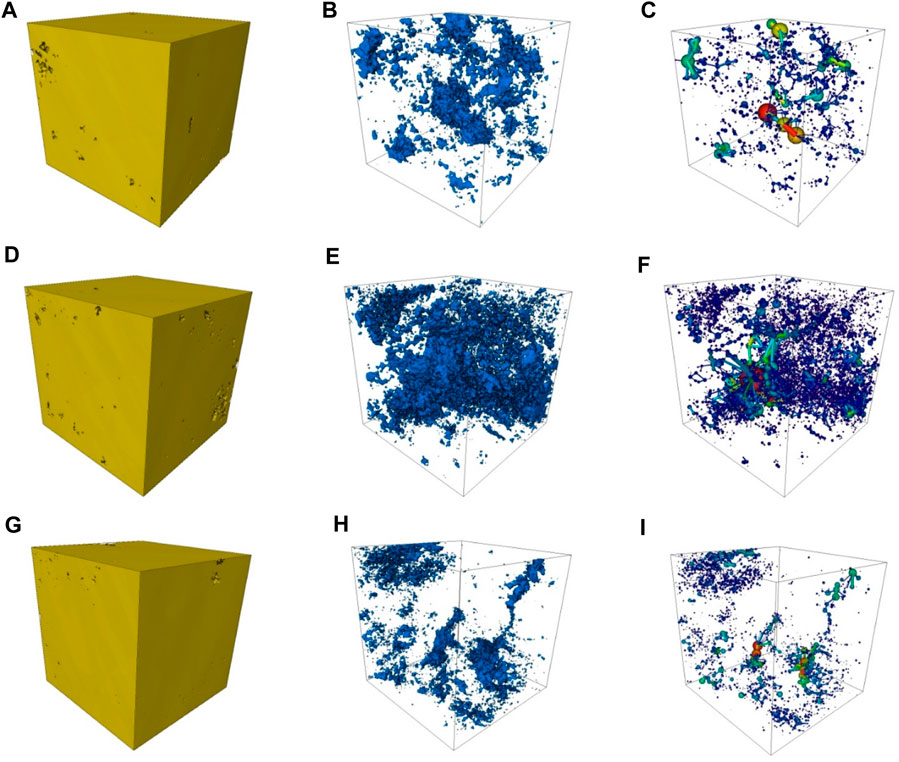
Figure 7. Digital rock models and structural analysis of S4, S5, and S6. (A, D, and, G) solid space; (B, E, and, H) pore space; and (C, F, and, I) pore network model.
The maximal ball algorithm was used to calculate the coordination number distribution, and the results are shown in Figure 8A. It can be inferred from the coordination distribution that most of the pores are connected by the number of throats, ranging from 1 to 6. The maximum coordination number is 24, confirming the presence of many small throats around the pores. The specific Euler number curves are shown in Figure 8B, showing that pore connectivity changes with the number of layers. In addition, the two-point correlation function was calculated, as shown in Figure 8C, which shows that the correlation between the two voxels decreases as the distance between the two voxels increases. In particular, when the distance between the two voxels is greater than 200 μm, the two-point correlation function stabilizes at 0.0006.
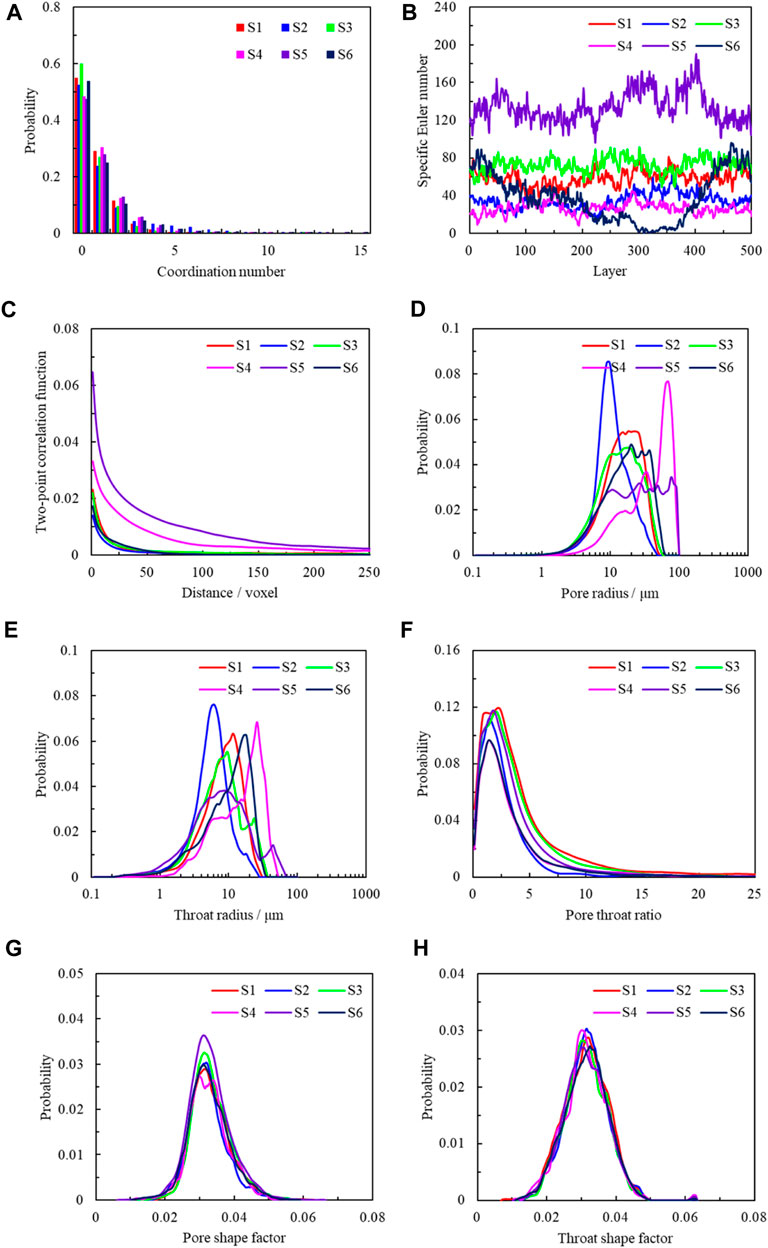
Figure 8. Geometric and topological characteristics of pores via micro-CT. (A) Coordination number, (B) specific Euler number, (C) two-point correlation function, (D) pore radius, (E) throat radius, (F) aspect ratio, (G) pore shape factor, and (H) throat shape factor.
Figure 8D ∼ Figure 8H show that the pore radius mostly ranges from 4 to 30 μm, and approximately 60.34% of throat radius distribution was between 3 and 6 μm. In addition, most of the pore shape factor and throat shape factor are less than 0.04, indicating that the shape of the throats and pores on the sections is non-circular. The relative ratio of the aspect ratio in the range of 1–5 is 75.36%, and the maximum aspect ratio is 53.98.
4.1.4 Comparison of MICP, NMR, and micro-CT results
The comparison between the results of MICP, NMR, and micro-CT and the pore radius distribution is shown in Figure 9, which shows that the pore radius characterized by MICP and NMR is larger than that characterized by micro-CT, as the experimental sample size of MICP and NMR (25.0 mm) is larger than that of micro-CT (approximately 2.0 mm). If there is a larger micro-CT, a more accurate pore radius distribution can be obtained. In addition, more pore and throat features can be obtained through micro-CT scanning images. Additionally, NMR can obtain more information about small pores than MICP, as water can enter the small pores more easily than mercury for water-wet rocks. The similarity among those different methods is that they can effectively describe the macropores.
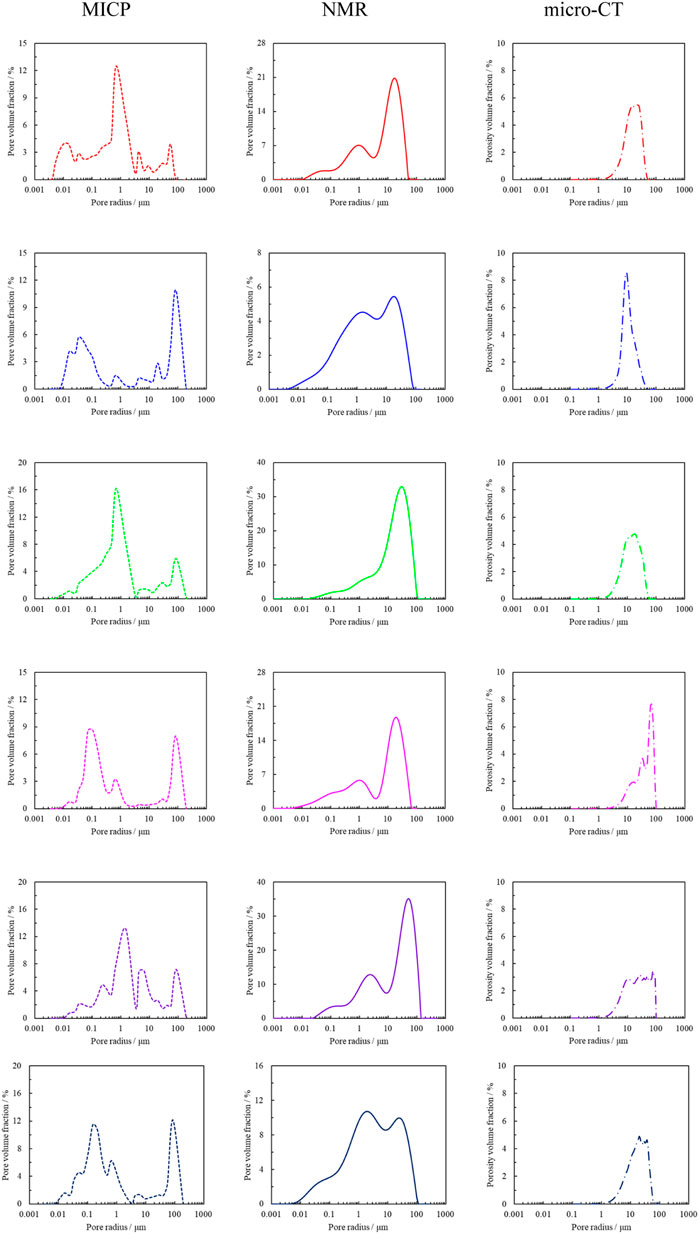
Figure 9. Comparison of the pore radius distribution in different experiments.
For the same carbonate sample, the porosity measured by NMR is greater than that tested through MICP. In addition, the pore radius tested through NMR is larger than that measured by MICP. As a result, the pore volume and throat radius, tested via MICP, are interconnected through the throats, leading to a relationship between SHg and Pc. In MICP tests, the volume of mercury injected is the total volume, including the pores and throats. NMR is a good technique for measuring pore radius distribution. Nevertheless, the coefficient between the pore or throat radius and the transverse relaxation time varies from sample to sample, which makes it a lot of trouble to figure out the coefficients for each sample. Therefore, a good calculation method must be found. Compared with the previous three methods, micro-CT can obtain more pore structure parameters and simulate rock physical properties, such as multi-phase or single-phase flow.
4.2 Fractal dimension analysis
4.2.1 Fractal dimension from MICP
The fractal dimension of the pore system can be calculated using Eq. 21. The detailed parameters of the various fractal dimensions are listed in Table 4 and presented in Figure 10, which show that for the same carbonate sample, Df1, Df2 Df3, and Df4 gradually decrease, indicating that the macropores are more irregular, owing to Df1 being the largest among the four fractal dimensions. In general, the surface of pore space is rough, and the fractal dimensions are greater than 2.6.

Figure 10. (A–F) Fractal dimensions of the six carbonate samples obtained from MICP experiments.
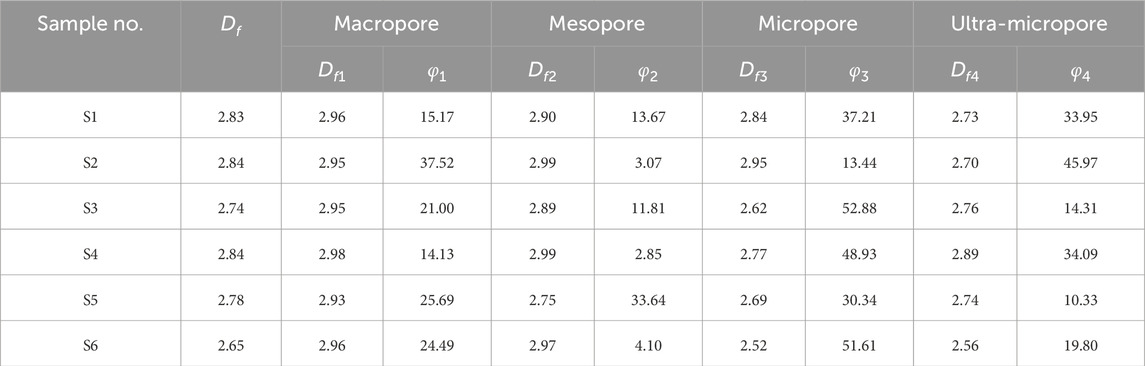
Table 4. Fractal dimension values of the six carbonate samples in MICP tests.
4.2.2 Fractal dimension from NMR
The fractal dimensions of different types of pores in carbonate samples are shown in Figure 11A, and the values are shown in Table 5, in which the larger values are the fractal dimensions of macropores. However, the fractal dimensions of S2 and S6 are similar to those of the mesopores. In addition, the fractal dimension of the overall pore system in the NMR experiments of the same carbonate sample is smaller than that of MICP, which may be because NMR can capture more ultra-micropores and smooth the surface of the pore system.
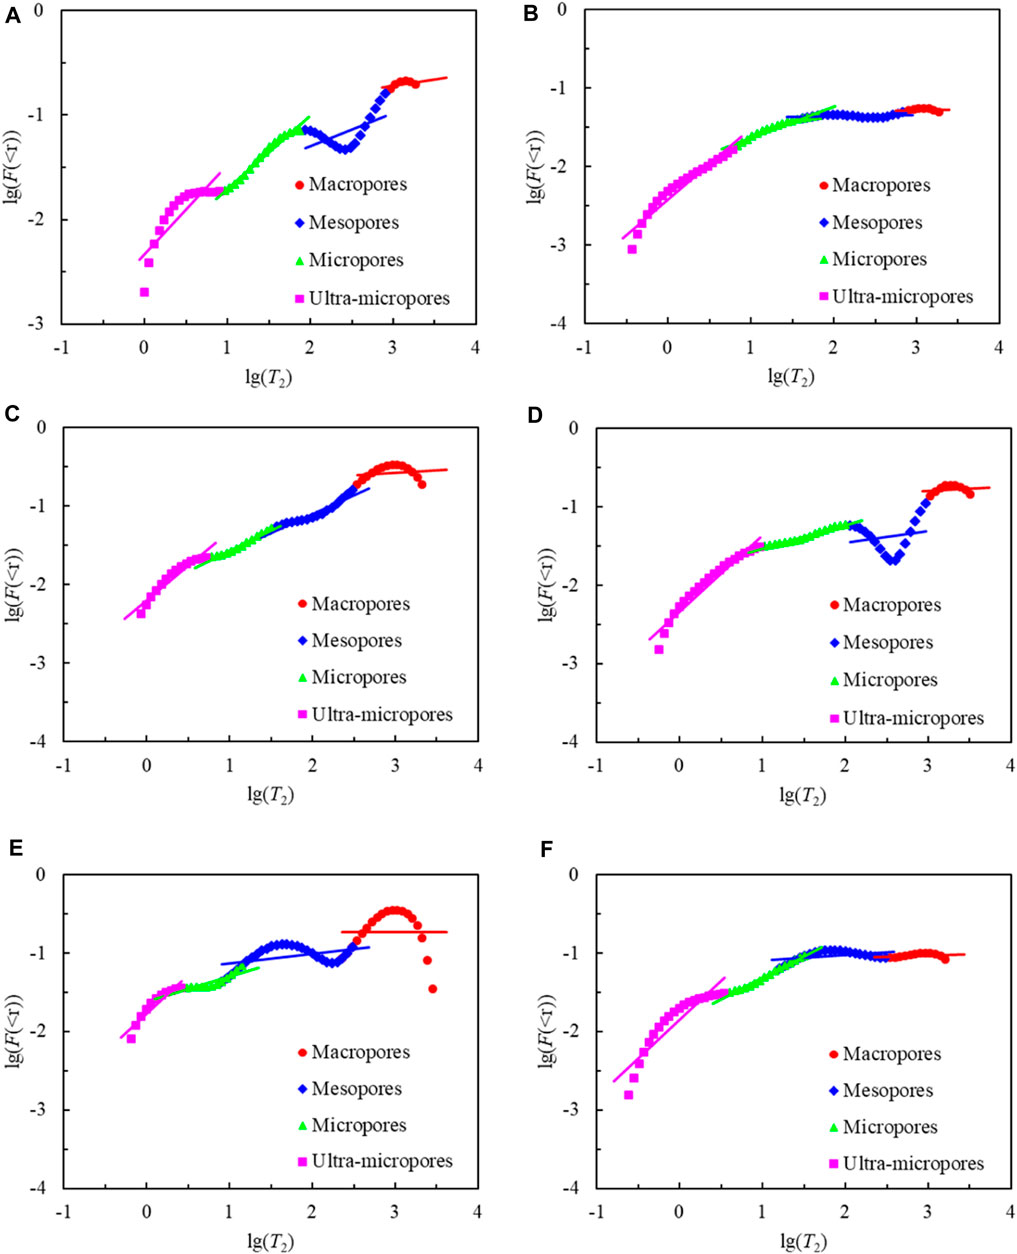
Figure 11. (A–F) Fractal dimensions of all carbonate samples obtained from NMR experiments.
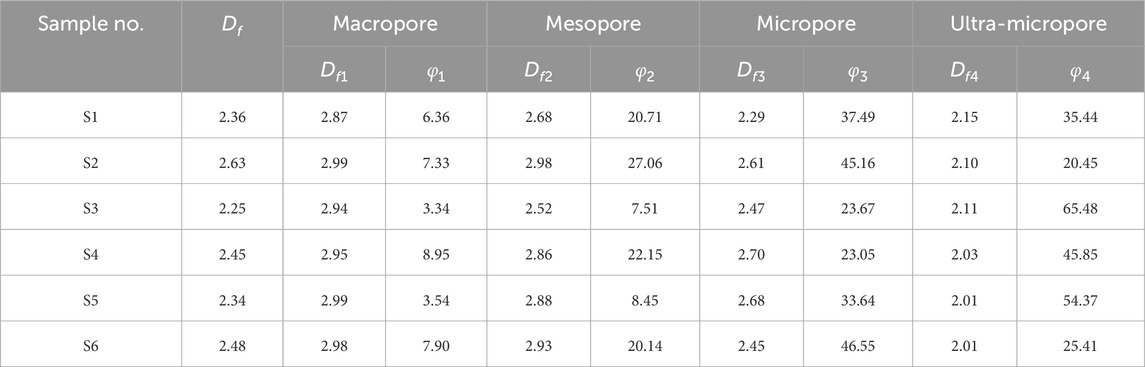
Table 5. Fractal dimension parameters of all samples obtained from NMR experiments.
4.2.3 Fractal dimension from micro-CT
The fractal dimensions of 3D pore space are 2.08, 2.00, 2.10, 2.05, 2.30, and 2.04, indicating that the surface of the pore space is not smooth. As shown in Figure 12A, the fractal dimensions of 2D images are all greater than 0.8 and the fractal dimensions of S5 are all greater than 1.2, which means that the pore boundaries demonstrate stronger regularity than other samples. In addition, the heterogeneity of the pore space can be expressed by calculating the porosity of each layer (Figure 12B). The pore spaces of S4, S5, and S6 are heterogeneous, while those of S1, S2, and S3 are relatively homogeneous, and the porosity of each layer changes within a certain small range.
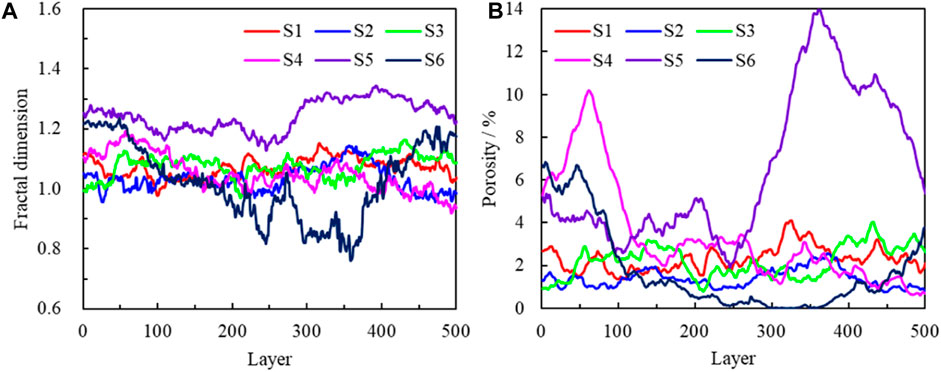
Figure 12. Change in vital parameters in each layer via micro-CT images. (A) Fractal dimension and (B) porosity varies with layers.
In summary, by comparing the fractal dimensions acquired by NMR and MICP techniques, it can be found that the fractal dimension calculated by MICP is larger than that obtained by NMR, and the reason may be that NMR can cover all types of pores, including ineffective ones containing formation fluids. However, MICP has a very limited ability to detect ineffective pores. Moreover, for the measurement results of micro-CT, the fractal dimensions and the pores of each layer showed the same change trend in 2D images, and the fractal dimensions are the smallest among the three techniques, which is essentially due to the limitation of scanning resolution and affects the acquisition of complete information of macropores and ultra-micropores at low-scanning resolution. As for the carbonate samples used in this experiment, they exhibit fractal characteristics from the nanometer scale to the millimeter scale. In addition, in the case of carbonate reservoirs that develop karst caves, there should also be fractal characteristics on the meter scale.
4.3 Transport properties, formation factor, and fractal dimension
The permeability and formation factors of six carbonate samples were measured by laboratory petrophysical experiments, representing the transport properties of fluids and electrical current. Figure 13 illustrates the relationship between transport properties and fractal dimensions and compares the relationship between fractal dimensions calculated by three different methods with permeability and formation factors. There are substantial discrepancies between the different methods used for calculating fractal dimensions, particularly the results of micro-CT, which exhibits an opposite trend to the other two experimental results. Generally, under the same measurement method, the larger the fractal dimension, the more complex the pore structure, hindering the transport in the pore. Therefore, the fractal dimensions calculated by MICP and NMR yield results that are consistent with the general understanding of fractal theory. The larger the fractal dimension, the lower the permeability, the higher the formation factors, the lower the fluid flow capacity, and the higher the rock resistivity. Moreover, compared with MICP, NMR can better reflect the relationship between transport properties and fractal dimensions, demonstrating a stronger correlation, which further highlights the ability of NMR to more comprehensively characterize the pore structure of rocks.
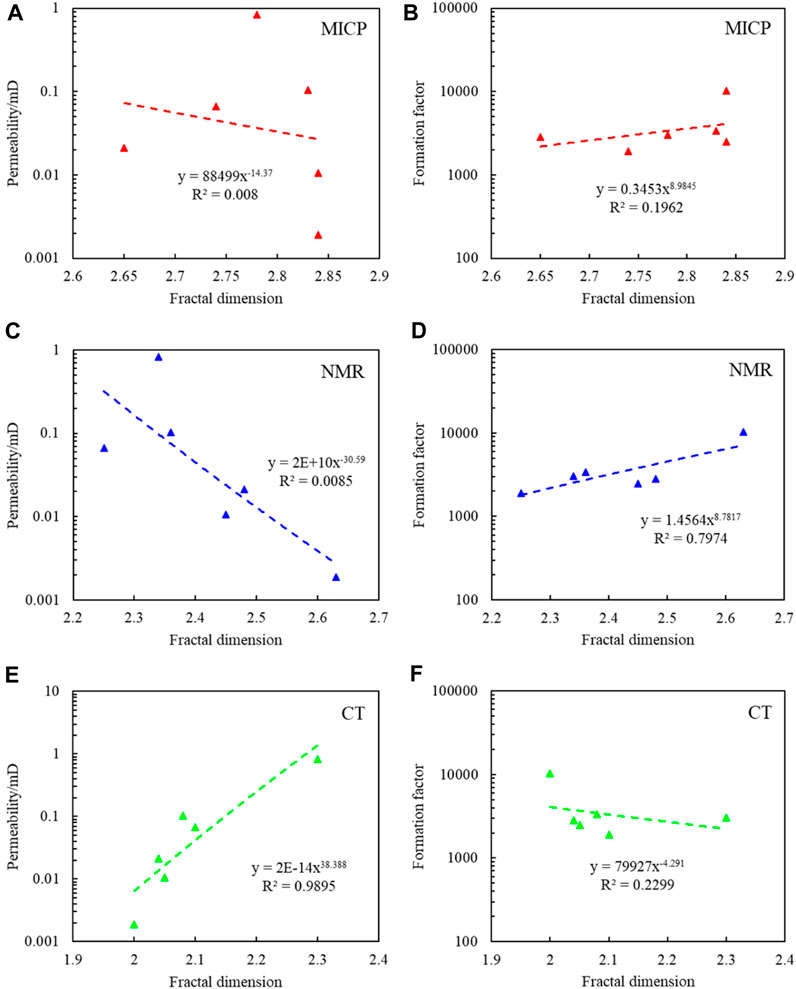
Figure 13. (A–F) Relationship between permeability and formation factors with the fractal dimension.
Due to the limited scanning resolution, micro-CT measurements cannot capture all types of pores. Consequently, the calculated fractal dimension can only represent the characteristics of large pores. In other words, in this context, the pore types exhibit relative homogeneity, and with the increase in porosity, the pore structure becomes progressively more complex, leading to an increase in fractal dimension. Consequently, the fractal dimension calculated using micro-CT yields an incomplete representation of the pore structure, rendering the relationship between transport capacity and fractal dimension unreliable. In summary, we prefer utilizing the NMR fractal dimension to represent the transport properties of rocks, in which the transport capacity exhibits a negative dimension correlated with the fractal dimension.
5 Conclusion
The topological, fractal, and geometric characteristics of the pore structure of carbonate samples from the Longwangmiao Formation and Dengying Formation of the Gaoshiti–Moxi block, Sichuan Basin, were analyzed using micro-CT, NMR, and MICP experiments, respectively. According to the pore radius distribution tested via different techniques, their disadvantages and advantages are summarized. NMR and MICP techniques can describe more pores than micro-CT. However, due to the presence of pore shielding in MICP tests, the pore radius obtained by MICP is smaller than that obtained by micro-CT and NMR. Furthermore, the most effective method for characterizing the pore structure is NMR technology. The hardest part is that the coefficient between the pore radius and T2 relaxation time is difficult to calculate. Therefore, a better calculation method must be found. In addition, micro-CT is an irreplaceable technique for obtaining a large number of topological and geometric features, and multi-phase or single-phase flow simulations can be conducted via digital rock models. However, for carbonates, micro-CT is not sufficient to describe the complete pore space because macropores cannot be fully represented and sub-resolution micropores cannot be described. Those macropores and micropores have a very important effect on their seepage properties. Therefore, multi-scale digital rock modeling involving small and large pores is essential for complex rocks, which is of great significance for the analysis of pore systems and the simulation of rock physical properties. Moreover, the fractal dimension was calculated through different techniques, and the values of all types of pores, from macropores to ultra-micropores, can be analyzed using NMR and MICP techniques. Compared with ultra-micropores and micropores, macropores have irregularity and heterogeneity. The fractal dimension of samples from NMR is smaller than that of MICP. In addition, micro-CT images can be used to acquire the fractal dimensions of the 3D and 2D pore spaces. Nevertheless, due to the low resolution of this method, the fractal dimension of micropores and ultra-micropores cannot be acquired, which can prove that the fractal dimension in 2D micro-CT images changes with the variation in the pore space area. Therefore, the fractal theory is an efficient means for pore type classification and reservoir quality evaluation.
Data availability statement
The original contributions presented in the study are included in the article/Supplementary Materials; further inquiries can be directed to the corresponding authors.
Author contributions
HD: funding acquisition, investigation, methodology, and writing–original draft. BL: writing–review and editing. CD: writing–review and editing. SX: data curation, software, visualization, and writing–original draft. FW: data curation and writing–original draft. PC: writing–review and editing.
Funding
The author(s) declare that financial support was received for the research, authorship, and/or publication of this article. This work was supported by the Youth Program of National Natural Science Foundation of China (grant no. 42204105), the China Postdoctoral Science Foundation (grant no. 2021M700525), the High-level Innovation and Entrepreneurship Talent Program of Qinchuangyuan, China (grant no. QCYRCXM-2022-24), the Fundamental Research Funds for the Central Universities, CHD (grant no. 300102263103), and the Young Talent Fund of Association for Science and Technology in Shaanxi, China (grant no. 20230703).
Conflict of interest
Author BL was employed by Changqing Oilfield Company. Authors SX and FW were employed by Changqing Oilfield Company.
The remaining authors declare that the research was conducted in the absence of any commercial or financial relationships that could be construed as a potential conflict of interest.
Publisher’s note
All claims expressed in this article are solely those of the authors and do not necessarily represent those of their affiliated organizations, or those of the publisher, the editors, and the reviewers. Any product that may be evaluated in this article, or claim that may be made by its manufacturer, is not guaranteed or endorsed by the publisher.
References
Abro, W. A., Shar, A. M., Lee, K. S., and Narejo, A. A. (2019). An integrated analysis of mineralogical and microstructural characteristics and petrophysical properties of carbonate rocks in the lower Indus Basin, Pakistan. Open Geosci. 11 (1), 1151–1167. doi:10.1515/geo-2019-0088
Ali, M., Al-Yaseri, A., Awan, F. U. R., Arif, M., Keshavarz, A., and Iglauer, S. (2022). Effect of water-soluble organic acids on wettability of sandstone formations using streaming zeta potential and NMR techniques: implications for CO2 geo-sequestration. Fuel 329, 125449. doi:10.1016/j.fuel.2022.125449
Arif, M., Abu-Khamsin, S. A., Zhang, Y., and Iglauer, S. (2020). Experimental investigation of carbonate wettability as a function of mineralogical and thermo-physical conditions. Fuel 264, 116846. doi:10.1016/j.fuel.2019.116846
Chandra, V., Petrovic, A., Khanna, P., Ramdani, A. I., Yalcin, B., Vahrenkamp, V., et al. (2021). Impact of depositional and diagenetic features on petrophysical and rock mechanical properties in Arab-D reservoir equivalent upper Jubaila Formation, Saudi Arabia. Mar. Petroleum Geol. 129, 105076. doi:10.1016/j.marpetgeo.2021.105076
Daigle, H., Hayman, N. W., Jiang, H., Tian, X., and Jiang, C. (2017). Multiscale pore networks and their effect on deformation and transport property alteration associated with hydraulic fracturing. Energy Procedia 125, 71–79. doi:10.1016/j.egypro.2017.08.067
Dong, H., Sun, J., Li, Y., Cui, L., Yan, W., and Zhang, J. (2017). Verification of the carbonate double-porosity conductivity model based on digital cores. Interpretation 5 (2), 173–183. doi:10.1190/INT-2016-0071.1
Dong, H., Sun, J., Zhu, J., Lin, Z., Cui, L., Yan, W., et al. (2019). Quantitative characterization and characteristic analysis of pore structure of shale-gas reservoir in the Sichuan Basin, China. Interpretation-A J. Subsurf. Charact. 7 (4), 23–32. doi:10.1190/INT-2018-0169.1
Dong, H., Zeng, X., Zhou, D., Zhu, J., Golsanami, N., Sun, J., et al. (2023). Insights into the multiscale conductivity mechanism of marine shales from Wufeng-Longmaxi formation in the Southern Sichuan Basin of China. J. Energy Eng. 149 (3), 04023008. doi:10.1061/JLEED9.EYENG-4667
Du, J., Zou, C., Xu, C., He, H., Shen, P., Yang, Y., et al. (2014). Theoretical and technical innovations in strategic discovery of a giant gas field in Cambrian Longwangmiao Formation of central Sichuan paleo-uplift, Sichuan Basin. Petroleum Explor. Dev. 41 (3), 294–305. doi:10.1016/S1876-3804(14)60035-5
Fagbemi, S., Tahmasebi, P., and Piri, M. (2018). Interaction between fluid and porous media with complex geometries: a direct pore-scale study. Water Resour. Res. 54 (9), 6336–6356. doi:10.1029/2017WR022242
Gao, Z., Yang, X., Hu, C., Wei, L., Jiang, Z., Yang, S., et al. (2019). Characterizing the pore structure of low permeability eocene liushagang formation reservoir rocks from beibuwan basin in northern south China sea. Mar. Petroleum Geol. 99, 107–121. doi:10.1016/j.marpetgeo.2018.10.005
Golsanami, N., Sun, J., Liu, Y., Yan, W., Chen, L., Jiang, L., et al. (2019). Distinguishing fractures from matrix pores based on the practical application of rock physics inversion and NMR data: a case study from an unconventional coal reservoir in China. J. Nat. Gas Sci. Eng. 65, 145–167. doi:10.1016/j.jngse.2019.03.006
Han, X., Shan, S., Xu, G., Han, Y., Guo, Y., Yang, B., et al. (2023). Single- and multifractal dimension variation of the pore-fracture system in tight sandstone by using high-pressure mercury intrusive tests and its influence on porosity-permeability variation. Energy fuels. 37 (16), 11969–11981. doi:10.1021/acs.energyfuels.3c01622
Hosseini, M., Arif, M., Keshavarz, A., and Iglauer, S. (2021). Neutron scattering: a subsurface application review. Earth-Science Rev. 221, 103755. doi:10.1016/j.earscirev.2021.103755
Isah, A., Arif, M., Hassan, A., Mahmoud, M., and Iglauer, S. (2022). Fluid-rock interactions and its implications on EOR: critical analysis, experimental techniques and knowledge gaps. Energy Rep. 8, 6355–6395. doi:10.1016/j.egyr.2022.04.071
Jiang, W., Zhou, Y., Wu, C., and Du, M. (2023). Fractal characteristics and theirs influence on methane adsorption in high-rank coals with NMR. Front. Earth Sci. 10, 1047557. doi:10.3389/feart.2022.1047557
Kibria, M. G., Hu, Q., Liu, H., Zhang, Y., and Kang, J. (2018). Pore structure, wettability, and spontaneous imbibition of woodford shale, permian basin, west Texas. Mar. Petroleum Geol. 91, 735–748. doi:10.1016/j.marpetgeo.2018.02.001
Lai, Q., Qi, L., Chen, S., Ma, S., Zhou, Y., Fang, P., et al. (2023). Resercoir space characteristics and pore structure of Jurassic Lianggaoshan Formation lacustrine shale reservoir in Sichuan Basin, China: insights into controlling factors. Front. Earth Sci. 11, 1133413. doi:10.3389/feart.2023.1133413
Li, C., Li, X., Gao, S., Liu, H., You, S., Fang, F., et al. (2017). Experiment on gas-water two-phase seepage and inflow performance curves of gas wells in carbonate reservoirs: a case study of Longwangmiao Formation and Dengying Formation in Gaoshiti-Moxi block, Sichuan Basin, SW China. Petroleum Explor. Dev. 44 (6), 983–992. doi:10.1016/S1876-3804(17)30110-6
Li, C., Pan, J., Wang, H., Li, H., Feng, C., and Zhou, J. (2022). Study on seismic petrophysics and dispersion characteristics of carbonate rocks with deep ultra-deep complex pore structure in Tarim Basin. Appl. Geophys. 19 (2), 1–15. doi:10.1007/s11770-022-0974-y
Mathews, J. P., Campbell, Q. P., Xu, H., and Halleck, P. (2017). A review of the application of X-ray computed tomography to the study of coal. Fuel 209, 10–24. doi:10.1016/j.fuel.2017.07.079
Mathews, J. P., Pone, J. D. N., Mitchell, G. D., and Halleck, P. (2011). High-resolution X-ray computed tomography observations of the thermal drying of lump-sized subbituminous coal. Fuel Process. Technol. 92 (1), 58–64. doi:10.1016/j.fuproc.2010.08.020
Norbisrath, J. H., Eberli, G. P., Laurich, B., Desbois, G., Weger, R. J., and Urai, J. L. (2015). Electrical and fluid flow properties of carbonate microporosity types from multiscale digital image analysis and mercury injection. AAPG Bull. 99 (11), 2077–2098. doi:10.1306/07061514205
Okolo, G. N., Everson, R. C., Neomagus, H. W. J. P., Roberts, M. J., and Sakurovs, R. (2015). Comparing the porosity and surface areas of coal as measured by gas adsorption, mercury intrusion and SAXS techniques. Fuel 141, 293–304. doi:10.1016/j.fuel.2014.10.046
Otiede, D., and Wu, K. (2011). The effect of image resolution on the geometry and topological characteristics of 3-D reconstructed images of reservoir rock samples. Int. J. Eng. Res. Afr. 6, 37–44. doi:10.4028/www.scientific.net/JERA.6.37
Ouyang, S., Lu, X., Zhang, Y., Chen, L., Qu, Y., and Sun, W. (2023). Impacts of the pore-throat structure on fluid mobility in tight sandstone: insight from an improved method based on rate-controlled porosimetry and nuclear magnetic resonance. Energy & Fuels 37 (1), 273–290. doi:10.1021/acs.energyfuels.2c03285
Qi, A., Huang, H., Li, K., Li, J., and Zhang, F. (2023). Study on pressure sensitive pore structure of the hole-type carbonate based on situ CT. Chin. J. Undergr. Space Eng. 19 (1), 173–182.
Radlinski, A. P., and Mastalerz, M. (2017). Neutron scattering study of vitrinite: insights into sub-micrometer inclusions in North American Carboniferous coals of bituminous rank. Int. J. Coal Geol. 186, 145–154. doi:10.1016/j.coal.2017.10.012
Romero, E., and Simms, P. H. (2008). Microstructure investigation in unsaturated soils: a review with special attention to contribution of mercury intrusion porosimetry and environmental scanning electron microscopy. Geotech. Geol. Eng. 26 (6), 705–727. doi:10.1007/s10706-008-9204-5
Sarkar, P., Kumar, A., Singh, K. H., Ghosh, R., and Singh, T. N. (2018). Pore system, microstructure and porosity characterization of Gondwana shale of Eastern India using laboratory experiment and watershed image segmentation algorithm. Mar. Petroleum Geol. 94, 246–260. doi:10.1016/j.marpetgeo.2018.04.006
Tahmasebi, P. (2017). HYPPS: a hybrid geostatistical modeling algorithm for subsurface modeling. Water Resour. Res. 53 (7), 5980–5997. doi:10.1002/2017WR021078
Tahmasebi, P., and Kamrava, S. (2018). Rapid multiscale modeling of flow in porous media. Phys. Rev. E 98 (5), 052901. doi:10.1103/PhysRevE.98.052901
Van Geet, M., Swennen, R., and David, P. (2001). Quantitative coal characterisation by means of microfocus X-ray computer tomography, colour image analysis and back-scattered scanning electron microscopy. Int. J. Coal Geol. 46 (1), 11–25. doi:10.1016/s0166-5162(01)00006-4
Vogel, H. J., and Roth, K. (2001). Quantitative morphology and network representation of soil pore structure. Adv. Water Resour. 24 (3), 233–242. doi:10.1016/S0309-1708(00)00055-5
Wang, N., Du, Y., Fu, C., Ma, X., Zhang, X., Wang, J., et al. (2023). Experimental study on spontaneous imbibition of coal samples of different ranks based on the NMR relaxation spectrum. ACS Omega 8 (37), 33526–33542. doi:10.1021/acsomega.3c03534
Wei, G., Du, J., Xu, C., Zou, C., Yang, W., Shen, P., et al. (2015a). Characteristics and accumulation modes of large gas reservoirs in Sinian-Cambrian of Gaoshiti-Moxi region, Sichuan Basin. Acta Pet. Sin. 36 (1), 1–12. doi:10.7623/syxb201501001
Wei, G., Yang, W., Du, J., Xu, C., Zou, C., Xie, W., et al. (2015b). Tectonic features of Gaoshiti-Moxi paleo-uplift and its controls on the formation of a giant gas field, Sichuan Basin, SW China. Petroleum Explor. Dev. 42 (3), 283–292. doi:10.1016/S1876-3804(15)30018-5
Yan, W., Sun, J., Golsanami, N., Li, M., Cui, L., Dong, H., et al. (2019). Evaluation of wettabilities and pores in tight oil reservoirs by a new experimental design. Fuel 252, 272–280. doi:10.1016/j.fuel.2019.04.130
Yang, J., Zhang, J., Ji, Y., Lv, W., Wu, H., He, Z., et al. (2022). Pore structure characteristics and controlling factors of a tight sandstone reservoir in the paleogene shahejie formation, nanpu sag, bohai bay basin, China. ACS Omega 7 (2), 1740–1756. doi:10.1021/acsomega.1c04573
Yang, S., Yang, H., Peng, X., Lan, X., Yang, Y., Zhao, Y., et al. (2023). Research of influencing factors on permeability for carbonate rocks based on LBM simulation: a case study of low-permeability gas reservoir of Sinian Dengying Formation in Sichuan Basin. Front. Earth Sci. 11, 1091431. doi:10.3389/feart.2023.1091431
Yao, Y., Liu, D., Che, Y., Tang, D., Tang, S., and Huang, W. (2010). Petrophysical characterization of coals by low-field nuclear magnetic resonance (NMR). Fuel 89 (7), 1371–1380. doi:10.1016/j.fuel.2009.11.005
Yu, H., Wang, Z., Wen, F., Rezaee, R., Lebedev, M., Li, X., et al. (2020). Reservoir and lithofacies shale classification based on NMR logging. Petroleum Res. 5 (3), 202–209. doi:10.1016/j.ptlrs.2020.04.005
Zeng, F., Yang, W., Wei, G., Yi, H., Zeng, Y., Zhou, G., et al. (2023). Structural features and exploration targets of platform margins in sinian Dengying Formation in deyang-anyue rift, Sichuan Basin, SW China. Petroleum Explor. Dev. 50 (2), 306–320. doi:10.1016/S1876-3804(23)60389-1
Zhang, W., Shi, Z., and Tian, Y. (2020). An improved method to characterize the pore-throat structures in tight sandstone reservoirs: combined high-pressure and rate-controlled mercury injection techniques. Energy Explor. Exploitation 38 (2), 2389–2412. doi:10.1177/0144598720920729
Zhang, Y., Bijeljic, B., Gao, Y., Lin, Q., and Blunt, M. J. (2021). Quantification of nonlinear multiphase flow in porous media. Geophys. Res. Lett. 48 (5), e2020GL090477. doi:10.1029/2020GL090477
Zhang, Y., Xu, X., Lebedev, M., Sarmadivaleh, M., Barifcani, A., and Iglauer, S. (2016). Multi-scale x-ray computed tomography analysis of coal microstructure and permeability changes as a function of effective stress. Int. J. Coal Geol. 165, 149–156. doi:10.1016/j.coal.2016.08.016
Zhou, B., Ku, Q., Wang, H., and Wang, J. (2020). Particle classification and intra-particle pore structure of carbonate sands. Eng. Geol. 279, 105889. doi:10.1016/j.enggeo.2020.105889
Keywords: carbonates, geometric features, topological structure, fractal dimension, petrophysics experiments
Citation: Dong H, Luo B, Dang C, Xu S, Wang F and Chi P (2024) Quantitative characterization of the carbonate rock microstructure considering topological features: a case study from the Gaoshiti–Moxi block of the Sichuan Basin. Front. Earth Sci. 12:1375637. doi: 10.3389/feart.2024.1375637
Received: 24 January 2024; Accepted: 05 March 2024;
Published: 20 March 2024.
Edited by:
Wenguang Wang, Northeast Petroleum University, ChinaReviewed by:
Weichao Tian, Yangtze University, ChinaZhihao Jiang, Xi’an Shiyou University, China
Haitao Wang, Chongqing University of Science and Technology, China
Elham Bakhshi, University of Talca, Chile
Copyright © 2024 Dong, Luo, Dang, Xu, Wang and Chi. This is an open-access article distributed under the terms of the Creative Commons Attribution License (CC BY). The use, distribution or reproduction in other forums is permitted, provided the original author(s) and the copyright owner(s) are credited and that the original publication in this journal is cited, in accordance with accepted academic practice. No use, distribution or reproduction is permitted which does not comply with these terms.
*Correspondence: Huaimin Dong, c2RzZGRobUBjaGQuZWR1LmNu; Peng Chi, YjIxMDEwMDI0QHMudXBjLmVkdS5jbg==