 Jinyou Zhang1,2
 Min Wang
 Jinbu Li
94% of researchers rate our articles as excellent or good
Learn more about the work of our research integrity team to safeguard the quality of each article we publish.
Find out more
ORIGINAL RESEARCH article
Front. Earth Sci., 18 March 2024
Sec. Geochemistry
Volume 12 - 2024 | https://doi.org/10.3389/feart.2024.1375590
This article is part of the Research TopicUnconventional Resources: Provenance Analysis, Sediment Transport, Reservoir Evaluation, Geo-energyView all 29 articles
There is a large amount of oil and gas loss in traditional conventional core samples. Revealing the rules of oil and gas loss is of great significance for restore the pristine oil content and oil component in the shale. In this study, four preserved shale cores with different thermal maturity (Ro = 1.01–1.53%) and different total organic carbon content (TOC = 1.69–5.48 wt.%) were selected. The samples are obtained from the first member of the Qingshankou Formation in the Gulong Sag. Nuclear magnetic resonance (NMR) T1–T2 mapping and thermal desorption gas chromatography (TD–GC, at a constant temperature of 300°C for 3 min) were performed on the preserved cores and their replicas that were exposed in open air for different times, to study dynamic loss process and the molecular composition changes of shale oil. The results show that during exposure, shale experiences a large amount of oil loss, with a loss ratio of about 42%–78%, and the higher the maturity, the greater the loss ratio. The oil loss is mainly contributed by free oil, with a loss ratio as high as 88%. The adsorbed oil content, however, remains basically unchanged and has a good positive correlation with the TOC of shale. Once the cores were crushed, the gaseous hydrocarbon in oil was basically evaporated in just 5 min. After long-term storage, 90% of the C14- light hydrocarbon is lost, while the C14+ heavy hydrocarbon experiences basically no loss. Therefore, effective and timely analysis of preserved shales is extremely important. The oil content of uncrushed shale cores characterized by NMR T1–T2 mapping is much greater than that of the crushed sample measured by TD-GC, which means that NMR T1–T2 mapping can be important method to evaluate the original fluid saturation of shale.
In 2021, Daqing Oilfield reported 1.268 billion tons reserves of Gulong shale oil, which greatly boosting confidence in shale oil exploration (Sun et al., 2021). The key parameter for the evaluation of shale oil reserves and resource potential is the pristine oil content (Wang et al., 2022). However, due to the loss of light components in oil and gas, the oil content obtained from conventional coring samples (core samples that have long exposed to the open environment) is much lower than the in situ underground pristine oil content. The lost component has the highest mobility and is exactly the most meaningful part for production, especially for medium-to high-thermal matured shale oil composed of high proportion of light hydrocarbons. Loss of light hydrocarbon (including gaseous hydrocarbons C1-C5 and liquid hydrocarbons C6-C14) would lead to underestimation of resource potential and misjudgment of sweet spots (Jarvie, 2014). Therefore, there is an urgent need to conduct research on the loss patterns of shale light hydrocarbons, which is crucial for objective evaluation of shale oil resource potential, reserve scale, and sweet spot.
Under the influence of storage condition and pretreatment, and crucible waiting time (about 5 min) before Rock-Eval six pyrolysis experiments, the S1 value of shale sample measured in laboratory does not contain small molecular hydrocarbons, and thus is much lower than in situ S1 in shale oil reservoir when further considering the heavy hydrocarbons in S2 peak (Jarvie, 2014; Jiang et al., 2016; Romero-Sarmiento, 2019; Yan et al., 2023). The loss of light hydrocarbons is mainly caused by two aspects. On one hand, when the shale is brought from the underground to the surface, small molecular hydrocarbons will release due to sudden changes in temperature and pressure (Chen and Jiang, 2020). On the other hand, sample storage, pretreatment such as crushing, and Rock–Eval crucible waiting process also lead to evaporation of light components (Jarvie, 2014; Li et al., 2022a). Generally speaking, the loss of light hydrocarbons is related to its their proportion in shale oil, and the higher the proportion, the greater the loss (Noble et al., 1997; Ma et al., 2024). The proportion of light hydrocarbons is further controlled the organic matter type and thermal maturity of shale. For example, compared with Type I organic matter, Type II organic matter is more likely to generate gas and thus contribute a higher proportion of light hydrocarbons (Ma et al., 2020). In addition, highly matured organic matter will experience intense thermal cracking, generating more light hydrocarbons. Jarvie (2014) pointed out that the evaporation of light hydrocarbons (up to C10) in shale oil depends to a large extent on the richness of organic matter, lithofacies, oil properties, whether the sample is crushed or not, and storage conditions. The evaporation loss ratio ranges from 33% to 85%.
In previous studies, there have developed several methods to evaluate hydrocarbon loss, including empirical approach (Cooles et al., 1986), calculation the proportion of light hydrocarbon in oil/extracts (Michael et al., 2013; Jarvie, 2014; Wang et al., 2014), mass balance approach (Chen and Jiang, 2020), and sealing and pressure coring techniques (Jiang et al., 2016), etc. The ratio of hydrocarbon loss reported by different scholars varies a lot, ranging from 35% to 80% (Cooles et al., 1986; Jarvie, 2014). When assessing resource potential of shale, especially the target areas with a large maturity range, it is inappropriate to simply use a fixed light hydrocarbon loss ratio. Based on the difference in hydrocarbon content between thermal desorption-gas chromatography (TD-GC) of shale powder and GC of the crude oil from the shale, the light hydrocarbon loss can be calculated, and the corrected pristine hydrocarbon content is S1 × (hydrocarbon content in crude oil/hydrocarbon content in shale extracts) (Jarvie and Breyer, 2012). Song et al. (2013) assumed that the C14- component in the saturates are all lost, and then calculated the correction coefficient of the light hydrocarbon loss of shale extracts (by chloroform) from the same strata and at near depth with the crude oil, by using GC chromatography of the crude oil. They found that correction coefficient of light hydrocarbon evaporative losses increases with thermal maturity. When the maturity of shale increases from 0.5% to 0.7%, 0.9%, 1.1%, and 1.3%, the corresponding correction coefficients are 1.09, 1.16, 1.30, 1.41, and 1.52, respectively. In the work of Michael et al. (2013), they assumed that all the C15- component is lost, and the amount of loss is positively related to API gravity of crude oil, that is, the amount of loss increases with the increase of API gravity. On the basis of this, it is proposed to use the relationship between API gravity of crude oil and C15- content to estimate the loss of light hydrocarbons (API = 0.412 × C15- + 20.799). Results showed that when the API is 50, the maximum C15- loss ratio can reach 70%. In order to reduce light hydrocarbon fluid loss and contamination in the samples before experimental analysis, sealed coring technology was developed. Liquid nitrogen freezing was performed at the well site before the shale cores being transported back to the laboratory for analysis. The fresh samples obtained by this method can retain as much as light hydrocarbons and are closer to the in situ geological conditions. By using the light hydrocarbon logging technology of fresh samples, or comparing the difference in oil content between fresh samples and long-term exposed/conventional coring samples, the loss of light hydrocarbons can be obtained (Jarvie, 2014; Zhu et al., 2015; Jiang et al., 2016). For example, for the shale from Shahejie Formation of Jiyang Depression, eastern China, it is found that, the Rock-Eval S1 value of the preserved samples is 1.5–2.0 times that of the conventional samples stored in open air for 30 days, and the difference in S1 is related to thermal maturity.
Previous studies have focused primarily on the amount of light hydrocarbon loss using shale samples obtained through seal coring techniques, lacking attention to the dynamic loss process, component change during loss, and the influencing factors. Therefore, in this study, preserved shale samples of different thermal maturity and organic matter richness were collected. The fresh shales and their replicas with different exposure time were subjected to nuclear magnetic resonance (NMR) T1–T2 mapping, TD–GC, and Rock–Eval analysis. By dynamically monitoring changes in oil content and its chemical composition, the pattern of light hydrocarbon loss of shale oil is revealed.
The samples were collected from the shale oil Well in the Qing1 Member of the Gulong Sag in Daqing Oilfield that was drilled in 2020. All samples were obtained through sealed coring technology that preserves the original fluid components in shale. Preserved cores were sprayed with liquid nitrogen while cutting. When full-diameter cores were brought to the surface, they were immediately frozen in liquid nitrogen bucket at −196°C. Liquid nitrogen freezing can effectively retain the fluid components in shale, ensuring that the oil content analyzed in the experiment is closer to the in situ oil content. The thermal maturity, total organic carbon content, and mineral composition is shown in Table 1.

TABLE 1. Basic geochemical characteristics and mineral composition of the sample.
The preserved core samples were subjected to NMR T1–T2 mapping to quantify the oil content in shale and TD-GC experiments to characterize the molecular composition in oil. One sample was divided into two categories based on sample size and experimental purpose. One part of blocks with 3–5 cm size was used for NMR T1-T2 map experiments. The other part of blocks was crushed to 60–80 mesh powders and subjected to TD–GC analysis. Both NMR and TD-GC do not require resampling. After sample was exposed to open air for different time intervals (such as 10 min, 20 min, 30 min, 1 h, 2 h, 8 h, 24 h, 48 h, etc.), block sample was resubmitted to NMR experiment while a small proportion of powder sample (30–50 mg) was taken out to perform TD-GC analysis each time. In this work, four preserved samples were subjected to NMR experiment while only sample A were subjected to TD-GC analysis at different time intervals due to material limited.
H1-NMR spectroscopy was performed using an instrument produced by Core Laboratories, USA, with a frequency of 22 MHz, and the magnet temperature is 35°C. The nuclear magnetic probe has a diameter of 30 mm and dead time of signal acquisition to 15 μs, to measure short relaxation components such as solid organic matter (OM) and nanoporous fluid in shale. Compared with mainstream 2 MHz and 12 MHz nuclear magnetic equipment, the instrument used in this experiment emit a greater frequency, and its T1–T2 map can clearly distinguish oil, water and solid organic matter signals. The main testing parameters are: echo time (TE), 70 μs; recycle delays (RD), 1,000 ms; number of echos, 4,000; number of inverse times, 31; and target signal-to-noise ratio (SNR), 200. The number of scans and gain values was automatically optimized by the instrument based on the hydrogen contents of the samples (Liu et al., 2019; Li et al., 2022b).
During the test, the magnetic field excites the protons of hydrogen nuclei, which will cause the sample to self-heat up. This may cause the fluid to evaporate from the preserved sample. In order to avoid fluid evaporation, during test, the samples should be kept rich in total hydrogen content (which can be achieved by increasing the sample mass) and the number of scans should be low. In this study, the NMR T1–T2 test for preserved samples were all controlled within 5 min, and the signal-to-noise ratio maintained above 200. The detailed test process for preserved shale has been shown in Li et al. (2022b).
TD-GC combines pyrolysis device and gas chromatography. The chromatograph is Shimadzu GC-14B, and the chromatographic column is HP-5. Before test, the preserved shale with block shape was quickly crushed to about 60 mesh. Then, about 30–50 mg was put in to the pyrolysis oven and pyrolyzed at preset temperature program. The pyrolysis products were carried by carrier gas into a liquid nitrogen-frozen trap for collection. After collection, the trap was quickly heated to allow the organic compounds to be fully released and then enter the chromatographic column for analysis. The detector is hydrogen ion flame detector (FID) and the products were quantified by external standard method. The GC oven temperature was initially held at 30°C for 3 min, and then increased to the final temperature of 315°C at a heating rate of 3°C/min. The flame ionization detector (FID) temperature was maintained at 315°C until no components flowed out. The carrier gas was helium with flow rate of 1 mL/min, and the split ratio was 1:25. The TD-GC detected the P1 peak, corresponding to the S1 peak of the Rock-Eval pyrolysis, of which the pyrolysis temperature was 300°C and maintenance time was 3 min (Jiang et al., 2016; Beti et al., 2020). Compound identification was based on comparison of GC retention time with those in literature.
Previous scholars have demonstrated that the sample size will affect the pyrolysis results (Sun et al., 2023). In this work, the reason for using a 60 mesh sample is that the experimental object is sealed coring sample with large amount hydrocarbons. If the sample is crushed too finely (such as 100 mesh), the crushed sample will be very sticky, and the loss of hydrocarbons is too fast in a short period of time, making more difficult to detect process of hydrocarbon loss.
Our previous study revealed that sample crush caused large amount of light hydrocarbon and water loss in preserved shale (Li et al., 2022a). In order to avoid evaporation loss and accurately quantify the pristine fluid content in shale, the preserved cores were not crushed in this study, and the NMR tests were conducted on regularly rectangular rock pieces. Figure 1 showed T1–T2 maps of the four preserved shales. In the maps, five regions are divided by white dashed lines, and the components represented by each region are based on our previous reported scheme (Li et al., 2018; Li et al., 2020; Mukhametdinova et al., 2021). Region 1 (T2 < 0.2 ms, T1 > 10 ms) represents solid organic matter (OM), Region 2 (0.2 ms < T2 < 1 ms, T1/T2 > 10) corresponds to adsorbed/heavy hydrocarbon; region 3 (T2 > 1 ms, T1/T2 > 10) refers to free/light hydrocarbon; Region 4 (T2 < 0.2 ms, T1 < 10 ms) is adsorbed water and hydroxyl/structured water, and region 5 (T2 > 0.2 ms, T1/T2 < 10) represents pore water.
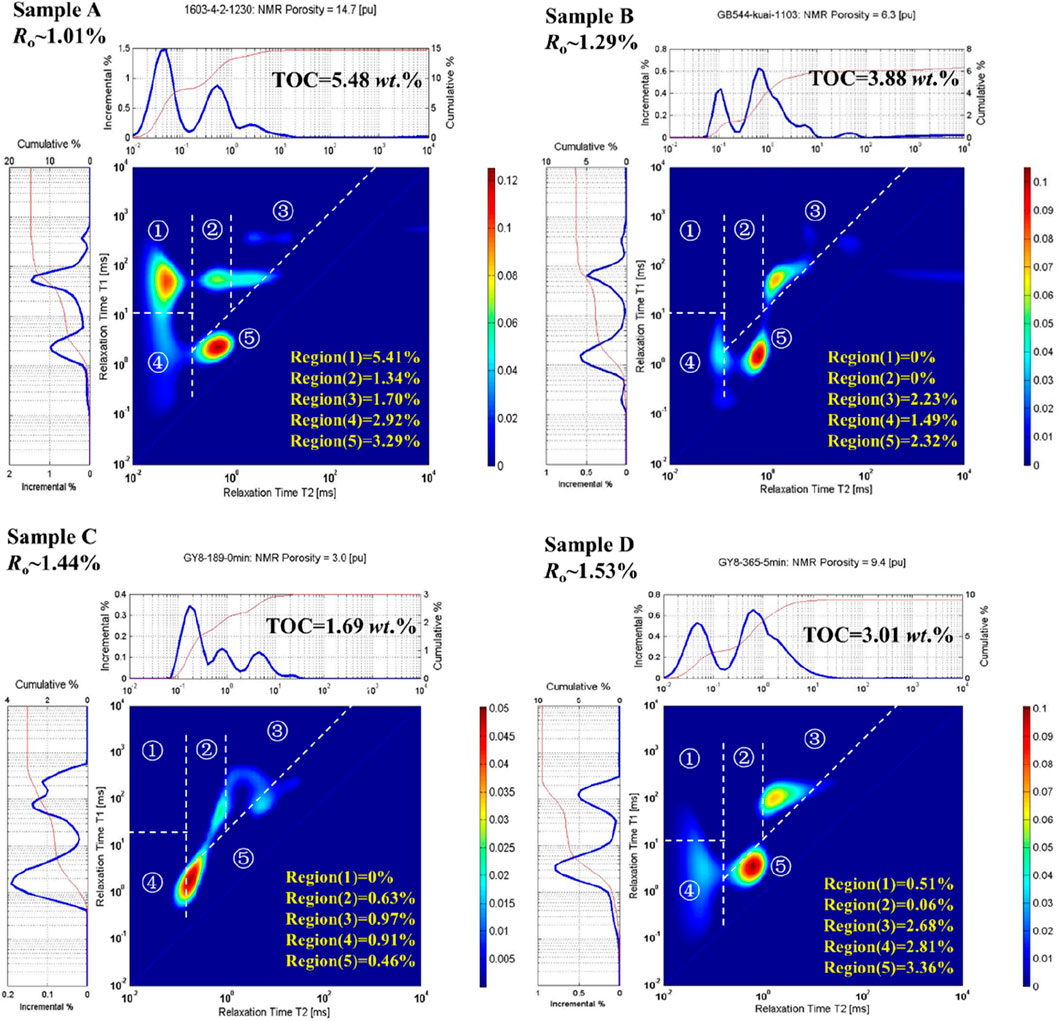
FIGURE 1. The NMR T1-T2 maps of the four preserved shale samples.
In general, the signals of the T1–T2 map of the four samples are relatively strong in region 3 and 5, indicating that the pores of the sample are mainly composed of shale oil and water. There are differences in T1–T2 maps of different samples. For sample A with relatively low thermal maturity and high TOC content, due to its high oil density, the oil adsorption ability of organic matter is high, resulting strong signal in region 2. In comparison, for samples with high thermal maturity and low TOC content, the strong signal mainly distributes in region 3, and the shale oil is mainly free oil. In addition, Sample A has strong signal in region 1, while other samples have basically no signal in region 1. The reasons may be lie in two aspects. On one hand, the NMR signal intensity of solid organic matter is related to its content. Obviously, sample A have highest TOC value of 5.48%, and their T1-T2 map showing the strong signal in Region 1, while no signals in Region 1was shown in sample C with TOC value of only 1.69% (Table 1). Organic matter is characterized by fast relaxation rate and short relaxation time. Although the NMR tests adopted the solid echo sequence (Washburn and Birdwell, 2013), unlike detecting pore fluid, it is still difficult to detect all solid organic matter signals (Fleury, 2016). On the other hand, affected by the high fluid content of the preserved shale, the signal of organic matter may be masked. The signal in region four reflects mineral structure water and adsorbed water. The signal intensity is related to the clay mineral content. It is obvious that sample D with clay content of up to 57% shows intense signal in region 4, while sample C with relatively lower clay content shows basically no signal in area 4.
Based on our previously calibrated coefficient between the signal intensity of shale oil and its content (Li et al., 2022b), the pristine oil content of the four samples was estimated to be 33.15 mg/g, 19.82 mg/g, 10.61 mg/g, and 22.62 mg/g, respectively. Obviously, the oil content in preserved shale is much higher than that in conventional coring sample.
Figure 2 shows the S1 chromatograph of TD-GC products of preserved shale samples A and B. GC fingerprints present distinct gaseous hydrocarbon components (C1—C5), with methane accounting for the most proportion. This indicates that the oil content measured by NMR T1–T2 mapping includes gaseous hydrocarbons. In addition, there seems no loss of C6-C14 component in oil. The S1 value was quantified by external standard method. For sample A, the total amount of S1 is 11.43 mg/g, of which the gaseous hydrocarbons C1-C5 is 1.85 mg/g and the hydrocarbons C6-C14 is 6.25 mg/g. For sample B, the total amount of S1 is 9.12 mg/g, of which the gaseous hydrocarbons C1-C5 is 0.56 mg/g and the hydrocarbons C6-C14 is 5.44 mg/g. The proportions of C14- component in S1 of sample A and B are similar, 71% and 66% respectively. However, the S1 value is much lower than the oil content measured by NMR T1–T2 mapping method (Figure 1). Reasons may lie in two aspects. Firstly, sample crushing before the TD-GC experiment resulted in hydrocarbon loss (Li et al., 2022a). Secondly, some heavy hydrocarbons had boiling points higher than 300°C and therefore could not be detected by TD-GC (Jarvie and Breyer, 2012).
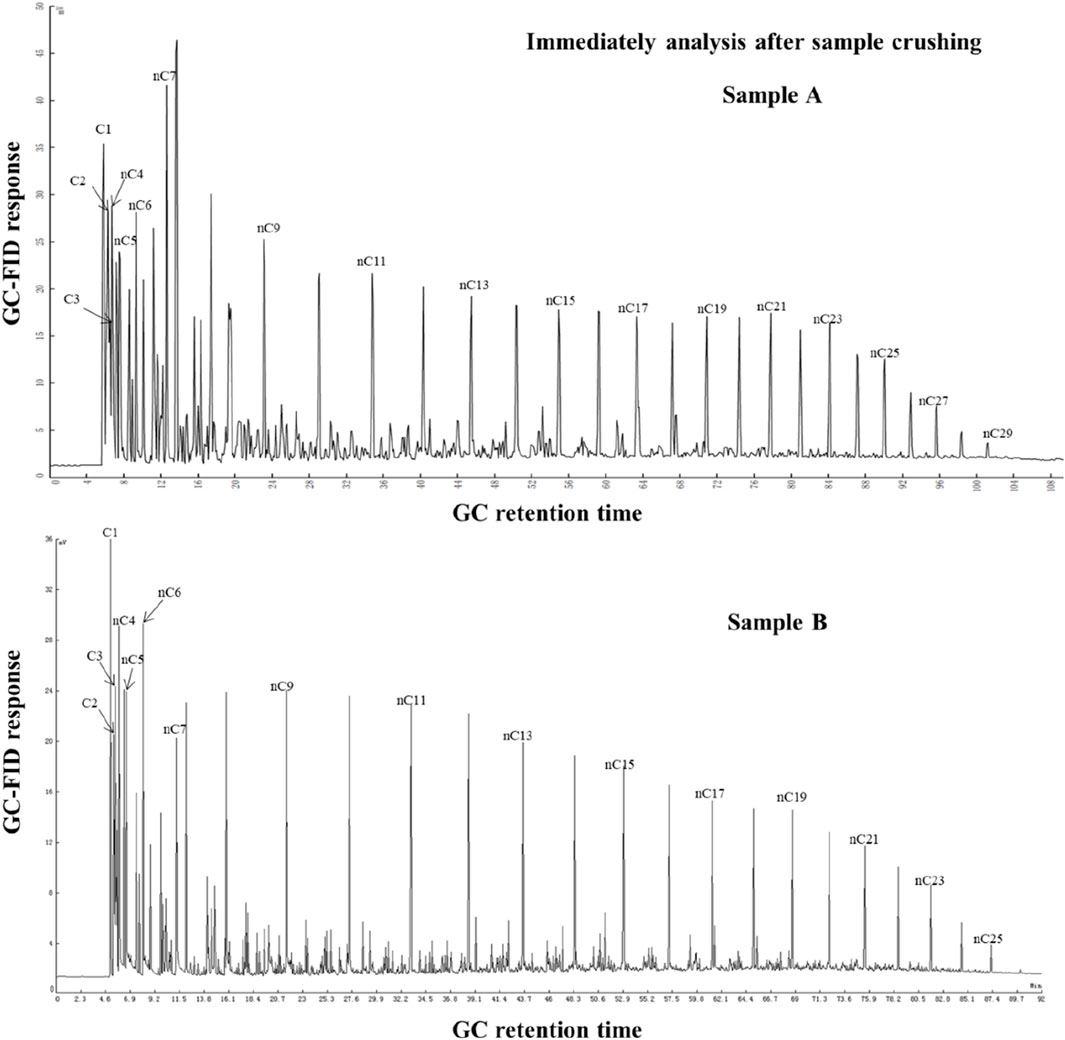
FIGURE 2. The S1 fingerprints of preserved shale samples (A, B).
The preserved shale cores (in rock pieces of 3–5 cm) were exposed in open air for 30 min, 1 h, 4 h, 8 h, 24 h, 48 h, etc. After different exposure time, shale pieces were resubjected to 2D NMR experiments to measure the mass of the shale pieces and the changes of T1–T2 maps. Figure 3 exhibits the changes of NMR T1–T2 maps of the sample A after different exposure times (for comparison, the colors in each map adopt a unified color scale). With the increase in exposure time, both the signals of shale oil (regions 2 and 3) and water (region 5) show a decreasing trend, indicating the loss of both oil and water when the preserved shale is exposed to air. Therefore, the assumption of only oil loss occurs is incorrect when using conventional cores to restore the in situ fluid saturation. This will overestimate the pristine oil content (Ali et al., 2020; Nikitin et al., 2019).
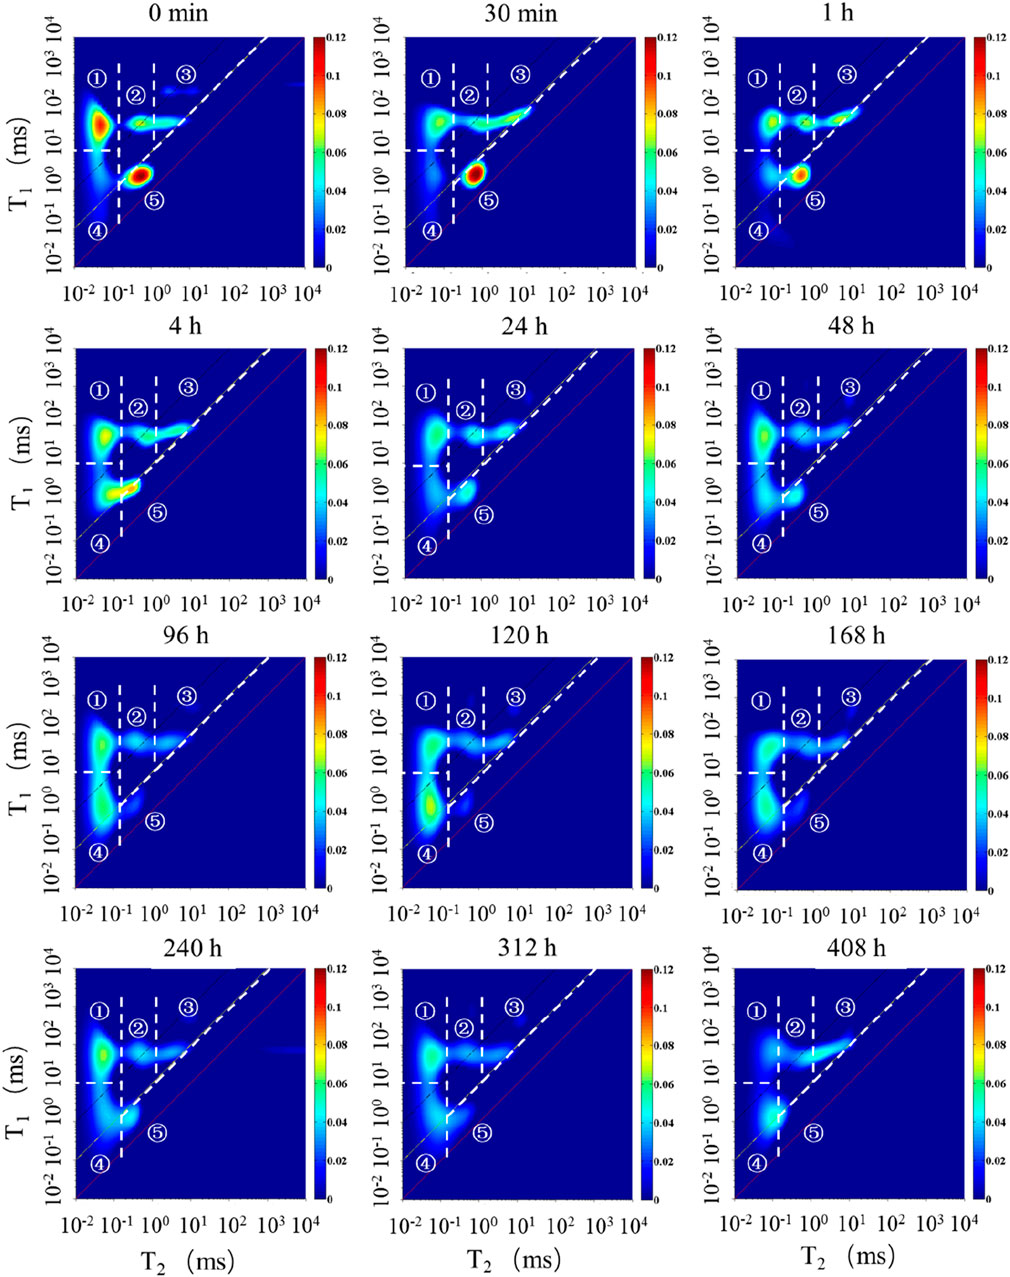
FIGURE 3. NMR T1–T2 maps of sample A (Ro = 1.0%, TOC = 5.48%) analyzed immediately and exposed to the open air at different time intervals. The NMR signals of each state were normalized to per Gram rock. The same color bar is used in each figure for ease of comparison.
Figure 4A shows the weight changes in preserved shale core sample A after exposure to open air at different time intervals. The initial weight of the sample is 17.385 g, and it shows a linear decline in the first 8 h of exposure. As the exposure time increases, the sample shows an exponential decrease, and the rate of decline progressively slows down. After 200–300 h, the trend levels off and the weight is stabled at 17.11 g, indicating no more fluid loss in shale pores. During the whole exposure process, about 0.275 g fluid was lost, accounting for 1.6% of the original weight of the shale. The change of oil content is similar to that of shale weight (Figure 4B), which decreased from 33.15 mg/g to 27.5 mg/g, with an oil loss rate of 17%.
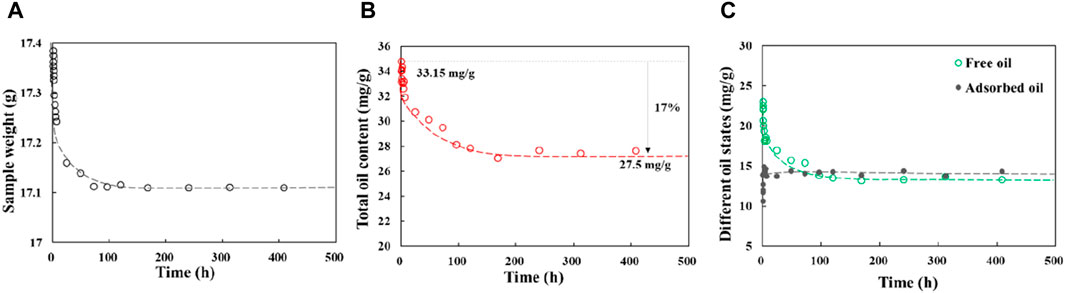
FIGURE 4. Variation diagram of each content of No. A sample after being placed for different times. (A) Total mass change diagram; (B) Oil content change diagram; (C) Variation diagram of free oil rate and adsorbed oil rate.
The changes of adsorbed oil and free oil during sample A exposure is shown in Figure 4C. During oil loss, the adsorbed oil remains basically unchanged while a large amount of free oil is lost. With the increase of exposure time, the content of shale oil or free oil in large pores (T2 > 1 ms) decreased from 23.06 mg/g to 13.3 mg/g, with a loss rate of 42%. In comparison, the adsorbed oil showed a different trend. In the early stage of storage (<100 h), which corresponds to the time period when free oil decreases rapidly, the adsorbed oil content shows an increasing trend. There maybe two reasons for the increase. First, the adsorbed oil generally exists in a solid-like state on the pore surface (Wang et al., 2015). In the early stage of the NMR test, controlled by the accuracy of the instrument, the adsorbed oil under freezing conditions may not be fully detected. As the exposure time increases, the sample was gradually thawed, and thus adsorbed oil was gradually detected. Second, as the free oil in the center of the pore gradually evaporates, the NMR T2 map of the fluid in the pore generally shows a left-shifting trend, leading signal intensity increases at T2 < 1 ms. The adsorbed oil content of sample A remains unchanged during the entire exposure process and was stable at 14.17 mg/g.
The losses of adsorbed oil, free oil at different exposure time in preserved shale samples B, C, and D were also calculated according to the changes of NMR T1–T2 maps, and the results are shown in Figure 5. For sample B, the total oil content reaches equilibrium after 100–150 h. The oil content decreases from 19.83 mg/g to 5.18 mg/g, and the loss rate is as high as 73%. Compared with sample A with lower maturity and higher TOC content, it takes shorter time for oil in sample B to reach loss equilibrium. The main reason maybe that sample B contains more light hydrocarbons than Sample A. For sample B, the free oil in large pores (T2 > 1 ms) drops from 16.64 mg/g to 1.9 mg/g and the loss rate is 88%, which is much greater than sample A. The adsorbed oil of sample B changes the same with sample A, which first increases and then levels off and finally remains at 2.5 mg/g. Similarly, the shale oil loss rates of samples C and D are 70% and 78%, respectively after long-term storage. The decrease in shale oil is mainly attributed to free oil, while the adsorbed oil content remains basically unchanged. The hydrocarbon loss ratio shows a negative trend with TOC data (Table 1), which similar to the phenomenon found by Jiang et al. (2016).
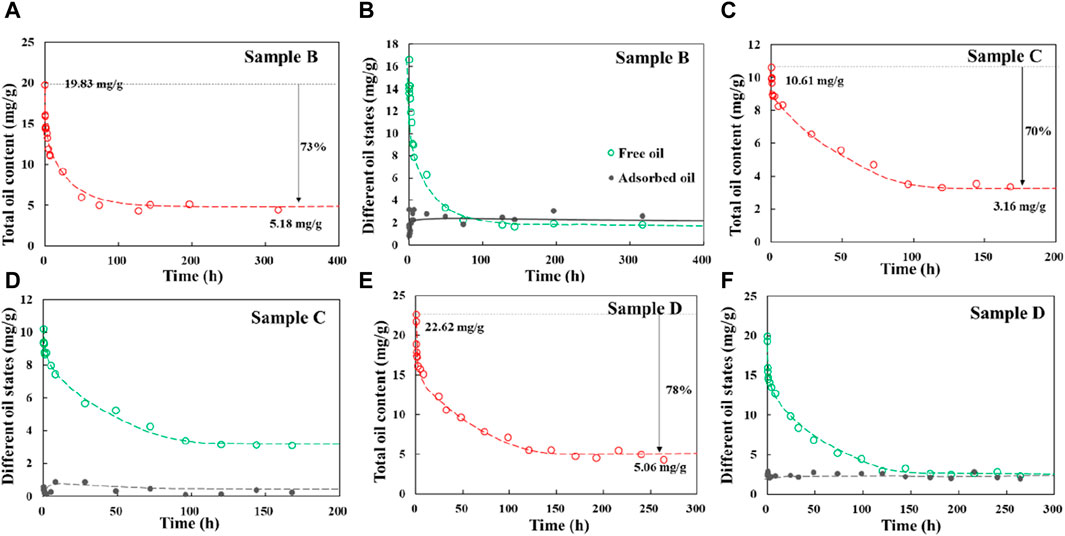
FIGURE 5. Changes of oil content, free oil, and adsorbed oil of preserved shales after different exposure times.
Comparing the amounts of adsorbed oil and free oil in the four samples after long-term storage, it is found that for samples A, B, and D with relatively high TOC content, the adsorbed oil and free oil contents are basically the same, each account for about 50%. For sample C with low TOC and clay mineral content, however, the shale oil is still dominated by free oil after long-term storage, and the adsorbed oil content is extremely low. It is been concluded that shale oil adsorption is mainly controlled by organic matter richness, thermal maturity and clay mineral (Li et al., 2022c). In the present work, the adsorption oil content measured by 2D NMR is positively correlated with TOC content (Figure 6). Therefore, shale with low TOC content and clay mineral, especially for interbedded layers between organic-rich shale strata, may be favorable areas for shale oil exploration.
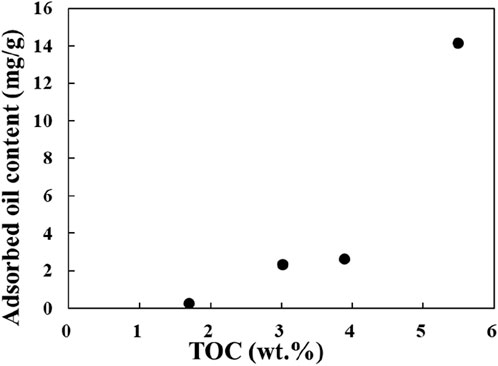
FIGURE 6. The relationship between adsorbed oil content and TOC of shale samples after long-term exposure.
The preserved shale samples (in powder) were exposed in open air environment, and were subjected to TD-GC experiments after different exposure times (e.g., 30 min, 1 h, 4 h, 8 h, 24 h, 48 h) to dynamically reveal molecular changes of shale oil. Figure 7 shows the TD–GC S1 fingerprints of sample A at different exposure times. When the preserved core is initially pulverized and the experiment conducted immediately, the thermal desorption products contain high proportion of C1-C5 gaseous components. As the exposure time increases, the gaseous components are evaporated first. After 5–10 min, the gaseous hydrocarbon components have volatilized in large quantities. During this period, the C6-C10 components also decrease. The gaseous components are almost disappeared after 2 h. As the storage time further increases, the C12- components continue to be lost. After 4–6 d, the C12- components basically disappear completely. From the TD–GC S1 fingerprints, the exposure process exerts basically no impact on the C14+ components.

FIGURE 7. Thermal desorption chromatogram of preserved sample A at different exposure times.
The contents of C1-C5 gaseous hydrocarbon, C6-C14 light hydrocarbon and C14+ heavy hydrocarbon were calibrated according to the peak areas of the GC–FID traces, and the results are listed in Table 2. The S1 total hydrocarbon of shale powder analyzed immediately after pulverization (0 min) is 11.43 mg/g. After just 2 min, the value drops to 9.67 mg/g. The lost components are mainly gaseous and light hydrocarbons in oil. Therefore, for preserved shales, especially for crushed preserved shales, effective and timely analysis is extremely important due to rapid loss of hydrocarbons. After 2 h exposure, the S1 value is 5.94 mg/g, a decrease of about 50% compared with the initial moment. Furthermore, after long-term exposure for 6 d or 12 d, the hydrocarbon content of the shale is only about 4.6 mg/g, which means that 60% of the hydrocarbons in the initial S1 have been lost.
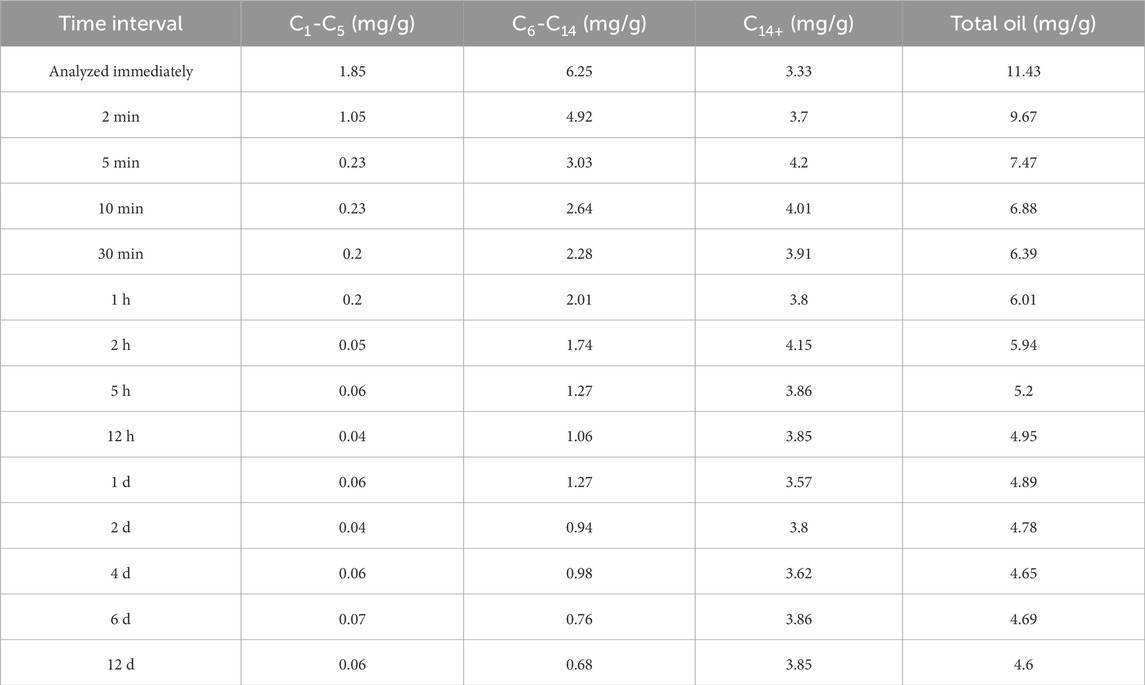
TABLE 2. Calibrated C1–C5, C6–C14, and C14+ contents of sample A at different exposure times based on the peak areas of the GC–FID traces.
After 1–2 h, the C1-C5 gaseous hydrocarbon has basically disappeared, and the value fluctuates between 0.04 and 0.07 mg/g. The remaining gaseous hydrocarbon maybe due to adsorption or the measurement error of the instrument. The original content of the C6-C14 light hydrocarbon is 6.25 mg/g. After long-term storage it decreases to 0.68 mg/g, which means that 90% is lost during the storage process. During the entire process, the C14+ heavy hydrocarbon of shale oil remained basically unchanged, fluctuating between 3.33 and 4.2 mg/g.
The content of n-alkanes in saturated fractions of oil was also calculated, and the results are shown in Figure 8. It is obvious that methane (C1) evaporates the fastest, with loss rates of 94.77% after 2 min and 99.39% after 20 min. As the carbon chain length of hydrocarbon molecules increases, the overall loss rate shows a decreasing trend. The loss rate of pentane (C5) is 83.93% after 2 min, and reaches 93.72% after 20 min. The loss rate of C10 is 33.75% after 2 min, and reaches 91.81% after 48 h. Different from small molecular n-alkanes, the heavy molecular n-alkanes (n > 14) are not lost as the storage time increases, but fluctuates. The reason may be related to the weak diffusion/mobility ability of heavy hydrocarbons. Another possibility is that the TOC content of sample A is relatively high, and the organic matter has a strong ability to absorb heavy hydrocarbons, making it difficult for heavy components to volatilize.
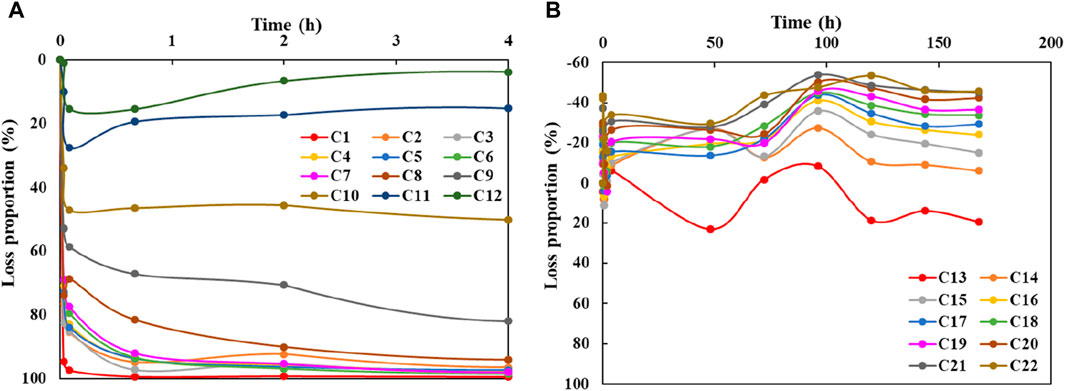
FIGURE 8. Changes of n-alkanes in thermal desorption products of sample A during exposure. (A) Hydrocarbons before C12; (B) Hydrocarbons after C12.
In this work, four preserved shale cores with different thermal maturity and organic matter richness were selected. NMR T1–T2 mapping and TD-GC experiments were performed on preserved/fresh cores and their replicas that had been long-term exposed to ambient conditions to study the hydrocarbon loss rules. The main conclusions are as follows:
(1) The four preserved shale cores have relatively high pristine oil content. The 2D NMR quantified oil content of crushing the cores ranges from 10.61 mg/g to 33.15 mg/g and averages at 21.3 mg/g, which is much higher than the value obtained by geochemical methods.
(2) During storage, the preserved shale cores experienced large amount of oil loss, with a loss rate of approximately 42%–78%. The higher the maturity, the greater the loss rate. The shale oil loss is mainly contributed by free oil, while the adsorbed oil remains basically unchanged during exposure. The remaining content of adsorbed oil is positively correlated with TOC of the shale.
(3) Thermal desorption products at different time periods show that for powdered samples, the gaseous hydrocarbons in the shale have basically evaporated in just 5 min, indicating the necessity of timely and effective analysis of preserved cores. After long-term storage, 90% of the C14- light hydrocarbon of shale oil is lost, while the C14+ heavy hydrocarbon remains basically unchanged.
(4) During the exposure process of preserved cores, in addition to shale oil loss, water will also decrease. There remain challenges in how to use conventional core samples to restore the original fluid occurrence and original fluid saturation of shale.
The raw data supporting the conclusion of this article will be made available by the authors, without undue reservation.
JZ: Data curation, Investigation, Resources, Writing–original draft, Writing–review and editing. MW: Conceptualization, Funding acquisition, Supervision, Writing–review and editing. JL: Data curation, Funding acquisition, Methodology, Writing–review and editing. ZL: Data curation, Methodology, Writing–review and editing. LX: Data curation, Methodology, Writing–review and editing.
The author(s) declare that financial support was received for the research, authorship, and/or publication of this article. This study was funded by the National Natural Science Foundation of China (42102154, 41922015, 42072147).
Authors JZ, ZL, and LX were employed by Exploration and Development Research Institute of PetroChina Daqing Oilfield Company.
The remaining authors declare that the research was conducted in the absence of any commercial or financial relationships that could be construed as a potential conflict of interest.
All claims expressed in this article are solely those of the authors and do not necessarily represent those of their affiliated organizations, or those of the publisher, the editors and the reviewers. Any product that may be evaluated in this article, or claim that may be made by its manufacturer, is not guaranteed or endorsed by the publisher.
Ali, M., Ali, S., Mathur, A., and Belanger, C. (2020). Organic shale spontaneous imbibition and monitoring with NMR to evaluate in-situ saturations, wettability and molecular sieving, unconventional resources technology conference, 20–22 july 2020. Unconv. Resour. Technol. Conf. (URTEC), 3104–3117. doi:10.15530/urtec-2020-3096
Chen, Z., and Jiang, C. (2020). An integrated mass balance approach for assessing hydrocarbon resources in a liquid-rich shale resource play: an example from Upper Devonian Duvernay Formation, Western Canada Sedimentary Basin. J. Earth Sci. 31 (06), 1259–1272. doi:10.1007/s12583-020-1088-1
Cooles, G. P., Mackenzie, A. S., Quigley, T. M., et al. (1986). Calculation of petroleum masses generated and expelled from source rocks. Org. Geochem. 10 (1-3), 235–245. doi:10.1016/0146-6380(86)90026-4
Jarvie, D. M. (2014). Components and processes affecting producibility and commerciality of shale resource systems. Geol. Acta Int. Earth Sci. 12 (4), 307–325.
Jarvie, D. M., and Breyer, J. A. (2012). Shale resource systems for oil and gas; Part 2, Shale-oil resource systems. AAPG Mem. 97, 89–119. doi:10.1306/13321447m973489
Jiang, C., Chen, Z., Mort, A., Milovic, M., Robinson, R., Stewart, R., et al. (2016). Hydrocarbon evaporative loss from shale core samples as revealed by Rock-Eval and thermal desorption-gas chromatography analysis: its geochemical and geological implications. Mar. Petroleum Geol. 70, 294–303. doi:10.1016/j.marpetgeo.2015.11.021
Li, J., Huang, W., Lu, S., Wang, M., Chen, G., Tian, W., et al. (2018). Nuclear magnetic resonance T 1–T 2 map division method for hydrogen-bearing components in continental shale. Energy and Fuels 32 (9), 9043–9054. doi:10.1021/acs.energyfuels.8b01541
Li, J., Jiang, C., Wang, M., Lu, S., Chen, Z., Chen, G., et al. (2020). Adsorbed and free hydrocarbons in unconventional shale reservoir: a new insight from NMR T1-T2 maps. Mar. Petroleum Geol. 116, 104311. doi:10.1016/j.marpetgeo.2020.104311
Li, J., Jiang, C., Wang, M., Xu, L., Li, M., Yu, C., et al. (2022a). Determination of in situ hydrocarbon contents in shale oil plays. Part 1: is routine Rock–Eval analysis reliable for quantifying the hydrocarbon contents of preserved shale cores? Org. Geochem. 170, 104449. doi:10.1016/j.orggeochem.2022.104449
Li, J., Wang, M., Fei, J., Xu, L., Shao, H., Li, M., et al. (2022b). Determination of in situ hydrocarbon contents in shale oil plays. Part 2: two-dimensional nuclear magnetic resonance (2D NMR) as a potential approach to characterize preserved cores. Mar. Petroleum Geol. 145, 105890. doi:10.1016/j.marpetgeo.2022.105890
Li, J., Wang, M., Jiang, C., Lu, S., and Li, Z. (2022c). Sorption model of lacustrine shale oil: insights from the contribution of organic matter and clay minerals. Energy 260, 125011. doi:10.1016/j.energy.2022.125011
Liu, B., Bai, L., Chi, Y., Jia, R., Fu, X., and Yang, L. (2019). Geochemical characterization and quantitative evaluation of shale oil reservoir by two-dimensional nuclear magnetic resonance and quantitative grain fluorescence on extract: a case study from the Qingshankou Formation in Southern Songliao Basin, northeast China. Mar. Petroleum Geol. 109, 561–573. doi:10.1016/j.marpetgeo.2019.06.046
Ma, W., Hou, L., Luo, X., Liu, J., Tao, S., Guan, P., et al. (2020). Generation and expulsion process of the Chang 7 oil shale in the Ordos Basin based on temperature-based semi-open pyrolysis: implications for in-situ conversion process. J. Petroleum Sci. Eng. 190, 107035. doi:10.1016/j.petrol.2020.107035
Ma, W., Li, J., and Wang, M. (2024). Determination of in situ hydrocarbon contents in shale oil plays: Part 3: quantification of light hydrocarbon evaporative loss in old cores based on preserved shales. Mar. Petroleum Geol. 160, 106574. doi:10.1016/j.marpetgeo.2023.106574
Michael, G. E., Packwood, J., and Holba, A. (2013). Determination of in-situ hydrocarbon volumes in liquid rich shale plays. SPE168695.
Mukhametdinova, A., Habina-Skrzyniarz, I., and Krzyzak, A. (2021). NMR relaxometry interpretation of source rock liquid saturation—a holistic approach. Mar. Petrol. Geol. 132, 105165. doi:10.1016/j.marpetgeo.2021.105165
Nikitin, A., Durand, M., McMullen, A., Blount, A., Driskill, B., and Hows, A. (2019). Crushed rock analysis workflow based on advanced fluid characterization for improved interpretation of core data. Petrophysics-The SPWLA J. Format. Eval. Reserv. Descript. 60, 755–769. doi:10.30632/pjv60n6-2019a4
Noble, R. A., Kaldi, J. G., and Atkinson, C. D. (1997). AAPG memoir 67: seals, traps, and the petroleum system. Chapter 2: Oil Saturation in Shales: Applications in Seal Evaluation.
Romero-Sarmiento, M. F. (2019). A quick analytical approach to estimate both free versus sorbed hydrocarbon contents in liquid-rich source rocks. AAPG Bull. 103 (9), 2031–2043. doi:10.1306/02151918152
Song, G., Zhang, L., Lu, S., et al. (2013). Resource evaluation method for shale oil and its application. Earth Sci. Front. 20 (4), 221–228.
Sun, L., Liu, H., He, W., Li, G., Zhang, S., Zhu, R., et al. (2021). An analysis of major scientific problems and research paths of Gulong shale oil in Daqing Oilfield, NE China. Petroleum Explor. Dev. 48 (3), 527–540. doi:10.1016/s1876-3804(21)60043-5
Sun, Y., Wang, Y., Liao, L., Shi, S., and Liu, J. (2023). How grain size influences hydrocarbon generation and expulsion of shale based on Rock-Eval pyrolysis and kinetics? . Mar. Petroleum Geol. 155, 106369. doi:10.1016/j.marpetgeo.2023.106369
Wang, M., Li, M., Li, J. B., Xu, L., and Zhang, J. X. (2022). The key parameter of shale oil resource evaluation: oil content. Petroleum Sci. 19 (4), 1443–1459. doi:10.1016/j.petsci.2022.03.006
Wang, M., Tian, S., Chen, G., Xue, H., Huang, A., and Wang, W. (2014). Correction method of light hydrocarbons losing and heavy hydrocarbon handling for residual hydrocarbon (S1) from shale. Acta Geol. Sin. (Beijing) 88 (06), 1792–1797. doi:10.1111/1755-6724.12345
Washburn, K. E., and Birdwell, J. E. (2013). Updated methodology for nuclear magnetic resonance characterization of shales. J. Magnetic Reson. 233, 17–28. doi:10.1016/j.jmr.2013.04.014
Yan, G., Xu, Y. H., Xu, W. L., Bai, B., Bai, Y., Fan, Y. P., et al. (2023). Shale oil resource evaluation with an improved understanding of free hydrocarbons: insights from three-step hydrocarbon thermal desorption. Geosci. Front. 14 (6), 101677. doi:10.1016/j.gsf.2023.101677
Keywords: shale oil, light hydrocarbon loss, NMR T1-T2 mapping, preserved shale, Gulong Sag
Citation: Zhang J, Wang M, Li J, Liu Z and Xu L (2024) Research on loss rules of oil and gas in preserved shale cores after open air exposure. Front. Earth Sci. 12:1375590. doi: 10.3389/feart.2024.1375590
Received: 24 January 2024; Accepted: 01 March 2024;
Published: 18 March 2024.
Edited by:
Xixin Wang, Yangtze University, ChinaCopyright © 2024 Zhang, Wang, Li, Liu and Xu. This is an open-access article distributed under the terms of the Creative Commons Attribution License (CC BY). The use, distribution or reproduction in other forums is permitted, provided the original author(s) and the copyright owner(s) are credited and that the original publication in this journal is cited, in accordance with accepted academic practice. No use, distribution or reproduction is permitted which does not comply with these terms.
*Correspondence: Min Wang, d2FuZ21AdXBjLmVkdS5jbg==; Jinbu Li, bGlqaW5idUBnaWcuYWMuY24=
Disclaimer: All claims expressed in this article are solely those of the authors and do not necessarily represent those of their affiliated organizations, or those of the publisher, the editors and the reviewers. Any product that may be evaluated in this article or claim that may be made by its manufacturer is not guaranteed or endorsed by the publisher.
Research integrity at Frontiers
Learn more about the work of our research integrity team to safeguard the quality of each article we publish.