 Shasha Sun
 Zhensheng Shi
 Dazhong Dong1
 Lin Wei
 Jia Yin
95% of researchers rate our articles as excellent or good
Learn more about the work of our research integrity team to safeguard the quality of each article we publish.
Find out more
ORIGINAL RESEARCH article
Front. Earth Sci. , 25 April 2024
Sec. Economic Geology
Volume 12 - 2024 | https://doi.org/10.3389/feart.2024.1375241
This article is part of the Research Topic Differences in Shale Oil and Gas Reservoirs across Various Sedimentary Environments: Theories and Applications View all 12 articles
In the deep Longmaxi Formation shale gas reservoirs of the southern Sichuan Basin, strong overpressure is universally developed to varying degrees. However, there is currently a lack of in-depth research on the formation mechanisms, evolutionary patterns, and the controlling effects on reservoir pore characteristics of strong overpressure. This limitation significantly restricts the evaluation of deep shale gas reservoirs. This study selected typical overpressured shale gas wells in Yongchuan, Luzhou, and Dazu areas as research subjects. Through comprehensive methods such as log analysis, fluid inclusion analysis, and numerical simulation, the dominant mechanisms of strong overpressure formation were determined, and the pressure evolution from early burial to late strong uplift was characterized. Additionally, the impact of varying degrees of overpressure on reservoir pore characteristics was studied using techniques such as scanning electron microscopy, gas adsorption-mercury intrusion, and helium porosity testing. The research findings indicate that hydrocarbon generation expansion is the primary mechanism for strong overpressure formation. The pressure evolution in the early burial phase is controlled by the processes of kerogen oil generation and residual oil cracking into gas. The reservoir experienced three stages: normal pressure (Ordovician to Early Triassic), overpressure (Early Triassic to Early Jurassic), and strong overpressure (Early Jurassic to Late Cretaceous), with pressure coefficients of approximately 1.08, 1.56, and 2.09, respectively. During the late strong uplift phase, the adjustment of early overpressure occurred due to temperature decrease and gas escape, leading to a decrease in formation pressure from 140.55 MPa to 81.63 MPa, while still maintaining a state of strong overpressure. Different degrees of strong overpressure exert a significant control on the physical properties of shale reservoirs and the composition of organic matter pores. Variations exist in the organic matter pore morphology, structure, and connectivity within the deep Wufeng-Longmaxi shale. Higher overpressure favors the preservation of organic large pores and reservoir porosity. Under conditions of strong overpressure development, deep siliceous shales and organically rich clay shales exhibit favorable reservoir properties. By determining the dominant mechanisms of strong overpressure in the Wufeng-Longmaxi Formation and studying pore characteristics, this research not only deepens the understanding of the geological features of deep shale gas reservoirs but also provides a new perspective for understanding the overpressure mechanisms and reservoir properties of deep shale gas reservoirs. Moreover, it is of significant importance for guiding the exploration and development of deep Longmaxi shale and provides valuable references for further research in related fields.
The formation and evolution of overpressure are crucial indicators for the accumulation and dissipation of shale gas. The pressure coefficient is generally positively correlated with gas content and production rate, making it a key reference indicator for assessing shale gas preservation conditions and evaluating sweet spots. Researchers have widely recognized that the formation and evolution of overpressure are critical controlling factors for the pore development and preservation as well as the enrichment and productivity of gas reservoirs (Guo et al., 2017; Yi et al., 2019; Shan et al., 2021; Wang and Wang, 2021; Jin and Nie, 2022). In the deep (burial depth of 3,500–4,500 m) Wufeng Formation-Longmaxi Formation shale gas reservoirs in southern Sichuan Basin, overpressure (pressure coefficient: 1.3–1.8) or strong overpressure (pressure coefficient: >1.8) is commonly developed (Li, 2023b). However, significant variations exist in shale porosity, gas content, and gas production among different deep areas.
The identification of overpressure causes and their relationships with hydrocarbon accumulation have been a focal point in both conventional and unconventional oil and gas exploration. In recent years, empirical research methods, including velocity-density crossplot method (Bowers, 1995) and porosity comparison method (Tingay et al., 2013), have gradually replaced relatively simple theoretical analyses. And new understandings have been obtained on the identification and analysis of overpressure causes. The prevailing view has denied attributing overpressure to disequilibrium compaction or undercompaction, while the importance and prevalence of hydrocarbon generation for causing overpressure, especially gas generation during fluid expansion and oil-cracking gas, have been increasingly confirmed (Tingay et al., 2013; Zhao et al., 2017). As the geological-geophysical response characteristics are understood, it is revealed that tectonic compression and pressure transmission are the causes of overpressure. It has been discovered that the overpressure in many basins or areas may be the result of multiple causes.
The study of pressure evolution has also moved towards quantitative characterization. The characterization of pressure evolution from shale burial to uplift mainly employs the method of fluid inclusion analysis to reconstruct paleopressure. For example, Tang et al. (2023) carried out inclusion analysis to determine the reduction of the pressure coefficient of the Longmaxi Formation shale in Lintanchang area of southeastern Sichuan Basin from 2.05 in the early uplift period to 1.1 currently. Based on inclusion analysis, Liu et al. (2021) concluded that the pressure coefficient of the Longmaxi Formation shale in the southern Sichuan Basin varied from 2.10 to 2.50 in the hydrogenation generation period to 1.92–2.16 in the uplift period. However, the pressure evolution in the process of sedimentation-subsidence burial is less researched. Various studies have simulated the complete process of pressure evolution in Longmaxi Formation shale using basin modeling software. Li et al. (2016) carried out simulation calculation with consideration of temperature decline and concluded that the pressure of the Longmaxi Formation shale decreased in the process of uplift with pressure coefficient increasing from 1.8 to 2.5. Wu et al. (2022) carried out simulation calculation with consideration of gas escape and concluded that the pressure of the Longmaxi Formation shale decreased in the process of uplift with pressure coefficient fluctuating slightly around 2.2. Due to differences in geological factors, the conclusions regarding the pressure and pressure coefficient evolution curves vary significantly, and scholars have different understandings on the increase and decrease of pressure coefficient in the process of uplift. Furthermore, deep shale gas reservoirs undergo intense compaction during the burial process. Scholars generally agree that the development of overpressure has a protective effect on the pores in deep shale, whereas pressure relief often leads to pore collapse, compared with normal-pressure and low-pressure shale gas reservoirs (Liu et al., 2012; He et al., 2019; Sun et al., 2021). However, a detailed characterization of the impact of overpressure (different overpressure coefficients) on pore development characteristics is still lacking.
To address the gaps mentioned above, this study focused on three overpressured shale gas wells in southern Sichuan with pressure coefficients of 1.86 (Well Z202 in Dazu area), 2.04 (Well H202 in Yongchuan area), and 2.24 (Well L202 in Luzhou area). The study firstly conducted theoretical analyses and applied various geophysical logging methods to identify the dominant mechanisms of overpressure formation. Subsequently, it constructed geological models of typical wells by virtue of the basin modeling software, and restored the paleopressure by systematically analyzing fluid inclusion. Based on this, it employed a mathematical model to quantitatively characterize the entire process of pressure evolution. Based on the geological context, the study explored the reasons for the differential overpressure evolution. Finally, a comparative analysis of porosity and pore structure characteristics of reservoirs with different pressure coefficients was conducted to clarify the impact of overpressure on reservoir pore features.
The Sichuan Basin is located on the northwest margin of the Yangtze Platform, representing a superimposed basin controlled by multiple tectonic movements since the Sinian. It has sequentially deposited marine, transitional, and continental strata on the Epiproterozoic basement (Wang et al., 2015; Liu et al., 2022). During the Late Ordovician to Silurian, the deep-water continental shelf environment resulted the deposition of two sets of high-quality shale formations in the Sichuan Basin, i.e., the Wufeng Formation and the Longmaxi Formation, with a thickness ranging from 300 to 600 m (Fan et al., 2020; Wang et al., 2022c). The Wufeng Formation-Longmaxi Formation in the Sichuan Basin is a primary target for marine shale gas exploration and development in China (Li, 2023a). The Wufeng Formation is dominated by black siliceous carbonaceous shale, with the Guanyinqiao Member at the top conformable with the overlying Longmaxi Formation, featuring thin interbeds of shell limestone. The Longmaxi Formation’s organic-rich shale is mainly found in the Long 1 and Long 2 Member. The Long 1 Member is divided into the first sub-member (Long 11) and the second sub-member (Long 12). The lower part is characterized by predominantly carbonaceous shale, transitioning upwards into calcareous silty mudstone. The Long 11 Sub-member can be further subdivided into four beds: Long 111, Long 112, Long 113, and Long 114. In comparison with Long 1 Member, Long 2 Member has coarser grain sizes, primarily consisting of calcareous siltstone and calcareous silty shale (Ma et al., 2020). The Luzhou, Dazu, and Yongchuan areas in southern Sichuan have developed high-quality deep shale reservoirs of the Wufeng Formation-Longmaxi Formation, representing significant development areas with greater reserves. The Luzhou area is situated in a low-steepness tectonic zone, serving as a sedimentary center in southern Sichuan (Fan et al., 2024). The Wufeng Formation thickness ranges from 6 to 11 m. The Longmaxi Formation, thickest in southern Sichuan, has a thickness between 350 and 620 m, increasing gradually from south to north (Deng et al., 2021). The burial depth of the Wufeng-Longmaxi Formation here is relatively shallow in high structural areas, ranging from 2,700 to 2,800 m, and deeper in low structural areas, exceeding 3,800 m. The Dazu area lies at the junction of the moderately sloping and low-steepness tectonic zones in central Sichuan. The Wufeng Formation thickness is between 6.5 and 8.8 m. The Longmaxi Formation ranges from 200 to 530 m, with thickness increasing from north to south and stabilizing with distance from the denudation line. The burial depth of the Wufeng-Longmaxi Formation in the Dazu area mainly falls between 3,500 and 4,500 m (Li et al., 2022). The Yongchuan area is located in the gently folded zone of southeastern Sichuan, characterized by a “two depressions with one uplift between them” structural pattern. The Wufeng Formation-Longmaxi Formation is widely distributed here, with a sedimentary thickness of approximately 360–470 m. The overall variation in strata thickness is small, with burial depth gradually decreasing from northwest to southeast, generally ranging from 3,000 to 4,200 m.
Significant breakthroughs have been achieved in deep exploration, leading to the establishment of one development area (Block Well L203), three trial production areas (Block Well Z202, H202, and Y101), and an increase in deep shale gas production to 3 billion cubic meters. The pressure coefficient, indicating the ratio of actual fluid pressure to hydrostatic pressure at the same depth, is widely used to measure the intensity of formation pressure. Generally, a pressure coefficient less than 0.9 indicates abnormally low pressure, a coefficient between 0.9 and 1.2 suggests normal compaction, a coefficient between 1.2 and 1.8 indicates overpressure, and a coefficient exceeding 1.8 suggests strong overpressure. It is currently believed that under actual geological conditions, there are no strata with a pressure coefficient greater than 2.5, as pressures beyond this threshold may cause rock fracturing, leading to fluid migration along newly created conduits and subsequent reduction of the pressure coefficient to below the threshold (Tang et al., 2022). This research based on oilfield and published relevant data, presented the present-day pressure coefficient contour map of the Longmaxi Formation shale in southern Sichuan Basin (Figure 1). From the map, it is evident that the pressure coefficients in deep shale gas reservoirs in southern Sichuan are generally higher than 1.2. Specifically, the Yongchuan and Dazu areas have pressure coefficients ranging from 1.2 to 2.0, indicating varying degrees of overpressure, while the Luzhou area has an overall pressure coefficient exceeding 2.0, indicating strong overpressure. This study is a continuing study following our previous research of (Yin et al., 2023), but focused more on pressure evolution differences within three studied wells, and also its influence on reservoir pore characteristics.
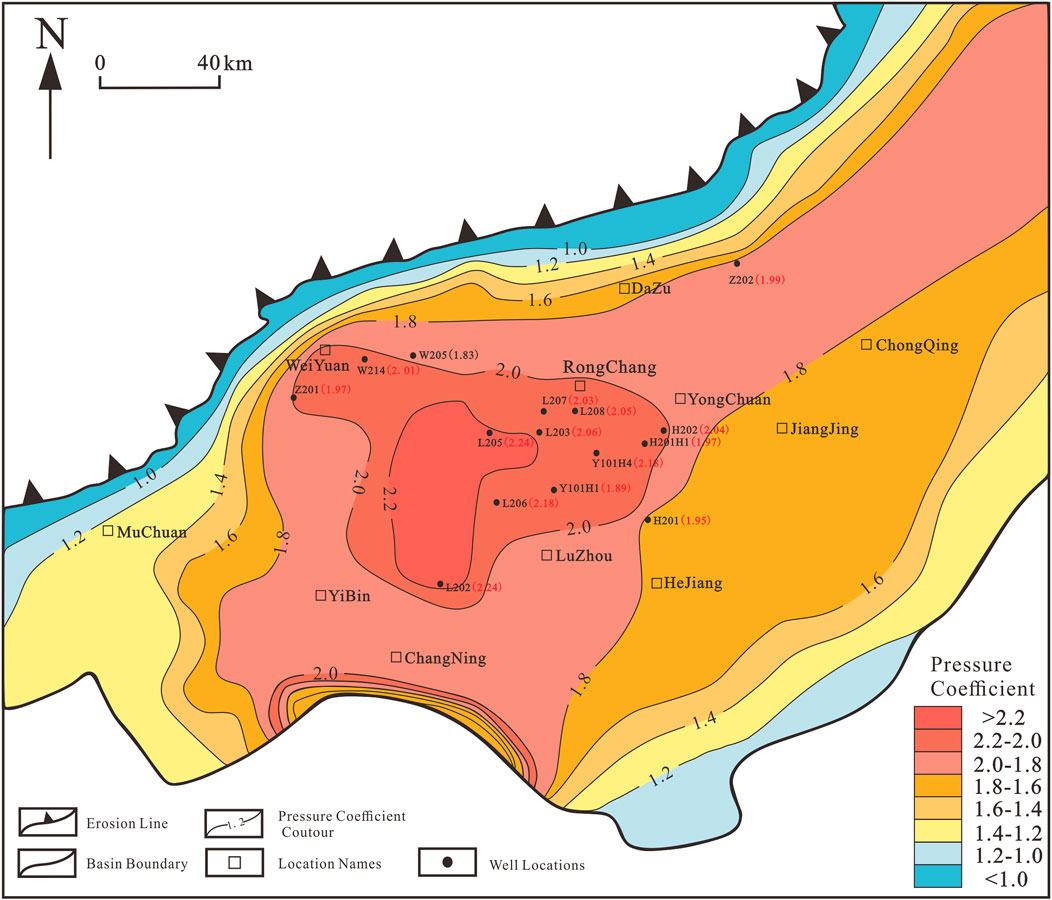
Figure 1. Planar distribution map of pressure coefficients in the Wufeng-Longmaxi formation shale gas reservoirs in the Southern and Southeastern Sichuan basin [adapted from Tang et al. (2022), with modifications].
Microscope equipped with transmission white light and incident ultraviolet light was used to observe fluid inclusions’ type and morphology in calcite veins. When the gas-liquid two-phase brine inclusions are artificially heated to a specific temperature, the multiphase state of the inclusions reverts to the initial single-phase fluid state, this specific temperature is homogenization temperature of the inclusion (Nie et al., 2020). By establishing a correlation curve between the Raman shift of methane gas and the pressure inside the inclusion, and based on the principle of maintaining constant total volume and composition of the inclusion, an iterative calculation model can be constructed to accurately calculate the capture pressure of the inclusion. The microthermometry measurements of thickly-polished sections were conducted using TH-600 Linkam heating platform, enabling determination of homogeneity temperature (Th) for gas-liquid two-phase brine inclusions with a reproducibility precision within ±0.1. Raman spectroscopic measurements were performed using JY/Horiba LABRAM HR800 raman spectroscopy equipped with a 532 nm green laser and output power ranging from 200 to 500 mW.
The ultra-high image resolution of focused ion beam-field emission scanning electron microscopy (FIB-SEM) enables effective observation of shale pore types and shapes. Prior to scanning, the shale sample is prepared into 1 cm2 before further SEM analysis. To enhance surface conductivity and obtain superior image quality, a Sputter Coater argon ion grinding instrument is utilized to uniformly plate the sample surface with gold. Finally, the Quanta250FEG is employed for controlled temperature (24 °C) and humidity level (35%) scanning of shale samples.
Under isothermal conditions, the specific surface area and pore size distribution of porous materials are determined through physical adsorption processes on the sample surface using gases at pressures below their saturation vapor pressure. The characterization methods commonly employed for assessing shale pore structure include nitrogen and carbon dioxide adsorption. Nitrogen adsorption is particularly suitable for characterizing mesopores (pore size range: 2–50 nm) within a testing range of 1–300 nm, while carbon dioxide adsorption primarily focuses on micropores (pore size range: 0.4–2 nm). Previous studies have demonstrated that consistent characterization results can often be obtained in the overlapping pore size range between these two methods, thereby providing a foundation for achieving comprehensive characterization of “nanoscale” pores spanning from micropores to mesopores (Clarkson et al., 2013).
Mercury exhibits non-wettability towards typical solids, necessitating the application of additional pressure to facilitate its penetration into shale pores. The extent of pressure directly influences the pore radius accessible by mercury intrusion, with higher pressures enabling entry into smaller pores. By quantifying the amount of mercury infiltrating the pores at varying pressures, we can accurately determine the corresponding pore volume for a given size. In this experiment, we employed a Quantachrome Poremaster-60 mercury porosimeter pore analyzer within a test range spanning from 3.5 to 106 nm. The principle underlying the mercury intrusion method is encapsulated by Washburn’s equation (Zheng et al., 2017),
where Pc is capillary pressure, MPa;
Helium porosity measurements were carried out with Ultrapore-300 using helium expansion. The shale was made into cylindrical samples with a growth degree of 2.5 cm and a diameter of 2.5 cm. Subsequently, the sample was placed in a vacuum drying oven at 105 °C overnight. The volumetric density of the shale samples was measured by a caliper, while bone density calculations were performed based on multiple helium expansions conducted on dry samples. Finally, the porosity of the shale was determined by assessing the disparity between its volumetric density and skeletal density.
The formation mechanisms of overpressure in typical sedimentary basins mainly include disequilibrium compaction, clay mineral transformation, tectonic compression, and hydrocarbon generation expansion. The overpressure origins in different lithologies generally exhibit variations and the causes of overpressure in source rocks often differ from those in non-source rocks. In general, overpressure in shale (source rock) is closely related to hydrocarbon generation and diagenesis, while overpressure in non-source rocks is often associated with disequilibrium compaction, diagenesis, or pressure transmission (Zhao et al., 2017). In recent years, an increasing number of scholars believe that overpressure resulting from disequilibrium compaction occurs in mechanically compacted environments at shallow burial depths with low geothermal gradients (less than 70 °C). In contrast, the formation of the overpressure in deeper burial environments is primarily attributed to hydrocarbon generation expansion, clay mineral diagenesis, and other non-under compaction factors, or a combination of both mechanisms.
Recently, the Asia-Pacific region has become a hotspot for overpressure research, including basins such as Malay and Balama in Southeast Asia, and Bohai Bay, East China Sea, and Sichuan in China. Scholars have deepened their understanding of overpressure causes, and particularly have discovered and confirmed those related to non-under compaction, such as hydrocarbon generation, montmorillonite-illite transformation, and tectonic compression. Overpressure formed by fluid expansion includes hydrocarbon generation, hydrothermal expansion, and oil cracking gas, etc. Different scholars in China propose various overpressure causes for different shale gas reservoirs. For example, in the Yangtze region, mechanisms for pressure increase in gas-bearing shale intervals mainly include structural, hydrocarbon generation, and clay mineral dehydration-induced pressure increments (Li et al., 2016; Tang et al., 2022; Wang et al., 2022c) used log curve combinations to determine that the overpressure in the Wufeng-Longmaxi shale in the Chongqing and Fuling areas of the Sichuan Basin is attributed to hydrocarbon generation expansion. However, (Wu et al., 2022), suggested that the overpressure of the Haynesville and Barnett shales in the United States and the Jiaoshiba shale gas field in Chongqing are mainly caused by structural pressure due to the retention of natural gas caused by rapid short-term uplift. Hydrothermal pressure is the primary cause of early overpressure in shale gas reservoirs, while clay mineral dehydration occurs with increasing burial depth. For moderately to highly mature shale, the overpressure mechanism of oil cracking gas expansion is receiving increasing attention, though there are many challenges in the application of empirical methods. The traditionally belief that abnormal compaction trends in acoustic travel time/velocity deviation represent disequilibrium compaction has been increasingly challenged by scholars. Due to the complexity of overpressure causes and the diversity of factors affecting log results, log curve combination methods are widely applied (Wang Z.L. et al., 2003).
Overpressure related to hydrocarbon generation expansion manifests as abnormally high resistivity and acoustic transit time in logging responses, with density remaining constant or slightly decreasing. Clay mineral transformation alters and disrupts shale microstructure, leading to further densification and reduced porosity as well as abnormally high acoustic transit time and density. Tectonic compression essentially enhances the compaction effect of rocks; hence, generated overpressure does not cause significant anomalies in these three logging responses. In addition, some researchers believe that the synchronous occurrence of log curve inversions is crucial for the analysis of overpressure causes. (Bowers, 2002). suggested that if the inversions of sonic velocity, resistivity, and density logs are not synchronous, and the density inversion lags, it indicates strong overpressure. Meanwhile it reflects possible causes such as fluid expansion, montmorillonite-illite transformation, pressure transmission, or tectonic loading. Specifically, for overpressure caused by fluid expansion, the inversion of sonic velocity and resistivity is more significant than that of density.
From the log curves of Well L202 in the Luzhou area, it can be observed (Figure 2B) that the acoustic transit time and resistivity of the siliceous shale of the Wufeng Formation and the Long 11 Sub-member (depth 4,230–4,320 m) show a noticeable increase compared with the overlying argillaceous shale of Long 12 Sub-member and Long 2 Member. But the density data exhibit a certain decrease. Logging responses of Well H202 and Z202 (Figures 2A–C) shows similar changing patterns indicating similar causes. These phenomena reveal the presence of significant overpressure, and the formation of overpressure is related to hydrocarbon generation expansion. This study also conducted research in other major shale gas production areas in China, and found similar examples include the Dazu area, Yongchuan area, and Jiaoshiba area. However, in the Luochang-Jianwu composite anticline of the northern Zhaotong area, the pressure values range between 1.75 and 1.98, and the inversion characteristics of log curve combination are different. The log curve of typical Well YS108 displays a decrease in sonic velocity, an increase in resistivity, and a decrease in density in the main producing beds of Long 111, Long 112, and Long 113 (Figure 3). The Zhaotong demonstration area is located on the southern margin of the Sichuan Basin, where structural reworking is relatively strong, and deformation zones are evident. The Jianwu composite anticline is located in a tectonic transition zone, and it is inferred that the overpressure may be caused by a composite origin of tectonic compression and hydrocarbon generation expansion. In addition to the Sichuan Basin, scholars have also studied the causes of overpressure in other areas in China by using the combination analysis of logging curves. Bozhong Sag shows the inversion of acoustic transit time and resistivity, and the density decreases slightly, which is considered to be the overpressure caused by hydrocarbon generation expansion (Yang et al., 2023). In Junggar Basin, the inversion depth of the density curve lags behind the acoustic time difference and the resistivity curve, which is considered to be the cause of fluid expansion or pressure conduction (Li et al., 2020).
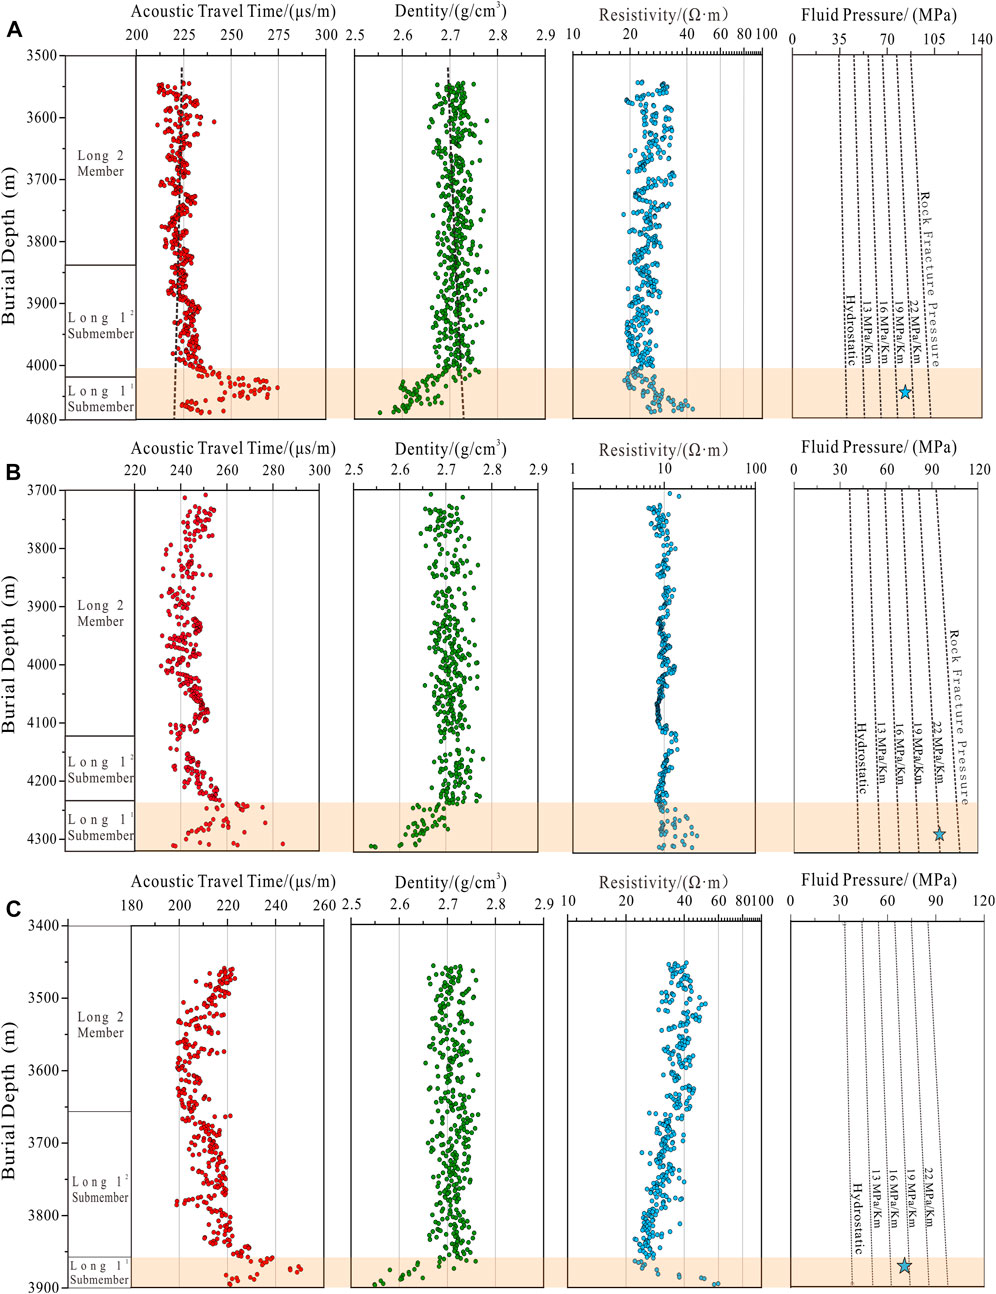
Figure 2. Overpressure distribution and causes identified from logging responses in the deep Longmaxi formation Shale of well H202 (A), L202 (B), and Z202 (C) in the southern Sichuan basin.
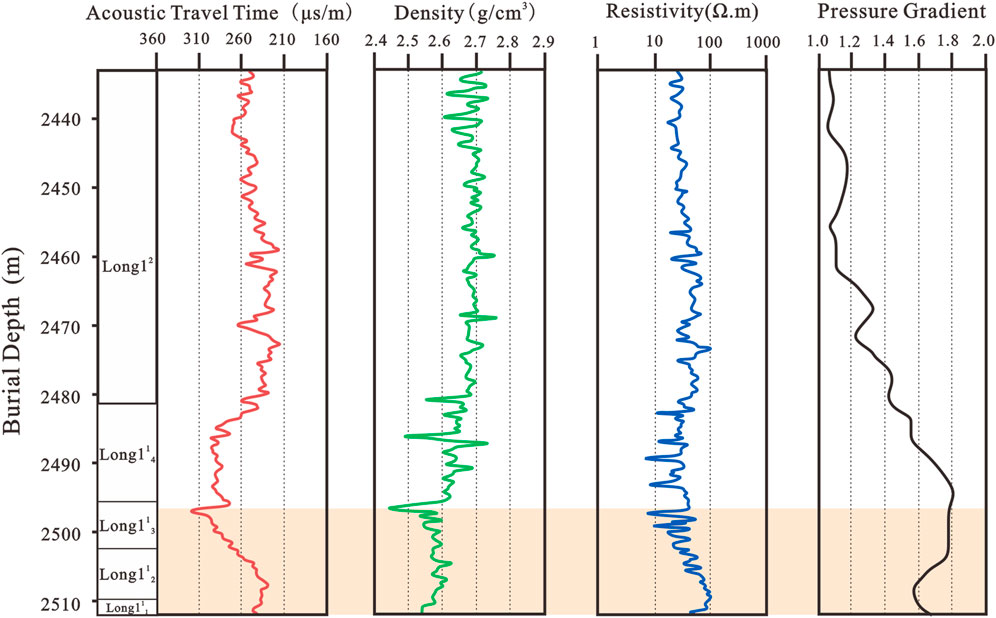
Figure 3. Overpressure distribution and causes identified from logging responses in the Longmaxi formation shale of well YS108, Zhaotong area, Southern Sichuan basin [modified from Chen et al. (2016); Rui et al. (2021)].
The classic application of the sonic velocity-density crossplot is illustrated in Figure 4A. Generally, overpressure and normal pressure formed by disequilibrium compaction falls on the loading curve. Overpressure formed by other mechanisms, on the other hand, tends to lie outside the loading curve (Conner et al., 2011; Tingay et al., 2013). Specifically, overpressure generated by fluid expansion mechanisms such as gas generation leads to a decrease in sonic velocity with increasing overpressure, while density remains unchanged or changes minimally. From the sonic velocity vs. density crossplot of three typical wells in the study area, it can be observed that data points from the normally pressured Long 2 Member and Long 12 Sub-member show an increase in sonic velocity with increasing density, forming the loading curve. In contrast, data points from the strongly overpressured Long 11 Sub-member deviate from the loading curve and do not follow the trend of the typical crossplot (Figures 4B–D). The overpressure data points in typical crossplot fall on or to the right of the loading curve. However, due to the slight reduction in density influenced by organic matter enrichment, the overpressure data points in the study area shift slightly to the left. Therefore, there could exist some controversy in using the sonic velocity vs. density crossplot to determine the dominant cause of overpressure.
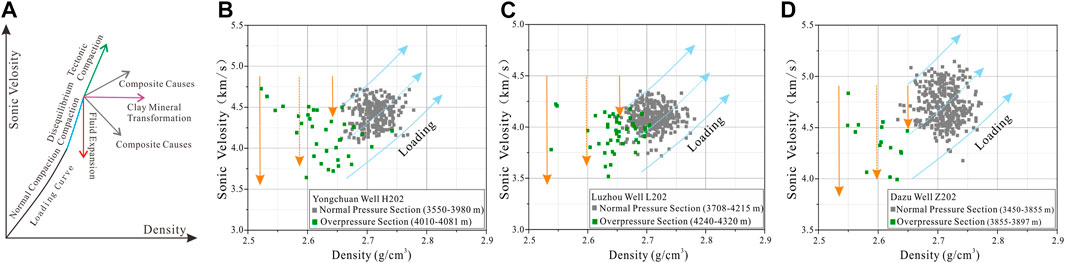
Figure 4. Typical plot for identifying shale overpressure using density vs. Sonic velocity crossplot (Zhao et al., 2017) (A), Crossplots for density vs. Sonic velocity in the deep Longmaxi formation shale of Southern Sichuan Basin (B–D).
In addition to the abovementioned methods, there are other techniques for identifying the causes of overpressure, such as the porosity comparison method and pressure retrograde calculating method. The identification of overpressure causes requires a combination of various empirical methods, especially the comprehensive analysis of multiple factors (e.g., geological environments) affecting overpressure formation and distribution. Traditionally many scholars believed that in relatively young sedimentary environments with high sedimentation rates and low geothermal gradients, the primary formation mechanism of overpressure is disequilibrium compaction. However, it has been found that overpressure, whether in young basins with high sedimentation rate or pre-Cenozoic basins with lower sedimentation rate, is rarely dominated by disequilibrium compaction. On the contrary, overpressure is commonly associated with fluid expansion, diagenesis, tectonic compression, and pressure transmission (Zhao et al., 2017). Specifically, for the shale of the Wufeng Formation to the Longmaxi Formation in the Sichuan Basin, hydrocarbon generation, especially gas generation, is identified as the most important mechanism for overpressure during the shale burial stage.
After undergoing burial processes, the shale of the Wufeng Formation to the Longmaxi Formation experienced a series of changes during the later stages of intense uplift, including a reduction in overlying load, temperature decrease, and cap rock denudation. Consequently, both pressure and pressure coefficients changed correspondingly. In comparison with the relatively consistent understanding of the mechanism for hydrocarbon generation-related overpressure, there is substantial difference between scholars regarding the impact of tectonic uplift movements on pressure. Qiu et al. (2020) argued that after strata uplift, the reduction in overlying pressure leads to the expansion of pore volume and fluid volume. Due to the higher fluid compressibility compared with rock, the expansion of fluid volume is slightly greater than that of pore volume, resulting in an increase in fluid pressure since confined fluids cannot be expelled. Gao et al. (2008); Yuan et al. (2020), on the other hand, proposed that during the uplift and denudation process, the reduction in overlying load leads to rebound in pore volume, while the contraction of pore fluid causes an increase in pore volume, fundamentally leading to the abnormal low pressure. Katahara and Corrigan, (2004) suggested that as the tectonic uplift process continues, the decrease in formation temperature causes both rock pore volume and fluid volume to contract. As the thermal expansion coefficient of fluid is greater than that of rock, the contraction of fluid volume is greater than that of pore volume, resulting in a decrease in formation pressure. Some scholars believe that the reduction in load leads to the expansion of pore and fluid, and the expansion of pore causes a decrease in formation pressure. During the later stages of uplift and unloading, pore rebound and temperature decrease lead to a decrease in formation pressure. However, since the hydrostatic pressure also significantly decreases, the formation pressure coefficient depends on the relative decrease (Ma et al., 2011). Additionally, uplift denudation causes brittle failure and overpressure rupture in rock layers, thus the generated overpressure fractures could result in shale gas loss and pressure release, resulting in a decrease in formation fluid pressure coefficient (Li., 2022). However, different wells may have different pressure coefficients, possibly related to the degree of fracture overpressure closure influenced by the shale over-consolidation ratio (OCR). When overpressure decreases to a certain level, fractures undergo overpressure closure, and OCR affects the way of shale damage and the degree of fracture closure, thereby controlling the extent of shale gas loss damage and the current formation pressure (Yuan et al., 2020). In general, during the uplift process, the formation water content in organic pores is low in the Silurian shale gas reservoir, and the effect of formation water contraction due to temperature decrease on the reservoir space can be ignored. Therefore, the changes in fluid pressure and pressure coefficients during the uplift process depend on the overall effects of pore rebound, temperature decrease, and overlying strata unloading.
Basin simulation, numerical simulation, and paleo-pressure reconstruction are the three most commonly used methods for studying the pressure evolution process in geological formations. Basin simulation involves setting key parameters to consider the influence of various geological factors and then simulating the evolution curve of formation pressure through software algorithms. The advantage of this method lies in its ability to quantitatively characterize the pressure characteristics of the entire evolution process. However, its accuracy is influenced by the software algorithm, the key parameter setting, and relevant geological factors. Numerical simulation applies appropriate computational models, combining with the main controlling factors of pressure evolution, to quantitatively calculate the entire process of pressure evolution. The accuracy of the results is influenced by the considered controlling factors and input parameters. Paleo-pressure reconstruction involves calculating ancient pressure and pressure coefficients using various methods based on burial history and thermal history. It provides a relatively quantitative description of the changes in formation pressure and pressure coefficients during geological periods. The advantage is the accuracy of the reconstruction results. But its limitation lies in only being able to clearly describe the pressure characteristics and changes at one or several moments, but unable to quantitatively characterize pressure features at any given moment or describe the entire pressure change process. Various scholars have conducted pressure evolution history reconstructions of the Longmaxi Formation shale in the Sichuan Basin using multiple methods (Li et al., 2016; Yuan et al., 2020; Liu et al., 2021; Wu et al., 2022). However, the shortcomings of the research methods introduce some uncertainty into the evolution results. In recent years, a new method combining basin simulation, numerical simulation, and paleo-pressure recovery has been proposed for studying the pressure evolution of geological formations (Qiu et al., 2020). This method has been successfully applied in the evaluation of pressure evolution in the Longmaxi Formation shale on the southeast margin and basin margin of the Sichuan Basin, the Ordovician strata in North Tarim uplift of the Tarim Basin, and the Permian strata in the Sulige Gas Field of the Ordos Basin (Qiu et al., 2020; Tang et al., 2022). This method first constructs a geological model (burial history-thermal history) using basin simulation software, then uses the corresponding mathematical model to quantitatively calculate the contributions of various factors after determining the dominated controlling factors of pressure evolution, and finally achieves a quantitative characterization of the entire pressure evolution process under the constraints of paleo-pressure recovery values and current pressure measurements. Thus, it can provide relatively accurate results and visually display pressure characteristics at different historical periods. Therefore, this study will apply this new method to recover the pressure evolution history of the deep Longmaxi Formation shale in the southern Sichuan in the entire process of sedimentary subsidence to structural uplift.
Using basin simulation software to build a geological model and achieve the quantitative characterization and dynamic analysis of the petroleum geological characteristics of petroliferous basins is of significant theoretical importance for studying the mechanisms of oil and gas generation, accumulation, and migration. In this study, the Petromod software’s one-dimensional basin simulation technology was first employed. This study set various input parameters, such as the geological age, thickness, lithology, measured formation temperature, and vitrinite reflectance of each stratum. Subsequently, a geological model (burial history-thermal history-maturity history, Figure 5) of the deep Longmaxi Formation shale in Well H202 of the Yongchuan area was constructed, laying the foundation for the recovery of the pressure evolution history. The simulation results show that the evolution of the target layer can be divided into two stages. 1) A long-term subsidence stage (444–65 Ma), during which the shale underwent two rapid subsidence events, two slow subsidence events, and three weak uplift events. By 65 Ma, the maximum burial depth of the shale reached 6,700 m. The formation temperature increased from 25°C to 210°C, and the organic matter maturity increased from 0.2% to 2.7%. 2) A late strong uplift stage (650 Ma), during which the shale continued to experience strong uplift, with the current burial depth being approximately 4,100 m. The formation temperature decreased from 210°C to 129°C, while the organic matter maturity remained stable. Finally, the evolution curve of maturity over time obtained through simulation matched well with the measured equivalent vitrinite reflectance, validating the reliability of the geological model.
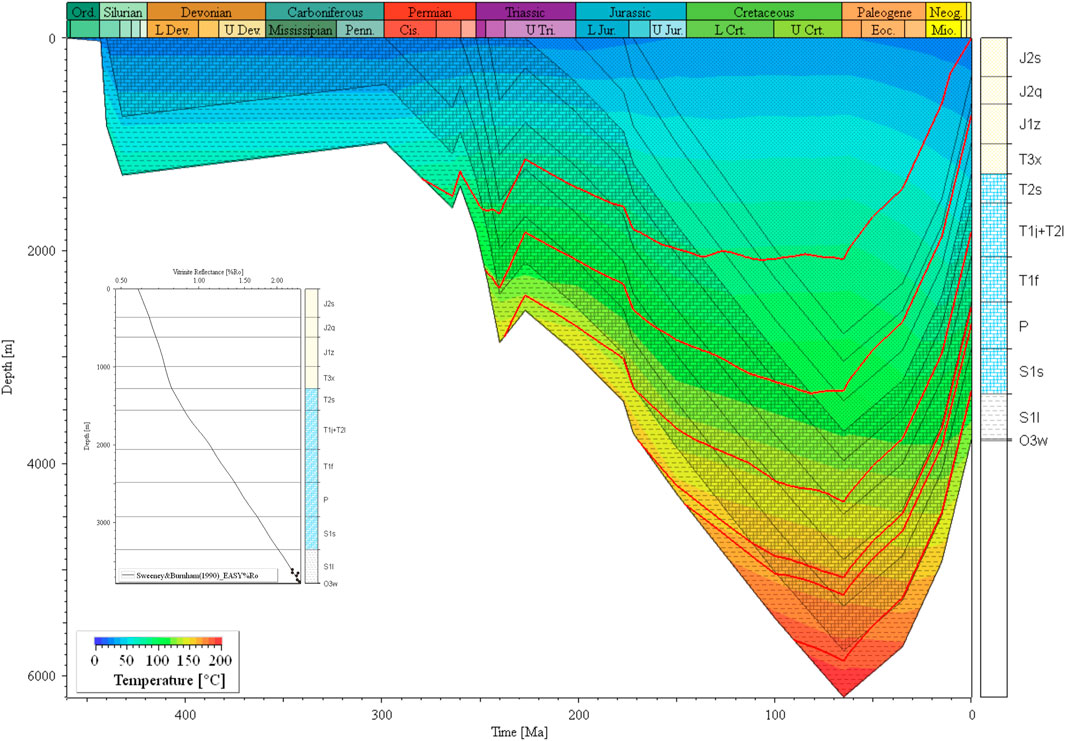
Figure 5. Burial history, thermal history, maturity evolution history, and geological model calibration results of Well H202 in Yongchuan area.
The mechanisms behind the formation of overpressure in sedimentary basins are diverse. Previous researchers, based on theoretical analyses of the geological background for overpressure formation and qualitative assessments of well log anomalies, have clarified that hydrocarbon generation expansion mechanisms (oil generation from kerogen, retained oil cracking into gas) are the dominant mechanisms for the formation of overpressure in the Longmaxi Formation shale in southern and southeastern Sichuan while the contributions from mechanisms such as disequilibrium compaction, clay mineral diagenesis, and tectonic compression are relatively insignificant (Gao et al., 2019; Tang et al., 2022). The above understanding indicates that during the long-term subsidence stage, the primary controlling factor for pressure evolution in the Longmaxi Formation shale is hydrocarbon generation. Therefore, this study utilizes a mathematical model of pressure enhancement by hydrocarbon generation (Guo et al., 2011) to quantitatively calculate the pressure and pressure coefficients of the Longmaxi Formation shale at different times.
Previous studies, through thermal simulation experiments and the proportions calculation of retained oil cracking gas using a mixture of methane and ethane end-members in the shale gas production areas of the Sichuan Basin, have shown that the proportion of retained oil cracking gas in natural gas ranges between 60% and 80%, while the proportion of kerogen cracking gas is relatively low (Zhang et al., 2018; Guo et al., 2020). For the Longmaxi Formation shale, the pressure enhancement model by hydrocarbon generation mainly considers two processes: kerogen thermal cracking to generate oil (Ro: 0.5%–1.3%) and crude oil cracking to generate gas (Ro: >1.3%). The detailed numerical simulation model assumption and calculation equations could be found in Yin et al. (2003). Table 1 shows the calculation result of pressure and pressure coefficients for the Longmaxi Formation shale gas reservoir in Well H202 from Yongchuan area. The final reservoir pressure reached 140.55 MPa with pressure coefficient being 2.09.
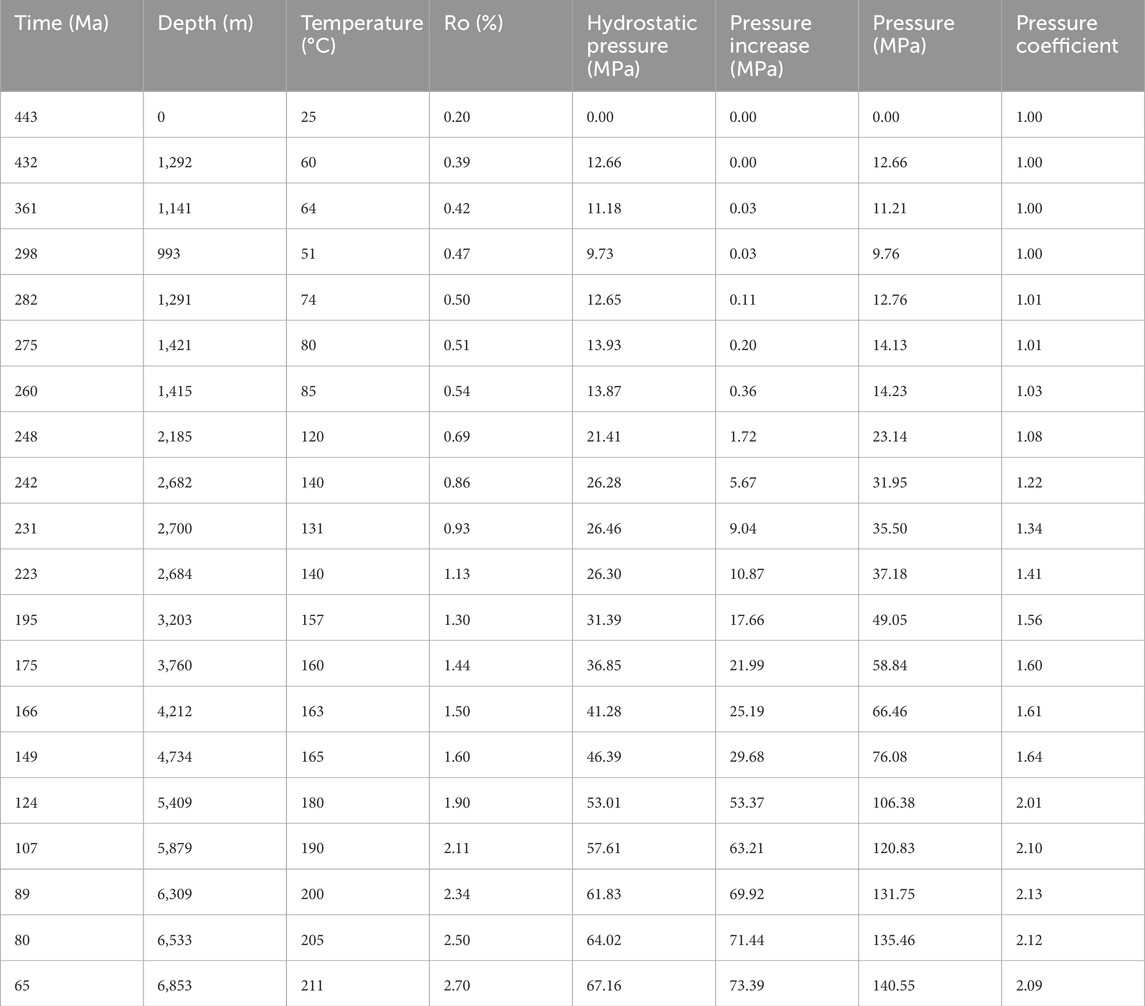
Table 1. Calculation results of pressure and pressure coefficient for the Longmaxi Formation shale gas reservoir in Well H202, Yongchuan area.
Taking well H202 in the Yongchuan area as an example, the depth, temperature, conversion rate, and cracking rate corresponding to the key time points in the geological model (such as the start of oil generation, peak oil generation, and crude oil cracking into gas) are introduced into the pressure enhancement model by hydrocarbon generation. Thus the pressure evolution curve of the shale during the subsidence stage is drawn (Table 1; Figures 7A, D). The pressure evolution of the Longmaxi Formation shale in the Yongchuan area can be divided into three stages based on the reservoir pressure state: 1) Normal pressure stage (Silurian to Early Triassic, 443–242 Ma): The shale experienced rapid and large-scale subsidence in the Silurian, and from the Ordovician to the Permian, it continued to experience slight uplift. Until the Early Triassic, it remained in a shallow burial state, and the organic matter was still in the immature to low-mature stage, with relatively limited hydrocarbon generation. Therefore, during this period, the pore fluid pressure in the shale was roughly equal to the hydrostatic pressure, indicating normal pressure conditions. The pore fluid pressure in the shale reached approximately 23.14 MPa by the Early Triassic, corresponding to a pressure coefficient of about 1.08; 2) Overpressure stage (Early Triassic to Early Jurassic, 242–195 Ma): The shale underwent slight uplift in the Middle to Late Triassic, followed by continued subsidence, increased formation temperature, and an increase in thermal maturity from 0.7% to about 1.3%. During this process, hydrocarbons continuously generated by the thermal cracking of kerogen accumulated in the shale, gradually forming overpressure (Wei et al., 2022). By the Early Jurassic, the cumulative pressure increase in the shale due to oil generation was approximately 17.66 MPa, and the pore fluid pressure reached about 49.05 MPa, corresponding to a pressure coefficient of about 1.56; 3) Super-strong overpressure stage (Early Jurassic to Late Cretaceous, 195–65 Ma): The shale experienced substantial subsidence during this period, with organic matter maturity increasing from 1.30% to 2.70%. The crude oil retained in the shale cracked to generate a large amount of natural gas, significantly increasing fluid pressure and forming strong overpressure. At the maximum burial depth, the cumulative pressure increase in the shale due to oil generation was approximately 55.73 MPa, and the pore fluid pressure reached about 140.55 MPa, corresponding to a pressure coefficient of about 2.09.
Fibrous calcite veins developed in shale fractures are considered products of overpressure fluid activity (Meng et al., 2017; Wu et al., 2021). Fluid inclusion types, compositions, temperatures, and salinities within these veins are analyzed using techniques such as lithofacies observation, laser Raman spectroscopy, and micro-thermometry, which provides insights into fluid activity periods, allowing for the reconstruction of paleo-geothermal and paleo-pressure conditions. Taking the deep Yongchuan area in southern Sichuan as an example, the Longmaxi Formation shale exhibits a variety of fracture forms, dominantly characterized by extensional-shear fractures. Fibrous calcite veins are widely developed within the layers, often appearing in high-angle or nearly vertical orientations (Figure 6A). Lithofacies observations of the inclusions reveal that the fibrous calcite veins mainly contain single-phase methane inclusions and gas-liquid two-phase brine inclusions (Figure 6B). Among them, discretely dispersed single-phase methane inclusions exhibit characteristics of low transparency, with bright centers surrounded by a darker rim, primarily in the form of quadrilaterals and sub-rounded shapes. Gas-liquid two-phase brine inclusions are observed as colorless, transparent entities with small gas bubbles, predominantly in sub-rounded, irregular elliptical, and elongated forms, commonly coexisting with methane inclusions.
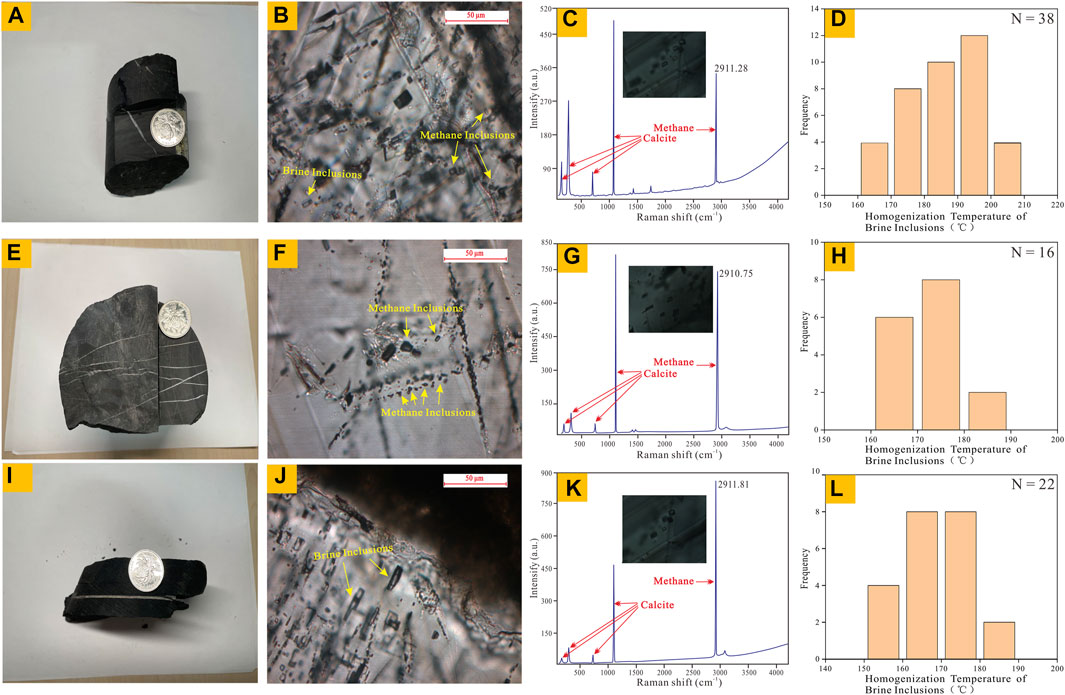
Figure 6. Characteristics of fibrous calcite veins in the Longmaxi formation shale of well H202 in the Yongchuan area (A), Petrographic features of methane and brine inclusions within the veins (B), Laser Raman spectrum of methane inclusions (C), Homogenization temperatures of gas-liquid two-phase brine inclusions, N represents the number of inclusions analyzed (D), Analysis results of vein and inclusions of well L202 in the Luzhou area (E–H) and well Z202 in the Dazu area (I–L).
Laser Raman spectroscopy analysis of single-phase methane inclusions shows strong characteristic peaks only for the host mineral calcite (at wavenumbers approximately 156 cm-1, 283 cm-1, 713 cm-1, and 1,086 cm-1) and methane fluid (at wavenumber approximately 2,911.28 cm-1), without other prominent Raman characteristic peaks observed (Figure 6C). This indicates that methane inclusions developed in calcite veins exhibit high methane purity. The wavenumber (Vd) of the characteristic peaks of methane fluid is a key parameter for calculating the density of individual methane inclusions. By introducing the measured peak wavenumbers of methane inclusions into an empirical formula based on a large amount of experimental data (Zhang et al., 2016), the density value of methane inclusions is calculated to be 0.261 g/cm3, which exceeds 0.130 g/cm3, so it is classified as a supercritical high-density methane inclusion. It provides favorable conditions for the accurate calculation of capture pressures.
From 150°C to 180°C, and 180°C–204°C. Those main maximum temperature data in L202 shows a unimodal distribution from 160°C to 180°C.
Micro-thermometry results of gas-liquid two-phase brine inclusions in well H202 and Z202 indicate a double peaks distribution of homogenization temperature (Figures 6D, L), ranging the geological model, the latest formation time of the veins is estimated to be approximately 15 Ma. Finally, the calculated density of methane inclusions and the measured minimum homogenization temperature of brine inclusions are input into the state equation of the supercritical methane system established by Duan et al. (1992). This yields the paleo-pressure of the Longmaxi Formation shale, and in conjunction with the geological model, the paleo-pressure coefficient is calculated. In the Yongchuan area, the Longmaxi Formation shale at 15 Ma, with a burial depth of 5,450 m in Well H202 exhibits a formation temperature of 165°C and a formation pressure of 95.21 MPa, corresponding to a pressure coefficient of 1.78. The differences between H202, Z202 with L202 indicate a greater uplifting process occurred in Yongchuan area compared to Dazu and Luzhou, which coincide with evolutionary models of pressure and pressure coefficient in those wells (Figure 8).
The extremely high pressures in fluid inclusions pose significant challenges for traditional microthermometry and pressure calculations. Wang et al. (2022a) used hydrothermal diamond-anvil cell (HDAC) to study fluid inclusions in fracture calcite and quartz veins from the Silurian Longmaxi Formation black shale in the eastern Sichuan Basin, ensuring the isochoricity of the fluid system and obtaining effective homogeneous temperatures; Raman spectroscopy quantitative analysis was applied to determine the composition of the inclusions, and the trapping pressure of single-phase gas phase inclusions coexist with brine inclusions was determined based on the state equation of the CH4-CO2 system, so as to overcome the problem of homogeneous pressure in gas-liquid two-phase inclusions exceeding the pressure range exceeding lithostatic pressure according to burial history curves. This provides direct geological evidence for generating extremely high-pressure fluids during hydrocarbon of the existing NaCl-H2O-CH4 system state equation. The results showed that the pressure of methane-rich ancient fluids can reach 2,310 bar, significantly generation processes. Figure 7 compared the result of temperature measurement in traditional heating stage and HDPC. When the inclusions are heated and quenched in the HDAC with a suitable external pressure, it can be found that the inclusions return to their pre-heating form.
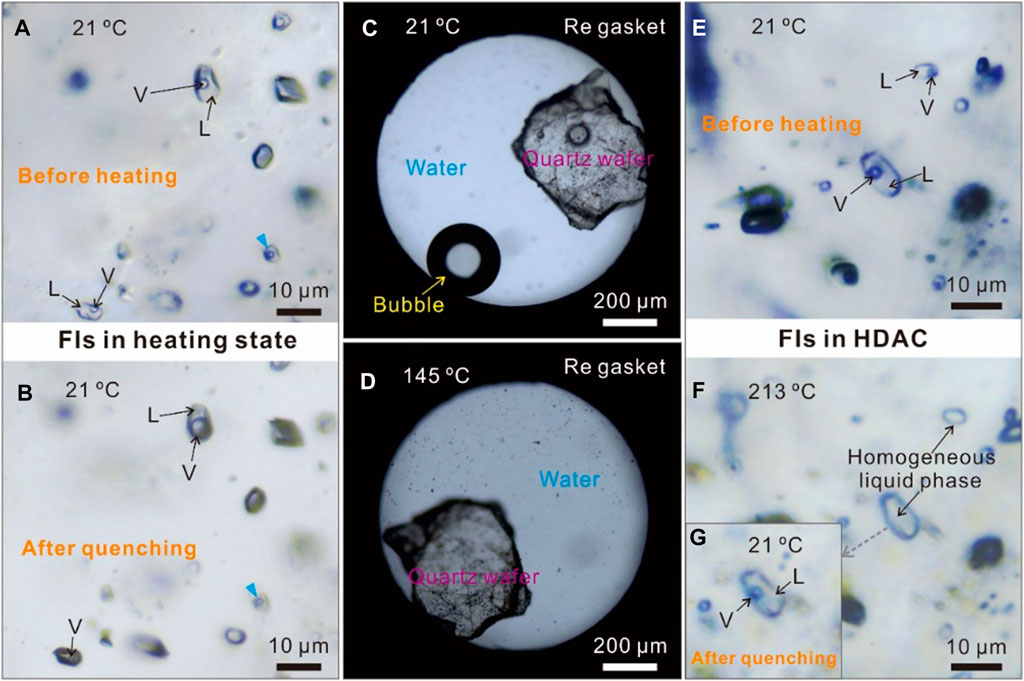
Figure 7. Comparison of temperature measurement results of inclusions (FI) in traditional heating stage (A,B) and HDPC (C–G) [adopted from Wang et al. 2022b].
Shales remained strong overpressured at present suggesting closed fluid systems and little gas loss. During the uplift and denudation stage, the hydrocarbon generation process of shale tends to stagnate. The main controlling factors of the pressure evolution change. Effects such as gas escape, temperature reduction, and pore rebound gradually alter fluid pressures during the uplift process (Xu et al., 2010; Wu et al., 2022). Tang et al. (2022) argued that the porosity and permeability of shale undergo rapid decline during burial, and cannot be restored to their initial state during uplift, resulting in a hysteresis rebound phenomenon. Consequently, it is imperative to consider this factor in calculations. Therefore, the subsequent equation was employed for computation,
Where,
However, Li et al. (2016) and Gao et al. (2019) proposed that Longmaxi Formation shale predominantly develops micro- and nano-scale pores, and the rebound degree does not significantly change with increasing denudation thickness. Hence its impact on pressure evolution is negligible.
In the uplift stage of Longmaxi Formation shale, a temperature decrease of approximately 80 °C inevitably led to changes in formation pressure. We employed two methods for pressure evolution during tectonic uplift. The first commonly used Soave-Redlich-Kwong (SRK) state equation is employed to quantitatively calculate the influence of temperature changes on fluid pressure in the gas reservoir during the uplift process. The calculation formula is as follows:
Where, P represents pressure (MPa); T is temperature (K); V is molar volume of the gas (cm3/mol); R is the gas constant (8.314 J/mol/K); a(T) denotes inter-molecular attraction; b is the volume of gas molecules; ω is the acentric factor of the gas; Tc and Pc are the critical temperature and pressure of the gas (190 K, 4.599 MPa); Tr is the relative temperature of the gas, i.e., the ratio of the actual absolute temperature to its critical temperature.
The second method is the equation of state (EOS) for supercritical CH4 system by Duan et al. (1992). The main factors affecting pressure changes in shales are temperatures and gas escape, which has a linear relationship with gas density. The gas volume or gas density can be evaluated by the equation of state for supercritical CH4 system (Duan et al., 1992).
Empirical parameters
For Well H202 in the Yongchuan area, the temperature data during the uplift stage is substituted into the above equation to calculate the pressure drop due to temperature decrease, which is equal to 27.99 MPa. The pressure drop caused by gas escape can be calculated by balancing the currently measured pressure values with the theoretical pressure values at the maximum burial depth. According to the first sets of calculation. The initial fluid pressure of the shale in Well H202 during the early uplift stage is 140.55 MPa, and the currently measured formation pressure is 81.63 MPa, resulting in a total pressure drop of 58.93 MPa. The pressure drop due to temperature decrease is 27.99 MPa, and the pressure drop due to gas escape is 30.94 MPa. Following method 2, the gas density in studied over-pressured shales is ∼0.206 g/cm3, and the gas density was ∼0.255 g/cm3 at maximum burial depths. Comparing the initial pressure before tectonic uplift and the present-day pressure coefficient, the loss of shale gas is ∼15.5% of the initial total gas content. If pore rebound is taken into account, the pressure drop is calculated to be 27 MPa. Combining those above calculated values, restored paleo-pressure values, and currently measured pressures, the pressure evolution curve during the uplift stage of the shale in Well H202 is plotted (Figures 8A, D). It can be observed that fluid pressure shows a decreasing trend during the uplift stage, but the evolution of the pressure coefficient has a turning point, exhibiting a trend of initially decreasing and then increasing. This phenomenon arises because the early fluid pressure drop is greater than the overlying strata pressure drop, while the late-stage fluid pressure drop is less than the overlying strata pressure drop. The homogenization temperature test results of inclusions provide the essential reasons for this phenomenon. The homogenization temperature of inclusions in Well H202 ranges from 165°C to 204°C, corresponding to capture time from 65 to 15 Ma. This indicates that during this period, fractures opened to allow extensive gas escape, thus fluid pressure drop was significant. No inclusions below 165°C were found, suggesting that from 15 to 0 Ma, fractures closed to limit gas escape, and the fluid pressure drop was smaller. Therefore, based on the differences in controlling factors, the pressure evolution during the uplift process of the Longmaxi Formation shale in Well 202 can be divided into two stages: 1) Early Paleogene to Middle Neogene (65–15 Ma), the shale fluid pressure dropped from 140.55 MPa to 95.21 MPa. The pressure drop due to temperature decrease is 15.74 MPa, and the pressure drop due to gas escape is 29.60 MPa. During this period, strata denudation caused a decrease in overlying strata pressure by 13.63 MPa, which is less than the fluid pressure drop, resulting in a decrease in the pressure coefficient from 2.09 to 1.78; 2) Middle Neogene to Present (15–0 Ma), the shale fluid pressure dropped from 95.21 MPa to 81.63 MPa. The pressure drop due to temperature decrease is 12.25 MPa, and the pressure drop due to gas escape is 1.33 MPa. During this period, strata denudation causes a decrease in overlying strata pressure by 13.61 MPa, slightly higher than the fluid pressure drop, resulting in an increase in the pressure coefficient from 1.78 to 2.04. Throughout the entire uplift process, fluid pressure has not reached the fracture limit of the rock, and gas pressure release mainly occurs through diffusion or structural fracture. Uplifting caused gas escape in Luzhou area is not as heavy as in Dazu and Yongchuan (Figures 8B–F).
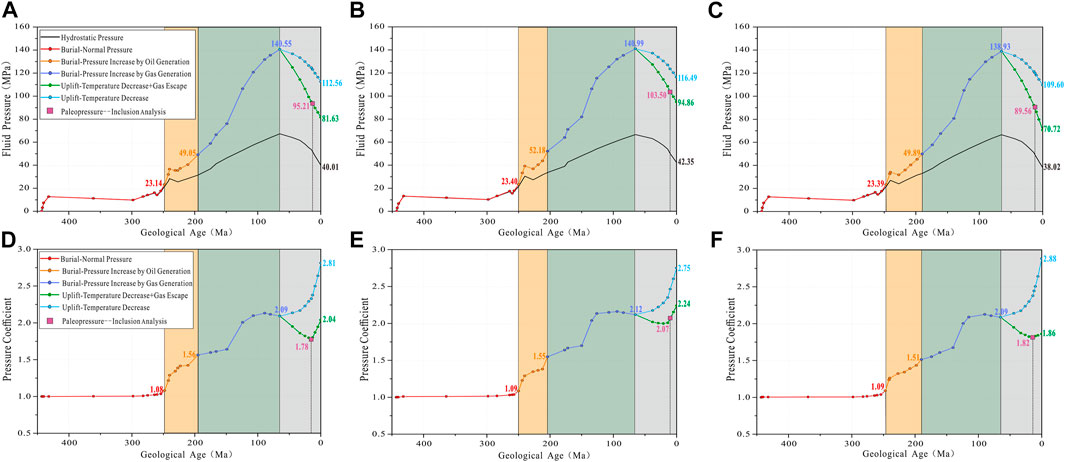
Figure 8. Evolutionary models of pressure and pressure coefficient in the deep Longmaxi formation shale gas reservoirs in the Yongchuan Area (A,D), Luzhou area (B,E), and Dazu area (C,F).
Pressure evolution histories of the deep Longmaxi Formation shale were individually established for Well L202 in Luzhou area, and Well Z202 in Dazu area (Figures 8B,C,E,F). A comparative analysis reveals similarities in pressure evolution during the sedimentation–subsidence stage. Both shales exhibit intense overpressure due to hydrocarbon generation, reaching a formation pressure of approximately 140 MPa and a pressure coefficient of about 2.10 at the maximum burial depth of approximately 6,700 m. However, differences emerged during the uplift–denudation process. The Luzhou area experienced the smallest decrease in formation pressure (pressure drop due to temperature decrease and gas escape are 24.50 MPa and 21.63 MPa, respectively). Consequently, the current formation pressure and pressure coefficient are the highest, equal to 94.86 MPa and 2.24, respectively. Conversely, the Dazu area witnessed the largest decrease in formation pressure (pressure drop due to temperature decrease and gas escape are 29.33 MPa and 38.88 MPa, respectively). Thus, the current formation pressure and pressure coefficient are the lowest, equal to 70.72 MPa and 1.86, respectively. This discrepancy reflects variations in gas reservoir preservation conditions. The Luzhou area, situated within the internal part of the gently inclined tectonic zone in southern Sichuan, is featured by limited large faults and primarily small faults. The extent of shale gas escape and the pressure drop are relatively low, resulting in current gas reservoir pressure coefficients generally ranging from 2.0 to 2.4. Conversely, the Dazu area, located at the boundary of the southern and central Sichuan tectonic zones, hosts several large faults trending northeast to southwest. This may contribute to relatively higher shale gas escape and pressure drop, resulting in overall pressure coefficients ranging from 1.8 to 2.0.
Observations using high-resolution scanning electron microscopy revealed diverse spatial types of organic-rich shale reservoirs under overpressure conditions in the Long 11 Sub-member. Four types of pores are commonly observed, including organic matter pores, intragranular dissolution pores in brittle minerals, intergranular (interlayer) pores in clay minerals, and microfractures, with the first two being predominant (Figures 9A–I). Organic matter pores exhibit great advantages in bearing adsorbed and free methane. Consequently, the development of organic matter pores plays a crucial role in the enrichment of shale gas in the Longmaxi Formation. The organic matter pores in the samples are primarily irregular subcircular or ellipsoidal, appearing honeycomb-shaped or bead-like within the organic matter, with pore diameters ranging from 50 to 450 nm (Figures 9A, B). Their formation is associated with the extensive hydrocarbon generation and expulsion during the thermal maturation of organic matter. Additionally, a few organic matter pores are in the form of fissures distributed at the interface between organic matter and inorganic minerals, with a width of up to approximately 200 nm (Figure 9C). The origin is attributed to specific organic maceral and its shrinkage effects during thermal evolution (Wang et al., 2023a). Intragranular dissolution pores in brittle minerals generally exhibit a polygonal shape, with pore diameters ranging from 300 to 1,200 nm and poor connectivity (Figures 9D–F). Intergranular (interlayer) pores in clay minerals typically appear as fissures with directional distribution, with pore diameters ranging from 300 to 700 nm and good local connectivity (Figure 9G). Scholars have classified microfractures into three types based on their origins: structural fractures, diagenetic shrinkage fractures, and bedding slip fractures (Zeng et al., 2016). In the study area, diagenetic shrinkage fractures are well-developed (Figures 9H, I), often extending along the interface of minerals or organic matter, with lengths ranging from 8 to 20 μm. They are featured by limited opening and mostly unfilled. These fractures serve as one of the main spaces for the occurrence and migration of shale gas. In addition, a small number of primary intergranular pores in brittle minerals were observed, appearing as fissure-like, wedge-shaped, or cylindrical structures (Figure 9F).
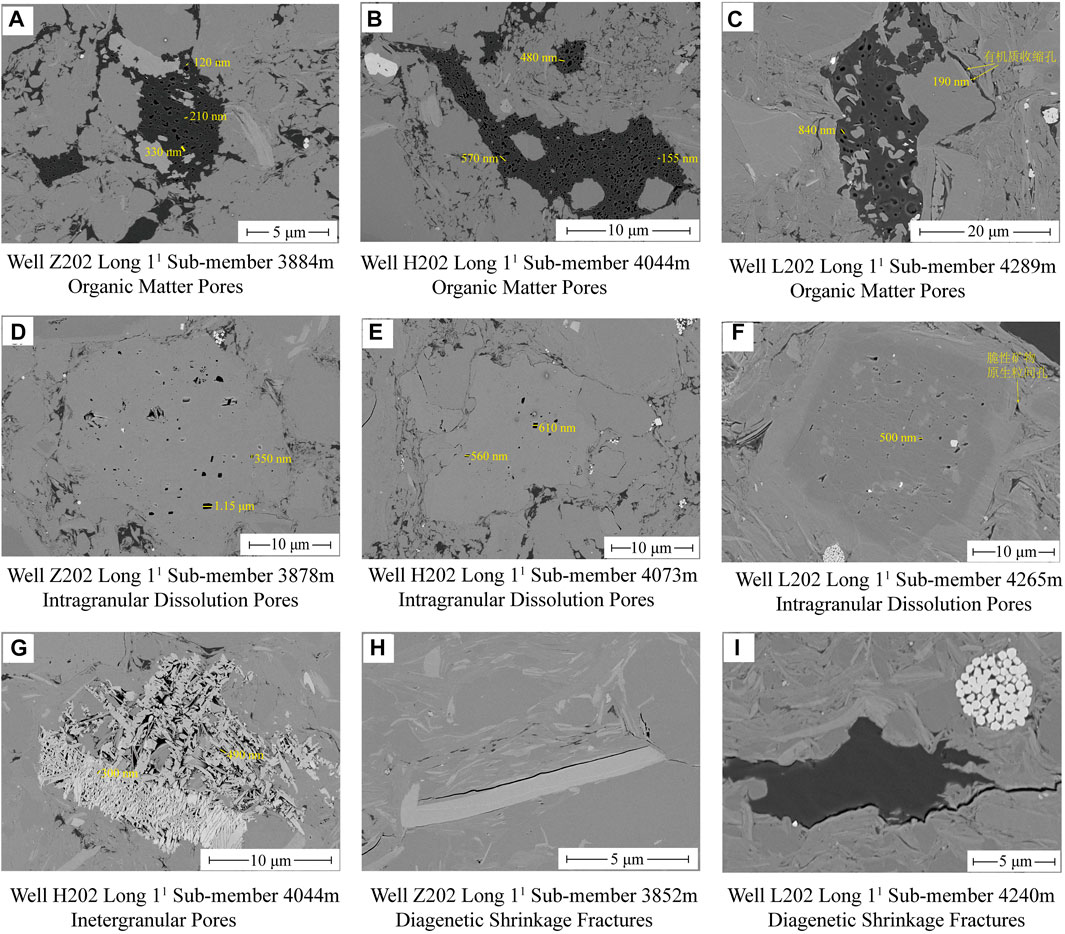
Figure 9. Scanning electron microscope images of pore types in organic-rich Shale of the deep long 11 sub-member, including organic matter pores (A–C), intragranular dissolution pores (E–G), and diagenetic shrinkage fractures (H–I).
The pore structure characteristics of shale reservoirs, including morphology, pore size distribution, pore volume, and specific surface area, are not only crucial parameters for evaluating reservoir performance but also significantly impact the distribution of shale oil and gas content in different occurrence states (Wei et al., 2021). Scholars have combined gas adsorption and high-pressure mercury injection experiments to characterize the pore structure of the deep Longmaxi Formation shale in southern Sichuan, and analyzed the influence of factors such as burial depth, total organic carbon (TOC) content, inorganic mineral composition, and water content on pore structure characteristics (Pan et al., 2015; Yang et al., 2016; Zhao et al., 2018). The research results indicate that the total pore volume of the shale ranges from 17.26 to 33.65 mm3/g, with an average of 28.74 mm3/g. The predominant pores are mesopores (2–50 nm) and micropores (<2 nm), with macropores (>50 nm) contributing a smaller proportion, averaging 23%, 73%, and 4%, respectively. In addition, the volume of pores with diameters less than 10 nm accounts for an average of 59%. In comparison with shallow shale at depths less than 3,000 m, deep shale at depths exceeding 3,500 m exhibits a significant increase in total pore volume (rising from 22.85 mm3/g to 29.86 mm3/g). The volume proportion of micropores within the total pore volume also significantly increases (from 15.34% to 21.85%), while the proportions of mesopores and macropores decrease (from 72.54% to 66.71% and from 12.12% to 11.44%, respectively). The TOC content correlates positively with the volumes of micropores and mesopores, with correlation coefficients reaching 0.81 and 0.42, while its correlation with macropore volume is only 0.21. The reservoir’s water absorption rate increases from 1.84% to 2.84%, while the reduction rate in total pore volume rises from 10.7% to 21.8%. The decrease in specific surface area increases from 15.5% to 29.7% (Shi et al., 2023). Additionally, some scholars have employed scanning electron microscopy and image processing to analyze the structural characteristics of organic matter pores. They have explored the controlling effects of organic maceral, formation pressure (overpressure and normal pressure), and mineral composition. Studies show pores developed in bitumen generally have diameters larger than 25 nm, while those in bacterial aggregates and algal fragments have diameters ranging from 10 to 30 nm (Xie et al., 2021). Organic matter pores, protected under overpressure conditions, exhibit characteristics such as nearly circular shapes and diameters ranging from hundreds of nanometers to micrometers. In contrast, under normal pressure conditions, these pores undergo modification and exhibit irregular shapes with diameters ranging from tens to hundreds of nanometers (Liu et al., 2020). An increase in pyrite content promotes the development of organic matter pores, with the diameters of organic matter pores in the periphery ranging from 20 to 70 nm. They often appear as approximately elliptical and irregular shapes with some interconnected with each other.
To explore the impact of varying degrees of overpressure on pore structure characteristics of shale reservoirs, this study employed low-temperature carbon dioxide adsorption, nitrogen adsorption, and high-pressure mercury injection experiments to quantitatively characterize micropores, mesopores, and macropores in organic-rich shale samples from the Long 11 Sub-member, in Luzhou, Yongchuan, and Dazu areas. The results show that their total pore volume ranges from 23.80 to 43.70 mm3/g, with an average of 32.45 mm3/g, mainly contributed by mesopores. Contributions from micropores and macropores are comparatively lower (Figure 10). The average total pore volume of micropores is 1.98 mm3/g, accounting for a proportion of 1.67%–9.88%, with an average of 6.24%. The average value of mesopores is 29.50 mm3/g, accounting for a proportion of 84.03%–93.82%, with an average of 90.57%. The average value of macropores is 0.97 mm3/g, accounting for a proportion of 1.60%–6.72%, with an average of 3.18%. The total specific surface area ranges from 23.05 to 47.05 m2/g, with an average of 33.61 m2/g, mainly contributed by mesopores and micropores, while macropores contribute less. The average total surface area of micropores is 6.79 mm3/g, accounting for a proportion of 14.65%–28.27%, with an average of 20.15%. The average value of mesopores is 26.80 mm3/g, accounting for a proportion of 71.70%–85.32%, with an average of 79.80%. The average value of macropores is 0.01 mm3/g, accounting for a proportion of 0.02%–0.13%, with an average of 0.04% (Figure 10). However, with increasing pressure coefficients (Dazu < Yongchuan < Luzhou), there is no consistent pattern in the variation of total pore volume, total specific surface area, and their proportions in micropores, mesopores, and macropores. This suggests that the influence of increased overpressure (1.86–2.24) on shale pore volume and specific surface area is relatively limited.
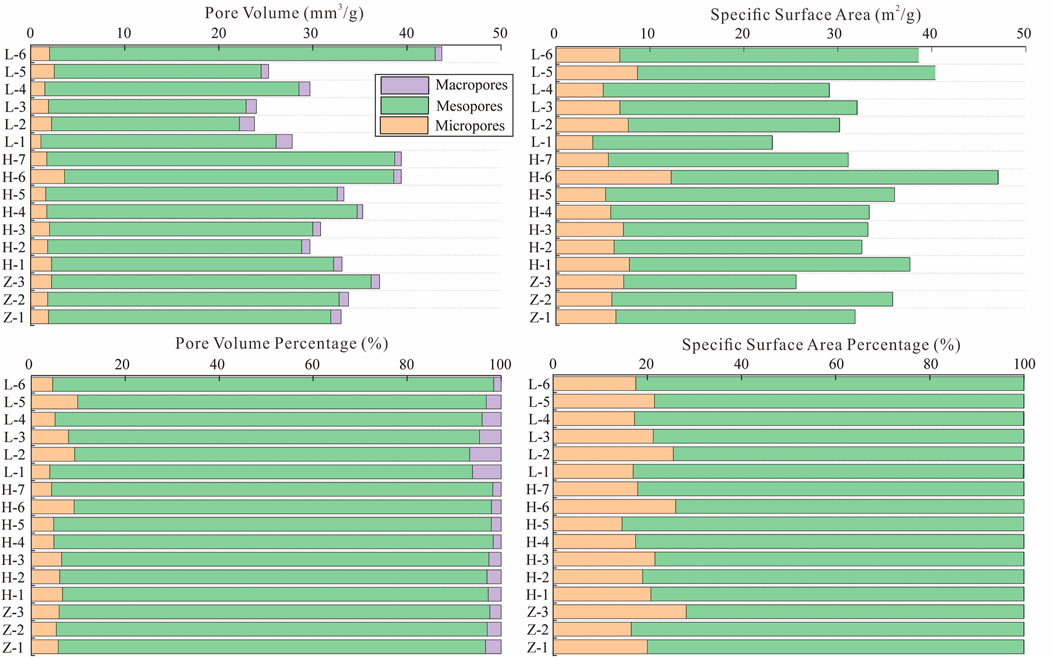
Figure 10. Pore structure characteristics of organic-rich shale in the deep long 11 sub-member (Z-1 to Z-3: samples from well Z202 in Dazu area, pressure coefficient 1.86; H-1 to H-7: samples from well H202 in Yongchuan area, pressure coefficient 2.04; L-1 to L-6: samples from well L202 in Luzhou Area, pressure coefficient 2.24).
On the basis of gas adsorption characteristics, this study utilized Ar-ion polishing SEM technique to systematically observe and continuously capture images of organic pores in samples from the Long 11 Sub-member in the study area (Figure 11). The pore size distribution and morphological features of organic pores were statistically analyzed by employing image processing software (Avizo 2019) for statistical analysis of the. SEM images provide better resolution and statistical significance for pores above 10 nm. The study documented a total of 8,767 organic pores, revealing a pore size range of 10–1,200 nm. The pore size distribution exhibits significant variations in different areas, with 10–50 nm pores accounting for 30.11%–65.79% of the total, 50–100 nm pores accounting for 23.71%–49.40%, and >100 nm pores accounting for 10.50%–45.92% (Figure 12A). The morphological features of the pores can be defined using the shape factor, and calculated through Eq. 1:
Where, S is pore cross-sectional area. C is pore cross-sectional perimeter Within the range of 0–1.0, the values closer to 1.0 indicate a more circular pore shape, and the values closer to 0 suggest increasingly irregular pore shapes. The statistical results indicate that organic pores with a shape factor greater than 0.7 constitute over 65% of the total, while those with a shape factor lower than 0.4 account for less than 9% (Figure 12B). This implies that the organic pores in the target layer of the study area are predominantly circular or subcircular, with fewer irregular and extremely irregular flattened angular pores.
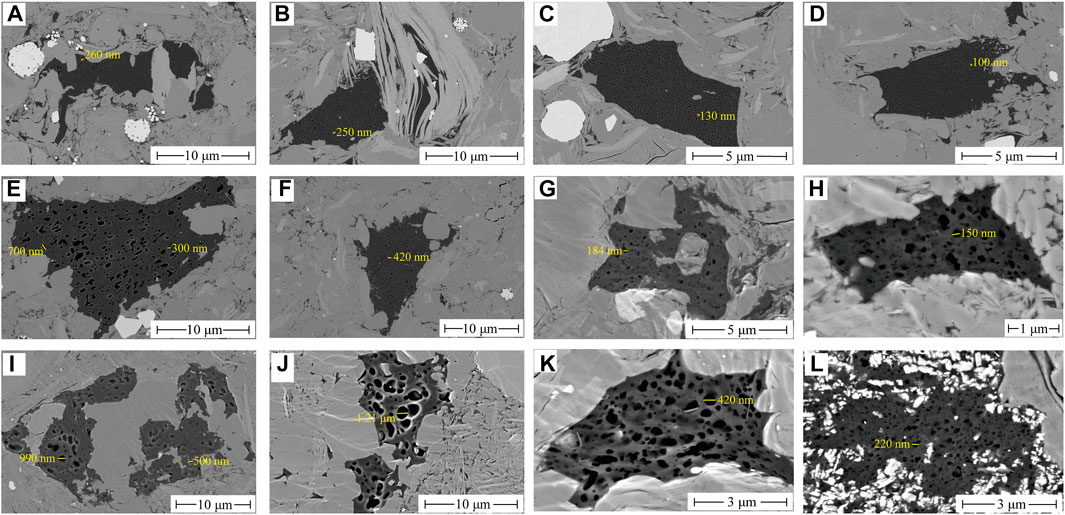
Figure 11. Morphological characteristics of organic pores in organic-rich shale of the deep long 11 sub-member in Southern Sichuan (A–D) Dazu area; (E–H) Yongchuan area; (I–L) Luzhou area.
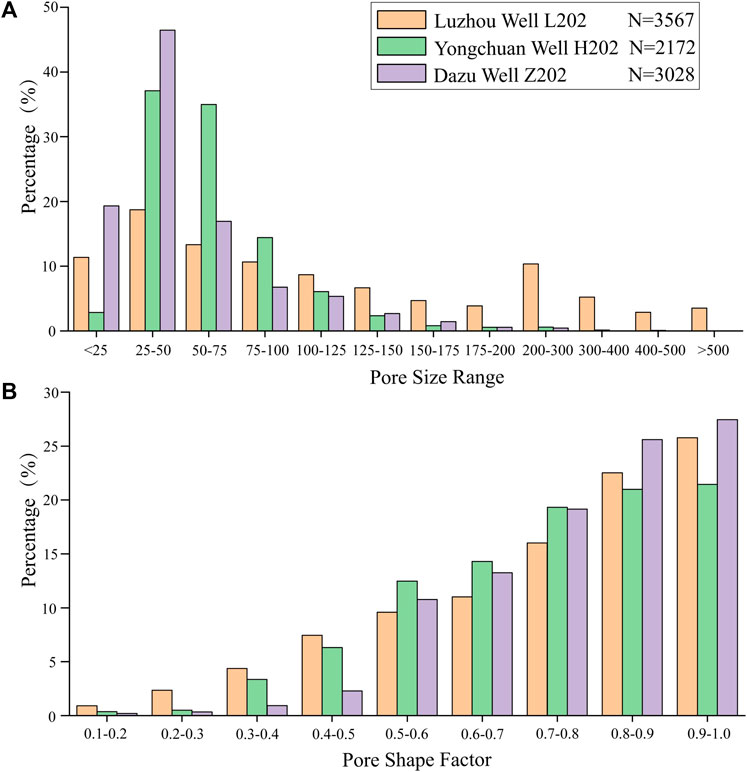
Figure 12. Comparative analysis of organic pore size range (A) and shape factor (B) in the deep long 11 sub-member, Southern Sichuan Area. ‘N’ represents the total number of statistically analyzed organic pores.
The study further conducted a comparative analysis on the distribution characteristics of the organic pore sizes in samples from different overpressured zones. The results indicate that with an increase in the pressure coefficient, there is an overall trend of enlargement in the organic pores of shale (Figure 12A). In the Dazu area, which has the lowest shale pressure coefficient (1.86), the pore size distribution is concentrated in the 10–25 nm, 25–50 nm, and 50–75 nm intervals, with proportions reaching 19.32%, 46.47%, and 16.94%, respectively. In the Yongchuan area, with an intermediate shale pressure coefficient (2.04), the pores slightly enlarge, concentrating in the 25–50 nm, 50–75 nm, and 75–100 nm intervals, with proportions of 37.11%, 34.99%, and 14.41%, respectively. In the Luzhou area, with the highest shale pressure coefficient (2.24), there is a significant enlargement of pores. The proportions of pores in the 10–50 nm and 50–100 nm intervals decrease to 30.11% and 23.97%, respectively, while the proportion of pores exceeding 100 nm significantly increases to 45.92%. These features suggest that in deep shale formations with widespread strong overpressure, higher degrees of overpressure make greater contribute to the development of organic pores larger than 100 nm. Conversely, decreasing overpressure results in the compression of organic pores, leading to an overall reduction in pore size to less than 100 nm, particularly in the 10–50 nm range. Many scholars agree that overpressure has a protective effect on the preservation of shale organic pores (Liu, 2015; Wang et al., 2019; Wang et al., 2023b), but there are few studies on the effect of overpressure on organic macropores in Longmaxi Formation.
In the research related to the middle and shallow Longmaxi Formation shale reservoirs in the southern and southeastern Sichuan Basin, the helium porosity is commonly observed to range between 2% and 8%. The variations in porosity are jointly controlled by the formation pressure coefficient and the lithofacies (Nguyen et al., 2013; Li et al., 2017; Nabawy et al., 2022). On one hand, as the pressure conditions transit from normal pressure to overpressure, the compaction effect from overlying strata gradually diminishes, maintaining the porosity of shale reservoir at relatively high levels. On the other hand, the compressive strength of siliceous shale, clayey shale, and silty shale decreases in sequence. Under the same normal pressure conditions, siliceous shale exhibits lower compaction, thereby retaining higher porosity and better reservoir capacity. In contrast, clayey shale and silty shale undergo significant compaction and alteration, leading to a substantial reduction in porosity and reservoir capacity, and they ultimately transform into cap rocks. When normal pressure shifts to overpressure, the compaction intensity of clayey shale significantly decreases, resulting in a notable increase in porosity, sometimes even surpassing that of siliceous shale. Consequently, clayey shale may also exhibit favorable reservoir capacity under overpressure conditions.
The analysis of helium porosity in the deep Long 11 Sub-member shale of the southern Sichuan region, encompassing 188 core samples from three areas, reveals a distribution range similar to that of the middle and shallow layers, ranging from 1% to 8%. The variation in porosity also exhibits a strong correlation with the formation pressure coefficient and the lithofacies. With increasing pressure coefficient, the distribution range and average of the shale porosity gradually increase (see Figure 13A). In the Dazu area, where the pressure coefficient is the lowest (1.86), the porosity ranges from 1.17% to 5.57%, with an average porosity of only 3.18%. In the Yongchuan area, with a moderate pressure coefficient (2.04), the porosity varies from 2.58% to 7.78%, and the average porosity is 4.28%. The Luzhou area, with the highest pressure coefficient (2.24), exhibits porosity distribution ranging from 3.21% to 7.73%, and an impressive average porosity of 5.03%. Evaluation standards for middle and shallow Longmaxi Formation shale reservoirs often categorize those with porosity exceeding 5.0 as Class I reservoirs (Zhao et al., 2016). When this criterion is applied to assess the deep shale porosity, only 4.35% of the Dazu area samples meet Class I reservoir standards, while the Yongchuan area reaches 23.21%, and the Luzhou area attains the highest, at 45.35%. These results show that, in deep shale formations characterized by prevalent strong overpressure, enhanced overpressure helps counteract the compaction effect, improving porosity and enhancing reservoir quality. Additionally, both siliceous shale and clayey shale are developed in the Long 11 Sub-member in Well H202 of the Yongchuan area. Analysis indicates that siliceous shale has a porosity distribution ranging from 2.58% to 5.42%, with an average value of 3.86%, and only 6.06% exceeding 5.0. In contrast, clayey shale exhibits relatively superior porosity characteristics, with a distribution between 2.76% and 7.78%, an average value of 4.90%, and an impressive 47.83% exceeding 5.0 (see Figure 13B). This observation indicates that the development of overpressure significantly improves the porosity and quality of clayey shale.
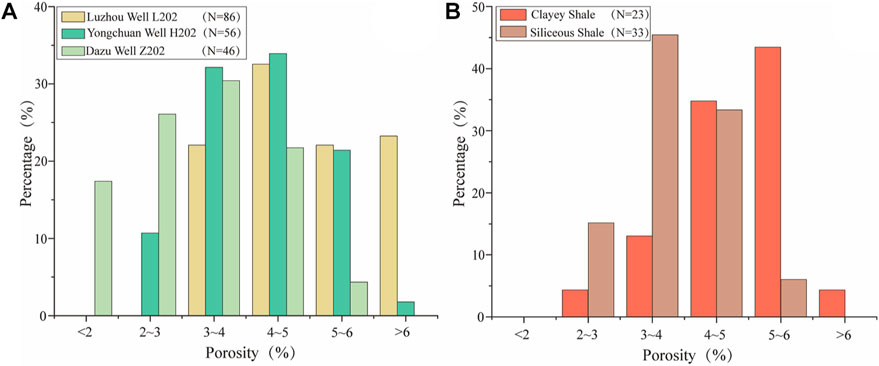
Figure 13. Comparison of pore volume in the long 11 sub-member shale reservoir under different pressure coefficients (A), and comparison of pore volume in the Clayey and Siliceous shales in the Yongchuan area under overpressure conditions (B).
A detailed study on the formation mechanisms, evolutionary patterns, and the controlling effects on reservoir pore characteristics of strong overpressure have been made and the following conclusions can be reached.
The well log curve combination method and the sonic velocity-density crossplot method, sediment burial and hydrocarbon generation history, fluid inclusion paleo-pressure recovery together confirm that hydrocarbon generation expansion is the dominant mechanism for the formation of strong overpressure in the deep Longmaxi Formation shale gas reservoir. Overpressured intervals exhibit the log characteristics of significantly increase of acoustic travel time and high resistivity, and significantly decrease of density.
In the long-term subsidence process, the deep Longmaxi Formation shale gas reservoir has been influenced by the effects of kerogen oil generation and retained oil cracking into gas. It experienced three stages: normal pressure (Silurian to Early Triassic), overpressure (Early Triassic to Early Jurassic), and strong overpressure (Early Jurassic to Late Cretaceous), with corresponding pressure coefficients of 1.08–1.09, 1.51–1.56, and 2.09–2.12, respectively. During the late strong uplift process, the initially formed overpressure underwent some adjustment due to temperature reduction and gas escape. Fluid pressure gradually decreased from 138.93–140.99 MPa to 70.72–94.86 MPa. The pressure coefficient showed a change trend of decreasing first and then increasing, and currently strong overpressure is still maintained.
Different degrees of strong overpressure have a significant control on the porosity and pore structure of the shale gas reservoir. Higher pressure coefficients contribute to maintaining high porosity and organic macropores. Deep Wufeng-Longmaxi Formation shale exhibits differences in morphological characteristics, structure and connectivity of organic matter pores. This study provides valuable insights for the further understanding and evaluation of deep shale gas reservoirs.
The original contributions presented in the study are included in the article/supplementary material, further inquiries can be directed to the corresponding authors.
SS: Project administration, Funding acquisition, Writing–review and editing, Writing–original draft, Investigation, Data curation, Conceptualization. ZS: Supervision, Writing–review and editing, Writing–original draft, Funding acquisition, Formal Analysis, Data curation, Conceptualization. DD: Methodology, Investigation, Funding acquisition, Writing–original draft. WB: Writing–original draft, Resources, Project administration, Data curation, Conceptualization. LW: Writing–original draft, Visualization, Methodology, Formal Analysis, Conceptualization. JY: Writing–review and editing, Validation, Supervision, Investigation, Data curation. JQ: Writing–review and editing, Visualization, Supervision, Methodology.
The author(s) declare that financial support was received for the research, authorship, and/or publication of this article. This research was supported by Science and Technology Management Department of PetroChina “Research on Stress Change, Tectonic Activation and Possible Induced Earthquake Mechanism in Shale Gas Development Zones of South Sichuan” (No. 2022DJ8004).
Authors SS, ZS, DD, and WB were employed by PetroChina.
The remaining authors declare that the research was conducted in the absence of any commercial or financial relationships that could be construed as a potential conflict of interest.
All claims expressed in this article are solely those of the authors and do not necessarily represent those of their affiliated organizations, or those of the publisher, the editors and the reviewers. Any product that may be evaluated in this article, or claim that may be made by its manufacturer, is not guaranteed or endorsed by the publisher.
Bowers, G. L. (1995). Pore pressure estimation from velocity data: accounting for overpressure mechanisms besides undercompaction. SPE Drill. Complet. 10, 89–95. doi:10.2118/27488-pa
Chen, Z. P., Liang, X., Zhang, J. H., Wang, G. C., Liu, C., Li, Z. F., et al. (2016). Genesis analysis of shale reservoir overpressure of Longmaxi Formation in Zhaotong demonstration area, dianqianbei depression. Nat. Gas. Geosci. 27 (3), 442–448. (In Chinese with English abstract). doi:10.11764/j.issn.1672-1926.2016.03.0442
Clarkson, C. R., Solano, N., Bustin, R. M., Bustin, A. M. M., Chalmers, G. R. L., He, L., et al. (2013). Pore structure characterization of North American shale gas reservoirs using USANS/SANS, gas adsorption, and mercury intrusion. FUEL 103, 606–616. doi:10.1016/j.fuel.2012.06.119
Conner, O. S., Swarbrick, R. E., and Lahann, R. (2011). Geologically driven pore fluid pressure models and their implications for petroleum exploration. Introduction to thematic set. Geofluids 11, 343–348. doi:10.1111/j.1468-8123.2011.00354.x
Deng, J. X., Wang, C. Y., Zhao, Q., Guo, W., Tang, G. Y., and Zhao, J. G. (2021). Depositional and diagenetic controls on macroscopic acoustic and geomechanical behaviors in Wufeng-Longmaxi Formation shale. Front. Earth Sci. 9, 617831. doi:10.3389/feart.2021.617831
Duan, Z., Moller, N., and Weare, J. H. (1992). An equation of state for the CH4-CO2-H2O system: I. Pure systems from 0 to 1000°C and 0 to 8000 bar. Geochimica Cosmochimica Acta 56, 2605–2617. doi:10.1016/0016-7037(92)90347-l
Fan, C. H., Li, H., Qin, Q. R., He, S., and Zhong, C. (2020). Geological conditions and exploration potential of shale gas reservoir in Wufeng and Longmaxi Formation of southeastern Sichuan Basin, China. J. Petroleum Sci. Eng. 191, 107138. doi:10.1016/j.petrol.2020.107138
Fan, C. H., Nie, S., Li, H., Radwan, A. E., Pan, Q. C., Shi, X. C., et al. (2024). Quantitative prediction and spatial analysis of structural fractures in deep shale gas reservoirs within complex structural zones: a case study of the Longmaxi Formation in the Luzhou area. southern Sichuan Basin, China. J. Asian Earth Sci. 263, 106025. doi:10.1016/j.jseaes.2024.106025
Gao, G., Gang, W. Z., Fan, H. C., Sang, T. Y., and Nie, C. Q. (2008). Research advances for the genesis of abnormally low formation pressure in petroliferous basins. Nat. Gas. Geosci. 19 (3), 311–315. (In Chinese with English abstract).
Gao, J., Zhang, J. K., He, S., Zhao, J. X., He, Z. L., Wo, Y. J., et al. (2019). Overpressure generation and evolution in Lower Paleozoic gas shales of the Jiaoshiba region, China: implications for shale gas accumulation. Mar. Petroleum Geol. 102, 844–859. doi:10.1016/j.marpetgeo.2019.01.032
Guo, X. S., Hu, D. F., Li, Y. P., Wei, Z. H., Wei, X. F., and Liu, Z. J. (2017). Geological factors controlling shale gas enrichment and high production in Fuling shale gas field. Petroleum Explor. Dev. 44 (4), 513–523. doi:10.1016/s1876-3804(17)30060-5
Guo, X. S., Li, Y. P., Borjigen, T., Wang, Q., Yuan, T., Shen, B. J., et al. (2020). Hydrocarbon generation and storage mechanisms of deep-water shelf shales of ordovician Wufeng Formation–silurian Longmaxi Formation in Sichuan Basin, China. Petroleum Explor. Dev. 47 (1), 204–213. doi:10.1016/s1876-3804(20)60019-2
Guo, X. W., He, S., Zheng, L. J., and Wu, Z. Z. (2011). A quantitative model for the overpressure caused by oil generation and its influence factors. Acta Pet. Sin. 32 (4), 637–644. (In Chinese with English abstract). doi:10.7623/syxb201104011
He, X. P., He, G. S., Gao, Y. Q., Zhang, P. X., Lu, S. F., and Wan, J. Y. (2019). Geological characteristics and enrichment laws of normal-pressure shale gas in the basin-margin transition zone of SE Chongqing. Nat. Gas. Ind. B 6 (4), 333–346. doi:10.1016/j.ngib.2018.12.003
Jin, Z. J., and Nie, H. K. (2022). Evolution history of overpressured and normally pressured shale gas reservoirs in Wufeng Formation–Longmaxi Formation, Sichuan Basin, China: an analysis from the perspective of source and seal coupling mechanism. Energy and Fuels 36, 10870–10885. doi:10.1021/acs.energyfuels.2c01925
Katahara, K. W., and Corrigan, J. D. (2004). Effect of gas on poroelastic response to burial or erosion. AAPG Mem. 76, 73–78.
Li, H. (2023a). Coordinated development of shale gas benefit exploitation and ecological environmental conservation in China: a mini review. Front. Ecol. Evol. 11, 1232395. doi:10.3389/fevo.2023.1232395
Li, H. (2023b). Deciphering the formation period and geological implications of shale tectonic fractures: a mini review and forward-looking perspectives. Front. Energy Res. 11, 1320366. doi:10.3389/fenrg.2023.1320366
Li, J., Li, H., Yang, C., Wu, Y. J., Gao, Z., and Jiang, S. L. (2022). Geological characteristics and controlling factors of deep shale gas enrichment of the Wufeng-Longmaxi Formation in the southern Sichuan Basin, China. Lithosphere 12, 4737801. doi:10.2113/2022/4737801
Li, J., Tang, Y., Wu, T., Zhao, J. Z., Wu, H. Y., Wu, W. T., et al. (2020). Overpressure origin and its effects on petroleum accumulation in the conglomerate oil province in Mahu Sag, Junggar Basin, NW China. Petroleum Explor. Dev. 47 (4), 726–739. doi:10.1016/s1876-3804(20)60088-x
Li, S. J., Yuan, Y. S., Sun, W., Sun, D. S., and Jin, Z. J. (2016). The formation and destroyment mechanism of shale gas overpressure and its main controlling factors in Silurian of Sichuan Basin. Nat. Gas. Geosci. 27 (5), 924–931. (In Chinese with English abstract). doi:10.11764/j.issn.1672-1926.2016.05.0924
Li, Z., Wu, S. H., Xia, D. L., Zhang, X. F., and Huang, M. (2017). Diagenetic alterations and reservoir heterogeneity within the depositional facies: a case study from distributary-channel belt sandstone of Upper Triassic Yanchang Formation reservoirs (Ordos Basin, China). Mar. Petroleum Geol. 86, 950–971. doi:10.1016/j.marpetgeo.2017.07.002
Liu, B., Lue, Y. F., Zhao, R., Tu, X. X., Guo, X. B., and Shen, Y. (2012). Formation overpressure and shale oil enrichment in the shale system of lucaogou Formation, mahu sag, sangtanghu basin, NW China. Petroleum Explor. Dev. 39 (6), 699–705. doi:10.1016/S1876-3804(12)60099-8
Liu, D. D., Guo, J., Pan, Z. K., Zhao, W., Du, F. P., Chen, Y., et al. (2021). Overpressure evolution process in shale gas reservoir: evidence from the fluid inclusions in the fractures of Wufeng Formation-Longmaxi Formation in the southern Sichuan Basin. Nat. Gas. Ind. 41 (9), 12–22. (In Chinese with English abstract).
Liu, H. L., Zhang, J. H., and Ji, Y. B. (2022). The controlling effect of kerogen type of shale on asphaltene nanopore and its exploration significance. Unconv. Oil gas 9 (3), 1–10. (In Chinese with English abstract). doi:10.19901/j.fcgyq.2022.03.01
Liu, R. B. (2015). Analyses of influences on shale reservoirs of Wufeng-Longmaxi Formation by overpressure in the south-eastern part of Sichuan Basin. Acta Sedimentol. Sin. 33 (4), 817–827. doi:10.14027/j.cnki.cjxb.2015.04.020
Liu, S. G., Ye, Y. H., Ran, B., Jiang, L., Li, Z. W., Li, J. X., et al. (2020). Evolution and implications of shale pore structure characteristics under different preservation conditions. Reserv. Eval. Dev. 10 (5), 1–11. (In Chinese with English abstract).
Ma, D. W., Qiu, N. S., and Xu, W. (2011). Analysis on mechanism of abnormal low pressure in Sulige gas field, Ordos Basin. Chin. J. Geol. 46 (4), 1055–1067.
Ma, X. H., Xie, J., Yong, R., and Zhu, Y. Q. (2020). Geological characteristics and high production control factors of shale gas reservoirs in Silurian Longmaxi Formation, southern Sichuan Basin, SW China. Petroleum Explor. Dev. 47, 901–915. doi:10.1016/s1876-3804(20)60105-7
Meng, Q. F., Hooker, J., and Cartwright, J. (2017). Early overpressuring in organic-rich shales during burial: evidence from fibrous calcite veins in the Lower Jurassic Shales-with-BEEF Member in the Wessex Basin, UK. J. Geol. Soc. 174, 869–882. doi:10.1144/jgs2016-146
Nabawy, B. S., Lashin, A. A., and Barakat, M. K. (2022). Implementation of lithofacies and microfacies types on reservoir quality and heterogeneity of the late cretaceous upper bahariya member in the shurouk field, shoushan basin, north western desert, Egypt. J. Asian Earth Sci. 224, 105014. doi:10.1016/j.jseaes.2021.105014
Nguyen, B. T. T., Jones, S. J., Goulty, N. R., Middleton, A. J., Grant, N., Ferguson, A., et al. (2013). The role of fluid pressure and diagenetic cements for porosity preservation in Triassic fluvial reservoirs of the Central Graben, North Sea. AAPG Bull. 97 (8), 1273–1302. doi:10.1306/01151311163
Nie, H. K., He, Z. L., Wang, R. Y., Zhang, G. R., Chen, Q., Li, D. H., et al. (2020). Temperature and origin of fluid inclusions in shale veins of Wufeng–Longmaxi Formations, Sichuan Basin, South China: implications for shale gas preservation and enrichment. J. Petroleum Sci. Eng. 193, 107329. doi:10.1016/j.petrol.2020.107329
Pan, L., Xiao, X. M., Tian, H., Zhou, Q., Chen, J., Li, T. F., et al. (2015). A preliminary study on the characterization and controlling factors of porosity and pore structure of the Permian shales in Lower Yangtze region, Eastern China. Int. J. Coal Geol. 146, 68–78. doi:10.1016/j.coal.2015.05.005
Qiu, N. S., Liu, Y. F., Liu, W., and Jia, J. K. (2020). Quantitative reconstruction of formation paleo-pressure in sedimentary basins and case studies. Sci. China Earth Sci. 50 (6), 793–806. doi:10.1007/s11430-019-9556-8
Rui, Y., Wang, C. J., Zhang, F. S., Yao, Y. B., Guo, N., and Zheng, R. (2021). Characterization of micro-pore throats in the shale gas reservoirs of Zhaotong national shale gas demonstration area. Nat. Gas. Ind. 41 (1), 78–85. (In Chinese with English abstract).
Shan, S. C., Wu, Y. Z., Fu, Y. K., and Zhou, P. H. (2021). Shear mechanical properties of anchored rock mass under impact load. J. Min. Strata Control Eng. 3 (4), 22–24. doi:10.13532/j.jmsce.cn10-1638/td.20211014.001
Shi, X. W., Wu, W., Hu, H. Y., Liu, L. H., Zhu, Y. Q., Pan, R. F., et al. (2023). The whole apertures of deeply buried Wufeng⁃Longmaxi Formation shale and their controlling factors in Luzhou district, Sichuan Basin. Earth Sci. 48 (1), 158–172. (In Chinese with English abstract).
Sun, C. X., Nie, H. K., Dang, W., Chen, Q., Zhang, G. R., Li, W. P., et al. (2021). Shale gas exploration and development in China: current status, geological challenges, and future directions. Energy and Fuels 35 (8), 6359–6379. doi:10.1021/acs.energyfuels.0c04131
Tang, J. M., He, J. H., Wei, L. M., Li, Y., Deng, H. C., Li, R. X., et al. (2023). Pressure evolution of deep shale gas reservoirs in Wufeng-Longmaxi formation, Lintanchang area, southeast Sichuan Basin and its geological significance. Petroleum Geol. Exp. 45 (4), 739–750. (In Chinese with English abstract).
Tang, L., Song, Y., Zhao, Z. G., Jiang, Z. X., Jiang, S., Chen, X. Z., et al. (2022). Origin and evolution of overpressure in shale gas reservoirs of the upper ordovician Wufeng Formation–lower silurian Longmaxi Formation in the Sichuan Basin. Nat. Gas. Ind. 42 (10), 37–53. (In Chinese with English abstract).
Tingay, M. R. P., Morley, C. K., Laird, A., Limpornpipat, O., Krisadasima, K., Pabchanda, S., et al. (2013). Evidence for overpressure generation by kerogen-to-gas maturation in the northern Malay Basin. AAPG Bull. 97, 639–672. doi:10.1306/09041212032
Wang, Z. L., Sun, M. L., Geng, P., Song, Y., and Li, Y. H. (2003). The development features and formation mechanisms of abnormal high formation pressure in southern Junggar region. Petroleum Explor. Dev. 30(1), 32–34. doi:10.3321/j.issn:1000-0747.2003.01.008
Wang, Y. M., Dong, D. Z., Li, X. J., Huang, J. L., Wang, S. F., and Wu, W. (2015). Stratigraphic sequence and sedimentary characteristics of lower silurian Longmaxi Formation in Sichuan Basin and its peripheral areas. Nat. Gas. Ind. B 2(2), 222–232. doi:10.1016/j.ngib.2015.07.014
Wang, Q., Wei, X. F., Wei, F. B., Yan, J. H., and Wan, L. (2019). Overpressure in shale gas reservoirs of Wufeng-Longmaxi formations, Fuling area, southeastern Sichuan Basin. Petroleum Geol. Exp. 41(3), 333–340.
Wang, J., Wang, X. L., Yang, P., Wu, Z. Y., Li, G., McGoogan, J. M., et al. (2021). Coronavirus disease 2019 outbreak in Beijing's Xinfadi Market, China: a modeling study to inform future resurgence response. J. Min. Strata Control Eng. 3 (3), 62–70. doi:10.1186/s40249-021-00843-2
Wang, L., Liu, B., Bai, L. H., Ostadhassan, M., Gentzis, T., Wang, B. Y., et al. (2023a). Maceral evolution of lacustrine shale and its effects on the development of organic pores during low mature to high mature stage: a case study from the Qingshankou Formation in northern Songliao Basin, northeast China. Petroleum Sci. 20 (5), 2709–2725. doi:10.1016/j.petsci.2023.08.025
Wang, Z. H., Gao, P., Feng, Y., Liu, R. B., and Yuan, T. (2023b). Pore structure characteristics and main controlling factors of the ultra-deep shales of the Wufeng-Longmaxi Formation in Eastern Sichuan Basin. J. Northeast Petroleum Univ. 479(1), 57–69.
Wang, Y. M., Wang, H. Y., Qiu, Z., Shen, J. J., Zhang, Q., Zhang, L. F., et al. (2022a). Basic characteristics of key interfaces in upper ordovician Wufeng Formation – lower silurian Longmaxi Formation in Sichuan Basin and its periphery, SW China. Petroleum Explor. Dev. 49(1), 37–51. doi:10.1016/s1876-3804(22)60003-x
Wang, X. L., Hu, W. X., Qiu, Y., Liu, Y. F., Jia, D., Cao, J., et al. (2022b). Fluid inclusion evidence for extreme overpressure induced by gas generation in sedimentary basins. Geology 50(7), 765–770. doi:10.1130/g49848.1
Wang, P. W., Chen, X., Liu, Z. B., Du, W., Li, D. H., Jin, W. J., et al. (2022c). Reservoir pressure prediction for marine organic-rich shale: a case study of the Upper Ordovician Wufeng-Lower Silurian Longmaxi shale in Fuling shale gas field, NE Sichuan Basin. Oil Gas Geol. 43 (2), 467–476. (In Chinese with English abstract).
Wei, L., Sun, S. S., Dong, D. Z., Shi, Z. S., Yin, J., Zhang, S. D., et al. (2021). Petrographic characterization and maceral controls on porosity in overmature marine shales: examples from ordovician-silurian shales in China and the U.S. Geofluids 2021, 1–31. doi:10.1155/2021/5582262
Wei, L., Yin, J., Li, J. S., Zhang, K., Li, C. Z., and Cheng, X. (2022). Mechanism and controlling factors on methane yields catalytically generated from low-mature source rocks at low temperatures (60–140°C) in laboratory and sedimentary basins. Front. Earth Sci. 10, 889302. doi:10.3389/feart.2022.889302
Wu, A. B., Cao, J., and Zhang, J. K. (2021). Bedding-parallel calcite veins indicate hydrocarbon–water–rock interactions in the over-mature Longmaxi shales, Sichuan Basin. Mar. Petroleum Geol. 133, 105303. doi:10.1016/j.marpetgeo.2021.105303
Wu, J., Chen, X. Z., Liu, W. P., Wu, W., Gao, Y., Luo, C., et al. (2022). Fluid activity and pressure evolution process of wufeng-longmaxi shales, southern Sichuan Basin. Earth Sci. 47 (2), 518–531. (In Chinese with English abstract).
Xie, G. L., Liu, S. G., Jiao, K., Deng, B., Ye, Y. H., Sun, W., et al. (2021). Organic pores in deep shale controlled by macerals: classification and pore characteristics of organic matter components in Wufeng Formation-Longmaxi Formation of the Sichuan Basin. Nat. Gas. Ind. 41 (9), 23–34. (In Chinese with English abstract). doi:10.3787/j.issn.1000-0976.2021.09.003
Xu, H., Zhang, J. F., Jia, C. Z., Tang, D. Z., and Yin, W. (2010). Influence of tectonic uplift-erosion on formation pressure. Petroleum Sci. 7, 477–484. doi:10.1007/s12182-010-0094-9
Yang, F., Ning, Z. F., Wang, Q., Zhang, R., and Krooss, B. M. (2016). Pore structure characteristics of lower Silurian shales in the southern Sichuan Basin, China: insights to pore development and gas storage mechanism. Int. J. Coal Geol. 156, 12–24. doi:10.1016/j.coal.2015.12.015
Yang, Y., Guo, D. M., Cheng, L. L., Yuan, S. B., Cheng, G. Y., and Yin, S. L. (2023). Organic carbon content correction and overpressure genesis analysis for overpressure strata of Dongying Formation in Bozhong Sag. Mud Logging Eng. 34 (2), 103–108.
Yi, J. Z., Bao, H. Y., Zheng, A. W., Zhang, B. Q., Shu, Z. G., Li, J. Q., et al. (2019). Main factors controlling marine shale gas enrichment and high-yield wells in South China: a case study of the Fuling shale gas field. Mar. Petroleum Geol. 103, 114–125. doi:10.1016/j.marpetgeo.2019.01.024
Yin, J., Wei, L., Sun, S. S., Shi, Z. S., Dong, D. Z., and Gao, Z. Y. (2003). Overpressure generation and evolution in deep Longmaxi Formation Shale reservoir in southern Sichuan Basin: influences on pore development. Energies 16, 2533. doi:10.3390/en16062533
Yuan, Y. S., Fang, Z. X., He, X. P., Li, S. J., Peng, Y. M., and Long, S. X. (2020). Normal pressure formation mechanism of Longmaxi shale gas in Pengshui and its adjacent areas. Reserv. Eval. Dev. 10 (1), 9–16. (In Chinese with English abstract). doi:10.13809/j.cnki.cn32-1825/te.2020.01.002
Zeng, L. B., Lyu, W. Y., Li, J., Zhu, L. F., Weng, J. Q., Yue, F., et al. (2016). Natural fractures and their influence on shale gas enrichment in Sichuan Basin, China. J. Nat. Gas Sci. Eng. 30, 1–9. doi:10.1016/j.jngse.2015.11.048
Zhang, J. L., Qiao, S. H., Lu, W. J., Hu, Q. C., Chen, S. G., and Liu, Y. (2016). An equation for determining methane densities in fluid inclusions with Raman shifts. J. Geochem. Explor. 171, 20–28. doi:10.1016/j.gexplo.2015.12.003
Zhang, S. C., He, K., Hu, G. Y., Mi, J. K., Ma, Q. S., Liu, K. Y., et al. (2018). Unique chemical and isotopic characteristics and origins of natural gases in the Paleozoic marine formations in the Sichuan Basin, SW China: isotope fractionation of deep and high mature carbonate reservoir gases. Mar. Petroleum Geol. 89, 68–82. doi:10.1016/j.marpetgeo.2017.02.010
Zhao, J. H., Jin, Z. J., Hu, Q. H., Liu, K. Y., Jin, Z. K., Hu, Z. Q., et al. (2018). Mineral composition and seal condition implicated in pore structure development of organic-rich Longmaxi shales, Sichuan Basin, China. Mar. Petroleum Geol. 98, 507–522. doi:10.1016/j.marpetgeo.2018.09.009
Zhao, J. Z., Li, J., and Xu, Z. Y. (2017). Advances in the origin of overpressures in sedimentary basins. Acta Pet. Sin. 38 (9), 973–998. (In Chinese with English abstract).
Zhao, S. X., Yang, Y. M., Zhang, J., Wang, L. S., Wang, X. Z., Luo, C., et al. (2016). Micro-layers division and fine reservoirs contrast of lower silurian Longmaxi Formation shale, Sichuan Basin, SW China. Nat. Gas. Geosci. 27 (3), 470–487.
Keywords: strong overpressure, formation mechanism, pressure evolution, reservoir property, pore structure
Citation: Sun S, Shi Z, Dong D, Bai W, Wei L, Yin J and Qu J (2024) Formation and evolution of shale overpressure in deep Wufeng-Longmaxi Formation in southern Sichuan basin and its influence on reservoir pore characteristics. Front. Earth Sci. 12:1375241. doi: 10.3389/feart.2024.1375241
Received: 23 January 2024; Accepted: 02 April 2024;
Published: 25 April 2024.
Edited by:
Hu Li, Southwest Petroleum University, ChinaReviewed by:
Hui Han, Southwest Petroleum University, ChinaCopyright © 2024 Sun, Shi, Dong, Bai, Wei, Yin and Qu. This is an open-access article distributed under the terms of the Creative Commons Attribution License (CC BY). The use, distribution or reproduction in other forums is permitted, provided the original author(s) and the copyright owner(s) are credited and that the original publication in this journal is cited, in accordance with accepted academic practice. No use, distribution or reproduction is permitted which does not comply with these terms.
*Correspondence: Shasha Sun, c3Vuc3M2OUBwZXRyb2NoaW5hLmNvbS5jbg==; Zhensheng Shi, c2hpenM2OUBwZXRyb2NoaW5hLmNvbS5jbg==
Disclaimer: All claims expressed in this article are solely those of the authors and do not necessarily represent those of their affiliated organizations, or those of the publisher, the editors and the reviewers. Any product that may be evaluated in this article or claim that may be made by its manufacturer is not guaranteed or endorsed by the publisher.
Research integrity at Frontiers
Learn more about the work of our research integrity team to safeguard the quality of each article we publish.