 Yunjuan Chen1,2
 Mengyue Liu
94% of researchers rate our articles as excellent or good
Learn more about the work of our research integrity team to safeguard the quality of each article we publish.
Find out more
ORIGINAL RESEARCH article
Front. Earth Sci., 28 February 2024
Sec. Geohazards and Georisks
Volume 12 - 2024 | https://doi.org/10.3389/feart.2024.1373627
This article is part of the Research TopicEvolution Mechanism and Control Method of Engineering Disasters Under Complex EnvironmentView all 30 articles
During the construction of a mountain tunnel, water inflow and rock instability are common occurrences due to unfavorable geological conditions, posing serious threats to construction safety. This study focuses on a proposed mountain tunnel and employs multiple formulas to predict potential water inflow during excavation. Based on the amount of water inflow and deformation of surrounding rocks, comprehensive determinations are made for the thickness of grouting rings and permeability coefficients. The results demonstrate that: 1) Different formulas yield slightly varied outcomes but overall trends remain consistent; considering various calculations, the normal water inflow for this tunnel is approximately 115.5908×10³ m3/d with a maximum at 210.9100×10³ m3/d 2) Increasing grouting ring thickness or decreasing permeability coefficient can effectively reduce water inflow, but the reduction range is gradually narrowed. 3) Pre-grouting curtains have an evident effect in enhancing stability; however, their effectiveness decreases with increased thickness. 4) Taking into account both safety and economic factors, it is recommended that the grouting ring thickness be set at 8 m with a permeability coefficient equaling one 100th that of surrounding rocks for this tunnel project.
During the construction process of tunnel engineering, two primary concerns have always been tunnel water inrush and surrounding rock stability. Particularly when tunnels traverse unfavorable geological conditions, excavation can trigger the initiation and propagation of rock fractures around the tunnel, leading to a disruption in seepage equilibrium and alterations in surrounding seepage dynamics. These changes in the seepage field will inevitably weaken the physical and mechanical properties of the surrounding rock, while modifications in the surrounding rock may continue to impact the underground water environment around the tunnel. The interaction between these two adverse factors ultimately gives rise to issues related to tunnel instability. Therefore, prior prediction of tunnel water inflow and analysis of surrounding rock stability hold significant theoretical and practical implications for successful tunnel excavation.
In recent years, a multitude of scholars have proposed diverse prediction formulas for water inflow and substantiated their feasibility through numerical simulation or engineering field practice (Liu et al., 2022; Li et al., 2021; Li et al., 2023; Xu et al., 2022). These research findings can serve as valuable references for future warning, monitoring, and prevention of similar tunnel construction projects to ensure safe execution. Wu et al. (2019) comprehensively summarized the commonly employed methods for predicting water inflow, encompassing empirical formula method, analytical formula method, numerical calculation method, and physical simulation method. They elucidated the underlying principles of these methods while analyzing their applicability conditions as well as advantages and disadvantages. Lin et al. (2021) proposed an analytical formula that accounts for soil anisotropic permeability to predict water inflow volume effectively. Chen et al. (2017), demonstrated the reliability of multiple empirical formulas in theoretically predicting water inflow through numerical simulation calculations. Furthermore, Fu et al. (2022) established a seepage differential balance equation and solved it using boundary conditions alongside steady-state drop funnel curve equation with drainage parameters to further determine water inflow volume. When confronted with substantial amounts of tunnel water inflows during construction processes grouting is often utilized for waterproofing treatment thus making determination of grouting parameters crucially important. Chen et al. (2023) proposed an analytical solution for the stable seepage field of deep-buried grouting tunnels, considering anisotropic infiltration. Ye (2023) predicted the maximum inflow during tunnel construction using empirical formulas and numerical simulations, proposing a construction scheme to control inflow through radial grouting. Lan et al. (2021) and Yuan et al. (2019) have put forward effective grouting schemes to address tunnel water inrush problems. Jianyong Han et al. (2023) studied a high-performance and effective polymer modified composite material, the research results provide guidance for improving the impermeability of grouting material. Hua Tao et al. (2023) conducted a study on the range of grouting reinforcement for karst water-rich tunnels under V-grade surrounding rock using numerical simulation, combined with seepage and stability analysis. Zheng et al. (2022) analyzed the influence of grouting and support parameters on seepage through model tests and theoretical analysis methods respectively. Xue et al. (2015) based on the concept of groundwater environment balance, established relevant functions to evaluate the effectiveness of grouting by utilizing empirical formulas and underground runoff modulus to obtain permeability coefficient under practical tunnel engineering conditions. Excavation-induced disturbances pose significant threats to the stability of surrounding rocks near excavations. Chen and Zhang (2019) established an analytical solution of soil’s plastic zone around circular digging holes based on Superposition Principle and Rubin’s Answer. Moreover, Chen et al. (2022) studied the influence of joint crack distribution on the stability of surrounding rock under hydraulic coupling conditions in underground engineering construction. Grouting is considered as an effective method for controlling tunnel deformation (Wang et al., 2022; Wang, 2023; Cheng et al., 2024). Filling cracks around tunnels can not only prevent water ingress but also improve rock stability. Peng et al. (2022) established numerical models for different distribution profiles of karst caves and tunnels, studying respectively the deformation and mechanical response of lining rocks with or without grouting. Jiang et al. (2023) proposed a coupled deformation analysis method between grout construction and adjacent existing tunnels that holds important theoretical significance in formulating grouting schemes.
The present study investigates the water inflow and surrounding rock stability in a specific mountain tunnel through a combination of theoretical analysis and numerical simulation. Firstly, four empirical formulas, namely, Oshima Yoshi formula, Railway experience formula, Kuniaki Sato formula, and Koskyakov formula are employed to theoretically predict the water inflow in different sections. The results obtained from these calculations are comprehensively analyzed. Secondly, FLAC3D is utilized to numerically simulate the stability of surrounding rocks in nine drilling sections under fluid-solid coupling conditions. Finally, considering factors such as water inflow, rock stability, and economic considerations; reasonable parameters for grouting permeation and thickness range are determined to provide a theoretical basis for tunnel design and construction.
A section of the planned mountain tunnel traverses a deep and steep valley with challenging geological conditions. The maximum burial depth in this section is 145 m, while the minimum burial depth is 63 m. The strata within the tunnel primarily comprise Quaternary gravelly soils, including coarse boulder gravel soil, boulder soil, and block stone soil. Locally, there are also sandy soils such as fine sand and medium sand. The groundwater is fully saturated, and the surrounding rock has a grade VI classification. The sediment in this area is loose and contains abundant silt and sand particles. Figure 1 illustrates the schematic diagram of the strata, while Figure 2 depicts the cross-section of the tunnel.
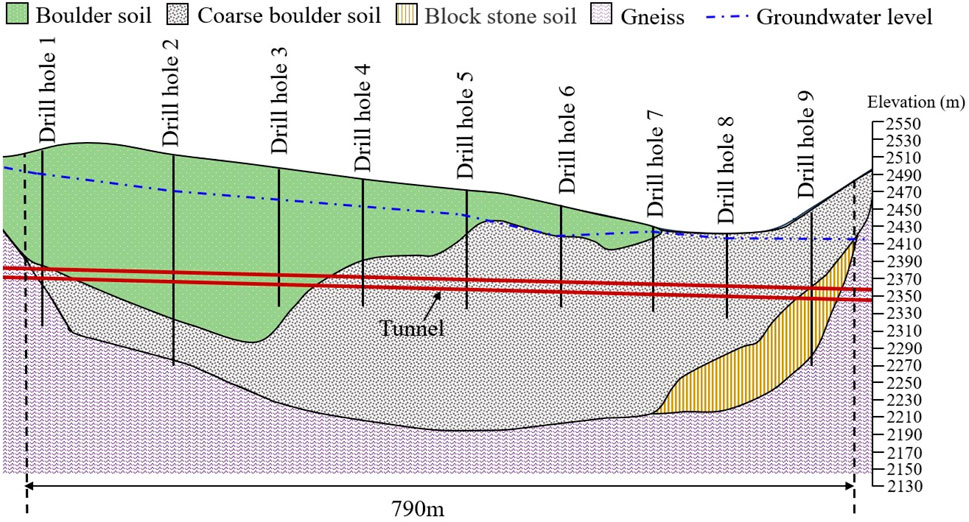
FIGURE 1. Schematic diagram of the strata.
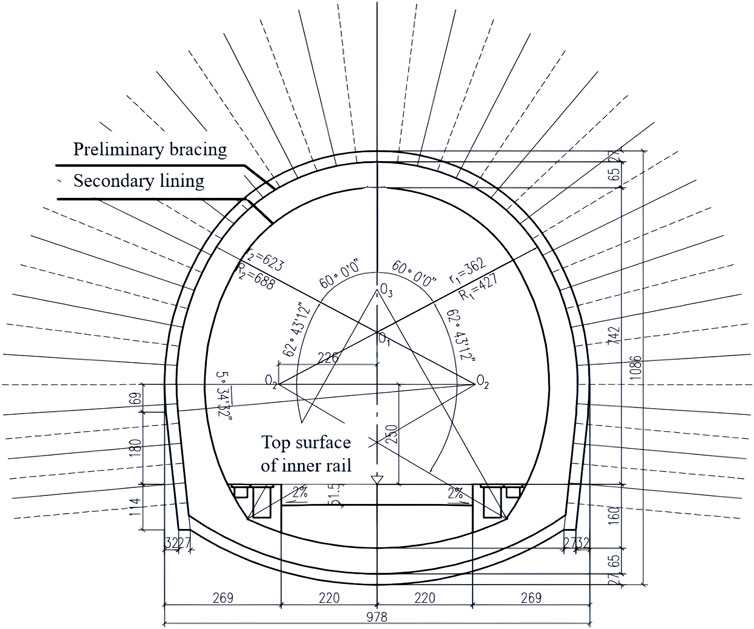
FIGURE 2. Cross-section of the tunnel.
The calculation of tunnel water inflow refers to the estimation of water influx under the assumption of conventional excavation, without considering support and lining throughout the entire tunnel. This represents an idealized scenario for water inflow, and the temporal variation curve of tunnel water inflow is depicted in Figure 3.
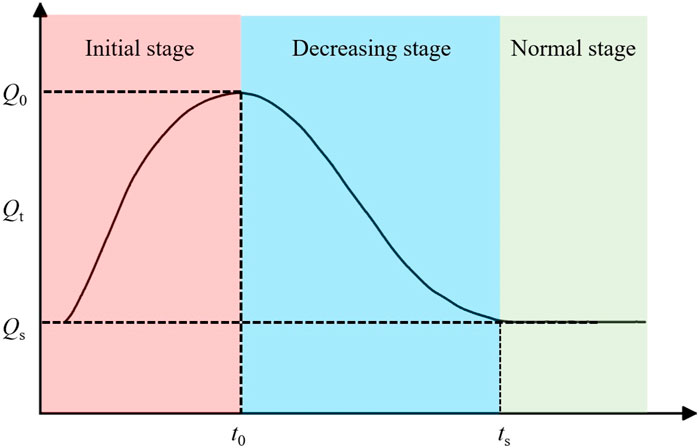
FIGURE 3. Temporal variation curve of tunnel water inflow.
The variation of tunnel water inflow can be classified into three stages: initial, decreasing, and normal stages. Therefore, the prediction of tunnel water inflow often involves calculating the maximum and normal inflows. During the initial stage of tunnel excavation, groundwater balance is disrupted due to excavation activities, resulting in a continuous influx of groundwater into the tunnel. Consequently, this stage is generally considered as having the highest water inflow rate. As groundwater is discharged and a drawdown funnel forms, the seepage field gradually reaches a new equilibrium stage which represents the normal phase of water inflow. For construction safety purposes, it is recommended to use maximum water inflow for safety protection design; whereas for drainage during tunnel construction and environmental protection measures, estimating normal water inflow is suggested. Different calculation methods used to predict tunnel water inflows may yield varying results in practical engineering projects; each prediction method has specific application conditions and limitations. Relying on a single formula for predicting large-scale tunnel water inflows leads to poor accuracy and can result in inadequate design leading to accidents or excessive conservatism causing wastage of manpower, resources, and finances. Therefore, it is advisable to employ multiple methods to comprehensively assess the situation regarding tunnel water infiltration.
The Oshima Yoshi formula is a widely employed rough estimation method during the preliminary survey phase of tunnel construction for assessing the volume of water inflow from subterranean cavities. Consequently, it is currently utilized to forecast potential water inflow during tunnel excavation. Its empirical formula is shown as Eq 1.
Where,
The actual cross-sectional shape can be simplified into an equivalence circle with its radius expressed as follows:
Where, r denotes the equivalent circular radius derived from the cross-sectional area of the borehole, m; d represents the span of the original tunnel section, m; and h signifies the height of the original tunnel section, m.
Railway empirical analytical formulas can calculate the initial maximum water inflow, denoted as
Where,
Where,
When the water body contained in the bedrock mountain crossing tunnel is unconfined and has a substantial thickness, Koskyakov gives the formula of the stable water inflow of the tunnel as follows:
Where, R is the quoted recharge radius of the water gushing section of the tunnel which can be obtained by the permeability coefficient, m; the other parameters are the same as (1).
Among them, the influence radius is calculated using the Kusakin formula, which can be expressed as follows:
Where, S is the drop depth of the tunnel water level.
Based on hydrogeological parameters obtained from drilling and pumping tests, combined with geophysical and engineering geological investigations, the hydrogeological parameters and tunnel dimensions for different sections are determined using 100 m as the unit length. Among the nine boreholes in this section, five underwent pumping tests, with the results presented in Table 1. The groundwater level at the tunnel site ranges approximately between 2418m and 2502 m above sea level, situated about 39.328m–118.995 m higher than the proposed tunnel elevation. The permeability coefficient of surrounding rock varies from 1.25 to 3.90 m/d. Specific calculation parameters for each section are provided in Table 2.
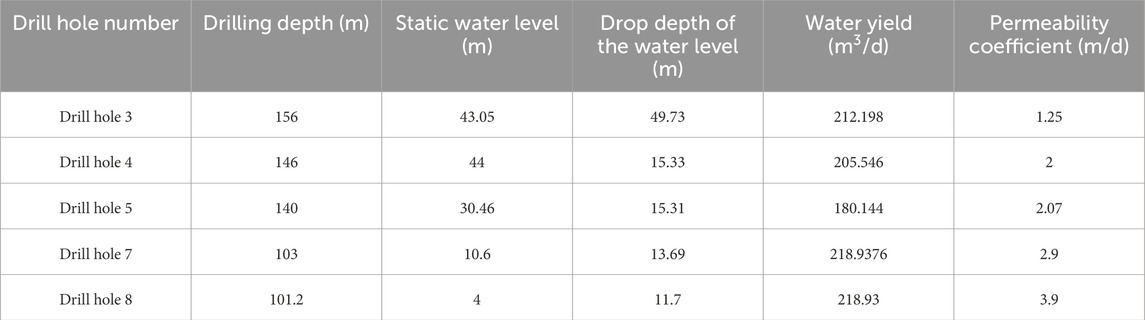
TABLE 1. Experimental results of drilling water extraction test.
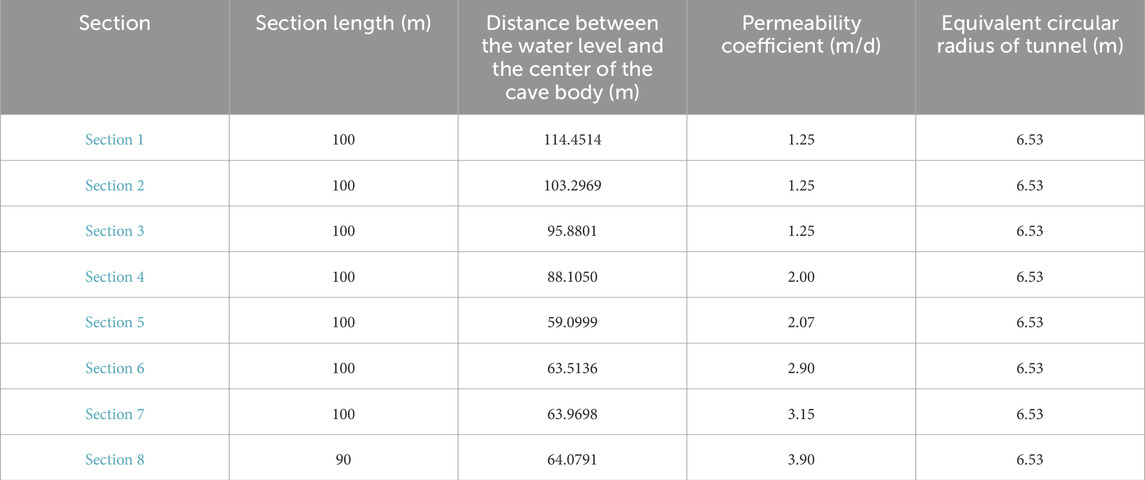
TABLE 2. Calculation parameters for different sections.
Using the water inflow calculation formula, the total water inflow of the tunnel can be calculated as shown in Table 3, and the water inflow of each section is shown in Figure 4.
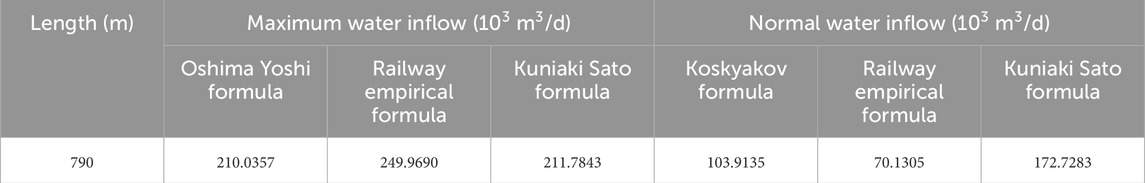
TABLE 3. Water inflow throughout the tunnel.

FIGURE 4. Water inflow in each section of the tunnel.
According to Table 2; Figure 4, it can be observed that there are certain discrepancies in the calculation results obtained from different formulas; however, the overall trend of water inflow remains consistent. Comparing the maximum water inflow for the tunnel, it is evident that Oshima Yoshi formula and Kuniaki Sato formula yield relatively similar values of 210.0357×10³ m3/d and 211.7843×10³ m3/d respectively. The railway empirical formula produces the highest calculated maximum water inflow (249.9690×10³ m3/d), which is approximately 19% higher than the other two formulas. Regarding normal water inflow, significant variations exist among the three formulas. Among them, the calculation result of Kuniaki Sato formula of normal water inflow is the largest, which is 172.7283×10³ m3/d. The calculation result of Koskyakov formula is relatively close to that of railway empirical formula, which is 103.9135×10³ m3/d and 70.1305×10³ m3/d. By conducting a comprehensive analysis of these calculation results obtained from different formulas, it can be concluded that Section 6, Section 7, and Section 8 exhibit relatively high levels of water inflow while Section 4 experiences a comparatively significant amount of water inflow.
Due to oversimplification of the aquifer as a homogeneous and isotropic ideal state in simulating and calculating water inflow, the predicted results may be distorted in actual tunnel engineering where surrounding rocks exhibit heterogeneity and anisotropy. Additionally, considering the deep burial depth of the tunnel, complex topography and geomorphology, as well as challenges in accurately defining rock parameters, uncertainties arise in predicting water inflow. To account for these unpredictability, the average value (115.5908×10³ m3/d) of Koskyakov formula, railway experience, and Kuniaki Sato formula is used to represent the normal water inflow of the tunnel.
Furthermore, reflecting maximum water inflow during tunnel excavation process can be represented by an average value (210.9100×10³ m3/d) obtained from Oshima Yoshi formula and Kuniaki Sato formula maximum water inflow formula. These calculations consider unfavorable conditions such as intense changes in permeability due to reverse groundwater infiltration leading to drastic increase in permeability coefficient within certain rock formations.
For situations involving significant water inflow, a remedial measure can be implemented by employing the technique of full-section advanced curtain grouting to mitigate the volume of water ingress. The diffusion of grout can effectively seal cracks in the surrounding rock ahead of the tunnel face, obstruct seepage pathways, and establish a watertight barrier, thereby substantially enhancing the impermeability of the surrounding rock mass. Additionally, it has the potential to enhance both physical and mechanical properties of the rock mass, preventing water infiltration during construction activities and ensuring construction safety.
When the tunnel is situated in a confined aquifer with ample water supply, and the drainage of the tunnel has negligible impact on hydraulic head in distant regions, the model can be simplified as a steady flow model of vertical wells in an infinite aquifer, as depicted in Figure 5. The inner radius of the tunnel is denoted by r1, corresponding to a hydraulic head value of h1 at that specific location; rg represents the outer radius of the grouting ring, corresponding to a hydraulic head value of hg at that specific location; H signifies the hydraulic head in far field, while r2 denotes the distance from far-field water level to the center of the tunnel; kg refers to permeability coefficient for grouting ring and kr indicates permeability coefficient for surrounding rock.
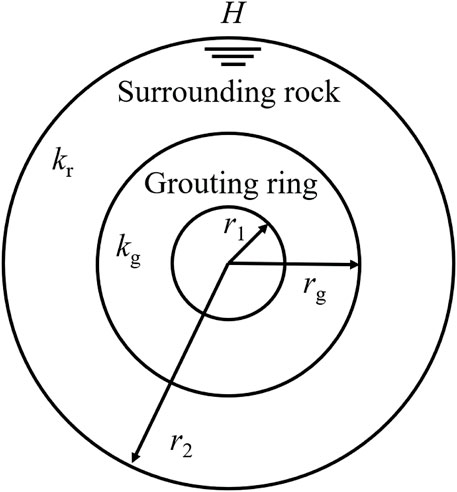
FIGURE 5. Schematic diagram of calculation model.
To simplify the calculations, the following assumptions are made: 1) The grouting ring and surrounding rock of the tunnel are assumed to be homogeneous, isotropic, and extend infinitely in the axial direction. 2) Groundwater is instantaneously released and seepage follows Darcy’s law with steady flow. 3)The permeability coefficients of both the surrounding rock and grouting ring are assumed to be equal in all directions. 4) The fluid is considered incompressible. The hydraulic head distribution of radial water flow in tunnels satisfies Laplace’s equation for seepage continuity. This equation describes the relationship between pressure difference on either side of a curved liquid surface and factors such as surface tension coefficient and radius of curvature.
By considering the shape of confined wells, we transform planar Laplace’s equation into its corresponding cylindrical coordinate form:
Flow is perpendicular to the Z-axis, so
Where the tunnel and grouting ring sizes r1 and rg are always nonzero, the above formula is simplified as follows:
By integrating Eq 11:
Since the radius of tunnel and grouting ring is not zero, the general solution of this equation can be obtained as:
According to the boundary conditions, the definite solutions are discussed in the lining and surrounding rock regions respectively.
1 Grouting ring area (
Then the hydraulic head value at any point in the grouting ring is:
2 Surrounding rock area (
Then the hydraulic head value at any point in the surrounding rock area is:
The formula for calculating the water head value at any position of the tunnel is:
According to Darcy’s law, the formula for steady flow through a section is as follows:
The deformation of darcy’s law left and right sides of the separation variable integral can be obtained after grouting flow
Similarly available flow
Since the flow rate of the tunnel through different sections is the same, that is,
Taking Section 6, Section 7, and Section 8 as representative examples of sections with relatively high water inflow, this study investigates the impact of grouting ring thickness and permeability coefficient on water inflow. The objective is to provide valuable insights for determining optimal parameters for grouting rings. Considering various grouting thicknesses ranging from 4.0m to 12.0 m (in increments of 1.0 m) and a range of ratios (n) between rock mass and grouting ring permeability coefficients (50, 100, 150, and 200), under different working conditions, Figure 6 illustrates the variation in water inflow concerning the parameters of the grouting ring across different sections.
From Figure 6, it can be observed that the water inflow exhibits a non-linear decrease as the permeability coefficient of the grouting ring decreases and its thickness increases. Notably, an increase in the permeabilitycoefficient of the grouting ring leads to a significant reduction in water inflow. Specifically, when reducing the permeability coefficient of the groutingring from 1/50 to 1/100 of that of surrounding rock, there is an approximate 49% reduction in water inflow. Similarly, further decreasing it from 1/100 to1/150 results in about a 33% reduction with diminishing magnitude. However, once reaching a certain threshold (when the permeability coefficientequals that of surrounding rock divided by 100), no significant decrease in water inflow is observed. Moreover, while increasing the thickness of thegrouting ring gradually reduces tunnel water inflow, beyond a certain threshold (e.g., 8-m thickness), no further significant reduction occurs.Considering both economic costs and construction capabilities, employing a permeability coefficient ratio (n) between surrounding rock and groutingring at n=100 along with an 8 m thick grouting ring effectively controls water inflow.
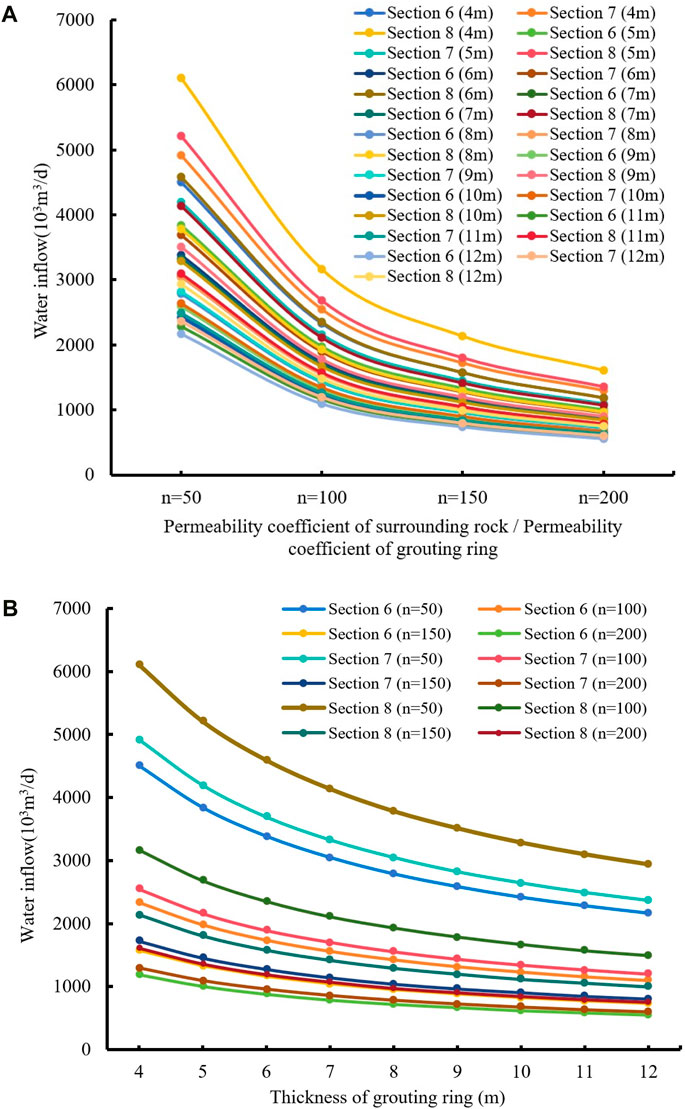
FIGURE 6. Variation curve of water inflow in the section with different parameters of grouting ring. (A), Change curve of water inflow with different grouting ring permeability coefficient; (B), Change curve of water inflow with different grouting ring thickness.
Due to unfavorable geological conditions and the low quality of surrounding rocks, FLAC3D three-dimensional simulation software was employed to analyze the stability of surrounding rocks in a 25 m section at 9 drilling locations during tunnel construction. The objective of this study was to investigate the impact of different grouting ring thicknesses on rock stability, determine the optimal grouting reinforcement thickness, ensure safe tunnel construction, and optimize costs. A total of 153 scenarios were considered by setting seventeen grouting scenarios for each drilling area with varying grouting thicknesses ranging from 4.0m to 12.0 m. Through numerical forward simulations, we obtained spatiotemporal evolution patterns of tunnel rock displacement under different scenarios and analyzed the stability of surrounding rocks under fluid-solid coupling conditions using various scenarios.
An external software was utilized to model and import FLAC3D, establishing a numerical calculation model with dimensions of 150m×150m×25m, as illustrated in Figure 7. The front, back, left, right, and bottom boundaries of the model were fixed while the top surface remained free. Following Darcy’s law, it is assumed that the surrounding rock of the tunnel constitutes a homogeneous, continuous, isotropic medium with constant flow permeability. The groundwater level remains unchanged during tunnel excavation drainage.
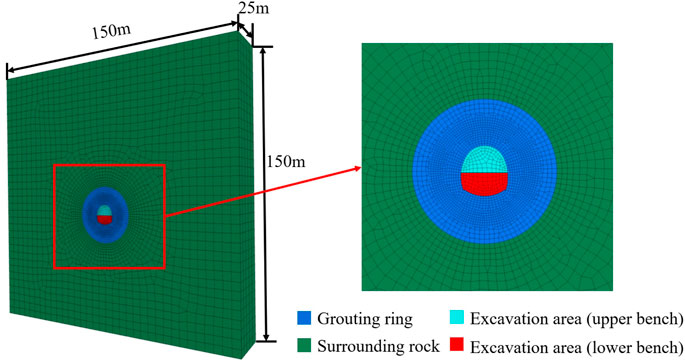
FIGURE 7. Full 3D numerical calculation model.
The parameters of different strata and grouting rings in numerical simulation are shown in Table 4.
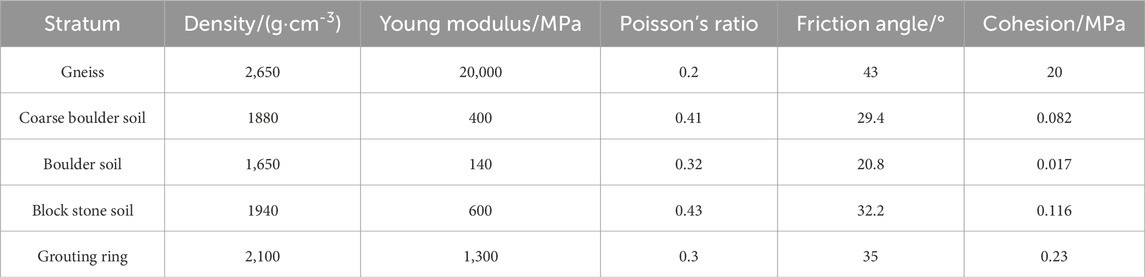
TABLE 4. The parameters of different strata and grouting rings.
Using the tunnel cross-section in the initial drilling area as a case study, this investigation examines the deformation image of vertical displacement under varying grouting thicknesses. By conducting a comprehensive analysis of arch settlement curves at different sections with diverse grouting thicknesses, an informed conclusion regarding the optimal grouting thickness is derived. The vertical displacement image for various grouting ring thickness of drill hole 1 are presented in Figure 8.
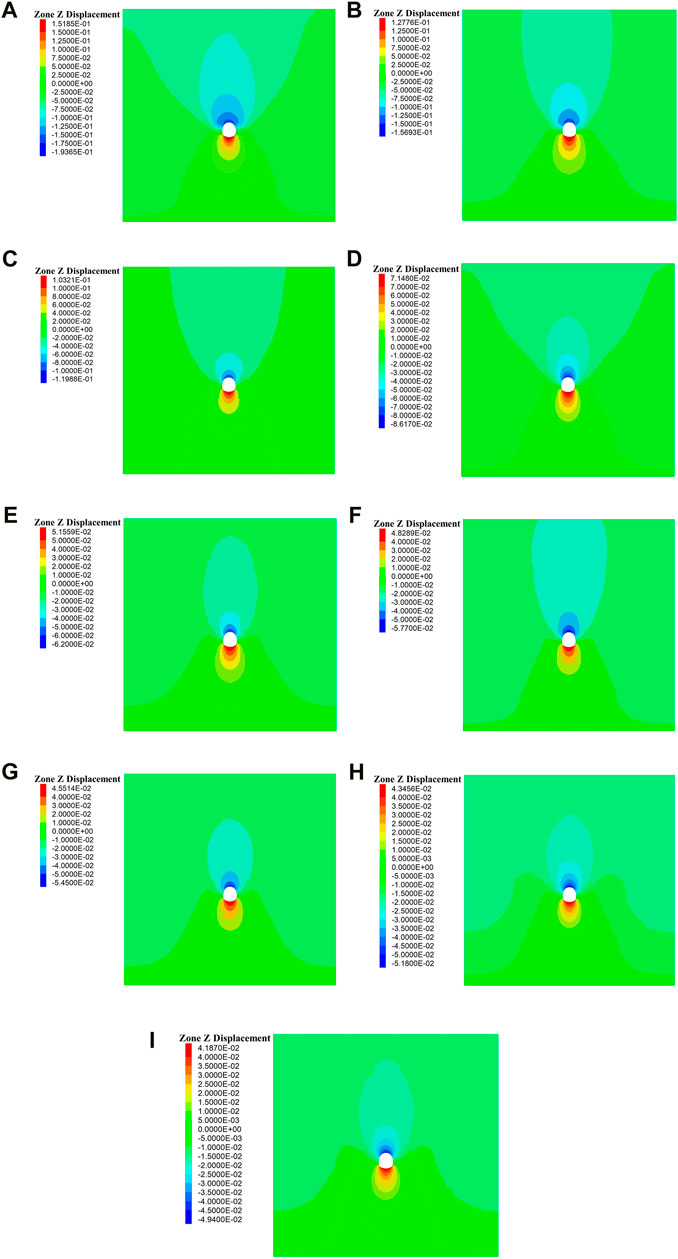
FIGURE 8. Vertical displacement image for various grouting thickness of drill hole 1. (A), The thickness of grouting ring is 4 m; (B), The thickness of grouting ring is 5 m; (C), The thickness of grouting ring is 6 m; (D), The thickness of grouting ring is 7 m; (E), The thickness of grouting ring is 8 m; (F), The thickness of grouting ring is 9 m; (G), The thickness of grouting ring is 10 m; (H), The thickness of grouting ring is 11 m; (I), The thickness of grouting ring is 12 m.
By analyzing the vertical displacement field in Figure 8, it can be inferred that the deformation pattern of surrounding rock after tunnel excavation remains consistent across different grouting thicknesses, with the maximum deformation occurring at the crown. As the grouting thickness increases, there is a gradual reduction in maximum settlement at the crown. When increasing the grouting thickness from 4 m to 8 m, successive maximum settlements at the crown are observed as 19.4 cm, 15.7 cm, 12 cm, 8.6 cm, and finally reaching a decrease of more than 2 cm each time; further increasing grouting thickness up to 12 m only slightly reduces successive maximum settlements at the crown to values of 5.77 cm, 5.45 cm, 5.18 cm and eventually reaching a minimum reduction of merely 0.53 cm. Variation curve of vault settlement with different grouting thickness at each drill hole is showed in Figure 9.
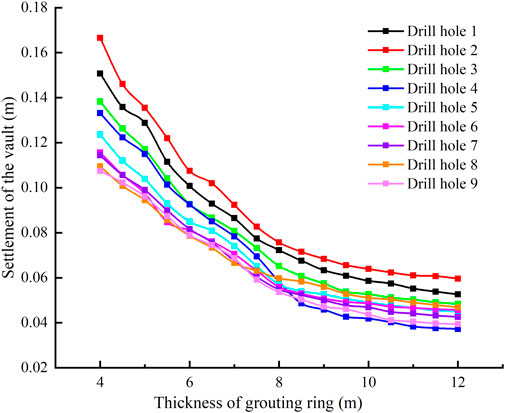
FIGURE 9. Variation curve of vault settlement with different grouting thickness at each drill hole.
By analyzing the settlement variation curve in Figure 9, it can be observed that for each drilling section, the effect of arching settlement control becomes quite evident as the grouting thickness increases from 4 m to 8 m, resulting in a reduction of settlement values by 45%–56%. The curve stabilizes after reaching a grouting thickness of 8 m and continues to increase up to 12 m only leads to a marginal decrease in settlement values by 18%–36%. This indicates that further increasing the grouting thickness does not have a significantly stronger control effect on vertical displacement. Considering safety and cost-effectiveness factors, it is recommended to choose a grouting thickness of 8 m.
(1) The predicted results of different formulas for calculating water inflow may exhibit slight variations; however, the overall trend of water inflow remains consistent. Considering the inherent unpredictability of tunnel water inflow, and taking into account various calculation results, the estimated normal water inflow in this tunnel is approximately 115.5908×10³ m3/d; with a maximum potential water inflow around 210.9100×10³ m3/d, particularly in Sections 6, 7, and 8 where the water inflow is relatively large.
(2) Pre-grouting curtain serves as an effective measure to prevent and control water inflow. Increasing the thickness of grouting rings while reducing their permeability coefficient can effectively mitigate the amount of infiltrating water entering the tunnel. However, further adjustments to these parameters yield diminishing returns in terms of reducing water inflow. In this particular tunnel project, employing a permeability coefficient n) value of 100 for surrounding rock along with an optimal grouting thickness set at 8 m would sufficiently control the volume of incoming groundwater.
(3) Pre-grouting curtain exhibits a noticeable effect on enhancing stability in tunnel surrounding rock; however, its strengthening effect diminishes as its thickness increases beyond a threshold. Increasing the grouting thickness from 4m to 8 m effectively controls arch settlement effects. However, further increasing the grouting thickness does not significantly enhance control over vertical displacement. Taking safety and economic factors into consideration, it is suggested that an optimal grouting thickness should be at least set at 8 m.
The original contributions presented in the study are included in the article/Supplementary material, further inquiries can be directed to the corresponding authors.
YC: Funding acquisition, Project administration, Writing–review and editing. ML: Data curation, Formal Analysis, Writing–original draft. MS: Data curation, Investigation, Writing–original draft. MD: Data curation, Software, Writing–original draft. HL: Investigation, Writing–original draft. YJ: Software, Writing–original draft.
The author(s) declare financial support was received for the research, authorship, and/or publication of this article. This study is financially supported by the National Natural Science Foundation of China (Nos 42172310 and 51609130).
The authors gratefully acknowledge Shandong Jianzhu University and Shandong University that have contributed to the research results reported within this paper.
The authors declare that the research was conducted in the absence of any commercial or financial relationships that could be construed as a potential conflict of interest.
All claims expressed in this article are solely those of the authors and do not necessarily represent those of their affiliated organizations, or those of the publisher, the editors and the reviewers. Any product that may be evaluated in this article, or claim that may be made by its manufacturer, is not guaranteed or endorsed by the publisher.
Chen, D., Chen, Y., Hong, J., et al. (2017). Prediction of water inflow in the long diversion tunnel of Danba Hydropower Station. J. Wuhan Univ. Eng. Ed. 50 (02), 193–199+206. doi:10.14188/j.1671-8844.2017-02-006
Chen, Q., Liang, L., Zou, B., Xu, C., Kong, B., and Ma, J. (2023). Analytical solutions of steady a seepage field for deep-buried tunnel with grouting ring considering anisotropic flow. J. Mar. Sci. Eng. 10 (12), 1861. doi:10.3390/jmse10121861
Chen, Y., Gao, T., Yin, F., Liu, X., and Wang, J. (2022). Study on influence of joint locations and hydraulic coupling actions on rock masses’ failure process. Energies 15 (11), 4024. doi:10.3390/en15114024
Chen, Y. J., and Zhang, X. (2019). Analytical plastic solution around soil-digging holes for inclined building and its application. Int. J. Civ. Eng. 17, 245–252. doi:10.1007/s40999-017-0230-7
Cheng, X., Sheng, L., Xia, Z., Liu, Y., Ma, X., Pan, J., et al. (2024). Grouting theory and strategy of simultaneous control of the horizontal and vertical deformations of tunnels. Int. J. GEOMECHANICS 24 (2), 04023267. doi:10.1061/IJGNAI.GMENG-8839
Fu, H. L., An, P. T., Cheng, G. W., Wen, S., and Li, J. (2022). Calculation of the allowable drainage of parallel tunnels based on ecological environment protection. KSCE J. Civ. Eng. 26 (5), 2420–2427. doi:10.1007/s12205-022-0401-1
Han, J., Wang, J., Yang, W., Wang, X., Ma, R., et al. (2023). Experimental study on the properties of a polymer-modified superfine cementitious composite material for waterproofing and plugging. Case Stud. Constr. Mater. 19, e02552. doi:10.1016/j.cscm.2023.e02552
Jiang, P., Zhang, Z., Zheng, H., and Huang, J. k. (2023). Coupling analysis method of grouting construction with deformation response of adjacent existing tunnel. Undergr. SPACE 15, 312–330. doi:10.1016/j.undsp.2023.07.005
Lan, X., Zhang, X., Yin, Z., Li, X., and Yang, T. (2021). Mitigation of karst tunnel water inrush during operation in seasonal variation zone: case study in nanshibi tunnel. J. Perform. Constr. Facil. 35 (3), 04021010. doi:10.1061/(ASCE)CF.1943-5509.0001573
Li, L., Chen, H. H., Li, J. P., and Sun, D. (2021). A semi-analytical solution to steady-state groundwater inflow into a circular tunnel considering anisotropic permeability. Tunn. And Undergr. Space Technol. 116, 104115. doi:10.1016/j.tust.2021.104115
Li, T. L., Zhao, W., Liu, R., Han, J., Jia, P., and Cheng, C. (2023). Visualized direct shear test of the interface between gravelly sand and concrete pipe. Can. Geotechnical J. 61, 361–374. doi:10.1139/cgj-2022-0007
Lin, L., Chen, H., Li, J., and Sun, D. (2021). A semi-analytical solution to steady-state groundwater inflow into a circular tunnel considering anisotropic permeability. Tunn. Undergr. space Technol. 116, 104115. doi:10.1016/j.tust.2021.104115
Liu, J. Q., Sun, Y. K., Li, C. J., Yuan, H. l., Chen, W. Z., Liu, X. Y., et al. (2022). Field monitoring and numerical analysis of tunnel water inrush and the environmental changes. Tunn. And Undergr. Space Technol. 122, 104360. doi:10.1016/j.tust.2021.104360
Peng, P., Peng, F., Sun, Z., and Zhang, D. (2022). Grouting for tunnel stability control and inadequate grouting section recognition: a case study of countermeasure of giant karst cave. Appl. SCIENCES-BASEL 12 (23), 11895. doi:10.3390/app122311895
Tao, H., Liu, S., Zhang, X., Meng, L., and Wang, P. (2023). Numerical analysis of grouting of water-enriched karst highway tunnel based on critical water-enriched height. Processes 11 (1), 149. doi:10.3390/pr11010149
Wang, L. (2023). Prediction of water inflow in submarine tunnels and optimization of waterproof and drainage systems. Jinan, Shandong Jianzhu University. doi:10.27273/d.cnki.gsajc.2023.000525
Wang, T., Zhou, Q., Guo, C., Yang, S., Dan, L., et al. (2022). “Application analysis on convergence deformation of soft soil shield tunnel controlled by grouting,” in 2022 8TH INTERNATIONAL CONFERENCE ON HYDRAULIC AND CIVIL ENGINEERING: DEEP SPACE INTELLIGENT DEVELOPMENT AND UTILIZATION FORUM ICHCE, Xi’an, China, 25-27 November 2022, 324–332. doi:10.1109/ICHCE57331.2022.10042634
Wu, J., Zhou, Z., Li, M., et al. (2019). Research progress on calculation methods for predicting tunnel water inflow. J. Eng. Geol. 27 (04), 890–902. doi:10.13544/j.cnki.jeg.2018-245
Xu, L. L., Cai, M. F., Dong, S. N., Yin, S., Xiao, T., Dai, Z., et al. (2022). An upscaling approach to predict mine water inflow from roof sandstone aquifers. J. Hydrology 612 (C), 128314. doi:10.1016/j.jhydrol.2022.128314
Xue, X., Zhang, J., Su, Z., et al. (2015). Study on the grouting pre-reinforcement mechanism and effect evaluation in water-rich loess tunnel. Proc. Int. Conf. Adv. Des. Manuf. Eng. 39, 1084–1088.
Ye, W. (2023). Water inrush prediction and plugging technology scheme for shallow buried tunnels on the Binggou Fushui fault. China Railw. (06), 25–31. doi:10.19549/j.issn.1001-683x.2022.12.01.002
Yuan, J., Chen, W., Tan, X., Yang, D., and Wang, S. (2019). Countermeasures of water and mud inrush disaster in completely weathered granite tunnels: a case study. Environ. Earth Sci. 78 (18), 576. doi:10.1007/s12665-019-8590-8
Keywords: mountain tunnel, adverse geology, water inflow, rock stability, grouting ring, numerical simulation
Citation: Chen Y, Liu M, Su M, Ding M, Li H and Jing Y (2024) Prediction of water inflow and analysis of surrounding rock stability in unfavorable geological mountain tunnel. Front. Earth Sci. 12:1373627. doi: 10.3389/feart.2024.1373627
Received: 20 January 2024; Accepted: 05 February 2024;
Published: 28 February 2024.
Edited by:
Xiaoyu Bai, Qingdao University of Technology, ChinaReviewed by:
Lu Chen, Changsha University of Science and Technology, ChinaCopyright © 2024 Chen, Liu, Su, Ding, Li and Jing. This is an open-access article distributed under the terms of the Creative Commons Attribution License (CC BY). The use, distribution or reproduction in other forums is permitted, provided the original author(s) and the copyright owner(s) are credited and that the original publication in this journal is cited, in accordance with accepted academic practice. No use, distribution or reproduction is permitted which does not comply with these terms.
*Correspondence: Mengyue Liu, bGl1eXV4aW1lbmdAMTYzLmNvbQ==; Mengzhen Su, c216MTU2MTU0ODA3MzhAMTYzLmNvbQ==
Disclaimer: All claims expressed in this article are solely those of the authors and do not necessarily represent those of their affiliated organizations, or those of the publisher, the editors and the reviewers. Any product that may be evaluated in this article or claim that may be made by its manufacturer is not guaranteed or endorsed by the publisher.
Research integrity at Frontiers
Learn more about the work of our research integrity team to safeguard the quality of each article we publish.