 Carla Braitenberg
- Dipartimento di Matematica, Informatica e Geoscienze, Università di Trieste, Trieste, Italy
This study explores the dynamic evolution of the Hunga Volcano in the Kingdom of Tonga and covers two volcanic unrests, focusing on the creation and subsequent disappearance of a new island between Hunga Tonga (HT) and Hunga Ha'apai (HH) between 2013 and 2023. The island expanded in 2015 and vanished in January 2022 due to a massive eruption (VEI = 6), featuring a 57 km high volcanic cloud and generating multiple tsunamis that caused damage across the Pacific Ocean. Utilizing remote sensing techniques, including multispectral imaging from Sentinel 2, Landsat 8-9, and synthetic aperture radar (SAR) imaging from Sentinel 1, the research employs a supervised random forest classification algorithm to individuate the changing subaerial surface area of the volcano. This approach documents size variations in the islands, particularly during weeks surrounding two volcanic unrests. The classifier, trained on nearly cloud-free multispectral images, automatically delineates surface area changes over the years. The temporal resolution of area change, limited to images with less than 5% cloudiness, encompasses about 50% of Landsat and 20% of Sentinel 2 images between 2013 and 2023, selected from 739 available images. The multispectral observations are complemented by 215 Sentinel 1 SAR images, penetrating clouds, though with limited bands. Despite higher noise, the classifier on Sentinel 1 successfully distinguishes land from ocean. Sentinel 1 observations, starting in 2014, cover the volcano unrest of 2014/2015. Earth Engine, a cloud computing data facility, is used for processing. Analysis indicates a slight decrease in the area change post-2015 island formation and identifies the disappearance of the island bridge connecting HT and HH, along with two smaller islands south of HT and HH in 2022. The 2022 explosion is preceded by an increase in island area in the weeks before the eruption. Global satellite coverage could automatically detect changes in oceanic areas and distinguish water from new volcanic islands, offering a means of identifying volcanic unrests and documenting their evolution.
1 Introduction
The Hunga volcano, located in the Kingdom of Tonga, is part of the Tonga-Kermadec intra-oceanic volcanic arc, formed by the rapid subduction of the Pacific Plate. Rising 1,500 m above the sea floor, the volcano sits on a crust 20 km thick, as reported by Contreras-Reyes et al. (2011), and features an active caldera (Hekinian et al., 2008). Above sea level, two islands, Hunga Tonga (HT) and Hunga Ha'apai (HH), emerge from the caldera rim. The islands’ stratigraphy comprises lava, including basaltic andesite to andesite dykes at the base. Above this, three sequences of ignimbrites of varying ages are found, topped by volcaniclastic deposits (Bryan, Stice, and Ewart, 1972).
Historical documented caldera-forming eruptions date to 1,040–1180 AD, of which the HT and HH islands are the remnants of the volcano cone, with sequences overlying two or more older volcanic deposits (Brenna et al., 2022). Further notable eruptions are described with an orientation map displaying the positions of the vents in Brenna et al. (2022); the eruptions in 1912 and 1937 occurred between the two islands, originating from the caldera rim. A smaller, unobserved eruption took place from 1–3 June 1988, originating in shallow water south-southeast of HH. Lava erupted from three vents in a southwest-northeast direction, covering 100–200 m, but barely reached the ocean surface and did not form a new island (Global Volcanism Program and Venzke, 2023).
The subsequent eruption on 17 March 2009 (Vaughan and Webley, 2010; Bohnenstiehl et al., 2013; Colombier et al., 2018) emerged from two vents on HH, adding tephra land to the island’s northwest coast and southwards from its tip. This expansion increased the island’s size from 0.51 km2 to 1.42 km2. Anomalous ocean coloring indicated tephra and hydrothermal mineral precipitation. The easily erodible tephra led to a reduction in the island surface to 1 km2 by November 2009. The subaerial erupted volume exceeded 0.00176 km³, excluding submarine deposits. Remote sensing estimates were based on ASTER and MODIS instruments on Terra and ACQUA satellites (Vaughan and Webley, 2010). Pumice rafts were observed in the ocean, 40 km from the vent.
The subsequent eruption in 2014 created an island bridge between Hunga Tonga and Hunga Ha'apai. This volcanic activity persisted from 19 September 2014 to January 2015, as documented by Garvin et al. (2018) and Colombier et al. (2018). The evolution of this event was meticulously investigated through sea-borne data acquisitions and geological sampling (Garvin et al., 2018). The newly formed volcanic island rose 300 m above the caldera floor, becoming a part of the much larger volcanic edifice. The entire edifice reached a height of 1,500 m above the sea floor, with a top diameter of 5 km.
Despite the overarching dimensions of the volcanic edifice, the eruption resulting in the island’s creation occupied only a fraction of the entire caldera. Typically, newly formed volcanic islands have a short lifespan (Garvin et al., 2018), lasting less than a year due to their composition of easily erodible tephra rock, susceptible to the forces of oceanic waves and wind. However, the HT and HH island system defied this norm, surviving for more than 6 years until it succumbed to the volcanic crisis in December 2021–January 2022.
The prolonged survival of the islands is attributed to the presence of basalt in the erupted material and the potential consolidation of the tephra material over time, counteracting erosional processes.
The anticipated timeline was abruptly interrupted by the volcanic unrest triggered by a magnitude 4.7 earthquake at the noticeable depth of 79 km beneath the volcano edifice on 18 December 2021. The island bridge underwent significant effects during various stages of volcanic unrest, ultimately vanishing entirely following the violent volcanic eruption (volcanic explosivity index (VEI) 6) on 15 January 2022 (Poli and Shapiro, 2022), which produced a volcano plume reaching 57 km above the sea surface to the stratosphere (Carr et al., 2022). The volcanic plume reached the mesosphere, a height never observed before, and was documented by observations from a geostationary satellite (Proud et al., 2022).
The explosion generated a globally observed tsunami, which was modeled to have been generated by the air-pressure pulse generated by the explosion, which circled the earth and, through air-sea coupling, transferred energy to the ocean (Lynett et al., 2022; Omira et al., 2022; Borrero et al., 2023; Purkis et al., 2023; Schindelé et al., 2024). The tsunami was observed along the coast of Mexico, the Caribbean, and the Mediterranean (Ortiz-Huerta and Ortiz, 2022; Ramírez-Herrera et al., 2022). The sequence of multiple explosive events in terms of locations and timing was derived from the back-projection of teleseismic P-waves (Tarumi and Yoshizawa, 2023). The immediate post-eruptive seismicity showed migration of seismicity toward the Hunga volcano islands from the northwest, peaking in frequency and magnitude 3 days after the explosion, which is interpreted as possibly being due to a magma resupply (Kintner et al., 2023).
The January explosion is well-documented through videos in social media (USGS Youtube, 2022; UTD GeoscienceStudio, 2022; Geology Hub, 2023; Global Volcanism Program and Venzke, 2023) and has triggered many scientific publications on diverse subjects such as climate impact (Schoeberl et al., 2023), atmospheric waves excitation (Wright et al., 2022), and ionosphere perturbation (Astafyeva et al., 2022). An overview is given in Manneela and Kumar (2022).
This study aims to depict the island’s evolution using multispectral images from Sentinel 1 and Sentinel 2, Landsat 8, and Landsat 9. The analysis aims to monitor the island’s shape to detect slow changes in the islands’ surface extension and, particularly, whether an area increase generated by emerging land from the sea was detected before the main volcanic explosion of 2022. An island uplift would be expected for a magma chamber pressurization and volcano inflation, as has been observed in other volcanos (Nomikou et al., 2014; Wang et al., 2021).
2 Materials and methods
Multispectral imaging was employed to observe the volcanic islands emerging at the surface. In documenting the volcanic evolution after 2013 and the evolution of the created islands, multispectral imaging data from the Sentinel 2 and Landsat 8, 9 satellites and SAR images from Sentinel 1 were utilized. The data acquisition and processing platform is Earth Engine, which accesses the data in the form of an image collection for each satellite, making a large collection of processing algorithms available in a cloud-housed JavaScript coding environment. The flowchart shown in Figure 1 summarizes the steps accomplished for the processing.
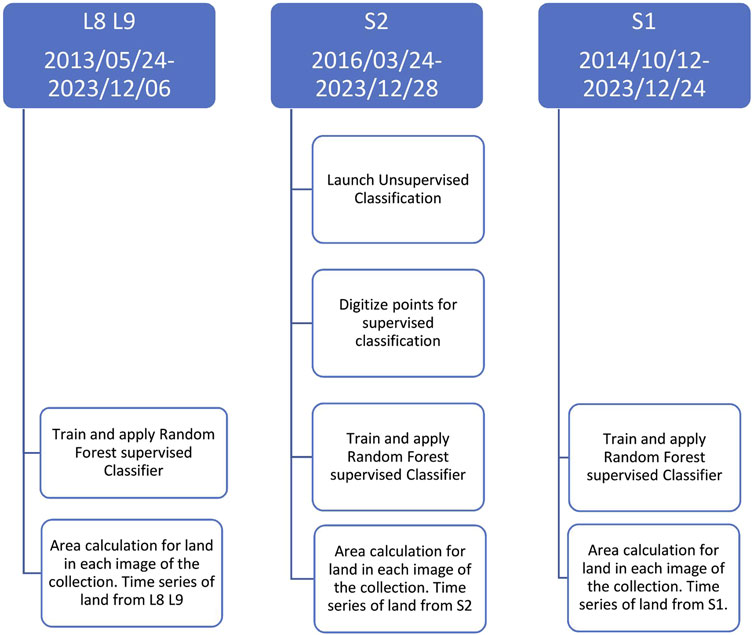
Figure 1. Flowchart of the processing. The start and end dates refer to the times of the first and last images used in the time series calculation, also considering the selection of images with a small cloud cover percentage. The dates of the start of the first acquisition are reported in Sections 2.1 and 2.2. Acquisitions of Sentinel 1 and 2 and Landsat 9 are still ongoing at the time of writing.
2.1 Processing of Sentinel 2 and Landsat 8 and 9 images
The Sentinel 2 mission consists of two satellites in sun-synchronous repeat orbit, which were launched on 23 June 2015 and 7 March 2017, respectively. The sun-synchronous orbit is at an altitude of 786 km, and the revisit time is 5 days at the equator for the two-satellite constellation. The payload is the multispectral imager covering 13 spectral bands (443 nm–2190 nm) at 10 m resolution for the visible and near-infrared bands, 20 m for the shortwave infrared bands, and 60 m for three bands (aerosols, water vapor, and cloud mask). The images are produced by the European Space Agency (ESA) at the Level 1C or Level 2A processing stages: Level-1C processing uses the raw data converted to radiometric units (Level-0) to produce top-of-atmosphere (TOA) reflectance values on a regular grid, for an ortho-rectified geometry. The quality masks in raster format are calculated at this stage. The Level-2A processing done routinely by ESA applies an atmospheric correction to the TOA product to obtain the “surface reflectance,” formerly known as “bottom of atmosphere (BOA) reflectance.” A scene classification is added based on indexes using normalized differences of selected bands, consisting of three classes of clouds and six classes for shadows, cloud shadows, vegetation, not vegetation, water, and snow. The atmospheric correction is performed through the “sen2cor” algorithm (Main-Korn et al., 2017). More information on the Sentinel 2 mission is well-documented on the website (https://sentinel.esa.int/web/sentinel/missions/sentinel-2).
In this work, the images are retrieved through the Earth Engine web application using the “COPERNICUS_HARMONIZED” image collection, which points to the Level-1C data, starting on 23 June 2015. The Level-2A data are found in the “COPERNICUS/S2_SR_HARMONIZED” collection, which starts 28 March 2017. To distinguish the emerging islands, the higher-level surface reflectance product (Level-2A) is not mandatory, and preference is given to the TOA product as it starts 21 months earlier. The Sentinel 2 images after 25 January 2022 have a bias of 1,000 digital units in the radiance at sensor values, and the harmonized collection corrects for the bias so that the more recent scenes have been shifted to the same level as the older ones.
The bands we use in Earth Engine represent top-of-atmosphere (TOA) reflectance scaled by 10,000. The cloudiness percentage of the images is included in the metadata of each image and is based on the 13th band (the QA band in Earth Engine) of the images, which contains cloud information. The calculation of the surface area time series of the island extension requires cloud-free images because the clouds are not penetrated by the electromagnetic spectrum used by this satellite. Therefore, we limit the analysis to images with very low cloud percentage and find that the value of 1.3% reaches clean results (44 images), and a value of 5% (113 images) gives a noisier area time series with a better time resolution, without the characteristic peaks in the reflectance values characteristics of clouds.
The available images can be analyzed for a first inspection through the image browser of Earth Engine: https://showcase.earthengine.app/view/s2-sr-browser-s2cloudless-nb.
Landsat 8 and 9 are Earth observation satellites operated by the United States Geological Survey (USGS) and NASA. Landsat 8 was launched on 11 February 2013 on a sun-synchronous polar orbit, with a 16-day repeat cycle. The payload includes the operational land imager (OLI), which operates in nine spectral bands, including visible, near-infrared, and shortwave infrared. The thermal infrared sensor (TIRS) measures the thermal infrared bands. OLI has a ground resolution of 30 m for visible, near-infrared, and shortwave infrared bands, and TIRS has a ground resolution of 100 m for thermal bands. Landsat 9 was launched on 16 September 2021. The orbit is similar to that of Landsat 8, so the joint revisit time is 8 days. The payload is similar to that of Landsat 8, with some improvements and enhanced capabilities. The ground resolution is the same. The information on the Landsat 8 and 9 satellites are found on the following websites: https://landsat.gsfc.nasa.gov/satellites/landsat-8/ and https://landsat.gsfc.nasa.gov/satellites/landsat-9/.
The images are retrieved through the Earth Engine web application using the “LANDSAT/LC08/C02/T1_TOA” and “LANDSAT/LC09/C02/T1_TOA” top-of-atmosphere reflectance image collection. The collection contains the 2 Tier 1 calibrated top-of-atmosphere (TOA) reflectance, with calibration coefficients extracted from the image metadata. This collection has only Landsat scenes with the highest available data quality, and the scenes are considered suitable for time-series processing analysis. Tier 1 includes Level-1 Precision Terrain (L1TP) processed data that have well-characterized radiometry and are inter-calibrated across the different Landsat sensors. The geo-registration of Tier 1 scenes is consistent and within prescribed tolerances (<=12 m root mean square error). All Tier 1 Landsat data can be considered consistent and inter-calibrated (regardless of sensor) across the full collection (see https://code.earthengine.google.com/).
2.2 Processing of Sentinel 1 SAR images
The SAR images that illustrate the Hunga Tonga and Hunga Ha'apai (HTHH) evolution capture surface and ocean reflections of microwave pulses transmitted and received by the active system on the Sentinel 1 satellite. These images represent the logarithmic scale amplitude of the return signal for each pixel, organized along azimuth and range directions with a nominal spatial resolution of 5 m in azimuth and 20 m in range. The Sentinel 1 mission consists of two satellites, Sentinel 1A and 1B, orbiting at a half-orbit distance from each other, enabling a revisit time of 6 days. Sentinel 1A, launched on 3 April 2014, covers the island’s appearance, while Sentinel 1B, launched on 15 April 2016, offers a higher revisit time of 6 days since its launch. The satellite’s C-Band SAR system operates at a center frequency of 5.405 GHz, with possible polarizations (VV, VH, HH, and HV) and an incidence angle of 20°–45°. Image processing in the Earth Engine scripting environment involved utilizing the “COPERNICUS/S1_GRD” image collection, containing the backscatter coefficient (BC) of each pixel, derived from processing Level 1 acquisitions with the Sentinel 1 Toolbox and expressed in dB (10*log10(BC)). The documentation is found at https://sentinels.copernicus.eu/web/sentinel/missions/sentinel-1.
The descending mode must be used to maximize the number of homogeneous images, with the VV and VH acquisitions totaling 178 images between 16 May 2015 and 16 December 2023. For the same period, the ascending images amount to only one-third of this amount. We add a standard deviation band calculated over a moving window to the images with the aim of adding information that can be used by the classifier to distinguish the island surface area change. The standard deviation is calculated to a moving square window of seven pixels centered on each pixel. Between 12 October 2014 and 29 January 2017, only the VV reflectivity is present, so these images are classified with a classifier trained without using the VH band and relying only on the VV and the standard deviation of the VV band.
2.3 Unsupervised and supervised classification algorithms
Earth Engine offers the unsupervised clustering algorithms found in the WEKA Clustering Algorithms initiative hosted at the University of Waikato, Australia (Frank et al., 2016). We used the “k-means” algorithm. It can use either the Euclidean distance (default) or the Manhattan distance, where the latter computes the centroids through the median rather than the means of components, which is more stable and less prone to outliers than the mean. The goal of the k-means algorithm is to find the centers of k clusters so as to minimize the sum of the squared distances between the sample points and the closest clustering center (Arthur and Vassilvitskii, 2007). The operator defines the number of clusters k and the input sample points used to train the clusterer.
We refer to the supervised classification algorithm random forest offered in Earth Engine, which refers to the Smile—Statistical Machine Intelligence and Learning Engine (Li, 2014). The goal of the algorithm is to assign the pixels of the image, the instances, to a given number of classes. The classification is based on a training stage, in which a training set of instances is used to define the algorithm that best associates the instances to the given classes. The algorithm is then used to predict the class of the new instances, in our case, segments of images acquired at different times. The value ranges of the image bands can have very different amplitude ranges, which are difficult to handle for methods that use the functions of distance, like the k-means algorithm mentioned above. The decision tree methods work more efficiently for heterogeneous data (Li, 2014). Another problem is faced by correlated features when the input data are not independent, which can lead to numerical problems. In the case of the presence of linear or nonlinear relationships among the data defining a class, nonlinear support vector machines and decision trees give better performance. The HTHH presents essentially five classes: 1) the old islands, 2) the new island bridge created between 2014 and 2015, 3) the ocean, 4) the ocean break at the island shore, and 5) the inland lake. The breaking of waves along the shoreline identifies the “ocean break,” seen by a white rim in the optical images. The training instances are created by visual inspection of four cloudless images of Sentinel 2, selected from the years 2017–2018 and representing the four seasons. The training instances are merged into one, and the selection of different seasons is required because the image characteristics significantly change over the course of a year, particularly over the ocean and less over land.
The SAR Sentinel 1 distinguishes fewer features than the multispectral sensors S2 and L8/9; therefore, we must reduce the number of classes to three: 1) old islands, 2) new island bridge, and 3) the ocean. The ocean break, seen in the multispectral images by a whitish color, appears as land in the Sentinel 1 acquisitions. The lack of the ocean break in the SAR image will be seen later in the manuscript in Figures 2 and 3.
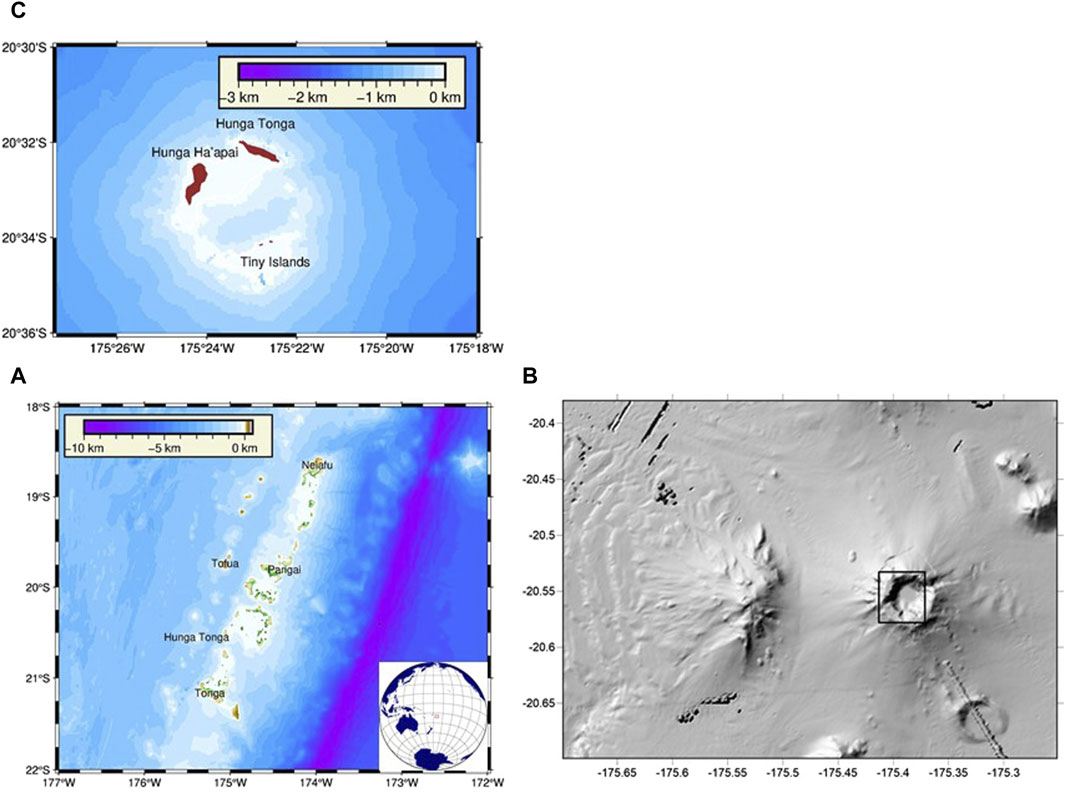
Figure 2. Bathymetry of the Hunga Volcano and surrounding areas from the regional to local scale. (A) Regional scale bathymetry (GEBCO database) and (B) post-2022 eruption bathymetry. The box shows the focus area of the present study (Le Mével et al., 2023). (C) Local pre-eruption bathymetry from NOAA/NCEI. The map includes the HT and HH islands to the north and the two tiny islands to the south. All emerge from the caldera rim.
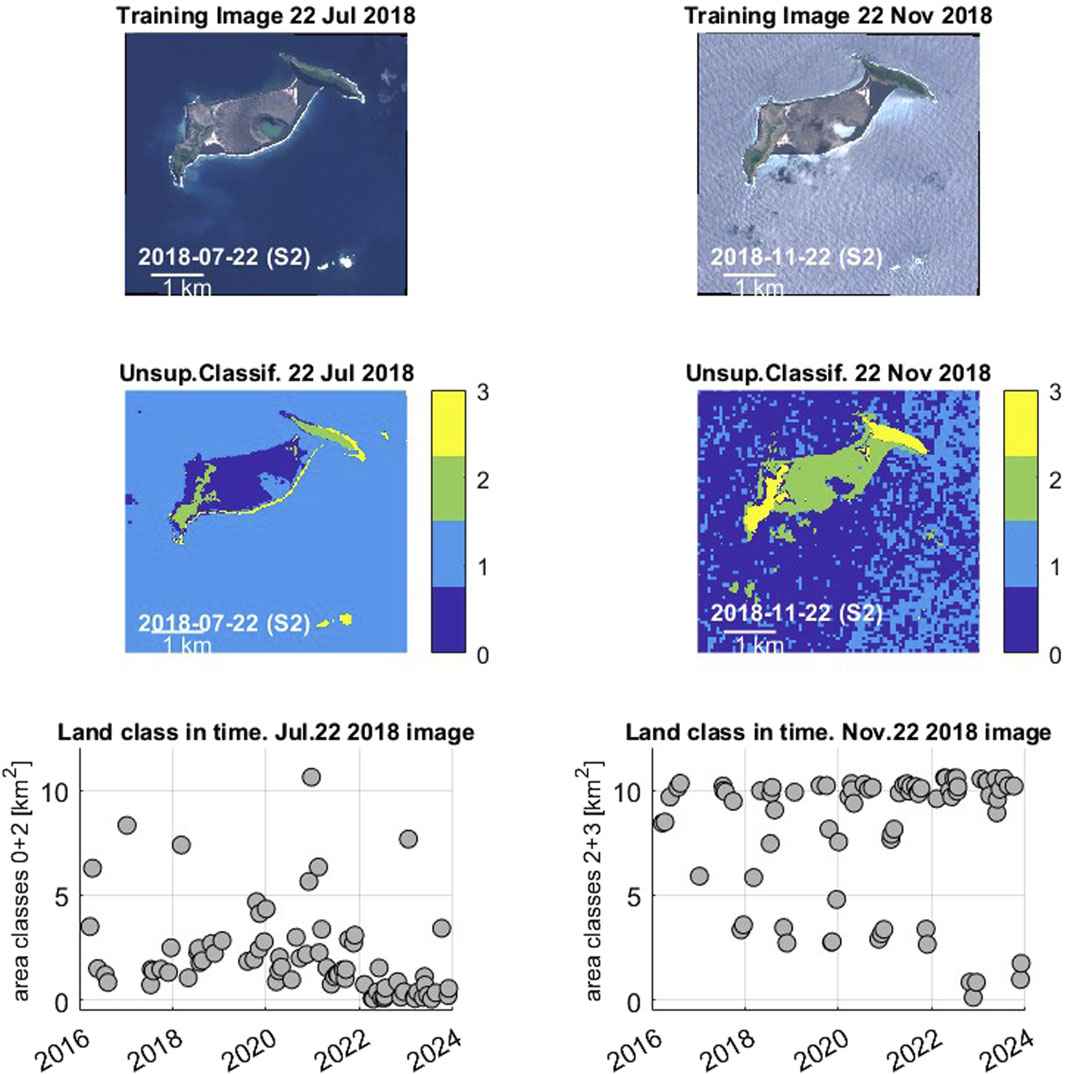
Figure 3. Unsupervised classification of a Sentinel 2 image among the least cloudy in 2018, one image in winter (November 2018) and one in summer (July 2018). The yellow and green classes identify the land areas for the November image, distinguishing old (class 3, yellow) and new class 2, green) island surfaces. Water is blue or azure (class 0 or 1). For the July image, the land is blue (class 0) or green (class 2, old islands). The land area change detected by the unsupervised classifier applying the clusterer developed by the training images of July and November 2018, respectively, is shown below each image.
3 Results
3.1 Unsupervised classification time series
The Sentinel 2 acquisitions are available from January 2016 to December 2023. The year 2018 was chosen to define the training image. For this year, the least cloudy images, which have close to 0% cloudiness, were tested for training. We show the results for an image acquired on 22 November 2018, and the acquisition on 22 July 2018 was used as an image acquired in summer with the lowest cloudiness. The four classes of interest are the ocean, the old islands, the new islands, and the breaking waters at the island shore. The unsupervised classification algorithm requires samples of the entire training image, which the algorithm is allowed to draw from an area that has been defined enclosing the HTHH islands plus a buffer of several km. The training image is well-classified, as shown in Figure 3. The old islands and the new islands have different classes and are distinguished because the vegetation that covers the old islands and reflects in the infrared bands is not well-developed in the new island bridge that was created in 2015. Using four or five classes does not significantly alter the classification result. The classification works well only for the months similar to the months chosen for the training image. In the opposite seasons, the ocean is no longer distinguished from land, and the calculated area reflects the entire surface of the region of interest but not the land areas. This also happens if the training image is selected from fall or summer; the oscillation persists, and the correct values are only found in the months close to the training image (see Figure 3). We have analyzed the yearly variation of the bands over the land and ocean areas (Figure 4) to select those bands with the least seasonal variation, as discussed below.
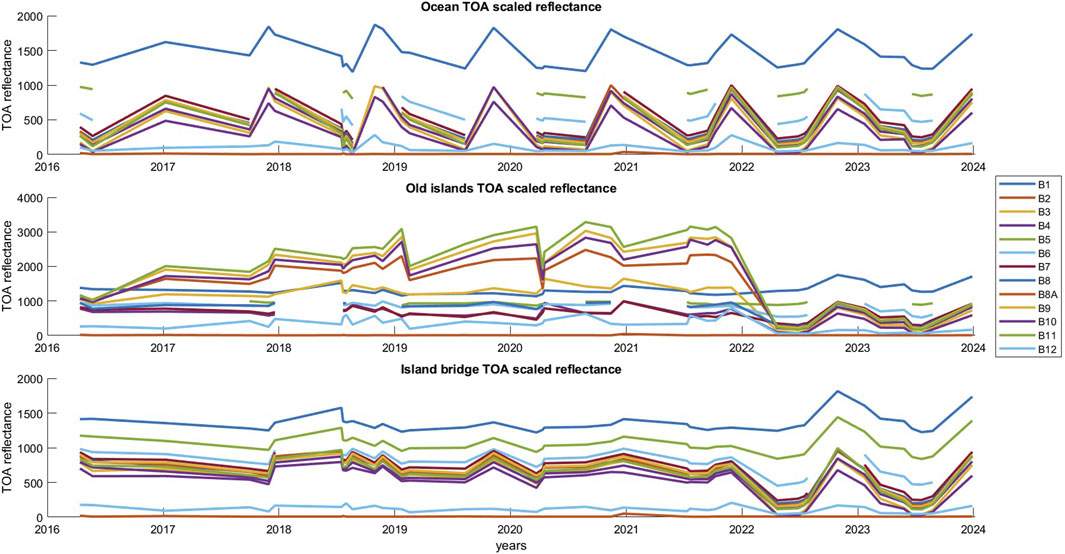
Figure 4. Spectral response of ocean and land during time. A strong seasonal variation is seen, which is the reason for the failure of the unsupervised classification of one image.
The time variation of the spectral bands over the ocean and the old and new islands is displayed in Figure 4. The spectral response in time is obtained by averaging the reflectance values over a selection of pixels over each of the land classes identified by the unsupervised classifier (Old Islands, New Island, Ocean). The new island spectral response is more stable. The ocean has a strong yearly variation amplitude over the entire spectrum, whereas the old islands show a steady increase in reflectance on near-infrared (NIR) to shortwave infrared (SWIR2) bands (Bands B8 to B12). The time series is made, allowing a 1.2% cloudiness of the Sentinel 2 image, which allows for a clean image. A higher percentage leads to time series that are affected by the high reflectance of the clouds.
For the land areas, the strong drop in reflectance between the end of 2021 and the first quartal of 2022 is due to the volcanic explosion of January 2022, which substantially reduced the island area. Because the island area was replaced by ocean water, the variations for these areas resemble those of the ocean after the explosion, with the peak on all bands on 30 October 2022. The old islands have a steady increase in the reflectance of B6 to B8A, presumably reflecting the increased coverage of soil with vegetation. This increase is not seen in the new island bridge. The ocean shows a strong increase in reflectance for the months in the last quartal of each year. This different yearly reflectance variation between land and ocean produces classification errors for the months in the opposite quartal of the training image. The spectral responses would suggest not considering the NIR and SWIR bands, although this band selection does not improve the result. The criterion of low seasonal variability would lead to selecting bands B9 and any other bands, excluding the infrared bands B6, B7, B8, and B8A. However, the failure of the classification persists independently of the selection of the bands used for classifying: either using all bands or a subset. The conclusion is that the unsupervised classification is unsuccessful in an environment in which a strong yearly variation in reflectance is present. Therefore, the supervised classifier is tested.
3.2 Supervised classification on Sentinel 2, Landsat 8 and 9, and Sentinel 1
We applied the supervised classification first on the Sentinel 2 and Landsat and then on the Sentinel 1 images. For Sentinel 2, the algorithm was trained on a feature collection of 444 features, each with 12 spectral bands, divided into 119 elements of class 1 (Island Bridge), 72 elements of class 2 (Old Islands), 169 elements of class 3 (Ocean), 51 elements of class 4 (Ocean Break), and 34 elements of class 5 (Volcano Mouth). The available images over the region of interest (ROI) are 113, in the interval between 24 December 2016 and 31 December 2023, allowing a cloudy pixel percentage of 5%. The training images from which the reference sites were picked were selected among the five least cloudy images over the years 2018 and 2019 and were taken on the following dates: 17 July 2018, 08 August 2018, 30 October 2018, 23 January 2019, and 09 November 2019, reaching a maximum cloudiness percentage of 0.29%. The choice of the years was thought to be in a period in which the HT and HH islands were stable, between the 2014/2015 and the 2021/2022 eruptions. The reference sites are randomly divided into 80% training and 20% validation samples, with 1808 elements of training data and 417 elements for validation. The classifier performance of the random forest classifier is stable with respect to the number of trees used as long as the number is larger than 15, which is the value at which the algorithm breaks down. A number of trees between 20 and 50 gives the same classifying results. The training error matrix is close to purely diagonal, with a few values off the diagonal, as given in the following matrix, which represents the number of features in input and output for each of the five classes. The values given are for 25 trees:
The matrix A has five rows, which give the number of classified reference sites in each class, represented by the first to the fifth column, indicating the class. The first row indicates the class of the reference sites which belong to class 1 that were classified. The correctly classified reference sites are given in the diagonal. The training overall accuracy is t= 0.99. t is defined as the sum of correctly classified reference sites divided by the total number of classified sites. This means that 99% of the reference sites were correctly classified.
The producer accuracy is defined as the ratio of reference sites classified correctly to the total number of reference sites in the class. These values are all high and close to 1; the smallest value is 0.97 for class 4 (Ocean break).
The validation error matrix B is calculated for the validation data, where the reference class and the calculated class are compared. The matrix B is again close to a diagonal, and the overall validation accuracy is still high (89%).
The producer validation values (see definition above) are a bit lower, and again the least well performing is class 4 (ocean break), with 64% of sites classified accurately on the entire class 4 ensemble. The single class validation is as follows: class 1: 89%, class 2: 95%, class 3: 95%, class 4: 64%, and class 5: 82%.
The Landsat images are classified in almost the same way, except for the different dates of acquisitions and the lower number of bands available for the Landsat suite. The cloudy pixel percentage of an image is estimated through the inbuilt cloud algorithm of Earth Engine (ee.Algorithms.Landsat.simpleCloudScore). This was not necessary for Sentinel 2 because the cloudy pixel percentage is a property of the Sentinel 2 images.
With the above definitions, the classification statistics are as follows:
Number of training elements: 1794. Number of validation elements: 431. Bands used: B2 to B9. Training accuracy: 0.99. The training error matrix is again close to purely diagonal, with few values off the diagonal, for the case with five classes. The values given are for 25 trees.
The producer accuracy values are all high, close to 1; the smallest value is 0.98 for class 4 (Ocean break).
The validation error matrix is close to diagonal, demonstrating the good performance of the classifier:
The producer validation values (see definition above) are high, and again, the least well performing is class 4 (ocean break), with 81% of sites classified accurately on the entire class 4 ensemble. The single class validations are as follows: class 1: 94%, class 2: 96%, class 3: 95%, class 4: 81%, and class 5: 100%.
For Sentinel 1, we use a very similar approach for classification, but the number of bands available in the images is reduced to the reflectivity in VV and VH in the best case, to which we have added the band of standard deviation of VV over a moving square window, so only up to three bands are present. As mentioned above, for the period between 12 October 2014 and 29 January 2017, only the VV reflectivity is available, so we have only the two bands, VV and the standard deviation of VV, to work on. A further drawback is given by the missing full coverage of the SAR acquisition between 24 November 2015 to 10 May 2016, for which reason the two small islands south of HTHH and the southernmost tip of the western HTHH island system lack coverage over an area of 0.09 km2. These months are very interesting because they cover the HTHH evolution through the 2014/2015 unrest and the following year. The Sentinel 2 images are not available during this time, as they start after the HTHH islands have stabilized after the eruption. Due to the reduced number of bands, we reduce the classes to three: the old island (class 1), the new islands (class 2), and the ocean (class 3). We again sample five images to train the classifier, which are chosen close in time to the ones used for the Sentinel 2 classification: 23 July 2018, 16 August 2018, 27 October 2018, 19 January 2019, and 15 November 2019. No information on cloudiness is given for the SAR images, but the SAR frequency penetrates clouds and is less affected. The training of the classifier used 1,432 elements, and the validation data had 368 elements. Again, the training error matrix is close to the diagonal, as shown in the following matrix, representing the number of features in input and output for each of the three classes. The values given are for 50 trees. For the less favorable case with the missing VH component:
The training overall accuracy is t = 0.98 and reduces slightly with a lower number of trees. Therefore, we use the random forest classifier with 50 trees. The producer accuracy values are all high, above 0.96. The training overall accuracy is slightly higher (t=0.99) when the same analysis is repeated using both VV and VH bands, with the standard deviation of the VV band.
The validation error matrix has several points off the diagonal; that is, there is a less successful classification of the Sentinel 1 data than the Sentinel 2 data, with an overall validation accuracy of 75% for the case with the missing VH band. The validation error matrix in that case is as follows:
The producer validation values (see definition above) are lower, and the single-class validations are as follows: class 1: 62%, class 2: 61%, and class 3: 91%. The ocean areas (class 3) seem to be better classified, although some ocean instances are classified as land, which will disturb the calculation of the island emerging areas discussed in the next section. Repeating the analysis, including the VH band, the overall validation accuracy is higher (84%), as are the producer validation accuracy values: class 1: 79%, class 2: 76%, and class 3: 92%.
3.3 Area of subaerial parts of the islands
The classification of the images in the ROI allows for estimating the area change of the islands from 2013 to 2023 when using Sentinel 1 and Sentinel 2 images and images from Landsat 8 and 9. Given that the area of each pixel is present in the image’s metadata, the sum of the number of pixels of the two land classes, the old and new islands, multiplied by the pixel area and mapped in time gives us the information on how the islands’ emerging surface changed in time. Of particular interest is to detect changes before, during, and between the two volcanic unrests of 2014/2015 and 2021/2022. The area changes are shown in Figure 5. The figure shows the result for Sentinel 2 and Sentinel 1 together and the changes recovered from Sentinel 2 and Landsat. We find that the Sentinel 1 area includes the coastal ocean break, which is demonstrated by the fact that including the ocean break class in the Sentinel 2 estimate results in very similar levels in the area estimates.
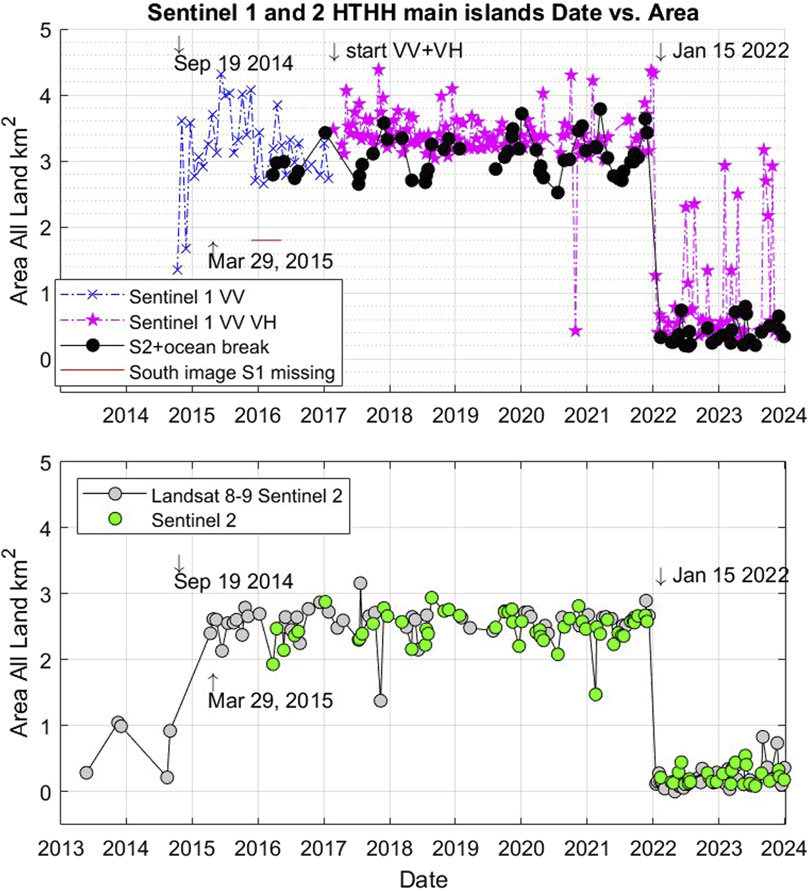
Figure 5. Area change of the main HT and HH islands estimated from classifying multispectral images (Sentinel 2, Landsat 8, 9) reflectance and SAR reflectivity (Sentinel 1). The Sentinel 2 curve shows the sum of the areas classified as Old Island and New Island, whereas the black dots (S2+ocean break) include the surface of the ocean break. The Sentinel 1 reflectivity does not distinguish the land pixels and ocean break; therefore, to reach the same area values, the ocean break class of Sentinel 2 must be added to the pure land pixels. Some particular times of volcanic activity are marked by arrows. Upper graph: Area change of land areas from Sentinel 1 and Sentinel 2. Lower graph: Area change from merging the results of Landsat 8, 9, and Sentinel 2.
To describe the area changes seen in Figures 5 and 6, we distinguish the first time interval covering the volcanic unrest between September 2014 and March 2015, a second phase of relative stability from then to December 2021, a short phase of area increase between the end of December 2021 and January 2022, and the fourth phase after the great volcanic Hunga explosion. The post-explosion phase saw a drastic area reduction after 15 January, due to the disappearance of the new central island, and the old islands HT and HH were greatly reduced in size. Possible sources of bias include changes in the conditions of the underlying images in terms of availability, coverage, and available bands. The blue curves of Sentinel 1 in Figures 5 and 6 are based on only the VV polarization, and the magenta curve of Sentinel 1 is based on both the VV and VH polarization. The horizontal red bar shows the interval for which the southern part of the Sentinel 1 images is missing, so approximately 0.09 km2 of coverage of the southern island tip of HH is missing. The noise on the Sentinel 1 area estimate is typically a flare-up caused by increased wave height on the ocean and false attribution of ocean pixels to land. The lower levels of the area estimate must, therefore, be considered as more reliable than the short-time peaks. The impulses, like overestimates of the area, are particularly severe after 15 January 2022, when the land areas are reduced to a small value of approximately 0.25 km2 and are replaced by ocean.
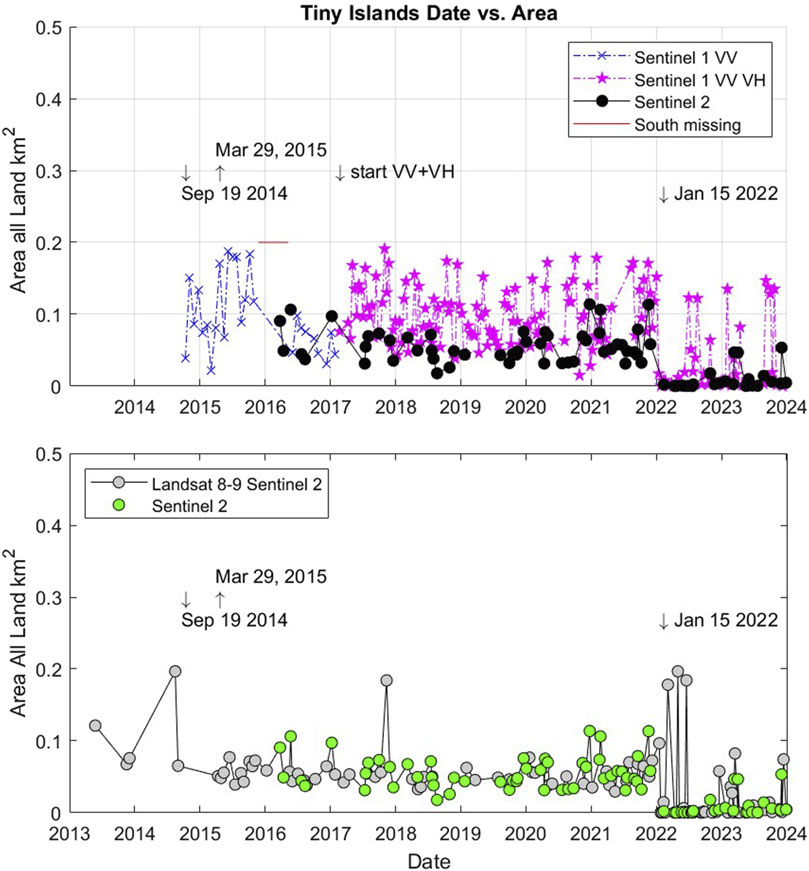
Figure 6. Area change of the tiny Hunga Volcano islands estimated from classifying multispectral images (Sentinel 2, Landsat 8, 9) reflectance and SAR reflectivity (Sentinel 1). The Sentinel 2 curve shows the sum of the areas classified as Old Island and New Island, whereas the black dots (S2+ocean break) include the surface of the ocean break. The Sentinel 1 reflectivity does not distinguish the land pixels and ocean break; therefore, to reach the same area values, the ocean break class of Sentinel 2 must be added to the pure land pixels. Some particular times of volcanic activity are marked by arrows. Upper graph: Area change of land areas from Sentinel 1 and Sentinel 2. Lower graph: Area change from merging the results of Landsat 8, 9, and Sentinel 2.
The time series for the Landsat and Sentinel 2 area estimates are perfectly coherent for the three satellites, extending the time series to 2013, and, therefore, have been merged into one curve (Figure 5; 6 lower graphs). Compared to Sentinel 1, the noise is lower, and the images delineate several features: the 2014 eruption is preceded by an area increase that began in May 2013, the first available image, with a surface of only 0.3 km2. The increase led to the formation of the new volcano island bridge and an area of 2.6 km2 in April 2015. A temporary reduction seen on 15 August 2014 was recovered after 2 weeks (20 August 2014). Inspection of the images shows that the northern part of the western island changed in this period and may have been the cause of this variation. Apart from some variations due to the effects of clouds, as could be verified by detailed inspection of the images, the slight area increase in November and December 2021 is associated with the preparation phase of the big explosion of 15 January 2022, leading to the area reduction ending up with a value of only 0.10 or 0.15 km2. The successive phase during 2023 suggests a slight recovery of the island area, roughly doubling this value in 1 year. The noise is larger than 0.1 km2, so this result must be considered a working hypothesis to be confirmed in the coming months.
The area change for the two tiny islands south of the HT and HH islands is resolved, notwithstanding the small size, amounting to only an average of 0.05 km2, as shown in Figure 6. We estimate the area by restricting the region of interest for the total area calculation to a polygon embracing them. The area variation in the two small islands essentially follows what has been observed for the main HTHH system. However, due to the small size, the noise is more disturbing, as the flare-ups seen on Sentinel 1 are up to three times larger than the surface extension. The blow-out of the islands in January 2015 is well-recorded; the small islands seemingly underwent an increase in extension during the 2014/2015 unrest. The Sentinel 1 and Sentinel 2/Landsat area estimates are concordant, except for the impulse-like flares seen in Sentinel 1.
4 Discussion
Oceanic volcanic islands are the top extreme of a volcanic seamount. Their morphology is plasmated by volcanic activity, with size changes that can include increasing the areal extent by factors or reducing it up to total disappearance. The changes may be undetected for remote islands far from civilization but nonetheless bear hazards for navigation and the negative effects of a volcanic eruption. Remote sensing is an ideal tool for detecting island changes, being global and continuous over many years. The monitoring of the area extent of existing and new islands requires decades-long continuous observations and the ability to distinguish the emerged land from the ocean. Multispectral images like Sentinel 2 or the Landsat suite have a large set of observational bands, which facilitate distinguishing land from ocean. An automatic distinction is viable through a random forest classification algorithm, the one we have trained on the HTHH islands. The monitoring is negatively influenced by clouds and the vapor of the volcanic activity because the electromagnetic rays in the visible and infrared bands are blocked or altered. In the case of HTHH, we find that the cloudiness of the images must be reduced to less than 5%, ideally to 1.3%, for automatic monitoring of the ocean surface and islands, leading to an exploitation of only 25%–10%, with a consecutive reduction in time resolution for Sentinel 2 from the original 6 days–24 days to 60 days on average. The classification is trained on the available bands and is successful in identifying land. The two very small islands south of HTHH with an area of only 0.05 km2 are correctly identified as vanishing, demonstrating the good spatial resolution of the method. The area of the small islands decreased from January 2016 to mid-2018 and remained stable to the first days of January 2022, when both islands disappeared with the great volcanic explosion. The Sentinel 1 acquisitions are less affected by the clouds and volcanic emissions, so all images can be used, increasing the time resolution. The reduced number of bands leads to identifying land with a higher noise. The lowest values of the area estimates are quite stable and resemble the values found with Sentinel 2 but are disturbed by spurious peaks of area flare-up. Inspection of the classified region shows that isolated speckles in the ocean falsely classified as land occur on days with a disturbed ocean surface. These misclassifications cause the intermittent increases in total land area.
A validation of the area changes is obtained by inspecting the images at the times with the greatest changes in the area. These are shown in Figure 7, and the predictions from the classifier are confirmed because the HTHH system is subject to enormous changes through time. The final state in 2022 has a much smaller area than the initial state in 2013. The image shows a selection of images from the collections of Landsat 8, Sentinel 2, and Sentinel 1 and illustrates the area change over time, signaling that significant changes happened. The acquisition day of the image is printed on the image and can be easily matched to the changes in the area curve shown with the gray dots interpolated by the continuous line. The black dots indicate the times of the images; the letter identifies each image. The land areas of images B and G are underestimated through the interpolation because they have not been used by the classifier due to the high cloudiness percentage. The correct area of image B is close to the area of image C, and the area of image G is similar and not lower than image F.
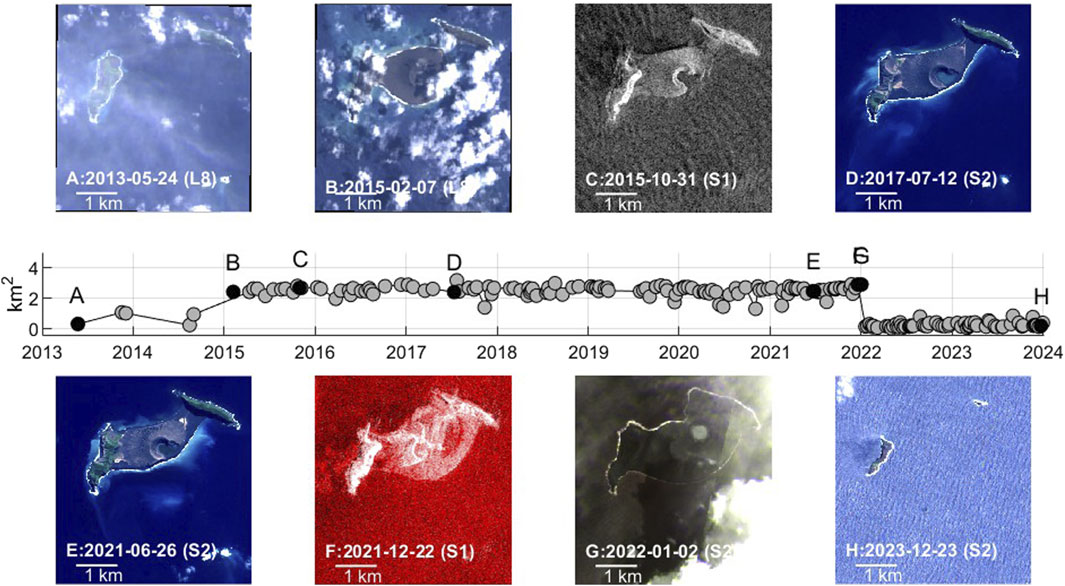
Figure 7. Representative images illustrating the area changes identified through the automatic classifier alongside the area change graph. The images have been selected from the following collections: Sentinel 2 (S2), Landsat 8 (L8), and Sentinel 1 (S1). The images display real color bands (B4, B3, and B2) in the color scheme RGB, except for the image of S1, 2015-10-31, which used the band VV, the image of S1 2021-12-22 which shows bands VV, VH, and VH, and the image S2 2022-01-02, which shows the B5, B7, and B8 infrared bands. The central plot shows the area change from the combined analysis of Landsat 8, 9, and Sentinel 2 shown in Figure 5.
5 Conclusion
Processing the images of reflectance in the optical and infrared bands over a period of 10 years identifies the recharge phases of the magma chamber of the HTHH oceanic volcano. The caldera floor from which the HTHH islands rise has phases of uplift and subsidence, and consequently, the exposed surface of the islands grows and shrinks in the range of 0.1 km2–3 km2. The volcanic eruptions of 2014/2015 and 2021/2022 are anticipated by a significant area change weeks before the eruption.
Two tiny islands of an area less than 0.05 km2 south of HTHH have been identified due to the ocean break rather than due to the subaerial land. After the 2022 eruption, no signs of the tiny islands can be seen. In general, such features could still be present as uncharted bathymetry and are hazards for ships. Therefore, the long-term identification of any small islands is important because their disappearance should be signalized, and bathymetric investigations should be made to verify that they are outside the depths of big ships. In the case of HTHH, the post-eruption bathymetric survey gives shallow bathymetry of over 12 m, so it is plausible that they exploded in the great volcanic eruption that destroyed the island bridge. The systematic monitoring of oceanic islands allows us to follow the subsidence and keep track of submerged islands that could be present just a few m below the surface.
Extending the analysis of area change of volcanic islands and the detection of new islands globally is a future challenge with enormous societal benefits, especially for ship navigation safety.
One challenge is the noise reduction in SAR processing, which suffers the most from different ocean state conditions. SAR, compared to the multispectral images, has the advantage of penetrating clouds.
Overall, the method that has been tested on the HT and HH islands has the potential to be extended to a global monitoring system for volcanic islands, with the service of an automatic alarm for any island changes. This requires noise reduction and automatic land recognition in the images, focusing on the anomalous area increase, which, from the experience of HT and HH, has been a precursor to volcanic eruptions and could predict eruptions in the future.
Data availability statement
Publicly available datasets were analyzed in this study. The datasets analyzed for this study can be found in the Earth Engine cloud computing environment (https://earthengine.google.com), and all data are freely and publicly available. The pre-eruptive bathymetry multibeam mosaic is available from NOAA/NCEI (https://www.ncei.noaa.gov/maps/bathymetry/). Larger scale bathymetry is available at the GEBCO database. The post-2022 eruption bathymetry is presented in the study of Le Mèvel et al. (2023).
Author contributions
CB: writing–original draft, visualization, validation, software, methodology, investigation, funding acquisition, formal analysis, data curation, and conceptualization.
Funding
The author declares that financial support was received for the research, authorship, and publication of this article. The work is in support of the ASI project “NGGM/MAGIC, una svolta nella comprensione della dinamica della Terra,” Contract/Agreement n. 2023-22. HH.0 ASI-UNIMI and of the Project Quantum Space Gravimetry for monitoring Earth’s Mass Transport Processes (QSG4EMT), ESA Contract No. ESA RFP/3-17687/22/NL/SD.
Acknowledgments
The use of Earth Engine Cloud Computing is acknowledged. The free access data policy of ESA for the Sentinel 1 and Sentinel 2 satellites and of NASA and USGS for the Landsat 8 and 9 satellites is acknowledged.
Conflict of interest
The author declares that the research was conducted in the absence of any commercial or financial relationships that could be construed as a potential conflict of interest.
Publisher’s note
All claims expressed in this article are solely those of the authors and do not necessarily represent those of their affiliated organizations, or those of the publisher, the editors, and the reviewers. Any product that may be evaluated in this article, or claim that may be made by its manufacturer, is not guaranteed or endorsed by the publisher.
References
Arthur, D., and Vassilvitskii, S. (2007). “K-Means++: the advantages of careful seeding,” in Proceedings of the Eighteenth Annual ACM-SIAM Symposium on Discrete Algorithms, New Orleans, LA, January 7–9, 2007 (Philadelphia, PA, Society for Industrial and Applied Mathematics), 1027–1035.
Astafyeva, E., Maletckii, B., Mikesell, T. D., Munaibari, E., Ravanelli, M., Coisson, P., et al. (2022). The 15 anuary 2022 Hunga Tonga eruption history as inferred from ionospheric observations. Geophys. Res. Lett. 49 (10), e2022GL098827. doi:10.1029/2022GL098827
Bohnenstiehl, D. W. R., Dziak, R. P., Matsumoto, H., and Andy Lau, T.-K. (2013). Underwater acoustic records from the March 2009 eruption of Hunga ha’apai-hunga Tonga volcano in the kingdom of Tonga. J. Volcanol. Geotherm. Res. 249 (January), 12–24. doi:10.1016/j.jvolgeores.2012.08.014
Borrero, J. C., Cronin, S. J., Latu’ila, F. H., Tukuafu, P., Heni, N., Tupou, A. M., et al. (2023). Tsunami runup and inundation in Tonga from the anuary 2022 eruption of Hunga Volcano. Pure Appl. Geophys. 180 (1), 1–22. doi:10.1007/s00024-022-03215-5
Brenna, M., Cronin, S. J., Smith, I. E. M., Pontesilli, A., Tost, M., Barker, S., et al. (2022). Post-caldera volcanism reveals shallow priming of an intra-ocean arc andesitic caldera: Hunga Volcano, Tonga, SW pacific. Lithos 412–413 (March), 106614. doi:10.1016/j.lithos.2022.106614
Bryan, W. B., Stice, G. D., and Ewart, A. (1972). Geology, petrography, and geochemistry of the volcanic islands of Tonga. J. Geophys. Res. 77 (8), 1566–1585. doi:10.1029/JB077i008p01566
Carr, J. L., Horváth, Á., Wu, D. L., and Friberg, M. D. (2022). Stereo plume height and motion retrievals for the record-setting Hunga Tonga-Hunga Ha’apai eruption of 15 anuary 2022. Geophys. Res. Lett. 49 (9), e2022GL098131. doi:10.1029/2022GL098131
Colombier, M., Scheu, B., Wadsworth, F. B., Cronin, S., Vasseur, J., Dobson, K. J., et al. (2018). Vesiculation and quenching during surtseyan eruptions at Hunga Tonga-Hunga Ha’apai volcano, Tonga. J. Geophys. Res. Solid Earth 123 (5), 3762–3779. doi:10.1029/2017JB015357
Contreras-Reyes, E., Grevemeyer, I., Watts, A. B., Flueh, E. R., Peirce, C., Moeller, S., et al. (2011). Deep seismic structure of the Tonga subduction zone: implications for mantle hydration, tectonic erosion, and arc magmatism. J. Geophys. Res. 116 (B10), B10103. doi:10.1029/2011JB008434
Frank, E., Hallo, M. A., and Witten, I. H. (2016). “The WEKA workbench,” in Online appendix for ‘data mining: practical machine learning tools and techniques’ 4th Edition. Burlington, MA: Morgan Kaufmann. Available at: https://waikato.github.io/weka-wiki/citing_weka/.
Garvin, J. B., Slayback, D. A., Ferrini, V., Frawley, J., Giguere, C., Asrar, G. R., et al. (2018). Monitoring and modeling the rapid evolution of Earth’s newest volcanic island: Hunga Tonga Hunga Ha’apai (Tonga) using high spatial resolution satellite observations. Geophys. Res. Lett. 45 (8), 3445–3452. doi:10.1002/2017GL076621
Geology Hub (2023) “Geology Hub,” in Youtube channel. Sunnyvale, CA: Geology Hub. Available at: https://www.youtube.com/@GeologyHub.
Global Volcanism Program Venzke, E. (2023). Volcanoes of the world, v.5.1.0. Washington, DC: Global Volcanism Program.
Hekinian, R., Mühe, R., Worthington, T. J., and Stoffers, P. (2008). Geology of a submarine volcanic caldera in the Tonga arc: dive results. J. Volcanol. Geotherm. Res. 176 (4), 571–582. doi:10.1016/j.jvolgeores.2008.05.007
Kintner, J. A., Yeck, W. L., Earle, P. S., Prejean, S., and Pesicek, J. D. (2023). High-precision characterization of seismicity from the 2022 Hunga Tonga-Hunga Ha’apai volcanic eruption. Seismol. Res. Lett. 94 (2A), 589–602. doi:10.1785/0220220250
Le Mével, H., Miller, C. A., Ribó, M., Cronin, S., and Kula, T. (2023). The magmatic system under Hunga volcano before and after the 15 january 2022 eruption. Sci. Adv. 9 (50), eadh3156. doi:10.1126/sciadv.adh3156
Li, H. (2014). Smile - statistical machine intelligence and learning engine. Available at: https://haifengl.github.io.
Lynett, P., McCann, M., Zhou, Z., Renteria, W., Borrero, J., Greer, D., et al. (2022). Diverse tsunamigenesis triggered by the Hunga Tonga-Hunga Ha’apai eruption. Nature 609 (7928), 728–733. doi:10.1038/s41586-022-05170-6
Main-Korn, M., Pflug, B., Louis, J., Debaecker, V., Müller-Wilm, U., and Gascon, F. (2017). Sen2Cor for sentinel-2. in Proc. SPIE. Image and signal processing for remote sensing XXIII Volume10427. Bellingham, WA: SPIE - International Society for Optics and Photonics. 1042704.
Manneela, S., and Kumar, S. (2022). Overview of the Hunga Tonga-Hunga Ha’apai volcanic eruption and tsunami. J. Geol. Soc. India 98 (3), 299–304. doi:10.1007/s12594-022-1980-7
Nomikou, P., Parks, M. M., Papanikolaou, D., Pyle, D. M., Mather, T. A., Carey, S., et al. (2014). The emergence and growth of a submarine volcano: the kameni islands, santorini (Greece). GeoResJ. 1–2 (March), 8–18. doi:10.1016/j.grj.2014.02.002
Omira, R., Ramalho, R. S., Kim, J., González, P. J., Kadri, U., Miranda, J. M., et al. (2022). Global Tonga tsunami explained by a fast-moving atmospheric source. Nature 609 (7928), 734–740. doi:10.1038/s41586-022-04926-4
Ortiz-Huerta, L. G., and Ortiz, M. (2022). On the Hunga-Tonga complex tsunami as observed along the pacific coast of Mexico on January 15, 2022. Pure Appl. Geophys. 179 (4), 1139–1145. doi:10.1007/s00024-022-03027-7
Poli, P., and Shapiro, N. M. (2022). Rapid characterization of large volcanic eruptions: measuring the impulse of the Hunga Tonga Ha’apai explosion from teleseismic waves. Geophys. Res. Lett. 49 (8), e2022GL098123. doi:10.1029/2022GL098123
Proud, S. R., Prata, A. T., and Schmauß, S. (2022). The anuary 2022 eruption of Hunga Tonga-Hunga Ha’apai volcano reached the mesosphere. Science 378 (6619), 554–557. doi:10.1126/science.abo4076
Purkis, S. J., Ward, S. N., Fitzpatrick, N. M., Garvin, J. B., Slayback, D., Cronin, S. J., et al. (2023). The 2022 Hunga-Tonga megatsunami: near-field simulation of a once-in-a-century event. Sci. Adv. 9 (15), eadf5493. doi:10.1126/sciadv.adf5493
Ramírez-Herrera, M. T., Coca, O., and Vargas-Espinosa, V. (2022). Tsunami effects on the coast of Mexico by the Hunga Tonga-Hunga Ha’apai volcano eruption, Tonga. Pure Appl. Geophys. 179 (4), 1117–1137. doi:10.1007/s00024-022-03017-9
Schindelé, F., Kong, L., Lane, E. M., Paris, R., Ripepe, M., Titov, V., et al. (2024). A review of tsunamis generated by volcanoes (TGV) source mechanism, modelling, monitoring and warning systems. Pure Appl. Geophys. 181 (6), 1745–1792. doi:10.1007/s00024-024-03515-y
Schoeberl, M. R., Wang, Y., Ueyama, R., Dessler, A., Taha, G., and Yu, W. (2023). The estimated climate impact of the Hunga Tonga-Hunga Ha’apai eruption plume. Geophys. Res. Lett. 50 (18), e2023GL104634. doi:10.1029/2023GL104634
Tarumi, K., and Yoshizawa, K. (2023). Eruption sequence of the 2022 Hunga Tonga-Hunga Ha’apai explosion from back-projection of teleseismic P waves. Earth Planet. Sci. Lett. 602 (January), 117966. doi:10.1016/j.epsl.2022.117966
USGS Youtube (2022). United States geological survey. Available at: https://www.youtube.com/@usgs/videos.
UTD GeoscienceStudio (2022). University of Texas at Dallas GeoScienceStudio. Available at: https://www.youtube.com/@UTDGeoscienceStudios.
Vaughan, R. G., and Webley, P. W. (2010). Satellite observations of a surtseyan eruption: Hunga Ha’apai, Tonga. J. Volcanol. Geotherm. Res. 198 (1–2), 177–186. doi:10.1016/j.jvolgeores.2010.08.017
Wang, J., Zhong, Lu, and Gregg, P. M. (2021). Inflation of okmok volcano during 2008–2020 from PS analyses and source inversion with finite element models. J. Geophys. Res. Solid Earth 126 (10), e2021JB022420. doi:10.1029/2021JB022420
Keywords: Hunga volcano, Tonga, volcanic islands, Sentinel 1-2, Landsat 8-9, multispectral images5, synthetic aperture radar
Citation: Braitenberg C (2024) Monitoring the Hunga Volcano (Kingdom of Tonga) starting from the unrests of 2014/2015 to the 2021/2022 explosion with the Sentinel 1-2 and Landsat 8-9 satellites. Front. Earth Sci. 12:1373539. doi: 10.3389/feart.2024.1373539
Received: 19 January 2024; Accepted: 12 July 2024;
Published: 08 August 2024.
Edited by:
Elisa Zuccolo, Fondazione Eucentre, ItalyReviewed by:
Claudia Spinetti, National Institute of Geophysics and Volcanology (INGV), ItalyEmanuele Ciancia, National Research Council (CNR), Italy
Copyright © 2024 Braitenberg. This is an open-access article distributed under the terms of the Creative Commons Attribution License (CC BY). The use, distribution or reproduction in other forums is permitted, provided the original author(s) and the copyright owner(s) are credited and that the original publication in this journal is cited, in accordance with accepted academic practice. No use, distribution or reproduction is permitted which does not comply with these terms.
*Correspondence: Carla Braitenberg, YmVyZ0B1bml0cy5pdA==