 Fengzhou Liu1,2
 Maolong Xiang
 Jingkang Lyu
- 1Shandong University, Jinan, China
- 2Jinan Rail Transit Group Co., Ltd, Jinan, China
- 3China Railway 14th Bureau Group Co., Ltd, Jinan, China
- 4School of Civil Engineering, Central South University, Changsha, China
- 5Architectural Engineering Institute, Huaiyin Institute of Technology, Huaian, China
A sophisticated model of the foundation pit support structure was developed via a model test that incorporated 3D printing technology. A meticulously scaled-down simulation of foundation pit excavation was conducted, utilizing the excavation width of the foundation pit as the sole variable, to evaluate and compare the impact of various foundation pit widths on the force and deformation characteristics of the foundation pit following layer-by-layer excavation. The findings indicate that the stress and deformation characteristics of the retaining structure shift from the “cantilever” mode to a composite mode of “internally convex” or “concave-convex” as the pit is excavated and internal support is installed. The change in pit width has minimal influence on the mechanical response law of the support structure during excavation. Nonetheless, the alteration in the pit width had a direct effect on both the internal force and deformation of the support structure, as well as the change in surface settlement value. In the experiment, wider pits had monitoring values that increased multiple times compared to narrower pits. The width of the foundation pit has a considerable impact on the mechanical response and stability of the pit, which is evident in the relatively lower lateral earth pressure on the outside of the retaining structure in narrower pits. This results in less stress and deformation of the pit structure. Moreover, the decrease in the passive zone of the pit contributes to better stability, indicating that the lower lateral earth pressure on the outside of the retaining structure is an innate reason for the excellent stability of narrower pits.
1 Introduction
Numerous engineering practices have demonstrated significant differences in the stability and failure modes of foundation pits of varying widths. Narrow foundation pits exhibit relatively small deformations and less frequent kicking phenomena. The existing calculation methods for different foundation pit widths, especially narrow foundation pit, cannot match the engineering practice (Li L. et al., 2022). This leads to overly conservative design of the foundation pit. With the emergence of foundation pit projects of different width types will inevitably cause a lot of unnecessary waste. Exploring the influence of foundation pit width effect on the deformation characteristics and stability of foundation pit has become the focus of engineering researchers.
At present, many scholars have carried out research related to the effect of pit width on the mechanical response and stability of pits using numerical simulation, theoretical calculation analysis and physical model test. There have been a lot of research results about numerical simulation (Faheem et al., 2004; Orazalin et al., 2015; Ying et al., 2018; Zhang et al., 2018; Zeng et al., 2019; He et al., 2020; He et al., 2022; Zhao et al., 2022; Huang et al., 2023), for example, Ying et al. (2018) conducted a numerical simulation of deep pits with different widths to obtain the distribution law of potential uplift slip crack surface at the bottom of pits. Zeng et al. (2019) conducted numerical simulations to study the impact of different pit widths on the mechanical behavior of retaining walls and surrounding soil. There are also some relevant results in the theoretical analysis (Wang and Sun, 2012; Liu et al., 2020; Xu et al., 2016; Xu et al., 2023), for example, Wang and Sun (2012) derived a method for calculating of the earth pressure reduction factor on the enclosure structure that can consider the influence of pit width. Liu et al. (2020) used an analytical method to compare the force and deformation characteristics of the enclosure wall under different excavation width conditions.
In the field of physical model experimental research, there are fewer relevant studies using pit width or width-to-depth ratio as a single variable, but there are still a large number of relevant 1 g normal gravity pit model tests (Chen et al., 2021; Zhang et al., 2023; Wang et al., 2018; Cheng et al., 2017; Zeng et al., 2021; Wang et al., 2017; Li et al., 2024) and centrifugal model tests (Hu et al., 2018; Chen et al., 2022) available. For example, Chen et al. (2021) studied the coordinated deformation characteristics among the internal support, retaining wall and soil behind the wall by designing a 1 g normal gravity model test with a scalable internal support system. Hu et al. (2018) conducted centrifugal model experiments using a deep excavation pit as a background to explore the impact of factors such as pit length and excavation depth on the mechanical response law of the pit.
For the numerical simulation research, there are problems in selecting appropriate models and parameters due to the unclear damage pattern of the pit when the pit width changes. Theoretical analysis is often constrained by the assumptions set. Compared with other research methods, physical model testing is better at reflecting the fundamental influence law when considering only the pit width variable. Among the physical model tests, the 1 g normal gravity model test has clear advantages over the centrifugal test regarding operability, such as the stepwise excavation and filling of the pit. In this paper, the 1 g normal gravity physical modeling test is used to investigate the influence of pit width on the mechanical behavior and stability of the pit after excavation layer by layer at the same pit excavation depth, in order to provide theoretical guidance and reference for relevant engineering applications.
2 Model test program
2.1 The application feasibility of 3D printing technology
3D printing is a rapid prototyping technology that constructs objects by printing layer by layer with adhesive materials, based on 3D digital models. This technique offers several advantages in the field of civil engineering testing, particularly in the production of structural models (Jiang and Song, 2018; Zuo et al., 2019; Li et al., 2020; Li Z.et al., 2022; Liu, 2022; Han et al., 2023):
(1) With a processing accuracy of up to 0.1 mm–0.2 mm, 3D printing offers high molding accuracy, and even considering the deformation caused by uneven heat dissipation during printing, the resulting model can meet the accuracy requirements of model testing;
(2) The forming process is highly controllable and only needs to build the digital structure model, which needs to be printed, can easily realize the complex model making, which is difficult to realize by traditional methods;
(3) 3D printing materials are diverse, the mechanical parameters of different materials have large differences, and the physical and mechanical properties of printed products cover a wide range of parameters, which makes the mechanical properties of 3D printed products can basically meet the needs of civil engineering model testing.
3D printed material products can be broadly classified into “rock-like products” and “elastomeric material-like products” according to their mechanical properties (Li et al., 2020). In the design of foundation pits, the support structure should be in the elastic-plastic stage. Existing 3D printing materials exhibit elastic-plastic characteristics in their initial deformation, with a maximum strain in the elastic stage greater than 0.2% (Jiang and Song, 2018), which can meet the demand of the deformation characteristics of the foundation pit support structure in the model test simulation.
2.2 Test model and material parameters
The test model box size is 1.6 m × 1.2 m × 0.56 m (length × height × width), the test box shape is rectangular, the model box frame is made of square steel welding, the internal is acrylic plate box without top cover, the test system is shown in Figure 1. The geometric similarity ratio between the test model and the actual project is 1: 50, the excavation depth of the pit is 40 cm, and the burial depth of the ground-connection wall is 56 cm. 3D printing technology is introduced to produce the pit support structure, and the pit support structure, including the underground diaphragm wall, internal support and waist beam, are all load-bearing components in the test. According to the stress-strain characteristics of commonly used printing materials (Li et al., 2020), and considering the geometric similarity ratio of the model test, the pit support structure is selected as ABS material, the relevant material parameters are shown in Table 1. The size of the retaining wall is 56 cm × 56 cm, the thickness is 20 mm. As shown in Figures 2A,B, the retaining wall and beam are bonded using AB glue, and buckles are set between the inner support of each layer and the retaining wall, then the inner support can be applied directly on the buckles after the excavation of the foundation pit. It is worth pointing out that some of the displacement gauges in existing studies are directly erected on the model box without considering the influence of the deformation and vibration of the model box on the displacement gauges. To avoid this influence, as shown in Figures 2A,C special displacement gauges bracket is designed and welded in this test, which is independent of the model box system to accurately monitor the surface displacement.
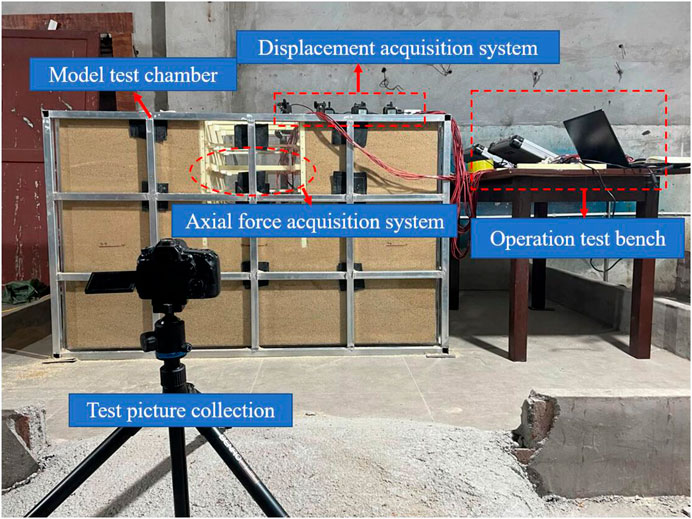
Figure 1. Foundation pit model experiment system.

Table 1. Physical and mechanical parameters of ABS printing materials used in the experiment.
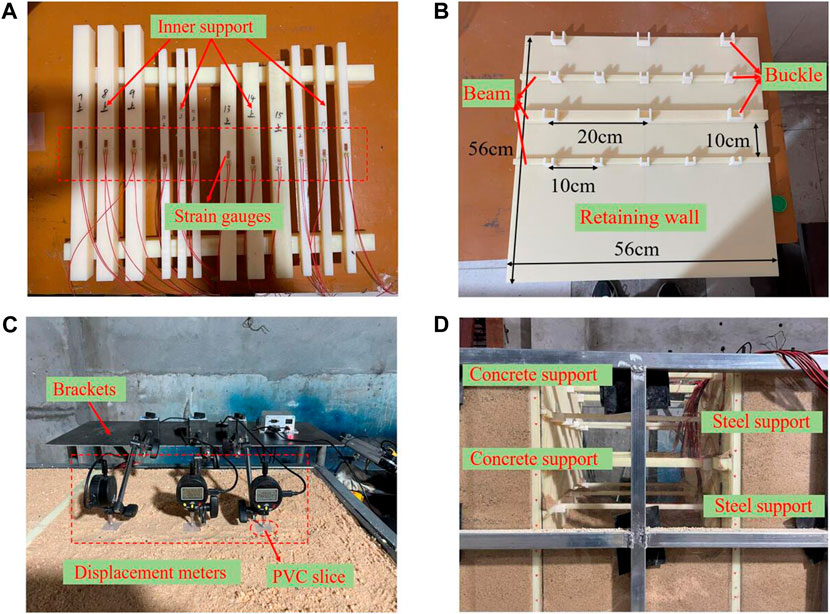
Figure 2. Solid drawing and displacement meter layout of each component of foundation pit: (A) Internal support. (B) Retaining wall and buckle arrangement. (C) Layout of displacement meter. (D) Model diagram after foundation pit excavation.
To accurately simulate the excavation process of an actual foundation pit, a layer of internal support is immediately installed for every layer of soil excavated from the pit. There are a total of four layers of internal support, with a vertical spacing of 10 cm between each layer, the first layer and the third layer of internal support for concrete support, each layer of concrete support set three. The second layer and the fourth layer of internal support for steel support, each layer of steel support set five, steel support cross-sectional size of 10 mm × 10 mm, concrete support cross-sectional size of 20 mm × 20 mm, the solid model of the foundation pit after excavation as shown in Figure 2D.
This experiment was conducted under 1 g normal gravity conditions and aimed to investigate the influence and mechanism of the pit width on the mechanical response and stability of the pit. The experiment is not intended to provide reference for the design, construction, or deformation prediction of any specific project. Therefore, the geological conditions were simplified. Homogeneous sand soil was used as the soil in the experiment, and its physical and mechanical parameters are detailed in Table 2.
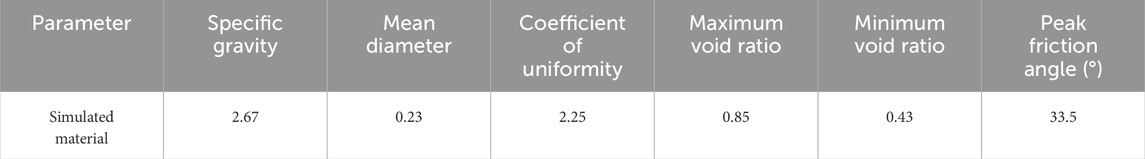
Table 2. Physical and mechanical parameters of sand used in the experiment.
2.3 Arrangement of testing points
During the experiment, real-time monitoring was carried out on the stress and deformation of the pit support structure, surface settlement behind the wall, and soil pressure behind the wall. The layout of the monitoring points can be seen in Figure 3. Six pairs of strain gauges (01–06) were installed on the right side of the retaining structure, and three pairs of strain gauges (07–18) were installed on each layer of internal support, located in the middle and outermost support positions. Ten CJLY-350 strain-type miniature soil pressure boxes (501–510) were installed on the inner and outer sides of the left retaining structure. Capacitance grid displacement transducers (with an accuracy of 0.001 mm) were installed 10 cm, 25 cm, and 40 cm away from the outer edge of the retaining structure to monitor ground displacement (101–103), as shown in Figure 2D, the displacement measuring point is arranged 25 mm × 25 mm rigid PVC sheet, with the micrometer probe in contact with the sheet.
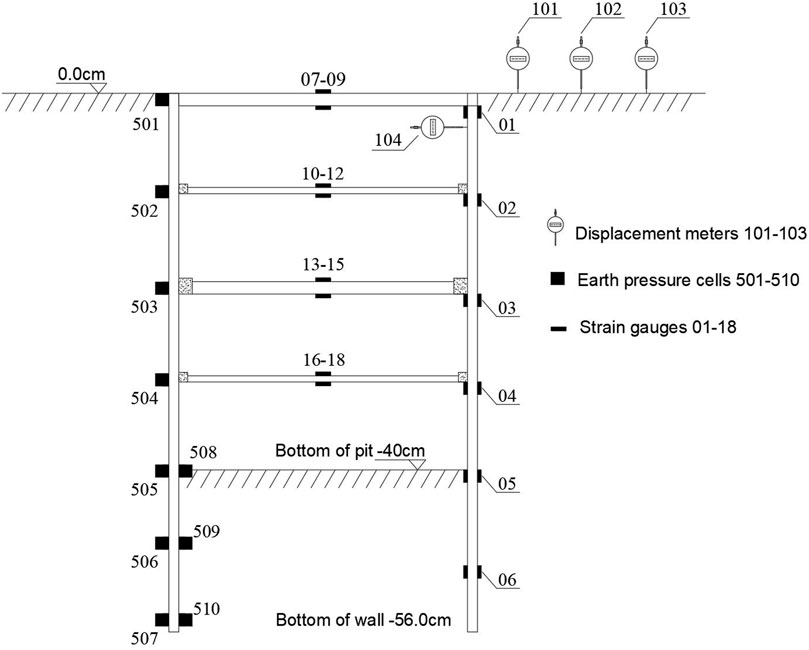
Figure 3. Layout of measuring points.
2.4 Test process and test conditions
During the experiment, the pit enclosure was assembled using AB glue bonding, and strain gauges and soil pressure boxes were installed. The assembled pit enclosure was placed in the model box, and the testing system was activated. The soil was then filled and compacted layer by layer, and the displacement meter was installed after the soil backfill was completed. Once the testing system data stabilized, the strain gauges and displacement meter were zeroed for the corresponding testing channel. The stable strain value of the soil pressure box testing channel was recorded as the initial value of the soil pressure box reading. The excavation of the foundation pit and erection of the internal support consisted of nine construction steps, as shown in Table 3 and Figure 4 from Step 1 to Step 9.
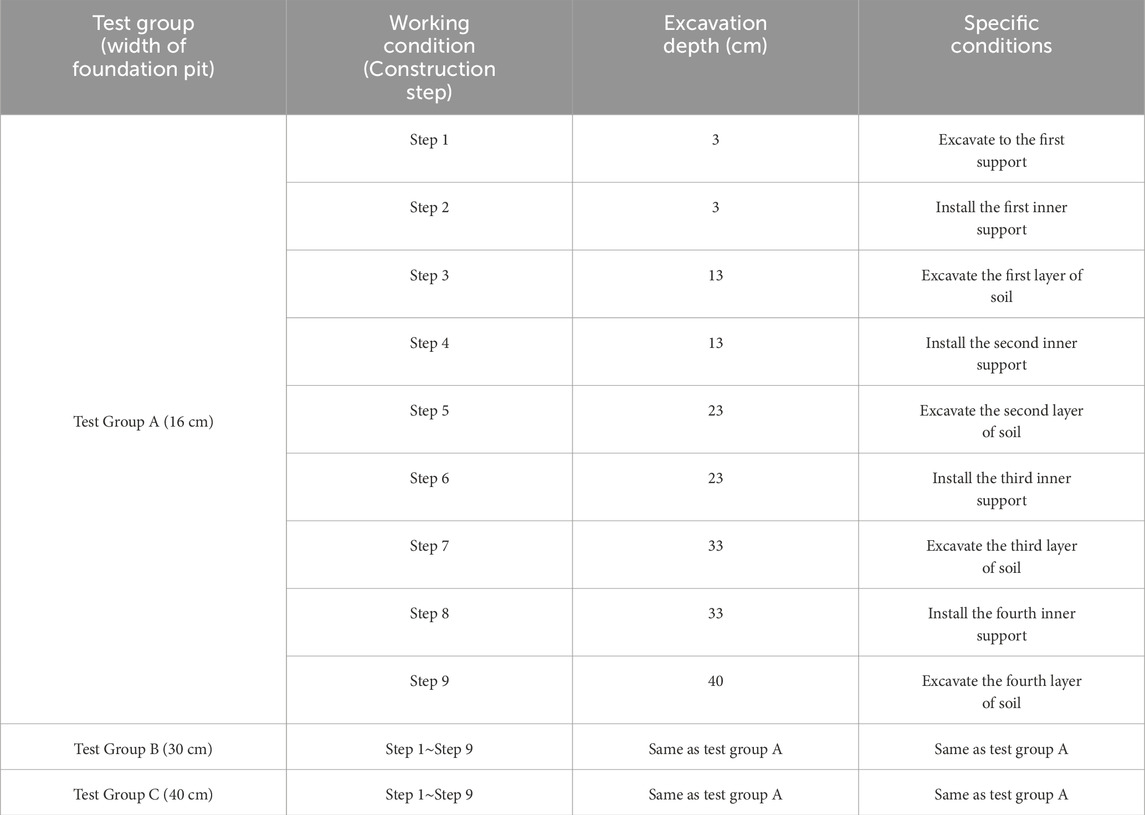
Table 3. Experimental groups and condition setting.
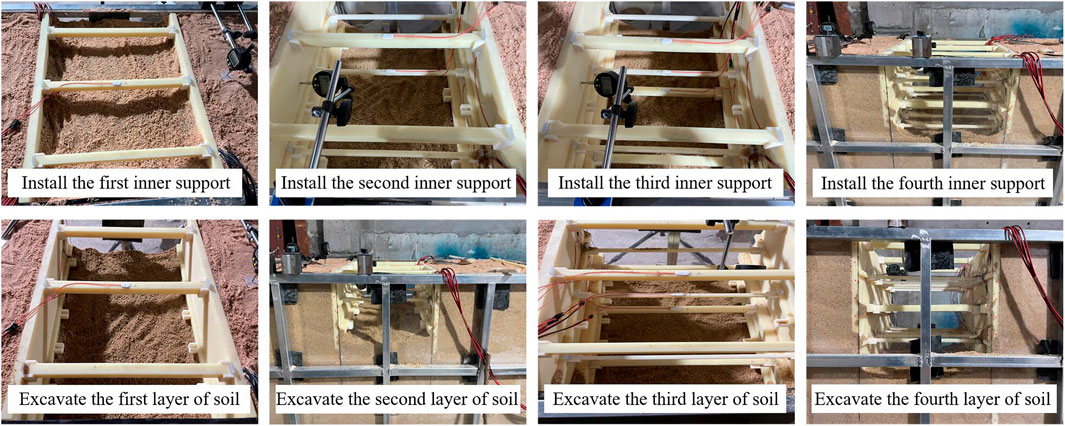
Figure 4. Construction step diagram.
In the case of ensuring the depth of the foundation pit unchanged, as shown in Figure 5, a total of three sets of scale model tests with different foundation pit widths were set up. The geometric similarity ratio of the test is 1: 50. The widths of the foundation pit of Group A, Group B and Group C were 16 cm, 30 cm and 40 cm, respectively; that is, the corresponding actual foundation pit widths were 8 m, 15 m and 20 m, and the corresponding width-depth ratios were 0.40, 0.75 and 1.00, respectively. The support structure and stratum parameters were the same in the three groups of tests except for the width of the pit. The buried depth of the center of the four internal support sections is 3 cm, 13 cm, 23 cm and 33 cm, respectively. The specific test group and working conditions are shown in Table 3.
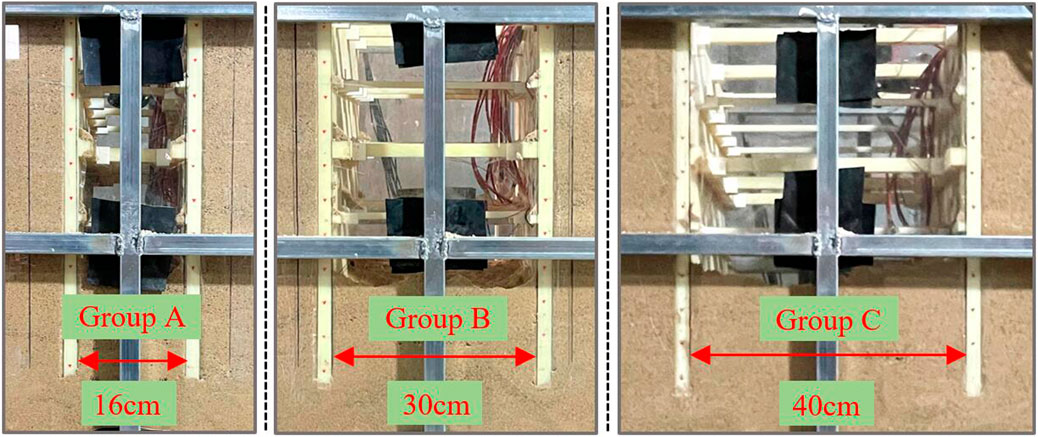
Figure 5. Test groups with different foundation pit widths.
3 Test results
3.1 Characteristics of deep horizontal displacement of enclosure structure
The curvature radius and curvature arc angle of the measuring point are calculated according to the strain difference between the inner and outer sides of the measuring point of the retaining structure. The curvature radius
Where h is the thickness of the retaining structure,
Assuming the displacement of the bottom of the retaining structure is 0, the horizontal displacement dx of the measuring point of the retaining structure is calculated as Eq. 3. The top of the retaining structure is taken as the origin of the longitudinal axis, and the deformation of the retaining structure to the inside of the foundation pit is positive. As shown in Figure 6, the spline curve is used to draw the deep horizontal displacement curve of the retaining structure. It should be noted that the purpose of this experiment is to explore the influence of the width of the foundation pit on the deformation characteristics and stability of the foundation pit. It does not rely on a practical project, so the follow-up test results are analyzed by the actual monitoring results in the model test.
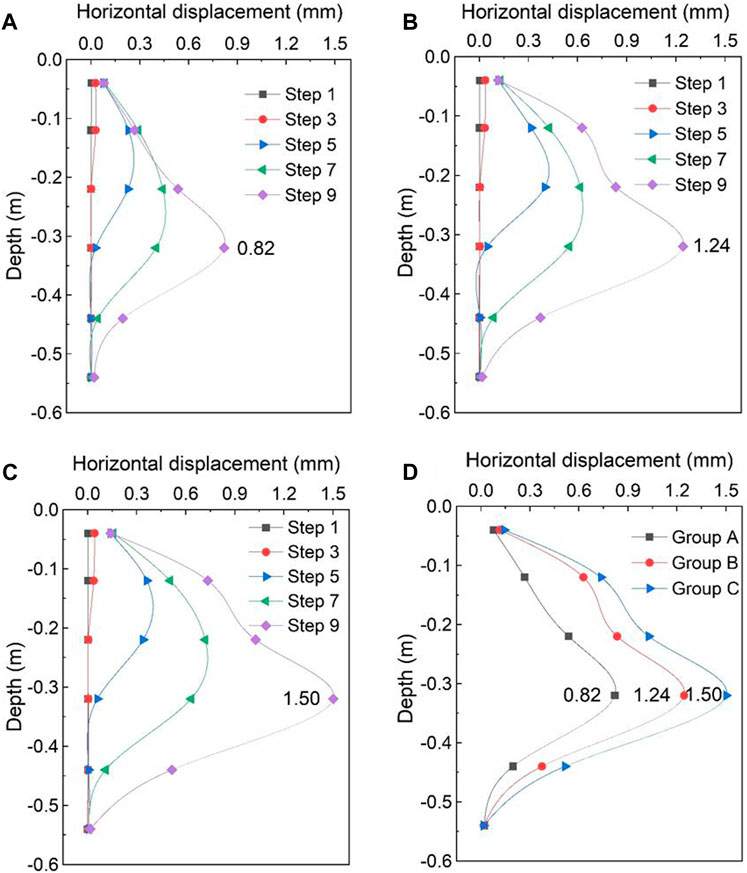
Figure 6. Deep horizontal displacement curve of retaining structure: (A) Group A. (B) Group B. (C) Group C. (D) Deep horizontal displacement of each group in Step 9.
Figures 6A–C show the deep horizontal displacement curve of the retaining structure under different foundation pit widths, and the step in Figure 6 is the construction step. It can be seen from Figure 6 that the deformation mode of the retaining structure under different foundation pit widths is similar. The retaining structure presents a “cantilever” deformation mode when the inner support is not erected. With the erection of the inner support and the soil excavation in the pit, the deformation mode changes from the “cantilever” when the inner support is not erected after excavation to the “internally convex” composite deformation mode. At the same time, with the excavation of the soil in the pit and the erection of the internal support, the horizontal displacement of the enclosure structure in different test groups increases continuously, and the position of the maximum horizontal displacement continues to move downward. After the final excavation, the maximum horizontal displacement is located at the excavation depth of about 33 cm.
Figure 6D shows a comparison of the deep horizontal displacement of the retaining structures for the different test groups after excavation was completed. With the excavation of the soil and the erection of the internal support, the horizontal displacement of the retaining structures in the different test groups continued to increase, and the location of the maximum horizontal displacement gradually moved downward. After the excavation was completed and stabilized, the maximum horizontal displacements of the retaining structures in groups A, B, and C were 0.82 mm, 1.24 mm, and 1.50 mm, respectively. Compared to Group C, the maximum horizontal displacement of the retaining structure in Group B decreased by 17.3%, while the maximum horizontal displacement in Group A decreased by 45.3%. The narrower the pit width, the smaller the horizontal displacement of the retaining structure, and the impact of the narrower pit width was more significant.
3.2 Bending moment distribution characteristics of the enclosure structure
The curvature radius of the measuring point is calculated according to the strain difference between the inner and outer sides of the measuring point of the retaining structure, and then the bending moment value of the envelope structure under different construction conditions under different experimental groups is calculated. The top of the retaining structure is used as the origin of the ordinate, as shown in Figure 7, and the outer tension of the retaining structure is used as the positive value. The spline curve is used to draw the bending moment distribution curve of the retaining structure.
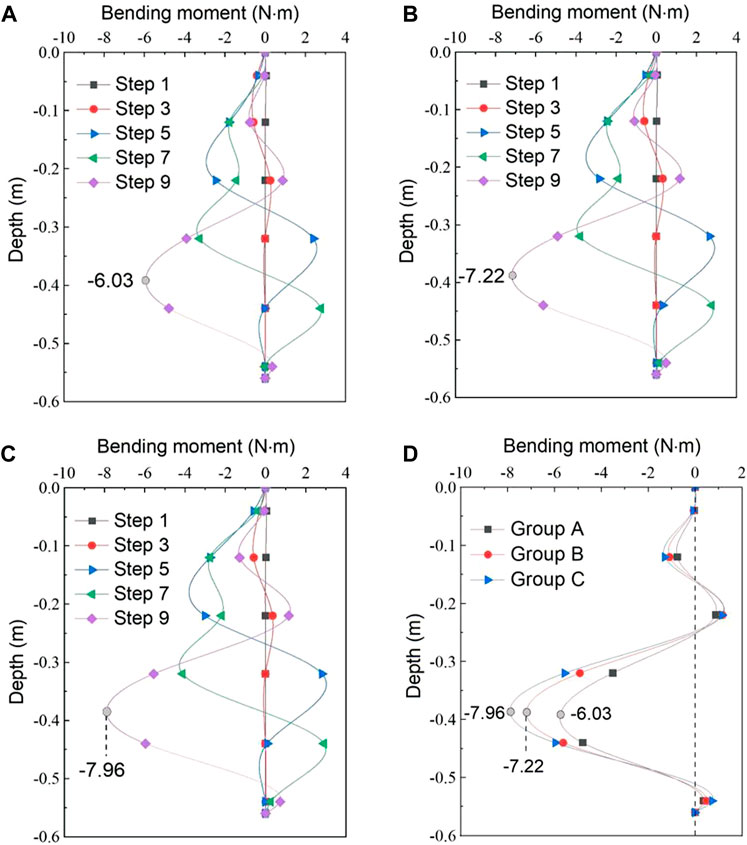
Figure 7. Moment curve of retaining structure: (A) Group A. (B) Group B. (C) Group C. (D) Bending moment of each retaining structure in Step 9.
From Figures 7A–C, it can be observed that as soil is excavated from the pit and internal support is installed, a negative bending moment appears in the retaining structure, and both positive and negative bending moments gradually increase. The retaining structure is subjected to the constraint of both the soil in the pit and the internal support. The force mode of the retaining structure changes from the “cantilevered” mode before installing internal support after excavation to the “concave-convex” composite force mode. This corresponds to the deep horizontal displacement characteristics of the retaining structure discussed in Section 3.1. After the excavation of the third layer of soil (Step 7), the positive bending moment of the enclosure structure reaches the maximum value. The maximum negative bending moment of the enclosure structure appears after the end of the excavation of the pit (Step 9), which is different from the location of the maximum horizontal displacement of the enclosure structure. The maximum negative bending moment all appear near the location of the pit bottom, which is mainly caused by the small deformation of the enclosure structure at the pit bottom under the effect of soil restraint.
Figure 7D shows a comparison of the bending moments of the retaining structures for the different test groups after excavation was completed. As can be seen from the figure, the internal force pattern of the retaining structure was the same for different pit widths. However, after excavation was completed and stabilized, the maximum bending moments of the retaining structures in groups A, B, and C were −6.03 N·m, −7.22 N·m, and −7.96 N·m, respectively. Compared to Group C, the maximum bending moment of the retaining structure in Group B decreased by 9.2%, while the maximum bending moment in Group A decreased by 24.2%. Consistent with the horizontal displacement trend of the retaining structure, the narrower the pit width, the smaller the maximum bending moment of the retaining structure.
3.3 Distribution characteristics of axial force of internal support
Based on the assumptions of linear elasticity and plane section, the strain values (
Where E is the elastic modulus, A is the sectional area of the internal support.
Taking internal support under pressure as positive, the axial force variation curves of the internal support with construction steps for different experimental groups are drawn in Figures 7A–C. From Figure 8, it can be seen that the inner support axial force change pattern is similar under different pit width conditions. With the construction step, there are certain fluctuations of the first layer of internal support axial force, but the magnitude is generally small. The second layer and the fourth layer of internal support axial force increase slightly with the construction step, and the increment is basically within the range of 5 N. It is worth noting that the third layer of internal support axial force grows more obviously with the construction step, and the increment is up to 44 N. Combined with the deformation of the enclosure structure (section 3.1), the internal support axial force change and the horizontal displacement of the enclosure structure have obvious correlation. The development of the internal support axial force is synchronized with the development of the horizontal displacement of the structure.
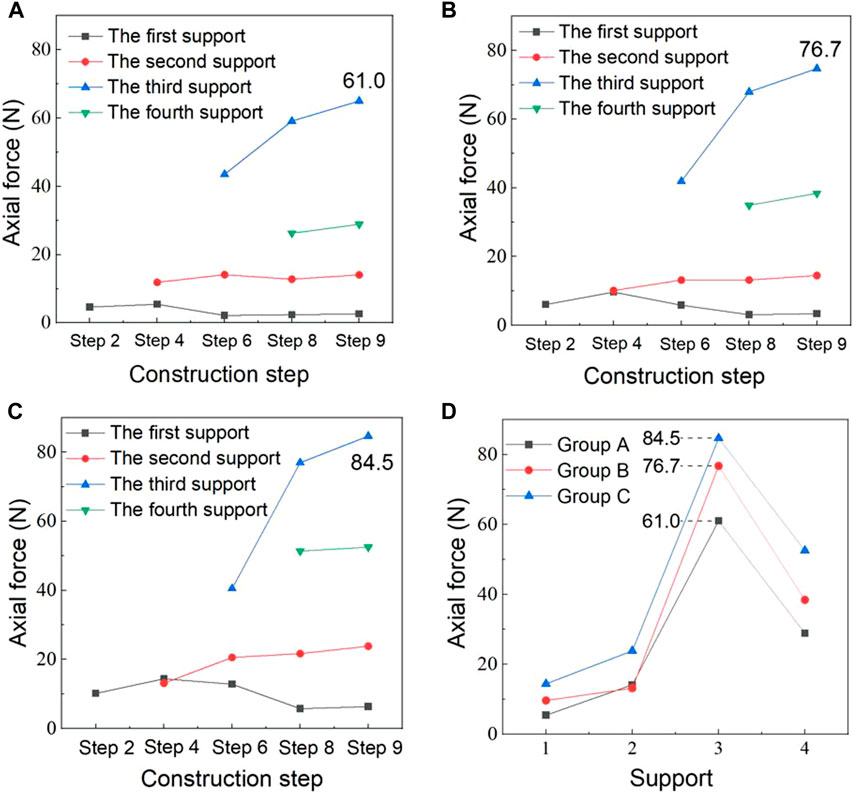
Figure 8. Curve of support axial force: (A) Group A. (B) Group B. (C) Group C. (D) Supporting axial force in each group in Step 9.
Figure 8D shows a comparison of the axial forces in the internal support for the different test groups after excavation was completed. It can be seen from the figure that after excavation was completed and stabilized, the maximum axial forces in the internal support for groups A, B, and C were 61.0 N, 76.7 N, and 84.5 N, respectively, with the maximum axial force occurring in the third layer of support. This corresponds to the location of the maximum horizontal displacement in Section 3.1. Compared to Group C, the maximum axial force in the internal support in Group B decreased by 9.2%, while the maximum axial force in Group A decreased by 27.8%. The narrower the pit width, the smaller the maximum axial force in the internal support, and the impact of the narrower pit width was more significant.
3.4 Surface settlement characteristics around the foundation pit
The displacement readings for each construction step were recorded for the different test groups, and a spline curve was used to plot the ground settlement with the top of the retaining structure as the origin of the horizontal axis and negative values indicating settlement. Figures 9A–C show the settlement curves of the ground surface at the back of the retaining structure for different test groups under different construction conditions. For different test groups, the soil behind the enclosure structure showed a “groove-type” settlement pattern, and the maximum settlement point appeared at 14 cm from the outer edge of the enclosure structure. The surface settlement at 40 cm from the edge of the enclosure structure is no longer obvious. In addition, with the soil excavation in the pit, the surface settlement gradually increased. The soil after the enclosure structure in different test groups showed the most significant increase in the settlement after the excavation of the fourth layer of soil.
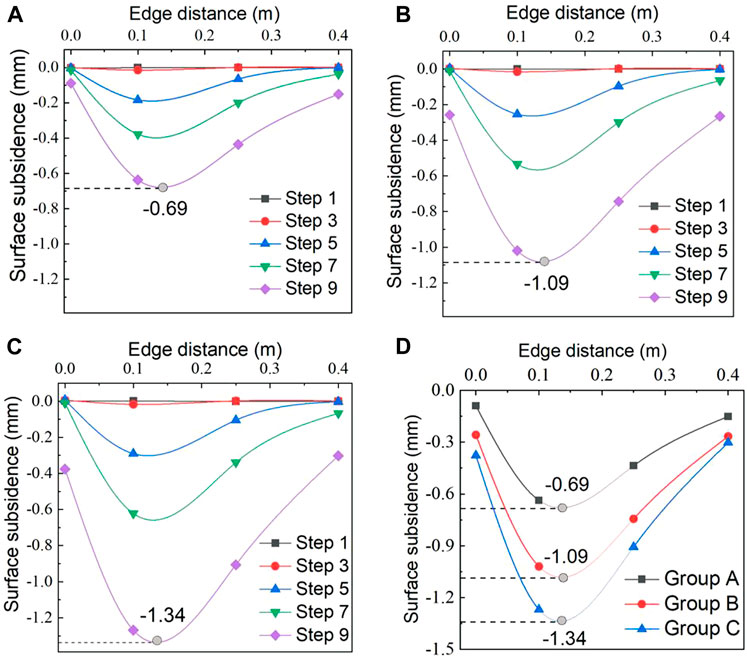
Figure 9. Surface settlement curve behind the retaining structure: (A) Group A. (B) Group B. (C) Group C. (D) Surface subsidence curves of each group in Step 9.
The maximum surface settlement after the foundation pit excavation in different test groups was counted and plotted as a curve, as shown in Figure 9D. It can be seen from the figure that the smaller the width of the foundation pit, the smaller the surface settlement value at the same measuring point. When the foundation pit is excavated to the bottom of the pit, the maximum surface settlement after the retaining structure of Group A, Group B and Group C is −0.69 mm, −1.09 mm and −1.34 mm, respectively. Compared to Group C, the maximum ground settlement behind the retaining structure in Group B decreased by 18.7%, while in Group A, it decreased by 48.5%. The narrower the pit width, the smaller the maximum ground settlement behind the retaining structure, and the weaker the impact on the surrounding environment, with a more significant impact as the pit width decreased. It is worth noting that the maximum settlement point of each test group occurred near 14 cm away from the outer edge of the retaining structure, and according to the geometric similarity ratio of 1:50, the maximum ground settlement was estimated to occur approximately 7 m away from the pit edge.
3.5 Soil pressure distribution characteristics of the enclosure structure
According to the strain value of the strain-type miniature earth pressure box arranged on the envelope structure, multiplied by the calibration coefficient of each earth pressure box, the earth pressure of the envelope structure under different construction conditions under different test groups is obtained. As shown in Figure 10, the top of the envelope structure is used as the origin of the longitudinal axis spline curve to draw the earth pressure distribution curve outside the envelope structure.
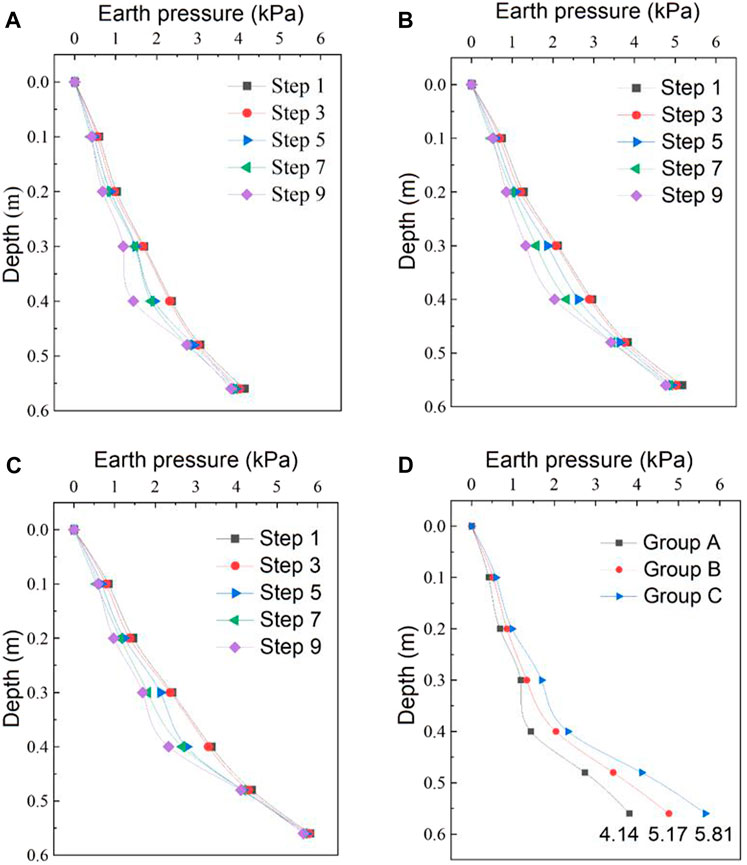
Figure 10. Earth pressure curve outside retaining structure: (A) Group A. (B) Group B. (C) Group C. (D) Deep soil pressure of each group in Step 9.
From Figures 10A–C, it can be seen that for the foundation pit with different widths, the change rule of the earth pressure outside the retaining structure with the construction step is the same. When the earth pressure outside the retaining structure is distributed at Step 1, it is basically static earth pressure, which is close to the stable earth pressure after filling. With the excavation, the earth pressure on the outside of the retaining structure decreases. The earth pressure near the top and bottom of the retaining structure (No. 501, 502, 506, and 507 earth pressure boxes) is not significantly reduced, while the earth pressure in the middle of the retaining structure (No. 503, 504, and 505 earth pressure boxes) is significantly reduced. The earth pressure on the outside of the retaining structure at different parts shows a differential growth feature. This is also the same as the characteristics of horizontal displacement and internal support axial force of the retaining structure. The earth pressure boxes from No. 508 to No. 510 do not change regularly due to the influence of manual excavation.
The external earth pressure of the retaining structure outside the completion of foundation pit excavation in different test groups was summarized and plotted as a curve, as shown in Figure 10D. It can be seen from the figure that the soil pressure on the outside of the enclosure structure has the same vertical distribution rule under different foundation pit widths, and the narrower the foundation pit at different depths, the smaller the soil pressure on the outside of the enclosure structure. The maximum values of soil pressure on the outer side of the retaining structure for Groups A, B, and C were 4.14 kPa, 5.17 kPa, and 5.81 kPa, respectively. Compared to Group C, the maximum soil pressure on the outer side of the retaining structure in Group B decreased by 11.0%, while that in Group A decreased by 28.7%. The narrower the pit, the smaller the maximum soil pressure on the outer side of the retaining structure. The soil pressure on the outer side of the retaining structure is the direct cause of the stress on the pit, and the smaller the soil pressure on the outer side of the retaining structure, the smaller the stress and deformation of the pit, the better the stability of the pit, and the smaller the impact on the surrounding environment. Therefore, the smaller soil pressure on the outer side of the retaining structure in narrow pits is the inherent reason for the better stability of narrow pits compared to wide pits.
4 Discussions
In this paper, through the design of a 1 g constant gravity physical model test, the mechanical response and stability influence law of foundation pit after layer-by-layer excavation under different foundation pit widths are explored. 3D printing technology is used to construct the foundation pit support structure. The setting of fine components, such as internal support buckles, makes excavating the foundation pit layer by layer more feasible. The physical and mechanical properties of printed components can meet this test’s needs, proving that 3D printing technology has good application value in the field of foundation pit model tests. It is worth noting that 3D printing is rich in raw materials. In this experiment, ABS materials are uniformly selected as raw materials. Different components, such as concrete support and steel support, can be distinguished in subsequent experiments. Powder metal materials can also be used to print some components to simulate the physical and mechanical properties of different types of components.
The test results further verify that the narrow foundation pit has better stability, and the narrower the foundation pit, the more significant the influence on the stability. The test reveals that the change in the width of the foundation pit has little effect on the mechanical response characteristics of the supporting structure, and the position of the maximum deformation and the maximum internal force has not changed. The influence of the width effect of the foundation pit is directly reflected in the internal force and deformation of the supporting structure and the change in the value of the surface settlement. Taking the test results of Group C as the benchmark, the percentage reduction of the test results of Group A is about three times the percentage reduction of the test results of Group B, and its stability has improved substantially. It should be noted that due to the limited number of test groups, more detailed regularity conclusions and theoretical analysis need to be further explored. Subsequent tests can appropriately increase the test group for support, such as setting different working conditions of equal gradient foundation pit width or width-depth ratio.
5 Conclusion
In this study, an elaborated foundation pit supporting structure is constructed by 3D printing technology, and the scaled model test of foundation pit excavation is carried out. The deformation and stress laws of foundation pit are analyzed with the foundation pit’s width as single variable. The main conclusions are as follows:
(1) The width of foundation pit significantly affects the stress, deformation and surface settlement of the supporting structure. Compared with the 40 cm foundation pit width, the maximum horizontal displacement of the retaining structure of the 16 cm and 30 cm foundation pit width is reduced by 17.3% and 45.3% respectively. At the sanme time, the maximum surface settlement is reduced by 18.7% and 48.5% respectively, and the maximum earth pressure outside the retaining structure is reduced by 11.0% and 28.7% respectively.
(2) With the excavation of foundation pit and the erection of internal support, the retaining structure is subjected to the constraint of the soil and the internal support in the pit. The deformation and stress characteristics are gradually converted from the “cantilever” pattern to the “internally convex” or “concave-convex” composite deformation and stress pattern. In addition, the maximum displacement of the retaining structure appears between the third support and the bottom of the pit. And the maximum bending moment appears near the bottom of the pit.
(3) Taking the foundation pit’s width as the single variable, the narrower the width of the foundation pit, the lower the earth pressure on the outer side of the retaining structure, which leads to the smaller deformation and stress of the foundation pit. Additionally, the reduction in the passive zone of the pit makes the stability of the foundation pit better, resulting in less surface settlement and impact on surrounding buildings. The inherent reason for the good stability of narrow pits is the small lateral earth pressure on the outside of the support structure.
Data availability statement
The original contributions presented in the study are included in the article/supplementary material, further inquiries can be directed to the corresponding author.
Author contributions
FL: Writing–original draft. XZ: Writing–review and editing. MX: Writing–review and editing. JL: Writing–review and editing. RF: Writing–review and editing. SL: Writing–review and editing.
Funding
The author(s) declare that financial support was received for the research, authorship, and/or publication of this article. This study was supported by the National Natural Science Foundation of China (No. U1934211), the Huaian Science and Technology Plan Project Natural Science Research (Grant No. HAB202365), and Basic Research (Natural Science) Research Project of Jiangsu Province Higher Education Institutions (Grant No. 23KJB560003). The corresponding author gratefully acknowledges their financial support.
Conflict of interest
Authors FL and RF were employed by Jinan Rail Transit Group Co., Ltd.
Author XZ was employed by China Railway 14th Bureau Group Co., Ltd.
The remaining authors declare that the research was conducted in the absence of any commercial or financial relationships that could be construed as a potential conflict of interest.
Publisher’s note
All claims expressed in this article are solely those of the authors and do not necessarily represent those of their affiliated organizations, or those of the publisher, the editors and the reviewers. Any product that may be evaluated in this article, or claim that may be made by its manufacturer, is not guaranteed or endorsed by the publisher.
References
Chen, B., Yan, T., Song, D., Luo, R., and Zhang, G. (2021). Experimental investigations on a deep excavation support system with adjustable strut length. Tunn. Undergr. Space Technol. 115, 104046. doi:10.1016/j.tust.2021.104046
Chen, S., Cui, J., and Liang, F. (2022). Centrifuge model investigation of interaction between successively constructed foundation pits. Appl. Sciences-Basel. 12, 7975. doi:10.3390/app12167975
Cheng, X., Zheng, G., Diao, Y., Huang, T., Deng, C., Nie, D., et al. (2017). Experimental study of the progressive collapse mechanism of excavations retained by cantilever piles. Can. Geotechnical J. 54 (4), 574–587. doi:10.1139/cgj-2016-0284
Faheem, H., Cai, F., and Ugai, K. (2004). Three-dimensional base stability of rectangular excavations in soft soils using FEM. Comput. Geotechnics 31 (2), 67–74. doi:10.1016/j.compgeo.2004.02.005
Han, J., Wang, J., Yang, W., Wang, X., Ma, R., Wang, W., et al. (2023). Experimental study on the properties of a polymer-modified superfine cementitious composite material for waterproofing and plugging. Case Stud. Constr. Mater. 19, e02552. doi:10.1016/j.cscm.2023.e02552
He, C., Lu, Y., and Yang, Y. (2022). Effect of size on the stability of narrow foundation pits. Adv. Civ. Eng. 2022, 1–9. doi:10.1155/2022/7391622
He, L., Liu, Y., Bi, S., Wang, L., Broggi, M., and Beer, M. (2020). Estimation of failure probability in braced excavation using Bayesian networks with integrated model updating. Undergr. Space 5 (4), 315–323. doi:10.1016/j.undsp.2019.07.001
Hu, Y., Li, Y., Li, B., Li, C., and Xiao, J. (2018). Centrifugal model tests and numerical simulation of three-dimensional space effect of deep and large foundation pit under the confined water level fluctuation. Rock Soil Mech. 39 (06), 1999–2007.
Huang, M., Li, H., Yu, J., Zhang, C., and Ni, Y. (2023). On the simplified method for evaluating tunnel response due to overlying foundation pit excavation. Transp. Geotech. 42, 101048. doi:10.1016/j.trgeo.2023.101048
Jiang, Q., and Song, L. (2018). Application and prospect of 3D printing technology to physical modeling in rock mechanics. Chin. J. Rock Mech. Eng. 37 (01), 23–37.
Li, L., Yang, J., Fu, J., Wang, S., Zhang, C., and Xiang, M. (2022). Experimental investigation on the invert stability of operating railway tunnels with different drainage systems using 3D printing technology. J. Rock Mech. Geotechnical Eng. 14 (5), 1470–1485. doi:10.1016/j.jrmge.2021.12.013
Li, L., Yang, J., Wang, L., Gao, C., Jiang, M., and Wang, Z. (2020). Application and research of 3D printing technology in simulation test of invert heaving disease of high-speed railway tunnel. Chin. J. Rock Mech. Eng. 39 (07), 1369–1384.
Li, T., Zhao, W., Liu, R., Han, J., Jia, P., and Cheng, C. (2024). Visualized direct shear test of the interface between gravelly sand and concrete pipe. Can. Geotechnical J. 61 (2), 361–374. doi:10.1139/cgj-2022-0007
Li, Z., Zhao, G., Deng, X., Zhu, J., and Zhang, Q. (2022). Further development of distinct lattice spring model for stability and collapse analysis of deep foundation pit excavation. Comput. Geotechnics 144, 104619. doi:10.1016/j.compgeo.2021.104619
Liu, S. (2022). Study on deformation mechanism of supporting structure and stability for long and narrow deep excavations. Central South University.
Liu, Y., Xia, C., Xu, C., and Chen, X. (2020). Analytical solution and centrifugal test for the optimization of retaining wall insertion depth in narrow foundation pits. Chin. J. Rock Mech. Eng. 39 (03), 593–607.
Orazalin, Z., Whittle, A., and Olsen, M. (2015). Three-Dimensional analyses of excavation support system for the stata center basement on the MIT campus. J. Geotechnical Geoenvironmental Eng. 141 (7). doi:10.1061/(asce)gt.1943-5606.0001326
Wang, H., and Sun, Y. (2012). Test study and bar system FEM for foundation pits considering excavation width. Rock Soil Mech. 33 (09), 2781–2787+2795.
Wang, J., Deng, Y., Ma, R., Liu, X., Guo, Q., Liu, S., et al. (2018). Model test on partial expansion in stratified subsidence during foundation pit dewatering. J. Hydrology 557, 489–508. doi:10.1016/j.jhydrol.2017.12.046
Wang, J., Liu, X., Wu, Y., Liu, S., Wu, L., Lou, R., et al. (2017). Field experiment and numerical simulation of coupling non-Darcy flow caused by curtain and pumping well in foundation pit dewatering. J. Hydrology 549, 277–293. doi:10.1016/j.jhydrol.2017.03.070
Xu, C., Chen, Q., Wang, Y., Hu, W., and Fang, T. (2016). Dynamic deformation control of retaining structures of a deep excavation. J. Perform. Constr. Facil. 30 (4), 04015071. doi:10.1061/(asce)cf.1943-5509.0000819
Xu, Q., Xie, J., Lu, L., Wang, Y., Wu, C., and Meng, Q. (2023). Numerical and theoretical analysis on soil arching effect of prefabricated piles as deep foundation pit supports. Undergr. Space 16, 314–330. doi:10.1016/j.undsp.2023.09.011
Ying, H., Wang, X., and Zhang, J. (2018). Analysis on heave-resistant stability considering the effect of excavation width. Eng. Mech. 35 (5), 118–124.
Zeng, C., Song, W., Xue, X., Bai, N., and Mei, G. X. (2021). Construction dewatering in a metro station incorporating buttress retaining wall to limit ground settlement: insights from experimental modelling. Tunn. Undergr. Space Technol. 116, 104124. doi:10.1016/j.tust.2021.104124
Zeng, C., Zheng, G., Zhou, X., Xue, X. L., and Zhou, H. Z. (2019). Behaviours of wall and soil during pre-excavation dewatering under different foundation pit widths. Comput. Geotechnics 115, 103169. doi:10.1016/j.compgeo.2019.103169
Zhang, J., Xie, R., and Zhang, H. (2018). Mechanical response analysis of the buried pipeline due to adjacent foundation pit excavation. Tunn. Undergr. Space Technol. 78, 135–145. doi:10.1016/j.tust.2018.04.026
Zhang, S., Yue, Z., Lu, X., Zhang, Q., Sun, T., and Qi, Y. (2023). Model test and numerical simulation of foundation pit constructions using the combined artificial ground freezing method. Cold Regions Sci. Technol. 205, 103700. doi:10.1016/j.coldregions.2022.103700
Zhao, J., Tan, Z., Yu, R., Li, Z., Zhang, X., and Zhu, P. (2022). Deformation responses of the foundation pit construction of the urban metro station: a case study in Xiamen. Tunn. Undergr. Space Technol. 128, 104662. doi:10.1016/j.tust.2022.104662
Keywords: foundation pit width, 3D printing technology, model test, deformation characteristics, mechanical response, stability
Citation: Liu F, Zhang X, Xiang M, Lyu J, Feng R and LIU S (2024) Experimental study on stress and deformation characteristics of foundation pit considering excavation width using 3D printing technology. Front. Earth Sci. 12:1373140. doi: 10.3389/feart.2024.1373140
Received: 19 January 2024; Accepted: 15 March 2024;
Published: 28 March 2024.
Edited by:
Jiayong Han, Shandong Jianzhu University, ChinaReviewed by:
Wei-Hai Yuan, Hohai University, ChinaZhixiong Zeng, Hong Kong University of Science and Technology, Hong Kong, SAR China
Copyright © 2024 Liu, Zhang, Xiang, Lyu, Feng and LIU. This is an open-access article distributed under the terms of the Creative Commons Attribution License (CC BY). The use, distribution or reproduction in other forums is permitted, provided the original author(s) and the copyright owner(s) are credited and that the original publication in this journal is cited, in accordance with accepted academic practice. No use, distribution or reproduction is permitted which does not comply with these terms.
*Correspondence: Maolong Xiang, eGlhbmdtYW9sb25nQGNzdS5lZHUuY24=