 Yifan Jia
 Ruihuang Xie
- 1Department of Marine Meteorology, College of Oceanic and Atmospheric Sciences, Ocean University of China, Qingdao, China
- 2Collaborative Innovation Center for Forecast and Evaluation of Meteorological Disasters, Nanjing University of Information and Technology, Nanjing, China
The dependence of the southward shift of low-level westerly anomalies over the equatorial central Pacific on El Niño intensity during the mature winter was investigated through observational analyses and air–sea coupled model simulations. El Niño events are categorized into two types based on the presence or absence of such a southward westerly shift (SWS). El Niño events with an evident SWS (SWS El Niño) exhibit strong intensity in sea surface temperature anomalies, whereas those without a remarkable SWS (non-SWS El Niño) are weak. The strength of westerly anomalies of SWS El Niño is twice as large as those of non-SWS El Niño in mature winter and can induce larger growth of westerly anomalies south of the equator by two anomalous southward westerly advections. One is the advection of anomalous westerlies by climatological winter-mean northerlies, and the other is the advection of climatological zonal wind by anomalous westerlies. Observations and model simulations both indicate that the two types of El Niño terminate differently. The strong SWS El Niño decays initially in the equatorial central Pacific, induced by a large local discharge of mass and heat content associated with intense SWS and the subsequent westward sea current anomalies starting in the decaying spring. In contrast, the non-SWS El Niño terminates first in the far eastern Pacific by cool advection carried by local westward sea current anomalies in mature winter, which is then enhanced by poleward discharge associated with weak SWS in the equatorial central Pacific.
1 Introduction
The El Niño-Southern Oscillation (ENSO) is the strongest year-to-year climate variability in the tropical Pacific air–sea coupling system (Bjerknes, 1969; Wallace et al., 1998; Larkin and Harrison, 2002; Chen and Wallace, 2015). Its warm phase, El Niño, is characterized by warmer sea surface temperature (SST) and lower sea level pressure (SLP) in the equatorial eastern Pacific, anomalous low-level westerly winds, and an enhancement of atmospheric convection over the equatorial central Pacific (Rasmusson and Carpenter, 1982; Battisti et al., 2019). The spatial structure of the cold ENSO phase (La Niña) is opposite to that of warm phase, yet notable differences exist in the location and intensity of SSTs, SLPs, and wind and convection anomalies (Deser and Wallace, 1987; Hoerling et al., 1997; Burgers and Stephenson, 1999; An and Jin, 2004; Choi et al., 2013; Dommenget et al., 2013; Hu et al., 2014). Although ENSO is confined to the tropical Pacific, its influence extends globally by generating remote impacts on global weather and climate (Ropelewski and Halpert, 1987; Trenberth and Caron, 2000; McPhaden, 2006; Li and Hsu, 2018; Ren et al., 2018). Consequently, understanding ENSO dynamics, monitoring its evolution, and predicting its status have become a great research interest.
ENSO typically initiates in boreal late spring and reaches its peak in boreal winter due to the modulation of its growth rate by the seasonal cycle in the background state (Li, 1997; An and Wang, 2001; Stein et al., 2010; Dommenget and Yu, 2016; Chen and Jin, 2020; Bayr et al., 2021). Throughout the seasons from boreal spring to autumn, there is a gradual intensification of seasonal mean equatorial upwelling and zonal SST gradients, which results in increases in both the thermocline feedback and zonal advective feedback (Li, 1997; Stein et al., 2010; Li and Hsu, 2018; Chen and Jin, 2020) and ultimately leads to an enhancement of the coupled Bjerknes instability (Jin et al., 2020). During autumn, the mean upwelling and zonal SST gradient decrease rapidly, causing the coupled Bjerknes instability to decrease to near zero in winter and to negative in the following spring (Li, 1997; Li and Hsu, 2018; Chen and Jin, 2020).
Moreover, the peak of ENSO in winter and its subsequent termination may also be attributed to the southward shift of equatorial zonal wind anomalies (Vecchi and Harrison, 2003; Spencer, 2004; Lengaigne et al., 2006; McGregor et al., 2012; 2013; 2014; Abellán and McGregor, 2016). During winter, SST anomalies (SSTA) still straddle the equator, but the maximal zonal wind and convection anomalies over the equatorial central Pacific are shifted south of the equator, near 5oS (Harrison, 1987; Harrison and Vecchi, 1999). As the southward westerly shift (SWS) weakens the equatorial zonal wind anomalies and oceanic Kelvin wave activity, the fluctuated thermocline depth and the sea level height in the equatorial eastern Pacific begin to relax, consequently weakening the thermocline feedback (Harrison and Vecchi, 1999; Vecchi and Harrison, 2003; Lengaigne et al., 2006). Furthermore, the zonal advective feedback undergoes a reversal because of the reversal of the equatorial zonal sea surface current anomalies triggered by the imbalance between the zonal gradient of sea level and wind stress anomalies on the equator (Kug et al., 2009; Chen H.-C. et al., 2016; Ren et al., 2018). Concurrently, the SWS strengthens the northward transport of equatorial oceanic heat content, known as the discharging process, in the equatorial central Pacific (Kug et al., 2003; Clarke et al., 2007; Mcgregor et al., 2012; 2013; 2014).
Thus far, studies on the SWS have revealed its linkage to the seasonal southward shift of high SST above the convection threshold, corresponding to the southward migration of solar radiation in winter. Three different mechanisms were proposed: 1) high SSTs located south of the equator in winter can generate stronger convection anomalies and larger zonal wind anomalies than those north of the equator (Spencer, 2004; Lengaigne et al., 2006; Stuecker et al., 2013); 2) the southward shift of high SST enhances wind convergence but weakens boundary layer friction in the South Pacific Convergence Zone (SPCZ), through which ENSO drives larger zonal wind anomalies south of the equator (Mcgregor et al., 2012); 3) the wintertime cross-equator northerly winds driven by the southward shift of high SSTs can induce a southward advection of the equatorial zonal wind anomalies (Gong and Li, 2021; 2023).
It has been suggested that the extent of the SWS, specifically the latitude of maximal zonal wind anomalies, is larger in El Niño than in La Niña (Abellán and McGregor, 2016; Gong and Li, 2021). Additionally, the eastern Pacific (EP) El Niño events exhibit a more pronounced SWS than the central Pacific (CP) El Niño (McGregor et al., 2013; Zhang et al., 2015; Gong and Li, 2023). These findings suggest a dependence of the SWS extent on the ENSO spatial pattern. However, it is noteworthy that El Niño tends to be stronger than La Niña (e.g., Burgers and Stephenson, 1999), and EP El Niño events are typically stronger than CP El Niño events (Kug et al., 2009; Okumura, 2019; Xie et al., 2020). This also suggests a potentially overlooked relationship between the SWS extent and ENSO intensity, which is a research focus of this study. Furthermore, EP El Niño exhibits a faster decay rate than CP El Niño (Kug et al., 2009; Chen and Li, 2021), and there is a tendency for an EP (CP) El Niño to be followed by a CP (EP) La Niña (Li et al., 2015; Wang and Ren, 2020; Chen and Li, 2021). Hence, another aim of this study is to investigate the dynamical processes that connect the SWS extents to the different ways in which diverse El Niño events terminate.
In this study, we aim to re-evaluate the SWS phenomenon and its relationship with forms of El Niño termination by considering El Niño intensity as a key perspective. Observed El Niño events are classified into two types: a strong type that is capable of inducing a pronounced SWS in winter (SWS El Niño) and a weak type without an evident SWS (non-SWS El Niño). We will compare the spatial pattern of low-level wind anomalies and examine physical processes that lead to varying SWS extents. Forms of El Niño terminations associated with different SWS extents will also be compared.
2 Data and methods
The SSTs and atmospheric fields used in this study are from the fifth-generation European Centre for Medium-Range Weather Forecasts (ECMWF) reanalysis (ERA5; Hersbach et al., 2023a; b). These fields include three-dimensional winds and geopotential height. Oceanic data, including sea surface height (SSH) and zonal and meridional ocean currents, are from the ECMWF Ocean Reanalysis System 5 (ORAS5; Copernicus Climate Change Service, Climate Data Store, 2021). The current analysis spans the period from 1980 to 2020. To validate the diagnostic results derived from observations, considering the limited number of El Niño events, we utilize the 1200-year outputs from the pre-industrial control experiment conducted in the UKESM1-0-LL (Meinshausen et al., 2017). The simulated El Niño events in this model exhibit diverse intensities and locations, providing a reasonable comparison to observations (Dieppois et al., 2021). All data are interpolated into a 1°×1° horizontal resolution.
According to Gong and Li (2021), a SWS involves a transition from symmetric zonal wind on the equator to antisymmetric zonal wind between hemispheres. Hence, the atmospheric variables, excluding the meridional wind, are decomposed into symmetric and antisymmetric parts relative to the equator, as expressed in the following terms:
where y denotes latitude, and subscripts s and a denote the symmetric and antisymmetric parts of this variable, respectively. For meridional wind fields, the equatorial symmetric and antisymmetric components are defined as follows:
This approach results in the generation of a robust antisymmetric zonal wind pattern concerning the equator, featuring low-level westerly (easterly) anomalies to the south (north) during the El Niño mature phase (e.g., Figures 4A, 5A). To investigate the distinct SWS characteristics in the strong and weak El Niño types, a comparable analysis of the zonal momentum budget for the antisymmetric zonal wind is conducted. The budget equation is written as follows:
where the overbar (prime) denotes the monthly climatology (anomaly), and the subscript a denotes the antisymmetric part of each budget term; u, v, and ω are the three-dimensional winds, f is the Coriolis parameter, φ denotes the geopotential height, and Fx is the apparent momentum sink term that consists of turbulence viscosity and surface zonal friction. The calculation of the Fx follows the procedure in Gong and Li (2021): zonal momentum tendency and each term in Eq. (5) except Fx values are calculated first using daily reanalysis raw data, then Fx can be determined and averaged into monthly values for a monthly zonal momentum budget analysis.
3 Results
3.1 Observed SWS features in the two El Niño types
The spatio-temporal pattern of the SWS during El Niño can be obtained through a multivariate empirical orthogonal function (MV-EOF) analysis of the low-level wind anomalies averaged over 1000–850 hPa in the tropical central Pacific (150ºE–120ºW, 15ºS–15ºN). This area is chosen to concentrate on the variability of low-level winds solely in the equatorial central Pacific while eliminating the influence of anomalous anticyclones/cyclones over the northwestern tropical Pacific typically associated with ENSO (e.g., Stuecker et al., 2013). Figure 1 shows the first two modes, which collectively account for 55% of the total wind variance. The first mode exhibits a quasi-symmetric westerly wind pattern about the equator (Figure 1A) that peaks in Nov0-Dec0-Jan1-Feb1 (ND0JF1, Figures 1C,D). Here, 0 and 1 denote the ENSO developing and decaying years, respectively. Clearly, this mode represents the simultaneous wind response to ENSO, indicated by its high correlation with the Niño-3.4 index (SSTA averaged in 170ºW–120ºW, 5ºS–5ºN) (Figure 1C). The second mode shows maximal westerly anomalies situated south of the equator between 170ºW and 130ºW, a sign of SWS (Figure 1B). Notably, this mode shows large principle component (PC) values in Jan1-Feb1-Mar1-Apr1 (JFMA1, Figures 1C,D) when the ENSO mode decays. It is apparent that the spatio-temporal features of the first two modes are consistent with those of the ENSO mode and the ENSO-annual cycle combination mode (C-mode), as identified by Stuecker et al. (2013). Additionally, PC2 (the principle component of the second mode) shows large values following strong El Niño events (e.g., 1982/83, 1997/98, and 2015/16) but remains small in other El Niño events (Figure 1C). It has been suggested that these extreme El Niño events are related to pan-tropical Pacific interaction (Wang and Wang, 2021). During the developing year of an extreme El Niño, the presence of an Atlantic Niña in the summer and a positive Indian Ocean dipole in the fall would jointly produce additional westerlies over the equatorial central-to-eastern Pacific, thereby augmenting an extreme El Niño. Furthermore, the regressed SST and wind anomalies confirm that the first mode is linked to the mature phase of the ENSO, whereas the second mode is associated with the decaying phase of the ENSO that is initiated in the equatorial central Pacific (Figures 1E,F).
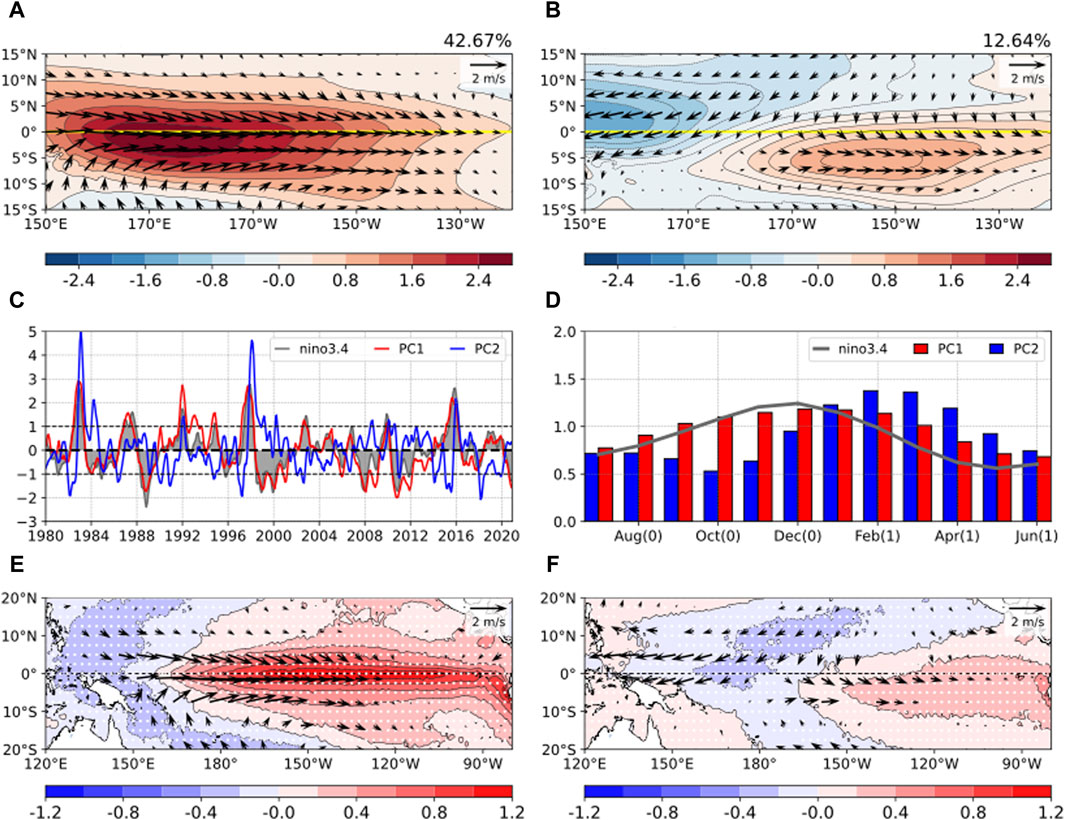
Figure 1. Spatio-temporal characteristics of the first two MV-EOF modes of low-level wind anomalies (vectors; m s−1) in the tropical Pacific (150°E−120°W, 15°S–15°N) during 1980–2020. The spatial patterns are shown in (A, B), with shading indicating the zonal wind anomalies. The corresponding principal components (PCs) and Niño3.4 indexes are displayed in (C), and their monthly standard deviations of PC and Niño3.4 are presented in (D). Panels (E) and (F) display the regressed sea surface temperature (SST) and low-level wind anomalies on the two PCs, respectively. Stipples and vectors indicate the SST anomalies and wind anomalies exceeding the 95% confidence levels, as estimated from a Student’s t-test.
Based on the ND0JF1 values of PC1 and the JFMA1 values of PC2, El Niño events are categorized into two types: one with (principle component of the first mode) PC1>0.75 and PC2>0.75, indicating a pronounced SWS (SWS El Niño), and the other with PC1>0.75 and PC2<0.75, representing a weak SWS (non-SWS El Niño). It is common practice to use a criterion of 0.75 standard deviations of PC to distinguish distinct El Niño events from others. For instance, Chen L. et al. (2016) utilized a 0.75 standard deviation of the ND0J1 Niño 3 index (SSTA averaged in 150ºW–90ºW, 5ºS–5ºN) as a criterion for an El Niño event. A higher criterion, such as one standard deviation of JFMA1 PC2, will exclude the 1991/92 event, which did experience a clear SWS, from the SWS El Niño type. Nevertheless, applying a higher criterion will not significantly change the results and conclusions of this study. The SWS El Niño type includes the El Niño events in 1982/83, 1991/92, 1997/98, 2009/10, and 2015/16, which are strong and were classified as EP El Niño events except for the CP El Niño in 1991/92 and 2009/10 (e.g., Kim et al., 2009; Lee and McPhaden, 2010). The non-SWS El Niño type comprises events in 1986/87, 1994/95, 2002/03, 2004/05, and 2006/07 El Niño events, which are weaker and were previously categorized as CP El Niño events, except for the 1986/87 and 2006/07 events (see event definition in Lee and McPhaden, 2010). According to our classification, the occurrence of SWS phenomena depends on El Niño intensity rather than spatial pattern.
The seasonal evolution of the first two PCs for both El Niño types is shown in Figure 2. For both types, their PC1s, representing symmetric westerly anomalies, begin during spring, peak in winter from November (0) to February (1), and decay in the following spring (Figures 2A,B). The PC2 of the SWS El Niño type has negative values during the El Niño developing phase but undergoes a rapid reversal around October 0) and peaks during JFMA1 (Figure 2A), indicating a significant SWS. Conversely, in the non-SWS El Niño type, PC2 remains negative throughout the El Niño developing and mature phases and turns positive in the summer and early autumn of the decaying year (Figure 2B). The different seasonal PC2 evolutions confirm the previous conclusion and our hypothesis that the weaker CP El Niño event is not associated with an obvious SWS during the decaying spring (Mcgregor et al., 2013; Zhang et al., 2015).
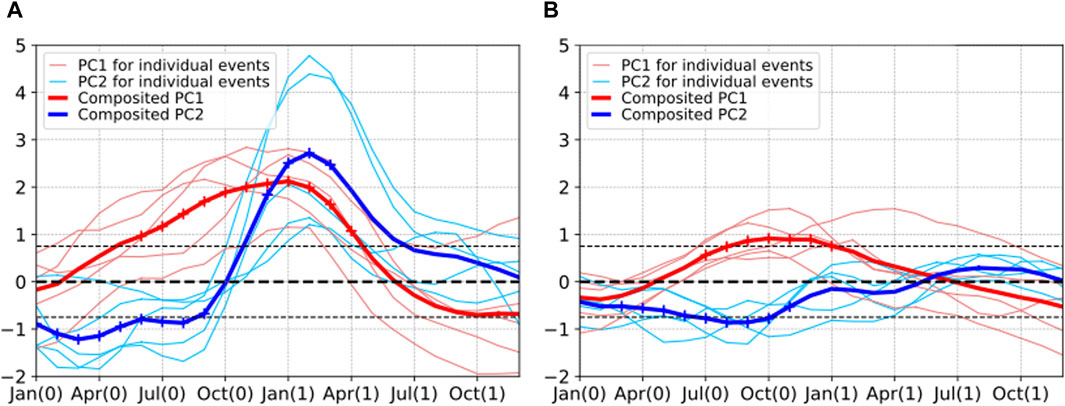
Figure 2. Monthly evolution of the first two PCs associated with (A) SWS El Niño events and (B) non-SWS El Niño events. Light red (blue) contours represent PC1 (PC2) for the individual event, and the thick contours correspond to the event composites. Plus signs indicate values exceeding the 95% confidence levels estimated from a Student’s t-test. The thin black lines indicate the ±0.75 standard deviations of the two PCs.
As suggested by Zhang et al. (2015) and Gong and Li (2023), the SWS phenomena are attributed to the combined influence of winds associated with the two modes. Therefore, the SWS structures can be reconstructed by combining the wind anomaly components associated with the two MV-EOF modes through the following equation:
Here,
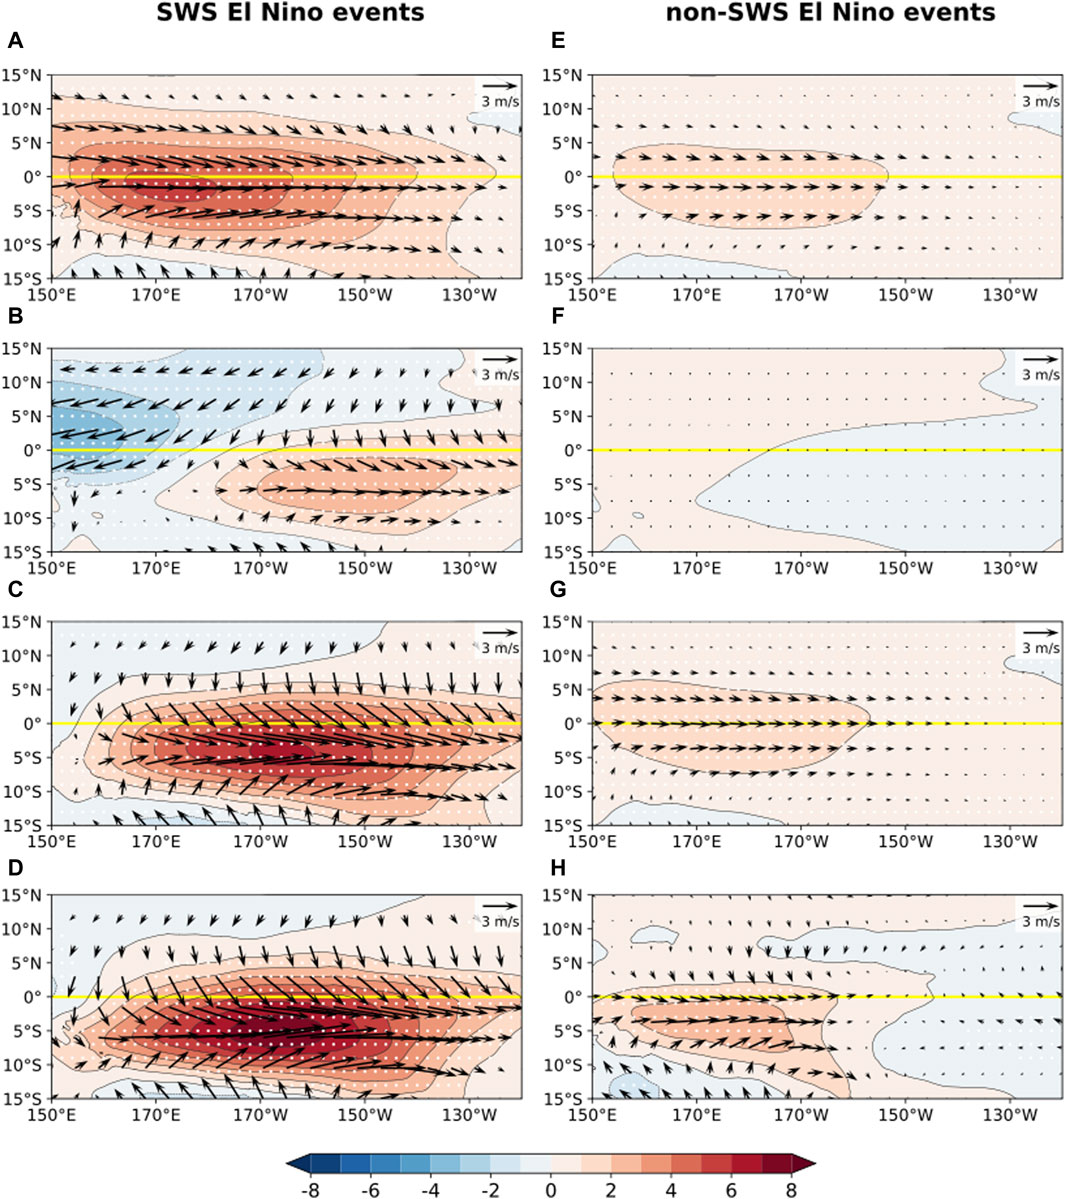
Figure 3. The reconstructed low-level wind anomalies (m s−1) from each mode and their combinations in JFMA1 for SWS El Niño (left) and non-SWS El Niño (right) events, derived based on PC1 (A, E), PC2 (B, F), and combined PC1 and PC2 (C, G). The composites of observed wind anomalies for the two El Niño events are shown in (D, H). Shading indicates zonal wind anomalies, and stipples indicate values exceeding the 95% confidence levels estimated from a Student’s t-test.
The PC2 reconstructed wind anomalies display significant distinctions (Figures 3B,F). For the SWS El Niño events, a remarkable SWS occurs in the southern central Pacific between 180° and 130°W, accompanied by strong easterly anomalies over the northwestern tropical Pacific (Figure 3B). This wind anomaly pattern enhances the PC1-related westerly anomalies over the central Pacific but strongly weakens those over the northwestern Pacific, favoring the SWS phenomena. In contrast, the non-SWS El Niño events show an almost opposite and very weak wind anomaly pattern from the SWS El Niño events in the same region (Figure 3F), mirroring the weak and negative PC2 values in JFMA1 (blue contour in Figure 2B). The weak westerly (easterly) anomalies over the western (central) equatorial Pacific tend to enhance (weaken) the westerly anomalies associated with PC1, thus inhibiting, rather than favoring, the SWS phenomena, which is consistent with the wind analysis of the weak CP El Niño in Zhang et al. (2015). The combination of the wind anomaly components reconstructed from the first two modes (Figures 3C,G) shows high similarities to the observed wind anomaly patterns of the two El Niño types (Figures 3D,H). The classified SWS El Niño is associated with a prominent SWS pattern over the central Pacific in JFMA1, featured by maximal westerly anomalies centered along 7°S between 150°E and 140°W (Figures 3C,D). In contrast, the non-SWS El Niño displays a weaker SWS, with maximal westerly anomalies at 3°S between 150°E and 160°W (Figures 3G,H).
3.2 Momentum budget diagnosis of antisymmetric zonal wind anomalies
Gong and Li (2021, 2023) suggested that the SWS arises from the development of antisymmetric zonal wind anomalies starting from the ENSO mature phase. A momentum budget of the antisymmetric zonal wind anomaly component is conducted to elucidate the specific physical processes responsible for the SWS. The antisymmetric zonal wind anomalies for the two El Niño types, along with their tendency and positive budget terms calculated following Eq. (5), are displayed in Figures 4, 5. The positive tendency term in the southern hemisphere (SH) signifies westerly and thus favors the SWS. For both the SWS El Niño and non-SWS El Niño events (Figures 4, 5), the leading positive tendency terms are the anomalous meridional advection of anomalous westerlies by a mean meridional wind
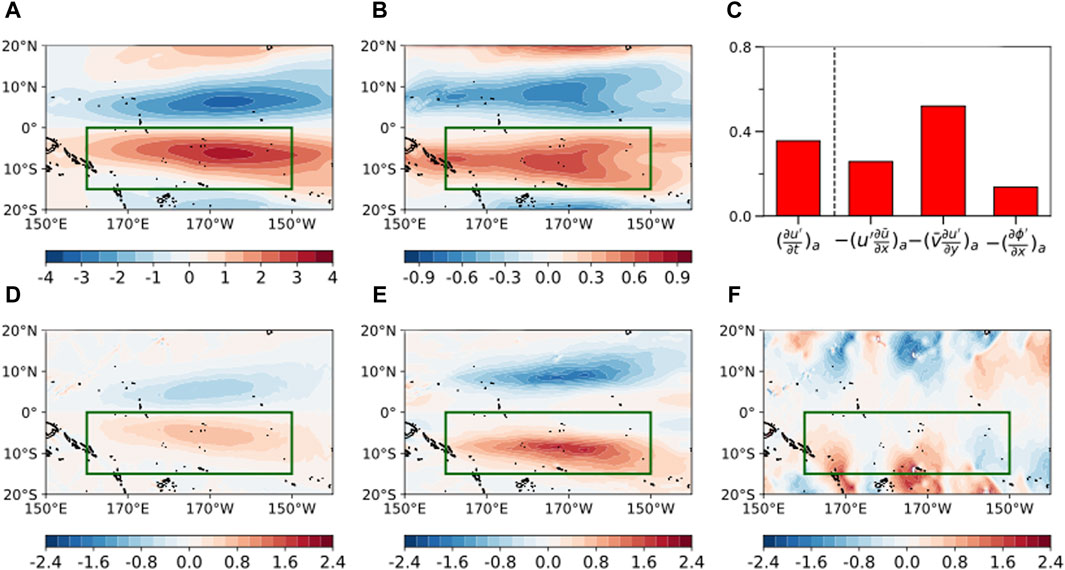
Figure 4. Composite (A) antisymmetric component of the anomalous low-level zonal wind [
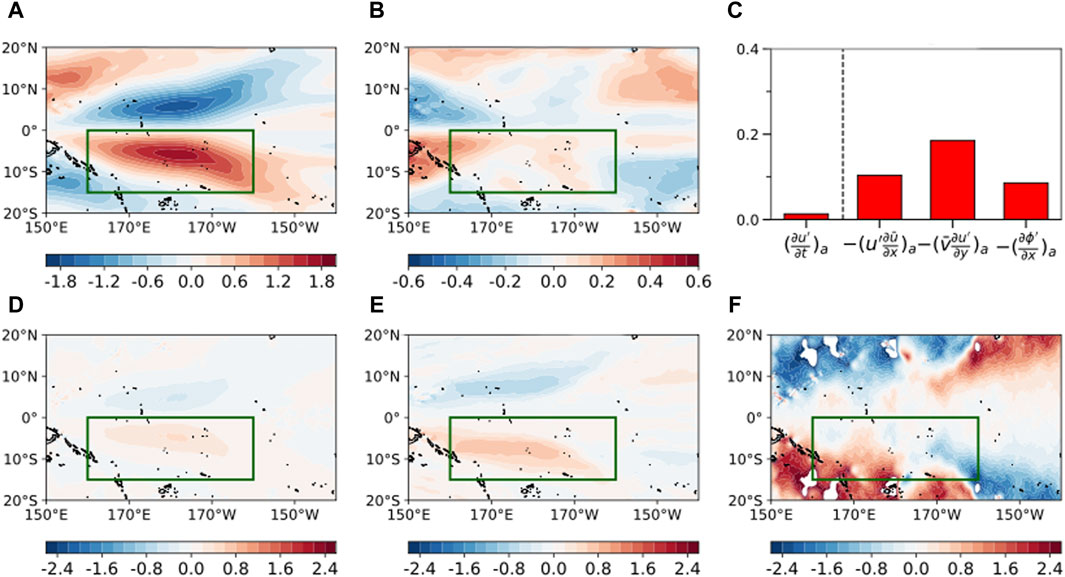
Figure 5. Similar to Figure 4 for the non-SWS El Niño. The green box is the domain with maximal
The momentum budget results indicate that the mechanism for the strong and weak SWS in the two types of El Niño events is the same. However, it is noteworthy that the two advection terms mentioned above for the SWS El Niños are nearly twice as large as those for the non-SWS El Niños (Figure 4C; Figure 5C), consistent with the intensity ratios of the anomalous zonal winds (Figures 3D,H) and antisymmetric zonal winds (Figures 4A, 5A) in the western-to-central Pacific south of the equator. The two anomalous advection terms are further divided into the advections associated with symmetric and antisymmetric winds, following Eqs (7), (8):
Then, the antisymmetric components can be written as
Figure 6 shows the horizontal patterns of the right-side terms of Equations 9, 10 for SWS El Niño events. It is seen that the antisymmetric zonal advection
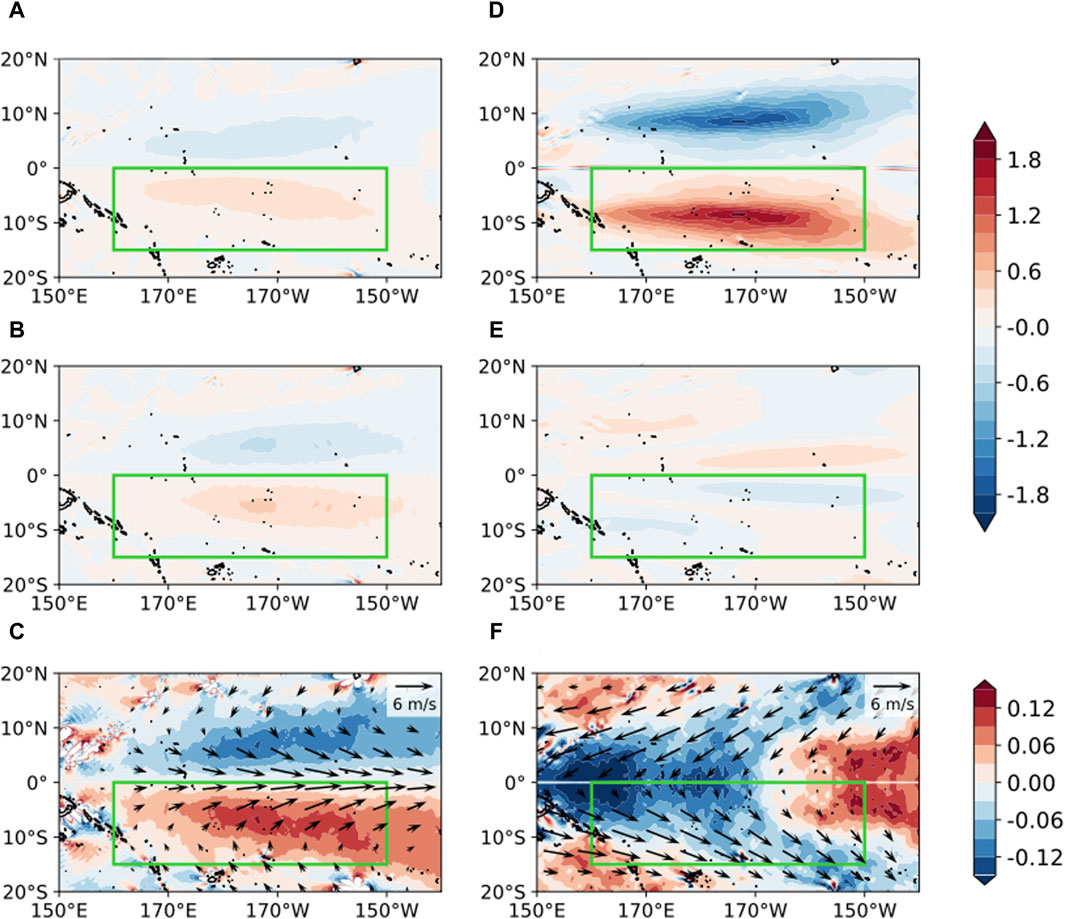
Figure 6. Horizontal distributions of (A)
As suggested by Gong and Li (2021, 2023), the contribution of the anomalous pressure gradient force arises from an antisymmetric mode in the atmospheric convection. In our analysis, the anomalous pressure gradient force is equal in the two types of El Niño events (Figures 4C, 5C), although the SSTA and geopotential height anomalies are stronger in an SWS El Niño. This is attributed to the antisymmetric geopotential height anomaly patterns induced by different SSTA patterns in the two types of El Niño in the western Pacific during winter (Figure 7). In the case of an SWS El Niño, the antisymmetric positive SSTAs in the SH exhibit a zonal distribution between 15°S and 5°S, with the strongest SSTA located at 150°W (Figure 7A). Notably, these SSTA are located within a mean SST background exceeding 27 °C, a threshold known for deep atmospheric convection (Lau et al., 1997; Johnson and Xie, 2010; Xie et al., 2020). Consequently, anomalous stronger convection is generated at 150°W and extends along the 10°S–5°S belt (Figure 7B). The intensified convection anomalies further excite westward-propagating atmospheric Rossby waves, leading to a zonally uniform pattern in negative geopotential height anomalies over the SH tropical Pacific basin (Figure 7B).
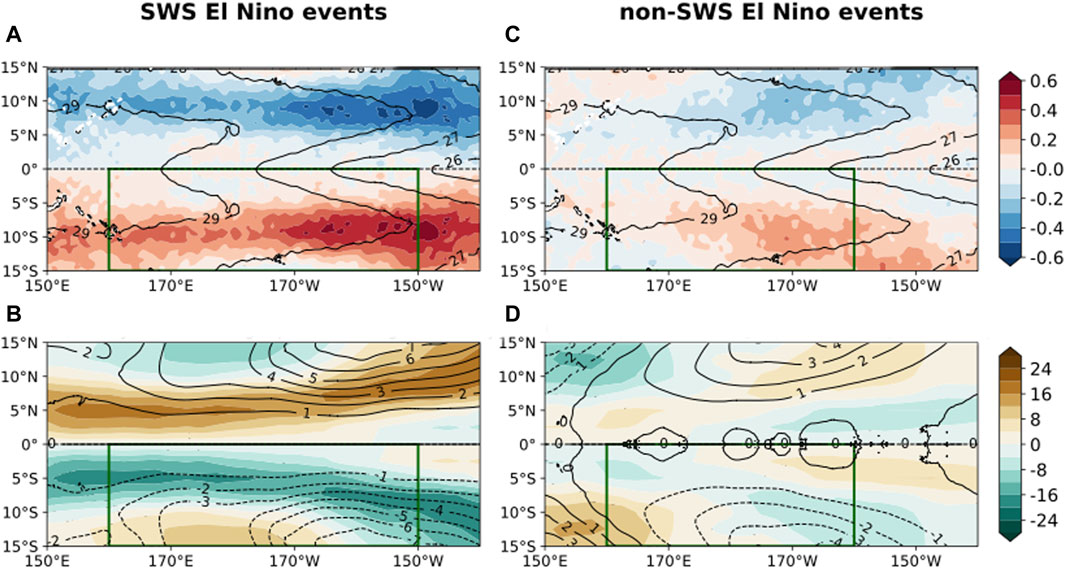
Figure 7. Composite distributions of (A) symmetric mean SST (contour, °C) and antisymmetric SST anomalies (SSTA; shading, °C), and (B) antisymmetric outgoing longwave radiation anomalies (OLRA; shading, W m−2) and antisymmetric geopotential height anomalies averaged over 1000–850 hPa (contour, gpm) for SWS El Niño events. (C, D) Similar to (A, B) for non-SWS El Niño events.
In contrast, the antisymmetric SSTA in the SH for the non-SWS El Niño events show a zonal dipole pattern, with a positive SSTA pole at 170°W and a weak negative pole around 160°E (Figure 7C). Compared to the patterns for the SWS El Niño, the SSTA center and the consequent convection center are more westward (Figure 7D). Therefore, Rossby waves are generated in a more westward location, resulting in negative geopotential height anomalies appearing at 170°W (Figure 7D). However, due to the presence of the weak negative SSTA west of 170°E in a background SST above 28°C, which has even larger convection-SST sensitivity than the 27 °C SST at 170°W (Figure 7C; Xie et al., 2020), convection is severely suppressed, and geopotential height is significantly increased through Rossby waves (Figure 7D). Despite the weaker underlying SSTA, this dipole pattern in the antisymmetric geopotential height anomalies in the SH creates a zonal gradient comparable to that in an SWS El Niño.
It is evident that the joint effects of antisymmetric advections
3.3 Varied El Niño terminations of SWS and non-SWS El Niño events
Previous studies have suggested that the SWS plays a role in the termination of El Niño (Harrison and Vecchi, 1999; Vecchi and Harrison, 2003; Spencer, 2004; Lengaigne et al., 2006; McGregor et al., 2012) through the oceanic processes as mentioned in Section 1. We notice that the different extents of SWSs in the two types of El Niños show varied termination patterns, as shown in Figure 8. To illustrate the oceanic response to different SWS intensities, the meridional Sverdrup transport is approximately estimated from the meridional shear of the low-level zonal wind anomalies through the following equation:
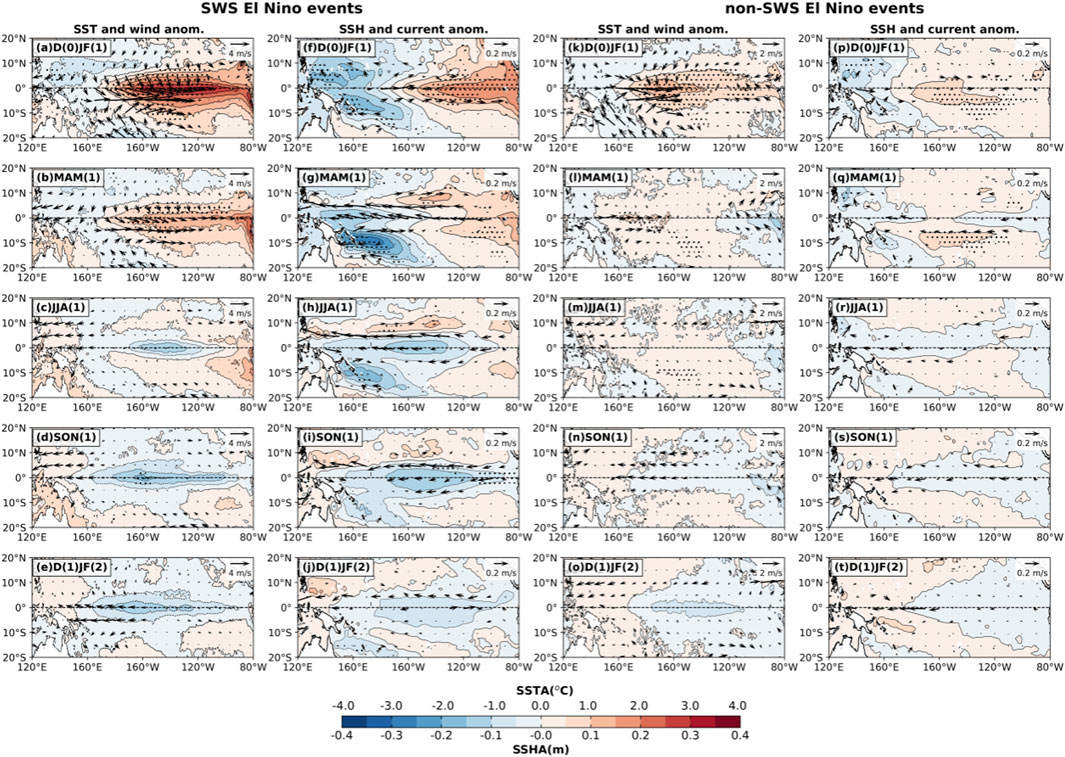
Figure 8. Seasonal evolution of ocean–atmospheric anomalies for SWS El Niño (A–J) and non-SWS El Niño (K–T) events in observation. In the first and third columns, the shading and gray contour denote SSTA (in °C), and vectors represent low-level wind anomalies (in m s−1) averaged over 1000–850 hPa. In the second and last columns, the shading and contour denote sea surface height anomalies (in m), and vectors represent sea current anomalies averaged over 0–50 m (in m s−1). The black dots and vectors indicate values exceeding the 95% confidence levels estimated from a Student’s t-test.
For the SWS El Niño events, the SSTA are strong in the equatorial central-to-eastern Pacific, accompanied by large westerly anomalies south of the equator and equator-ward convergent wind anomalies between 160°E and 120°W in boreal winter, when the local SST exceeds the 27 °C convection threshold (D0JF1, Figure 8A). As a consequence of the downwelling and convergent oceanic Kelvin waves excited by the prevailing westerly anomalies along the equator during the developing seasons, there are positive sea surface height anomalies (SSHA) in the eastern Pacific, and eastward sea current anomalies are observed along the equator (Figure 8F). However, the rapid decrease of equatorial westerly anomalies induced by the SWS results in an imbalance with the zonal gradient force of the SSHA along the equator. Therefore, such eastward sea current anomalies are relatively weak, attributed in part to the westward gradient force of the SSHA (Kug et al., 2009; Chen H.-C. et al., 2016) and partly to the westward sea current anomalies related to the reflected upwelling oceanic Kelvin waves from off-equatorial upwelling Rossby waves at the western boundary.
Those off-equatorial Rossby waves, initially triggered by strong equatorial westerly anomalies months earlier, project strong energy to the reflected Kevin waves. As a result, the westward sea current anomalies associated with reflected Kelvin waves are thus strong and act to reverse the equatorial zonal sea current anomalies (Figure 8G), thereby initiating El Niño decay (see Figure 8B). Meanwhile, the SWS also induces an asymmetric inter-hemispheric mass and heat content exchange through poleward Sverdrup transport, resulting in a larger transport towards the north from the equatorial central Pacific (Figures 8G, 9A), as discussed in the series studies of Mcgregor et al. (2012, 2013, 2014). The poleward mass transports in the central Pacific strengthen the gradient force of the westward zonal SSHA and intensify the equatorial westward sea current anomalies (Figure 8G), which further enhances the cool advection of cold water from the cold tongue (negative zonal advection feedback). Simultaneously, water mass loss in the equatorial central Pacific also shoals thermocline and accelerates oceanic upwelling, through which more subsurface cool water is pumped up to cool the sea surface (negative Ekman and thermocline feedback). The SSHA and sea current anomaly changes in the eastern Pacific are relatively weaker and slower than those in the central Pacific (Figures 8B,G), and the poleward Sverdrup transports show less inter-hemispheric asymmetry (Figure 9B). These oceanic responses to the SWS and the associated negative oceanic feedback are consistent with those revealed by Ren and Jin (2013) that the reversal of the equatorial sea current anomalies provides the initial negative feedback for El Niño phase transition.
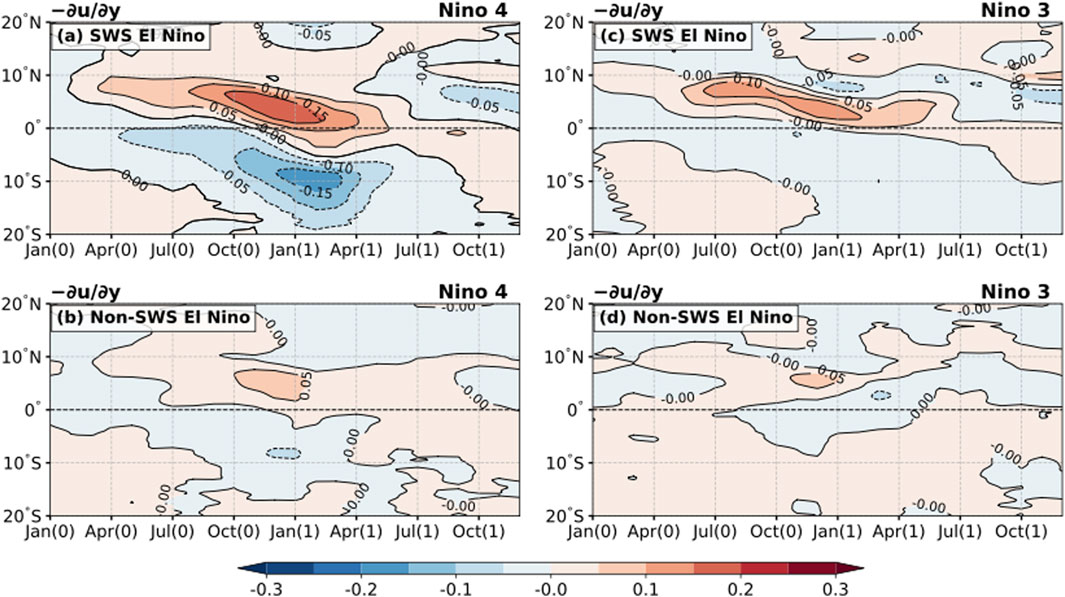
Figure 9. Latitude–time section of the meridional shear (in s−1) of the low-level zonal wind anomalies averaged in the Niño 4 (left panel) and Niño 3 (right panel) regions for (A, C) SWS and (B, D) non-SWS El Niño events in observation.
Attributed to these negative feedbacks, the SWS El Niño decays rapidly and transitions to La Niña in the equatorial central Pacific (Figures 8C–E). During the development of La Niña, easterly anomalies gradually strengthen over the central-to-western Pacific because the background high SST is high enough to support weak negative SSTA to generate convection and wind responses (Figures 8C,D). In turn, these easterly anomalies trigger westward sea current anomalies and upwelling oceanic Kelvin waves to further shoal the thermocline and enhance Ekman pumping. As a result, the westward advection of cool water from the cold tongue and upward pumping of subsurface cool water are strengthened to accelerate the development of La Niña. Eventually, the SWS El Niño decays into a central Pacific La Niña that has maximal SSTA around 160°W (Figure 8E). I
t is noteworthy that the negative SSHA are strongest in the boreal fall (SON1) rather than in the boreal winter (D1JF2) (Figures 8I,J). It is due to the propagation of the reflected downwelling Kelvin waves from the off-equatorial downwelling Rossby waves at the western boundary, which can weaken the negative SSHA by inducing surface water convergence.
The termination of a non-SWS El Niño differs from that of an SWS El Niño. In the mature phase (D0JF1), positive SSTA are centered in the equatorial central Pacific around 160°W, accompanied by westerly (easterly) anomalies to the west (east) side (Figure 8K). The anomalous convergent zonal winds along the equator result in maximal SSHA around 160°W (Figure 8P). Simultaneously, zonal sea current anomalies converge towards the SSHA maximum, with eastward (westward) currents along the western-to-central (eastern) equatorial Pacific (Figure 8P). The westward current anomalies can advect cool water from the cold tongue, which leads to the initial negative SSTA in the eastern Pacific and enhancement of these westward wind in the following spring (Figure 8I). Meanwhile, the SSHA pattern shows a discharge process wherein the equatorial positive SSHA weaken rapidly, and westward sea current anomalies occupy the entire equatorial Pacific (Figure 8Q,r). This indicates a weakening of the positive thermocline feedback and a strengthening of the negative zonal advection feedback. Consequently, the weak non-SWS El Niño undergoes a rapid decay, and La Niña gradually develops in the eastern Pacific (Figure 8M,n). During the phase transition of a non-SWS El Niño, the poleward Sverdrup transports are weaker and show less inter-hemispheric asymmetry in both the central and eastern Pacific (Figures 9B,D). Ultimately, the non-SWS El Niño turns into a weak La Niña, characterized by negative SSTA between 160°W and 120°W (Figure 8O), a slightly eastward location compared to the La Niña developed from a SWS El Niño (c.f. Figures 8E,O).
Comparing the terminations of the SWS and non-SWS El Niño events highlights the role of the SWS in driving oceanic responses responsible for the decaying of positive SSTA. The strong SWS El Niño experiences a rapid termination that initially occurs in the equatorial central Pacific, where there are meridionally asymmetric poleward Sverdrup transports and a reversal of the zonal sea current anomalies. Ultimately, it evolves into a strong La Niña that can be classified as the CP type. In contrast, the non-SWS El Niño, lacking an intense SWS, undergoes its initial decay in the equatorial eastern Pacific by the cool advection from the cold tongue carried by the eastward sea current anomalies. Concurrently, the poleward Sverdrup transport is less asymmetric about the equator. Our result, in particular the SWS El Niño case, is consistent with the findings in McGregor et al. (2013), which emphasizes the prominent role of the SWS in establishing the meridional asymmetry in the discharge of heat content and mass into the northern hemisphere during El Niño termination.
3.4 Model validation
In this section, we use the 1880-year output of pre-industrial control run from the UKESM1-0-LL model to demonstrate the dependence of the SWS on El Niño intensity and compare the different El Niño terminations with and without the presence of the SWS. As reported by Dieppois et al. (2021), this model can reproduce a reasonable diversity in El Niño intensity and spatial pattern, making it a qualified candidate to reveal the dependence of the SWS phenomenon on El Niño intensity and the associated different El Niño termination patterns. This analysis aims to mitigate the uncertainty arising from the limited El Niño cases in the set of observations.
In total, 334 El Niño events are identified based on the wintertime (D0JF1) Niño 3.4 index exceeding one standard deviation. The associated low-level wind anomalies in D0JF1 and the following MAM1 are displayed in Figure 10. The westerly anomalies in the central equatorial Pacific in D0JF1 show an SWS pattern, with the strongest westerly anomalies located near 5°S (Figures 10A,B). The SWS pattern persists in MAM1, but the westerly anomalies weaken as El Niño decays (Figures 10C,D). These wind patterns suggest that this model can reasonably reproduce an SWS.
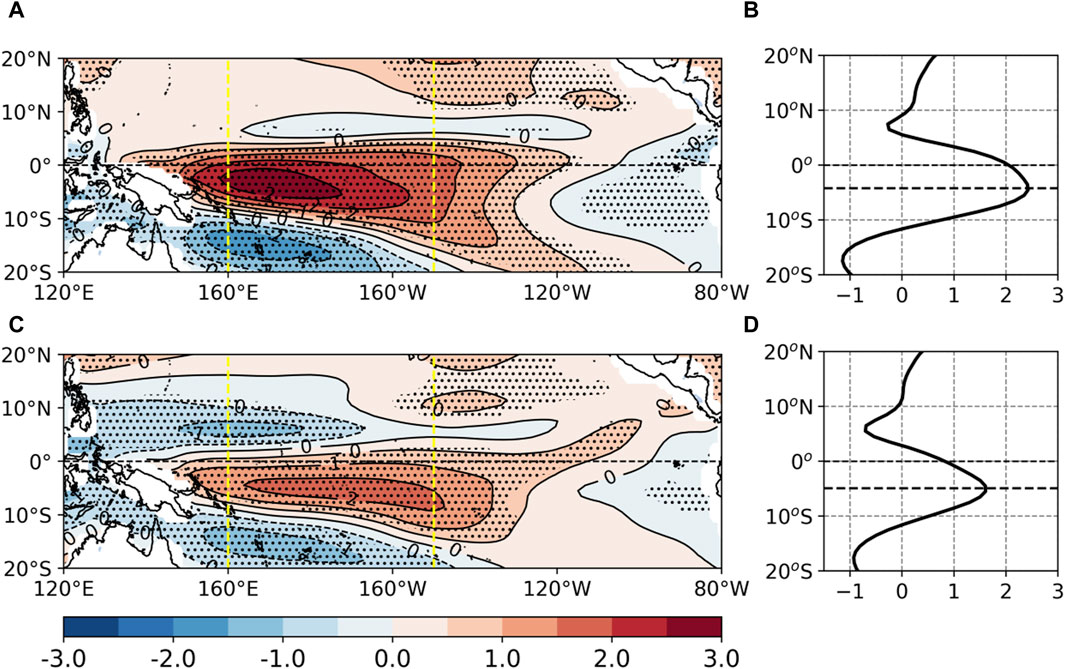
Figure 10. Seasonal distributions of low-level zonal wind anomalies (shading; m s−1) composited in all El Niño events from UKESM1-0-LL averaged in (A) boreal winter (D0JF1) and (C) spring (MAM1). (B,D) The corresponding meridional profiles of zonal wind anomalies averaged between 160°E and 150°W for the two seasons. Black dots in the left panel denote values exceeding the 95% confidence levels estimated from a Student’s t-test.
To obtain the SWS El Niño and non-SWS El Niño events, a similar MV-EOF analysis is applied to the low-level zonal wind anomalies, and PC1 and PC2 are used to categorize El Niño events into two types, as done to the observational winds. It is shown that the SWS El Niño events are strong, and the non-SWS El Niño events are weak, as seen in the mature SSTA amplitude (Figure 11). However, both types share similar SSTA patterns, featured by the strongest positive SSTA located between 160°E and 120°W (Figures 11A,C). It is surprising that the weak westerly anomalies during the non-SWS El Niño mature phases also extend south of 5°S (Fig. d). However, the meridional distribution of these westerly anomalies is considerably flatter than the distribution of an SWS El Niño (Figures 11B,D). This implies a weaker wind stress curl and poleward Sverdrup transports near the equator, as can be seen in Figure 13.
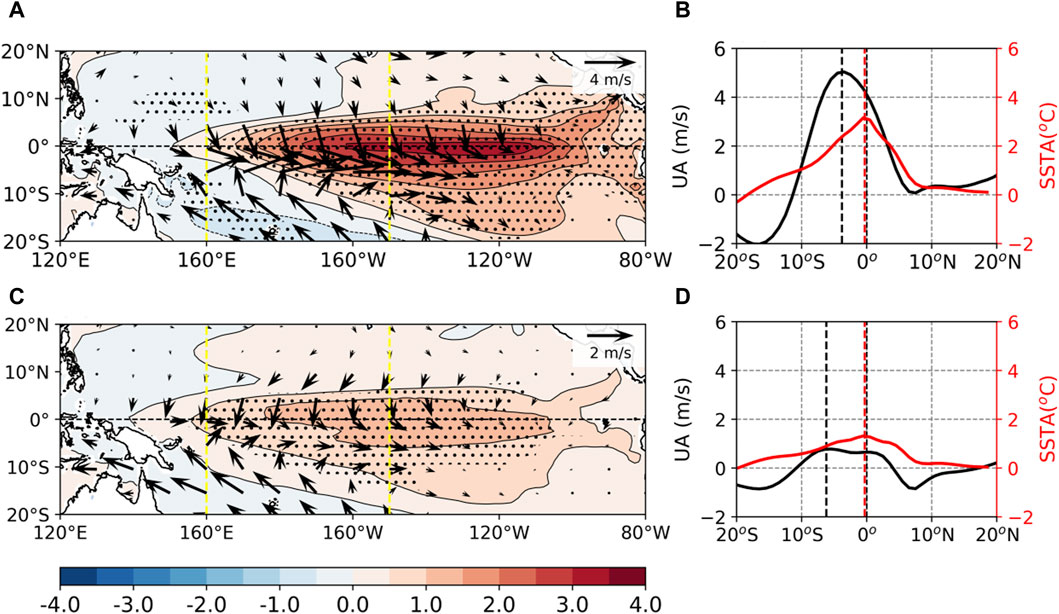
Figure 11. Composites of SSTA (shading; °C) and low-level wind anomalies (vector; m s−1) for (A) SWS El Niño and (C) non-SWS El Niño events during boreal winter (D0JF1) in UKESM1-0-LL. (B,D) The meridional distributions of SSTA (red contour) averaged between 170°W and 120°W, and westerly anomalies (black contour) averaged between 160°E and 150°W for the two El Niño events. Black dots in (A,C) denote values exceeding the 95% confidence levels estimated from a Student’s t-test.
Due to the varied meridional profiles of westerly anomalies over the central Pacific, SWS El Niño and non-SWS El Niño events show different termination patterns (Figure 12). The termination pattern of each El Niño type closely resembles that of the corresponding one in the observation. An SWS El Niño decays initially near the equatorial central Pacific (Figures 12B,C), while a non-SWS El Niño terminates from the equatorial far eastern Pacific (Figures 12L,M). The non-SWS El Niño occurs initially in MAM1, which is earlier than that of the SWS El Niño. Furthermore, the subsequent La Niña event following a SWS El Niño is stronger than the one following a non-SWS El Niño (Figure 12E,o).
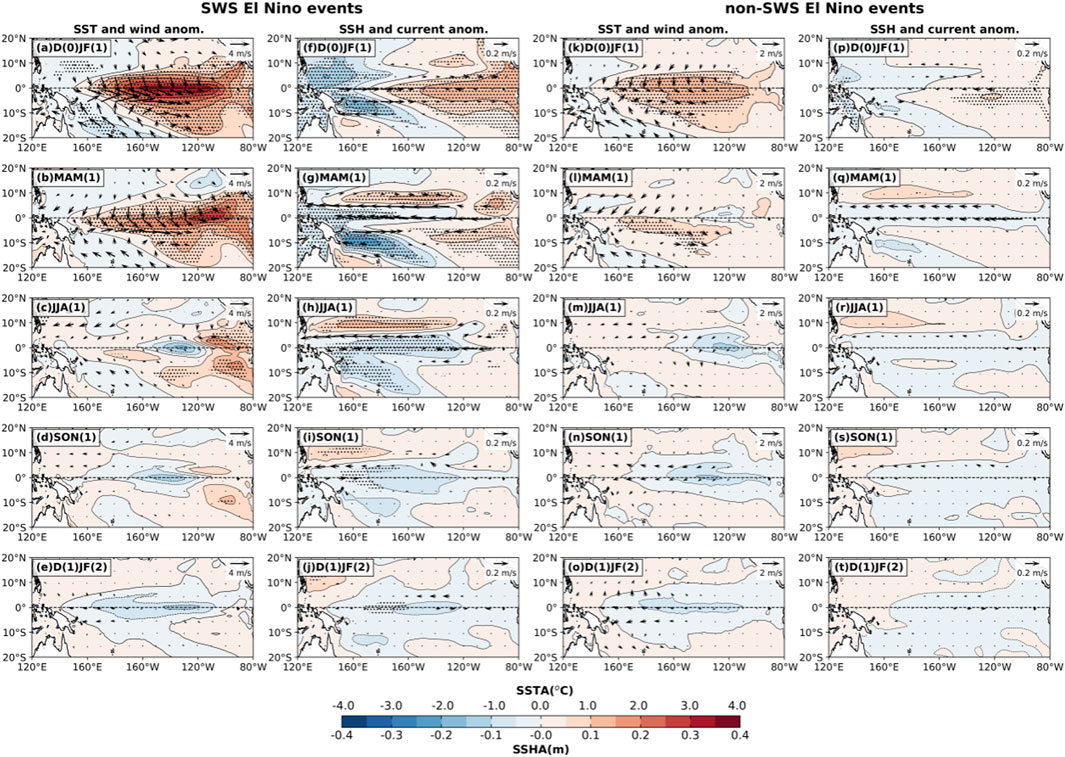
Figure 12. The same as Figure 8 for SWS El Niño (A–J) and non-SWS El Niño (K–T) events in UKESM1-0-LL.
The distinct El Niño termination patterns can be attributed to different locations and a reverse tendency of thermocline depth/SSH and surface current anomalies in the post-mature seasons (Figure 12G,q). For the SWS El Niño, strong westerly anomalies result in overall strong poleward Sverdrup transports in the central Pacific that become significantly asymmetric after January of the decaying year when an intense SWS occurs (Figure 12A). This leads to a strengthened northward mass and heat content transports into the north hemisphere. However, in the eastern Pacific, such Sverdrup transports are weaker and keep northwards (southwards) in the northern (southern) hemisphere (Figure 13C). As a consequence, positive SSHA decrease rapidly in the central Pacific but slowly in the eastern Pacific (Figure 12G), resulting in a rapid reversal of zonal gradient force and sea current anomalies. Consequently, thermocline and zonal advective feedback becomes negative, which contributes to the rapid termination of the SWS El Niño in the equatorial central Pacific.
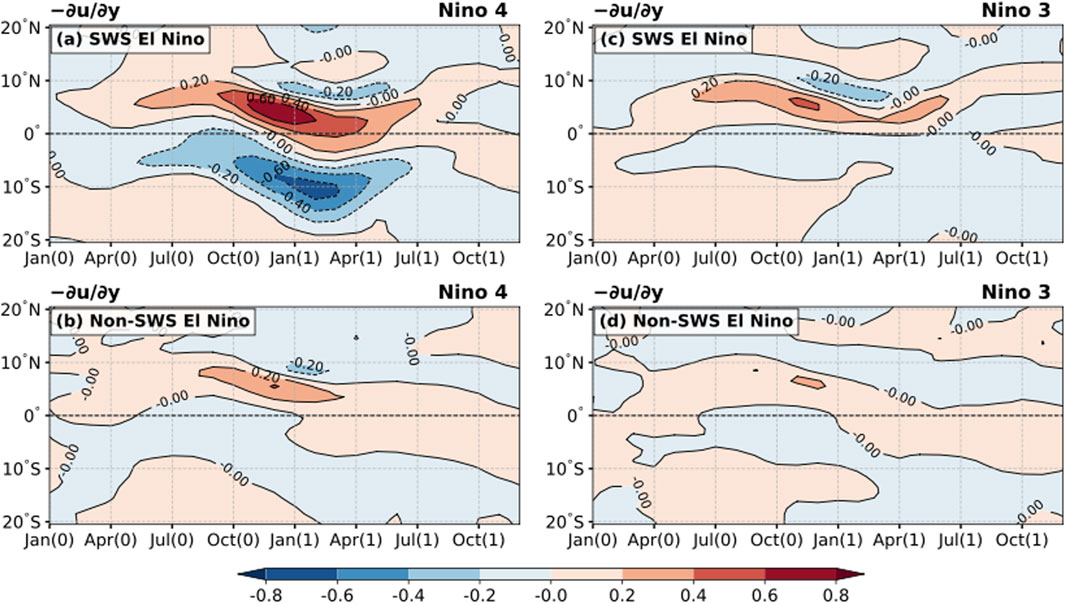
Figure 13. The same as Figure 9 for SWS El Niño (A,C) and non-SWS El Niño (B,D) events in UKESM1-0-LL.
For the non-SWS El Niño, weak westward sea current anomalies manifest in the eastern Pacific during D0JF1 (Figure 12P), which initiates the westward advection of cool water to terminate El Niño. The poleward Sverdrup transports take place simultaneously in the equatorial central and eastern Pacific in the post-mature seasons (Figures 13B,D), which induces basin-wide poleward mass transports. As a result, basin-wide negative SSHA are established in MAM1, accompanied by a broad extension of westward sea current along the equator (Figure 13Q). Such processes can enhance the decay of El Niño and the development of La Niña by strengthening negative thermocline and zonal advective feedback. In summary, the termination patterns of the two types of El Niño events in the UKESM1-0-LL model support our findings in the observation that varying extents of an SWS can trigger distinct forms of El Niño termination.
4 Conclusion and discussion
Previous studies have indicated that the maximal low-level westerly anomalies over the equatorial central Pacific locate south of the equator during the mature (D0JF1) and decaying (MAM1) seasons of an El Niño event (Vecchi and Harrison, 2003; Spencer, 2004; Lengaigne et al., 2006; McGregor et al., 2012; 2013; 2014; Zhang et al., 2015; Abellán and McGregor, 2016; Gong and Li, 2021). These studies have also proposed a correlation between the southward westerly shift (SWS) and the El Niño spatial pattern. Specifically, they suggested that an eastern Pacific (EP) El Niño shows a noticeable SWS, whereas a central Pacific (CP) El Niño does not. However, our current study establishes a dependence of the SWS on El Niño intensity during the mature phase.
The occurrence of the SWS is a result of the combined contribution of a meridionally quasi-symmetric westerly mode that develops concurrently with El Niño and peaks during El Niño mature winter (ND0JF1), and a southward shifted westerly mode that grows after October and peaks in the post-mature early spring (JFMA1). Consequently, El Niño events can be categorized into two types, SWS El Niño and non-SWS El Niño, based on the presence or absence of the remarkable SWS phenomena in the early spring season (JFMA1). An SWS El Niño is featured by maximal westerly anomalies extending south of 5°S in JFMA1 and has strong mature SSTA. On the other hand, a non-SWS El Niño is characterized by maximal westerly anomalies near 3°S during JFMA1 and exhibits weaker mature SSTA. Notably, both types of El Niño include individual events that were categorized as EP or CP flavor in earlier studies.
The development of the southward-shifted westerly mode can gradually collapse the quasi-symmetric wind mode, resulting in an antisymmetric wind pattern in the anomalous zonal wind, characterized by westerly anomalies south of the equator and easterly anomalies north of the equator. An antisymmetric zonal momentum budget diagnosis, similar to the approach employed by Gong and Li (2021, 2023), was applied to understand the mechanisms behind the growth of westerly anomalies south of the equator. The results indicate that the SWS is triggered by the advection of symmetric westerly anomalies by an antisymmetric climatological northerly in winter (Figures 6D,F), the advection of symmetric climatological zonal wind triggered by symmetric westerly anomalies (Figures 6B,C), and the antisymmetric zonal pressure gradient force, in which the first term contributes the most. The first and last terms are closely related to the southward shift of high SST exceeding 27°C in winter, which drives the mean cross-equator northerly and allows the El Niño SSTA south of the equator to generate stronger convection. However, the zonal distribution of antisymmetric SSTA south of the equator in the non-SWS El Niño shows a dipole pattern, unlike the zonally uniform pattern in the SWS El Niño, which consequently induces a comparable zonal pressure gradient force as those in the SWS El Niño case. For the non-SWS El Niño, the antisymmetric westerly anomalies and related advection terms are half as strong as those in an SWS El Niño, thereby leading to weaker growth in the anomalous westerly south of the equator. Therefore, the SWS depends on El Niño intensity.
With different extents of SWS, the two types of El Niño exhibit distinct termination patterns. An SWS El Niño decays initially in the equatorial central Pacific, while a non-SWS El Niño decays first in the far eastern Pacific (Figure 8). The key factors contributing to these differences lie in the locations where poleward Sverdrup transports take place and the initial westward sea current anomalies occur. An SWS El Niño exhibits strong poleward mass and heat content transports in the equatorial central Pacific in MAM1. This results in a strong discharge of local mass and heat content and further generates reversed zonal SSH gradient forces that drive westward sea current anomalies. Therefore, both thermocline and zonal advective feedbacks turn negative first in the equatorial central Pacific in MAM1, which initiates La Niña in JJA1.
In contrast, in the mature phase of a non-SWS El Niño, westward sea current anomalies appear in the far equatorial eastern Pacific, inducing initial El Niño termination and La Niña development by advecting cool water westwards. Meanwhile, the weak poleward mass and heat content transports induced by a weak SWS enhance the decaying of central Pacific SSTA by discharging local heat content. Furthermore, the analysis of many El Niño samples from the simulation in UKESM1-0-LL supports our findings in observation. Model results indicate a dependence of the extent of the SWS on El Niño intensity, and the resulting variations in El Niño termination patterns are related to different extents of the SWS.
Nevertheless, our findings do not deny the relationship between the extent of the SWS and the El Niño spatial pattern. From the perspective of convection and wind responses over the central Pacific, strong El Niño events are of the EP type, while weaker El Niño events are of a mixed type or a CP type (Okumura, 2019; Xie et al., 2020). Therefore, the momentum advection of larger westerly anomalies by the climatological northerly in strong EP El Niño events can lead to a greater growth in the westerly anomalies south of the equator, which manifests as an evident SWS.
In addition, this study focuses only on the role of internal variability of the air–sea interaction in producing an SWS during El Niño peak and decaying phases. External forces, such as volcanic eruptions, will lead to diverse SST and convection responses in the tropical Pacific (e.g., Liu et al., 2018; 2022), thereby influencing the extent of the SWS. Tropical volcanic eruptions will produce SST cooling and convection suppression in the tropical central Pacific in winter (Liu et al., 2022) that do not favor the emergence of a strong El Niño and an evident SWS. Volcanic eruptions in the northern hemisphere lead to reduced (enhanced) convection north (south) of the equator over the tropical central Pacific in winter, resulting in a more evident SWS. In contrast, volcanic eruptions in the southern hemisphere lead to an opposite convection response in winter and hence weaken the SWS. However, estimations of the ENSO–volcano link report diverse results depending on the research methods used (Dogar et al., 2023). Assessing the response of the SWS to external forcing would be an interesting research topic.
Data availability statement
The original contributions presented in the study are included in the article/Supplementary Material; further inquiries can be directed to the corresponding author.
Author contributions
YJ: data curation, software, visualization, writing–original draft, formal analysis, and investigation. RX: conceptualization, funding acquisition, investigation, methodology, project administration, resources, supervision, writing–original draft, writing–review and editing, and formal analysis.
Funding
The author(s) declare that financial support was received for the research, authorship, and/or publication of this article. This study was jointly supported by the National Natural Science Foundation of China (41976015), CAS(XDB42010000), and the Initial Funds of Young Talents in Ocean University of China.
Conflict of interest
The authors declare that the research was conducted in the absence of any commercial or financial relationships that could be construed as a potential conflict of interest.
The reviewer LC declared a shared affiliation with the author RX to the handling editor at the time of review.
Publisher’s note
All claims expressed in this article are solely those of the authors and do not necessarily represent those of their affiliated organizations, or those of the publisher, the editors, and the reviewers. Any product that may be evaluated in this article, or claim that may be made by its manufacturer, is not guaranteed or endorsed by the publisher.
References
Abellán, E., and McGregor, S. (2016). The role of the southward wind shift in both, the seasonal synchronization and duration of ENSO events. Clim. Dyn. 47, 509–527. doi:10.1007/s00382-015-2853-1
An, S., and Jin, F.-F. (2004). Nonlinearity and asymmetry of ENSO. J. Clim. 17 (12), 2399–2412. doi:10.1175/1520-0442(2004)017<2399:NAAOE>2.0.CO;2
An, S. I., and Wang, B. (2001). Mechanisms of locking of the El Niño and La Niña mature phases to boreal winter. J. Clim. 14 (9), 2164–2176. doi:10.1175/1520-0442(2001)014<2164:molote>2.0.co;2
Battisti, D., Vimont, D. E., and Kirtman, B. P. (2019). 100 years of progress in understanding the dynamics of coupled atmosphere–ocean variability. Meteorol. Monogr. 59, 8.1–8.57. doi:10.1175/AMSMONOGRAPHS-D-18-0025.1
Bayr, T., Drews, A., Latif, M., and Lübbecke, J. (2021). The interplay of thermodynamics and ocean dynamics during ENSO growth phase. Clim. Dyn. 56, 1681–1697. doi:10.1007/s00382-020-05552-4
Bjerknes, J. (1969). Atmospheric teleconnections from the equatorial Pacific. Mon. Weather Rev. 97 (3), 163–172. doi:10.1175/1520-0493(1969)097<0163:atftep>2.3.co;2
Burgers, G., and Stephenson, D. B. (1999). The “normality” of El Niño. Geophys. Res. Lett. 26 (8), 1027–1030. doi:10.1029/1999gl900161
Chen, H.-C., Hu, Z.-Z., Huang, B., and Sui, C.-H. (2016a). The role of reversed equatorial zonal transport in terminating an ENSO event. J. Clim. 29 (16), 5859–5877. doi:10.1175/JCLI-D-16-0047.1
Chen, H. C., and Jin, F.-F. (2020). Fundamental behavior of ENSO phase locking. J. Clim. 33, 1953–1968. doi:10.1175/JCLI-D-19-0264.1
Chen, L., Li, T., Behera, S. K., and Doi, T. (2016b). Distinctive precursory air-sea signals between regular and super El Niños. Adv. Atmos. Sci. 33 (8), 996–1004. doi:10.1007/s00376-016-5250-8
Chen, M., and Li, T. (2021). ENSO evolution asymmetry: EP versus CP El Niño. Clim. Dyn. 56, 3569–3579. doi:10.1007/s00382-021-05654-7
Chen, X., and Wallace, J. M. (2015). ENSO-like variability: 1900–2013. J. Clim. 28 (24), 9623–9641. doi:10.1175/JCLI-D-15-0322.1
Choi, K. Y., Vecchi, G. A., and Wittenberg, A. T. (2013). ENSO transition, duration, and amplitude asymmetries: role of the nonlinear wind stress coupling in a conceptual model. J. Clim. 26 (23), 9462–9476. doi:10.1175/JCLI-D-13-00045.1
Clarke, A. J., Van Gorder, S., and Colantuono, G. (2007). Wind stress curl and ENSO discharge/recharge in the equatorial pacific. J. Phys. Oceanogr. 37 (4), 1077–1091. doi:10.1175/JPO3035.1
Copernicus Climate Change Service, Climate Data Store (2021). ORAS5 global ocean reanalysis monthly data from 1958 to present. Copernic. Clim. Change Serv. (C3S) Clim. Data Store (CDS). doi:10.24381/cds.67e8eeb7
Deser, C., and Wallace, J. M. (1987). El Niño events and their relation to the southern oscillation: 1925–1986. J. Geophys. Res. 92 (C13), 14189–14196. doi:10.1029/JC092iC13p14189
Dieppois, B., Capotondi, A., Pohl, B., Chun, K. P., Monerie, P. A., and Eden, J. (2021). ENSO diversity shows robust decadal variations that must be captured for accurate future projections. Commun. Earth Environ. 2 (1), 212. doi:10.1038/s43247-021-00285-6
Dogar, M. M., Hermanson, L., Scaife, A. A., Visioni, D., Zhao, M., Hoteit, I., et al. (2023). A review of El Niño Southern Oscillation linkage to strong volcanic eruptions and post-volcanic winter warming. Earth. Syst. Environ. 7, 15–42. doi:10.1007/s41748-022-00331-z
Dommenget, D., Bayr, T., and Frauen, C. (2013). Analysis of the non-linearity in the pattern and time evolution of El Niño southern oscillation. Clim. Dyn. 40, 2825–2847. doi:10.1007/s00382-012-1475-0
Dommenget, D., and Yu, Y. (2016). The seasonally changing cloud feedbacks contribution to the ENSO seasonal phase-locking. Clim. Dyn. 47, 3661–3672. doi:10.1007/s00382-016-3034-6
Gong, Y., and Li, T. (2021). Mechanism for southward shift of zonal wind anomalies during the mature phase of ENSO. J. Clim. 34 (22), 1–45. doi:10.1175/JCLI-D-21-0078.1
Gong, Y., and Li, T. (2023). Comparison of southward shift mechanisms of equatorial westerly anomalies between EP and CP El Niño. Clim. Dyn. 60, 785–796. doi:10.1007/s00382-022-06346-6
Harrison, D. E. (1987). Monthly mean island surface winds in the central tropical Pacific and El Niño events. Mon. Weather Rev. 115 (12), 3133–3145. doi:10.1175/1520-0493(1987)115<3133:MMISWI>2.0.CO;2
Harrison, D. E., and Vecchi, G. A. (1999). On the termination of El Niño. Geophys. Res. Lett. 26 (11), 1593–1596. doi:10.1029/1999GL900316
Hersbach, H., Bell, B., Berrisford, P., Biavati, G., Horányi, A., Muñoz Sabater, J., et al. (2023a). ERA5 monthly averaged data on pressure levels from 1940 to present. Copernic. Clim. Change Serv. (C3S) Clim. Data Store (CDS). doi:10.24381/cds.6860a573
Hersbach, H., Bell, B., Berrisford, P., Biavati, G., Horányi, A., Muñoz Sabater, J., et al. (2023b). ERA5 monthly averaged data on single levels from 1940 to present. Copernic. Clim. Change Serv. (C3S) Clim. Data Store (CDS). doi:10.24381/cds.f17050d7
Hoerling, M. P., Kumar, A., and Zhong, M. (1997). El Niño, La Niña, and the nonlinearity of their teleconnections. J. Clim. 10 (8), 1769–1786. doi:10.1175/1520-0442(1997)010<1769:ENOLNA>2.0.CO;2
Hu, Z.-Z., Kumar, A., Xue, Y., and Jha, B. (2014). Why were some La Niñas followed by another La Niña? Clim. Dyn. 42 (3), 1029–1042. doi:10.1007/s00382-013-1917-3
Jin, F.-F., Chen, H.-C., Zhao, S., Hayashi, M., Karamperidou, C., Stuecker, M. F., et al. (2020). “Simple ENSO models,” in El Niño southern oscillation in a changing climate. Editor M. J. McPhaden, A. Santoso, and W. Cai (Hoboken, NJ: American Geophysical Union Geophysical Monograph Series) 253, 119–151. doi:10.1002/9781119548164.ch6
Johnson, N. C., and Xie, S.-P. (2010). Changes in the sea surface temperature threshold for tropical convection. Nat. Geosci. 3, 842–845. doi:10.1038/ngeo1008
Kim, H.-M., Webster, P. J., and Curry, J. A. (2009). Impact of shifting patterns of Pacific Ocean warming on North Atlantic tropical cyclones. Sci. 325, 77–80. doi:10.1126/science.1174062
Kug, J.-S., Jin, F.-F., and An, S.-I. (2009). Two types of El Niño events: cold tongue El Niño and warm pool El Niño. J. Clim. 22, 1499–1515. doi:10.1175/2008JCLI2624.1
Kug, J.-S., Kang, I.-S., and An, S.-I. (2003). Symmetric and antisymmetric mass exchanges between the equatorial and off-equatorial Pacific associated with ENSO. J. Geophys. Res. 108 (C8), 3284. doi:10.1029/2002JC001671
Larkin, N. K., and Harrison, D. E. (2002). ENSO warm (El Niño) and cold (La Niña) event life cycles: ocean surface anomaly patterns, their symmetries, asymmetries, and implications. J. Clim. 15 (10), 1118–1140. doi:10.1175/1520-0442(2002)015<1118:EWENOA>2.0.CO;2
Lau, K. M., Wu, H. T., and Bony, S. (1997). The role of large-scale atmospheric circulation in the relationship between tropical convection and sea surface temperature. J. Clim. 10 (3), 381–392. doi:10.1175/1520-0442(1997)010<0381:TROLSA>2.0.CO;2
Lee, T., and McPhaden, M. J. (2010). Increasing intensity of El Niño in the central-equatorial pacific. Geophys. Res. Lett. 37, L14603. doi:10.1029/2010GL044007
Lengaigne, M., Boulanger, J. P., Menkes, C., and Spencer, H. (2006). Influence of the seasonal cycle on the termination of El Niño events in a coupled general circulation model. J. Clim. 19 (9), 1850–1868. doi:10.1175/JCLI3706.1
Li, T. (1997). Phase transition of the El Niño-Southern oscillation: a stationary SST mode. J. Atmos. Sci. 54 (24), 2872–2887. doi:10.1175/1520-0469(1997)054<2872:PTOTEN>2.0.CO;2
Li, T., and Hsu, P.-C. (2018). “Dynamics of El niño–southern oscillation,” in Fundamentals of tropical climate dynamics (Cham, Germany: Springer Atmospheric Sciences. Springer). doi:10.1007/978-3-319-59597-9_5
Li, X., Li, C., Ling, J., and Tan, Y. (2015). The relationship between contiguous El Niño and La Niña revealed by self-organizing maps. J. Clim. 28 (20), 8118–8134. doi:10.1175/JCLI-D-15-0123.1
Liu, F., Gao, C., Chai, J., Robock, A., Wang, B., Li, J., et al. (2022). Tropical volcanism enhanced the east asian summer monsoon during the last millennium. Nat. Comm. 13, 3429. doi:10.1038/s41467-022-31108-7
Liu, F., Li, J., Wang, B., Liu, J., Li, T., Huang, G., et al. (2018). Divergent El Niño responses to volcanic eruptions at different latitudes over the past millennium. Clim. Dyn. 50, 3799–3812. doi:10.1007/s00382-017-3846-z
McGregor, S., Ramesh, N., Spence, P., England, M. H., McPhaden, M. J., and Santoso, A. (2013). Meridional movement of wind anomalies during ENSO events and their role in event termination. Geophys. Res. Lett. 40 (4), 749–754. doi:10.1002/grl.50136
McGregor, S., Spence, P., Schwarzkopf, F. U., England, M. H., Santoso, A., Kessler, W. S., et al. (2014). ENSO-driven interhemispheric Pacific mass transports. J. Geophys. Res. Oceans 119, 6221–6237. doi:10.1002/2014JC010286
McGregor, S., Timmermann, A., Schneider, N., Stuecker, M. F., and England, M. H. (2012). The effect of the South pacific convergence Zone on the termination of El Niño events and the meridional asymmetry of ENSO. J. Clim. 25 (16), 5566–5586. doi:10.1175/JCLI-D-11-00332.1
McPhaden, M. J., Zhang, X., Hendon, H. H., and Wheeler, M. C. (2006). Large-scale dynamics and MJO forcing of ENSO variability. Geophys. Res. Lett. 33 (16), 627–642. doi:10.1029/2006GL026786
Meinshausen, M., Vogel, E., Nauels, A., Lorbacher, K., Meinshausen, N., Etheridge, D. M., et al. (2017). Historical greenhouse gas concentrations for climate modelling (CMIP6). Geosci. Model. Dev. 10, 2057–2116. doi:10.5194/gmd-10-2057-2017
Okumura, Y. M. (2019). ENSO diversity from an atmospheric perspective. Curr. Clim. Chang. Rep. 5 (3), 245–257. doi:10.1007/s40641-019-00138-7
Rasmusson, E. M., and Carpenter, T. H. (1982). Variations in tropical Sea Surface temperature and surface wind fields associated with the southern oscillation/el Niño. Mon. Weather Rev. 110, 354–384. doi:10.1175/1520-0493(1982)110<0354:VITSST>2.0.CO;2
Ren, H., and Jin, F. (2013). Recharge oscillator mechanisms in two types of ENSO. J. Clim. 26 (17), 6506–6523. doi:10.1175/JCLI-D-12-00601.1
Ren, H. L., Lu, B., Wan, J., Tian, B., and Zhang, P. (2018). Identification standard for ENSO events and its application to climate monitoring and prediction in China. J. Meteorol. Res. 32 (6), 923–936. doi:10.1007/s13351-018-8078-6
Ropelewski, C. F., and Halpert, M. S. (1987). Global and regional scale precipitation patterns associated with the El niño/southern oscillation. Mon. Weather Rev. 115 (8), 1606–1626. doi:10.1175/1520-0493(1987)115<1606:GARSPP>2.0.CO;2
Spencer, H. (2004). Role of the atmosphere in seasonal phase locking of El Niño. Geophys. Res. Lett. 31, L24104. doi:10.1029/2004GL021619
Stein, K., Schneider, N., Timmermann, A., and Jin, F.-F. (2010). Seasonal synchronization of ENSO events in a linear stochastic model. J. Clim. 23 (21), 5629–5643. doi:10.1175/2010JCLI3292.1
Stuecker, M. F., Timmermann, A., Jin, F.-F., McGregor, S., and Ren, H. L. (2013). A combination mode of the annual cycle and the El Niño/Southern Oscillation. Nat. Geosci. 6 (7), 540–544. doi:10.1038/ngeo1826
Trenberth, K. E., and Caron, J. M. (2000). The Southern Oscillation revisited: sea level pressures, surface temperatures, and precipitation. J. Clim. 13, 4358–4365. doi:10.1175/1520-0442(2000)013,4358:TSORSL.2.0.CO;2
Vecchi, G. A., and Harrison, D. E. (2003). On the termination of the 2002–03 El Niño event. Geophys. Res. Lett. 30, 1964. doi:10.1029/2003GL017564
Wallace, J. M., Rasmusson, E. M., Mitchell, T. P., Kousky, V. E., Sarachik, E. S., and Storch, H. V. (1998). On the structure and evolution of ENSO-related climate variability in the tropical Pacific: lessons from TOGA. J. Geophys. Res. 103 (C7), 14241–14259. doi:10.1029/97JC02905
Wang, J., and Wang, C. (2021). Joint boost to super El Niño from the Indian and atlantic oceans. J. Clim. 34, 4937–4954. doi:10.1175/JCLI-D-20-0710.1
Wang, R., and Ren, H.-L. (2020). Understanding key roles of two ENSO modes in spatiotemporal diversity of ENSO. J. Clim. 33 (15), 6453–6469. doi:10.1175/JCLI-D-19-0770.1
Xie, R., Mu, M., and Fang, X. (2020). New indices for better understanding ENSO by incorporating convection sensitivity to sea surface temperature. J. Clim. 33 (16), 7045–7061. doi:10.1175/JCLI-D-19-0239.1
Keywords: El Niño intensity, southward westerly shift, equatorial central pacific, zonal momentum advection, El Niño termination, Sverdrup transports
Citation: Jia Y and Xie R (2024) Examining the dependence of southward shift of westerly anomalies on El Niño intensity: implications for varied El Niño termination patterns. Front. Earth Sci. 12:1372616. doi: 10.3389/feart.2024.1372616
Received: 18 January 2024; Accepted: 17 April 2024;
Published: 21 May 2024.
Edited by:
Zhiyuan Hu, Sun Yat-sen University, ChinaReviewed by:
Fei Liu, Sun Yat-sen University, ChinaLin Chen, Nanjing University of Information Science and Technology, China
Copyright © 2024 Jia and Xie. This is an open-access article distributed under the terms of the Creative Commons Attribution License (CC BY). The use, distribution or reproduction in other forums is permitted, provided the original author(s) and the copyright owner(s) are credited and that the original publication in this journal is cited, in accordance with accepted academic practice. No use, distribution or reproduction is permitted which does not comply with these terms.
*Correspondence: Ruihuang Xie, eGllcnVpaHVhbmdAb3VjLmVkdS5jbg==