 Beatriz Gill-Olivas
 Jon Telling
 Martyn Tranter
95% of researchers rate our articles as excellent or good
Learn more about the work of our research integrity team to safeguard the quality of each article we publish.
Find out more
ORIGINAL RESEARCH article
Front. Earth Sci. , 05 July 2024
Sec. Biogeoscience
Volume 12 - 2024 | https://doi.org/10.3389/feart.2024.1371128
The role of subglacial abrasion in sustaining subglacial microbiomes is an area of growing interest. It is likely that subglacial abrasion produces a range of bio-utilisable compounds, some released from fluid inclusions in the confines of the mineral matrix and some produced via the surface free radicals that crushing produces in a variety of different minerals. As yet, the geochemical reactions which are initiated by abrasion remain poorly understood. This is largely because of the multiple potential sources and sinks of free radicals that occur in even the most simple of multi-mineralic system during crushing and subsequent wetting of the mixture. We illustrate this assertion by conducting a series of laboratory experiments where common, “simple” silicate minerals, such as quartz and feldspar, are abraded and incubated with ultra-pure water. Gaseous reaction products included CH4, H2 and CO2. The concentrations of major ions (including Na+, K+, Mg2+, and Ca2+), dissolved silicate, dissolved iron and pH of the solution during incubation are reported. These results were used to calculate HCO3− in solution and the saturation index with respect to various minerals using PHREEQCi. We found that abrasion of silicates produces bio-available gases and has the potential to increase the concentration of various weathering products in solution. Further, we found that even trace amounts of carbonates, an impurity in many natural rocks and minerals, may significantly affect the reaction products, making it challenging to concretize the reactions taking place. These results highlight the importance of conducting abrasion experiments utilising natural samples to better understand how apparently negligeable changes in mineralogy might affect the reaction products of abrasion and crushing.
The powerful abrasive base of glaciers and icesheets is well established in the earth system sciences (Benn and Evans, 2010). Subglacial abrasion produces large quantities of micro- and nano-rock particles, known as “glacial- or rock-flour.” The large surface area of these rock particles makes them particularly reactive to chemical weathering. Additionally, trace reactive minerals, such as carbonates and sulphides, are liberated from the silicate mineral matrix, enabling them to react with melt water, to such an extent that these trace minerals are the dominant source of the solute found in the runoff from small alpine glaciers, due to their dissolution kinetics being orders of magnitude more rapid than those of silicate minerals (Tranter et al., 2002; Tranter, 2003; Wadham et al., 2010). However, chemical weathering of silicates is more dominant beneath larger glaciers, where there are significantly longer rock:water contact time (Tranter et al., 2002; Tranter, 2003; Wadham et al., 2010). Recently, abrasion and comminution of subglacial rocks and sediments has been shown to initiate a number of thermo-mechanochemical reactions, producing both oxidising and reducing species, which potentially impact on subglacial biogeochemical reactions (Telling et al., 2015; Dunham et al., 2021; Gill-Olivas et al., 2021). Yet, much remains to be understood about these reactions, largely because of the spectrum of different sources and sinks for the activated species which are produced, either as a direct or indirect consequence of crushing.
Abrasion of silicate rocks and minerals, shears Si-O bonds. Homolytic cleavage of these bonds produces highly reactive Si radicals (Si·) and more stable SiO radicals (SiO·) [Eq. 1; Saruwatari et al. (2004)]These radicals split water and produce either hydrogen radicals [H·; Eq. 2; Kita et al. (1982)] or hydroxyl radicals [HO·; Eq. 3; Narayanasamy and Kubicki (2005)], respectively. The radicals generated can then react together to produce either hydrogen [H2; Eq. 4; Kita et al. (1982)] or hydrogen peroxide [H2O2; Eq. 5; Borda et al. (2003)]. When both are present, some of these radicals are likely to reconstitute as H2O (Eq. 6). Alternatively, heterolytic cleavage of these same bonds can generate Si+ and SiO−ions, which can react with water to produce SiOH [Eq. 7; Saruwatari et al. (2004)]. Dissociation of SiOH in water generates H+. Various laboratory experiments using silicate rocks have shown that H2 is produced under simulated subglacial conditions (Telling et al., 2015; Dunham et al., 2021). Further, there is growing evidence that abrasion of other subglacial substrates, such as sedimentary rocks (Gill-Olivas et al., 2022) and even highly weathered sediments (Gill-Olivas et al., 2021), can also produce nutrients and energy (in the form of H2) for the microbial ecosystems found in these environments.
Laboratory studies, employing natural rocks (Telling et al., 2015; Gill-Olivas et al., 2022) and sediment samples (Dunham et al., 2021; Gill-Olivas et al., 2021), representative of those found in subglacial environments, have shown the potential contributions and importance of these reactions to sustaining subglacial ecosystems. However, silicates are not the only minerals which become “activated” by abrasion. We outline below how even simple, natural minerals have more complex trace compositions which makes it challenging to disentangle the mechanochemical reactions initiated by abrasion.
Abrasion of sulphides (such as pyrite) can generate H2O2 in solution [Eqs 5, 8 and 9; Borda et al. (2003)]. This H2O2 can react with organic matter present in samples to produce carbon dioxide (CO2) and, potentially, volatile organic compounds [VOC’s; Anastasio et al. (2007)].
However, more recently, it has been suggested that carbonates can interfere with these reactions and produce carbonate-radical-anions (CO3·-) instead [Eq. 12; Illes et al. (2019); Gill-Olivas et al. (2022)]. Mechanical breakdown of carbonate minerals can also affect subglacial biogeochemistry by producing dissolved carbon dioxide species [CO2; Eqs 10,11; Martinelli and Plescia (2004); Martinelli and Plescia (2005)]. Moreover, H·, H2O2 and OH (which are produced by the reactions outlined above) can also react with bicarbonate from carbonate dissolution to produce carbonate radicals and carbon dioxide anion radicals, CO3−· and CO2−· [Eqs 12, 13; Wu et al. (2002); Costagliola et al. (2017), respectively]. These carbonate radicals have been shown to abiotically produce organic anions such as acetate, formate and oxalate [Eqs 14–16; Costagliola et al. (2017)]. Our understanding of the potential mechanochemical reactions taking place is further complicated by the release of fluid inclusions, and of gases or solute trapped in inter-grain spaces, which will release a wide range of compounds, including gases such as H2, CO2, CH4 or VOC’s (Konnerupmadsen and Rosehansen, 1982; Diamond, 2001; Potter and Konnerup-Madsen, 2003) or solute, such as Na +, Cl− and other major ions (Goldstein, 2001), when crushed.
Much remains to be understood on the role that these reactions play in subglacial environments. Therefore, there is a need for experiments that illustrate how these reactions may interact, to produce different suites of products. Here we crush two common silicate minerals, quartz and feldspar, to gain insight into the complex geochemical reactions initiated by abrasion which may occur in even very simple systems. Natural mineral samples were chosen, and in order to maximise the impact of abrasion on the reaction products, while minimising the impact of fluid inclusions on one of the minerals, the quartz was furnaced at 1,000°C (Bray et al., 1991; Kuznetsov et al., 2012). The furnacing also removed organic matter (OM). The feldspar was furnaced at 450°C to remove OM. Both minerals were characterised by X-Ray Diffraction (XRD; full details of the method can be seen in Supplementary Material, 1. Supplementary Methods). Quartz was determined to be highly pure (less than 0.01% wt impurities; Supplementary Figure S1) and the alkali feldspar was found to be a mixture of albite (48.2% wt) and microcline (51.8% wt; Supplementary Figure S2).
The two silicate minerals, quartz (Madagascar), alkali feldspar (Norway), were purchased from the Geology Superstore (http://www.geologysuperstore.com). Mineral samples were washed with 18.2 MΩ cm−1 water and dried at 75°C for over 18 h. Minerals were then wrapped in several layers of paper roll (to avoid metal–rock interaction) and broken down using a sledgehammer on a metal plate. Crushed feldspar samples were washed again using 18.2 MΩ cm−1 water, the 63 μm to 2 mm size fraction was collected and dried at 100°C prior to furnacing at 450°C for 4 hours to remove any trace organics. Quartz samples were washed using 18.2 MΩ cm−1 water, the 63 μm to 2 mm size fraction was collected and dried at 100°C prior to furnacing at 1,000°C for 2 hours, to remove any organics and in an attempt to remove fluid inclusions (Bray et al., 1991; Kuznetsov et al., 2012). Crushed minerals where then milled under an oxygen-free nitrogen atmosphere (zero grade, BOC), using a Fritsch Planetary Mono Mill Pulverisette six at 500 r.p.m. for 30 min. Roughly 15 g of sample were crushed in the ball mill at any one time. Gas samples of the ball mill headspace were taken both before and after milling the samples. This process was repeated 10 times to generate sufficient crushed sample for sacrificial incubations of the minerals. After milling, the minerals were transferred to a Coy Vinyl Anaerobic Chamber (CoyLabs, MI, United States), previously flushed repeatedly with zero grade N2 until Oxoid™ Resazurin Anaerobic Indicator (BR0055B, Thermo Fisher Scientific Inc.) indicated anaerobic conditions. Within this chamber, crushed samples were transferred into a large serum vial, which was sealed with grey butyl rubber stoppers (previously boiled in 1 M NaOH for 1 h and rinsed 6 × with 18.2 MΩ cm−1 water), and crimp sealed. The headspace of the vial was then flushed with oxygen-free-N2 for 2 min and stored in the dark until incubation.
Six × 6 g triplicate samples, one for each time point, were weighed into 50 mL borosilicate serum bottles (previously acid washed, rinsed 6 × with 18.2 MΩ cm−1 water, and furnaced at 450°C for 4 h). They were placed into an anaerobic chamber which had been repeatedly flushed with N2 until an Oxoid™ Resazurin Anaerobic Indicator showed that the headspace was anoxic. The serum bottles were then sealed with thick blue butyl rubber stoppers, previously boiled in 1 M NaOH for 1 h, soaked in de-ionised (DI) water overnight and rinsed 6 times with 18.2 MΩ cm−1 water, which in turn were crimp sealed. The sealed vials were flushed for 2 min with oxygen-free-N2 and stored at 0°C until the addition of water and the start of the incubation experiments. Triplicate blank vials were prepared for each time point following the same methods. Once all vials were crimped and flushed, approximately 8 mL of 18.2 MΩ cm−1 water (flushed with N2 for over an hour) at 0°C were added to each vial.
Serum bottles were analysed prior to the addition of water by over pressurising the bottles with 10 mL of oxygen-free N2 (zero grade, BOC). A 10 mL headspace gas aliquot was transferred into a 5.9 mL double-wadded Exetainer® (Labco, Lampeter, United Kingdom) using a gas-tight syringe. Approximately 8 mL of 18.2 MΩ cm−1 water (at 4°C and sparged with oxygen-free N2 for over an hour) was then added to the serum bottles. The headspace in the vials was subsampled after 24 h following the same method. Headspace samples were then taken at 48, 120, 240, 360 and 720 h after the addition of water to the vials, following this same procedure. A 5 mL gas subsample was taken from the exetainers and analysed using an Agilent 8860 Gas Chromatographer (Agilent Technologies, Santa Clara, CA, United States). Concentrations of CH4 and CO2 were determined by a Flame Ionization Detector (FID). The sample loop was 0.5 mL, Helium (He) was used as the carrier gas, and a Porapak Q 80–100 mesh, 2 m × 1/8 inch × 2 mm SS column and a methaniser were used to distinguish the compounds. The concentrations of H2 and O2 were determined using a Thermal Conductivity Detector (TCD), using a 1 mL sample loop, Argon (Ar) as the carrier gas, and a Hayesep D 80–100 mesh, 2 m × 1/8 inch SS column, in series with a molecular sieve 5a, 60–80 mesh, 8 ft × 1/8 inch column. The oven temperature was set at 30°C for the initial 4 min, and then the temperature ramped up at rate of 50°C min-1 until the oven reached a temperature of 200°C. This temperature was maintained for 2.5 min, when the run was concluded. The concentrations of headspace gases were calculated based on a standard-curve generated from the dilution of a mixed gas standard (173738-AH-C, BOC). Standards were run daily and gave a CV of 1.0% (n = 15) for H2, with a limit of detection (LOD) of 9.6 ppm, equivalent to 4.4 nmol g−1, a CV of 0.8% (n = 15) for CH4, with a LOD of 0.1 ppm, equivalent to 0.04 nmol g−1 and a CV of 0.9% (n = 15) for CO2, with a LOD of 0.1 ppm, equivalent to 0.05 nmol g−1. The ideal gas law was used to convert to molar concentrations, and concentrations were corrected for dilution during sampling and for gases dissolved in the water using Henry’s Law (where relevant). The results were also blank corrected for each time point and normalised to dry sediment mass.
The vials were opened immediately after gas sampling, and the liquid overlying the sediment was filtered using 0.22 µm Sartorius™ Minisart™ High Flow PES in-line filters. A 5 mL aliquot was used for pH measurements and H2O2 analysis, using DMP [method detailed in Baga et al. (1988); Gill-Olivas et al. (2021)].
The remainder of the filtrate was frozen immediately after filtering and stored at −20°C until further analysis for nutrients and organic acids. Anions and organic acids, including acetate (LOD: 1.1 ppb, equivalent to 0.02 nmol g−1; CV: 1.4%), formate (LOD: 0.7 ppb, equivalent to 0.02 nmol g−1; CV: 2.3%), F− (LOD: 1.9 ppb, equivalent to 0.13 nmol g−1, CV: 8%), Cl− (LOD: 1.1 ppb, equivalent to 0.04 nmol g−1, CV: 2.6%), NO2− (LOD: 2.2 ppb, equivalent to 0.06 nmol g−1, CV: 2.2%), NO3− (LOD: 1.8 ppb, equivalent to 0.04 nmol g−1, CV: 1.9%), and SO42- (LOD: 3 ppb, equivalent to 0. 4 nmol g−1; CV: 7%) were analysed using a Dionex ICS 6000 (ThermoScientific), fitted with a Dionex IonPac™ AS11-HC 4 µm column. Cations, including: Na+ (LOD: 0.3 ppb, equivalent to 0.50 nmol g−1; CV: 0.3%), K+ (LOD: 0.4 ppb, equivalent to 0.36 µmol g−1; CV: 0.6%), Mg2+ (LOD: 1.6 ppb, equivalent to 0.26 µmol g-1; CV: 1.0%) and Ca2+ (LOD: 1.1 ppb, equivalent to 0.35 µmol g-1; CV: 1.1%), were determined using a Dionex IC 5000 Analytical (Dionex, Sunnyvale, CA, United States), fitted with an IonPac™ CS12A 2 mm column.
Total dissolved iron (dFe) was determined by automating and implementing the ferrozine method described in Viollier et al. (2000) on a Gallery Automated Photometric Analyzer (Thermofisher), with an LOD of 13 ppb, equivalent to 1.58 nmol/g.
The raw concentrations of ions in solution, the concentration of headspace gases and pH values were used to determine saturation indices (SI) of quartz, calcite and aragonite. The thermodynamic equilibria software package PHREEQ-C (version 2.18.5570), using the standard (phreeqc.dat) database, and using an extended Debye-Hückel model to calculate ion activities from concentrations (Parkhurst and Appelo, 1999), was used to calculate the SI with respect to these minerals.
The specific surface area (SSA) of materials was measured using a NOVA 1200e BET Analysis System. Approximately 1 g of dried sample was loaded into a pre-calibrated sample cell. The whole system was then evacuated and dried at 200°C for a minimum of 2 h (Clausen and Fabricius, 2000). The surface area of materials was measured using nitrogen gas as an adsorbent at 77 K. The system was not calibrated using a certified standard, therefore the values obtained were indicative, rather than absolute.
Statistical analysis of the Na+, K+, Mg2+ and Ca2+ concentrations was conducted using the Dunn test in RStudio. There was no clear temporal trend for the concentrations of these cations, thus the values were pooled into a single population for each treatment (see Table 1). The results of this analysis were used to determine if there was any significant difference between the waters incubated with quartz, alkali feldspar or in empty serum vials.
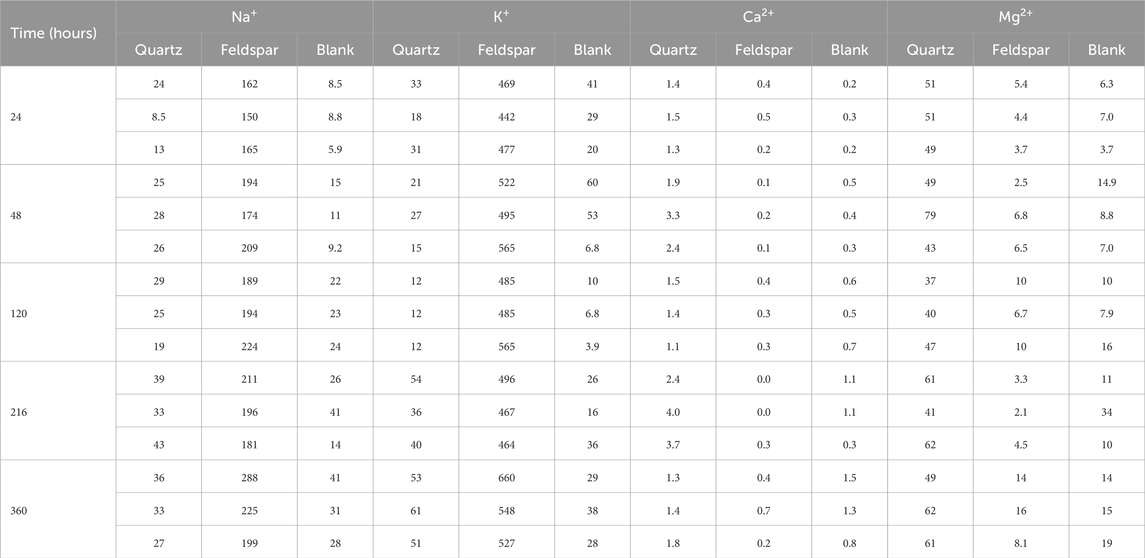
Table 1. Concentrations of Na+, K+, Mg2+ and Ca2+ (in μmol L−1) in solution after incubation with crushed Quartz and Feldspar, and concentration of these ions measured in the vials incubated with ultrapure water. Concentrations have not been corrected for blank values.
Analysis of the gas in the headspace of the ball mill after crushing showed differences between the two minerals. No H2 was detected during crushing of quartz or feldspar. Quartz released quantifiable concentrations of CO2 (average of 8.1 nmol mL−1, equivalent to 12 nmol g−1) during dry crushing, but CH4 concentrations were below the LOD (Table 2). By contrast, there was some CH4 in the alkali feldspar samples (average of 0.6 nmol mL−1, equivalent to 0.14 nmol g−1), but CO2 was below the LOD once corrected for the initial concentration in the headspace. The O2 concentrations before and after crushing were similar, although quartz had a slightly higher average concentration (422 nmol mL−1; Table 2), the concentrations were more variable between crushes (118 nmol mL−1; Table 2).
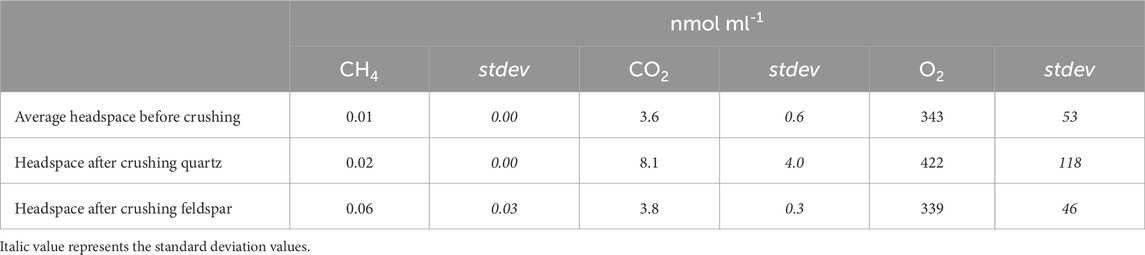
Table 2. Average concentration (in nmol ml−1) of CH4, CO2 and O2 in ball mill headspace before (n = 6) and after crushing quartz (n=3) or feldspar (n=3), and the standard deviation for these values (stdev). H2 was below LOD, and therefore not included here.
Figure 1 shows the release of CH4, H2 and CO2 from both minerals during the incubations. Both quartz and alkali feldspar produced quantifiable concentrations of CH4. Concentrations of CH4 increased linearly during the course of the incubation. Alkali feldspar produced slightly more CH4 than the quartz samples, reaching a maximum of 0.4 nmol mL−1 (equivalent to 0.16 nmol g−1) and 0.1 nmol mL−1 (equivalent to 0.05 nmol g−1), respectively (Table 3; Figure 1A). The incubations produced significant concentrations of H2. Alkali feldspar produced considerably more H2 than quartz, with a median value of 8.7 nmol/g (average of 46 nmol mL−1) after 24 h and increasing to 16 nmol/g (average of 96 nmol mL−1) after 720 h of incubation. The concentration of H2 produced by quartz was below the limit of detection until the 48 h time point (median value 3.8 nmol/g, average of 16 nmol mL−1), and had a maximum median value at 240 h (4.7 nmol/g, or an average of 30 nmol mL−1) and then decreased again (Figure 1B; Table 3). There was some CO2 in the atmosphere of the incubations, after the blank correction (see Table 3). CO2 concentrations in the headspace of the alkali feldspar incubations were equal to or below 0 nmol mL−1 (Table 3). In contrast, the concentration of CO2 in the headspace of quartz incubations increased over time (from 3.3 to 43 nmol g−1 median value, Figure 1B).
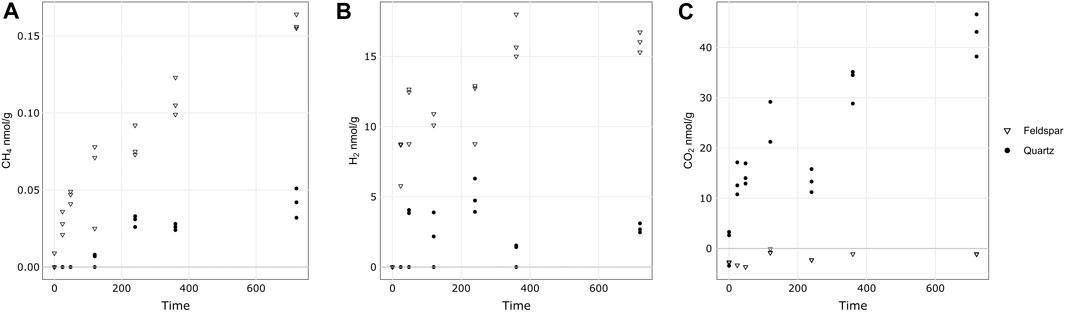
Figure 1. Concentration of CH4 (A), H2 (B) and CO2 (C) during the incubation of crushed quartz or alkali feldspar with ultra pure water. Concentrations of headspace gases have been normalised to the mass of crushed rock in the incubation. All vales are blank corrected and corrected for any gas dissolved in water during the incubation.
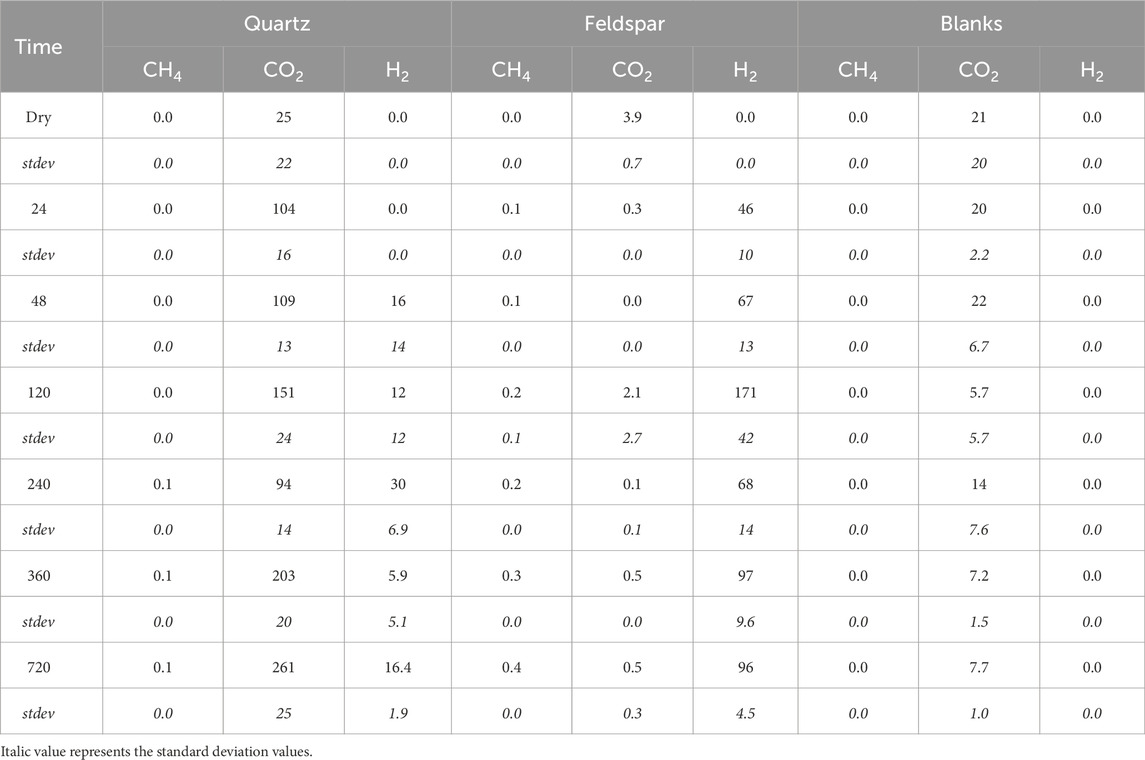
Table 3. Average concentration of CH4, CO2 and H2 (in nmol ml−1) in serum vial headspace during incubation of crushed quartz or feldspar with ultrapure water and the corresponding values for vials containing ultrapure water only (Blanks) and the correspondingstandard deviation for these values (stdev).
There was silicate dissolution during the incubation of both quartz and alkali feldspar. The concentration of truly dissolved silica (dSi) increased quickly for crushed quartz, despite being oversaturated with respect to Quartz (Figure 2B). The median concentration of dSi after 24 h was 0.32 μmol/g, increasing to 2.0 μmol/g (median value) over the course of the incubation (Figure 2A). The concentration of dSi in alkali feldspar started slightly higher (medium value of 1.1 μmol/g) and increased at a slower rate, reaching a median value of 1.5 μmol/g at the end of the incubation (Figure 2A). The concentrations of dSi appeared to have stabilised after 240 h, when concentrations in these incubations become oversaturated with respect to Quartz (Figure 2B).
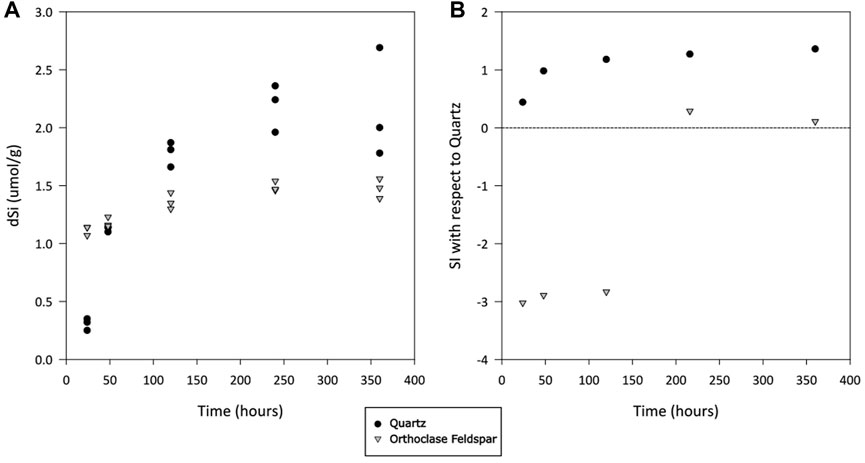
Figure 2. (A) Truly dissolved silicate (dSi) concentration in solutions of ultrapure water incubated with crushed quartz or alkali feldspar. Values normalized to the mass of crushed rock in incubation vial. (B) Calculated saturation index (SI) of solution with respect to quartz, as calculated using average values in PHREEQC, over time.
The concentrations of dissolved cations in solution showed some significant different between quartz and alkali feldspar incubations (Figure 3). The concentrations of monovalent ions (Na+ and K+) in the quartz incubations where not significantly different from the blanks (Figures 3A,B). Concentrations of divalent cations (Mg2+ and Ca2+) where low, but significantly higher than those in the blanks and the alkali feldspar incubations (Figures 3C,D). The solutions incubated with crushed alkali feldspar showed concentrations of monovalent ions significantly higher than the blanks (Figures 3A,B), whereas concentrations of Ca2+ were lower than those found in Quartz incubations, but still significantly different to those of the blanks (Figure 3C). The concentration of Mg2+ was not significantly different in alkali feldspar incubations than in blanks (Figure 3D).
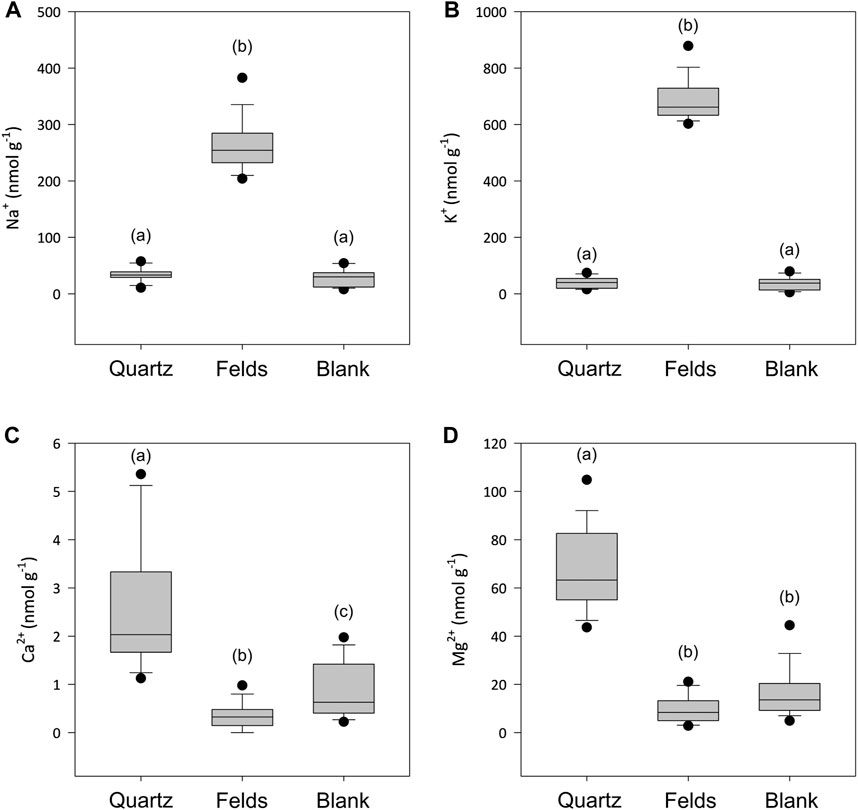
Figure 3. Boxplot showing the concentrations of Na+ (A), K+ (B), Ca2+ (C) and Mg2+ (D) when crushed quartz (Quartz) and alkali feldspar (Felds) samples are incubated with ultra-pure water for up to 720 h (n = 18). Blanks were conducted with water incubated under the same laboratory conditions over and sampled at the same time points. (a–c) above the boxplot denotes significantly different (p < 0.05) populations using a Dunn’s test.
Quantifiable concentrations of acetate and formate were found in both incubations (Figures 4A,B, respectively). Concentrations of acetate were significantly higher in alkali feldspar than in quartz incubations (Dunn’s test, p<0.001), and in both cases concentrations were significantly higher than those in blanks (Dunn’s test, p<0.01 and <0.001 for quartz and alkali feldspar, respectively). The formate concentrations were not significantly different between samples, and were significantly higher than in blanks (Dunn’s test, p<0.001). Finally, dFe was also measured in concentrations above the blank values (Dunn’s test, p<0.01), but not significantly different from each other (Figure 5).
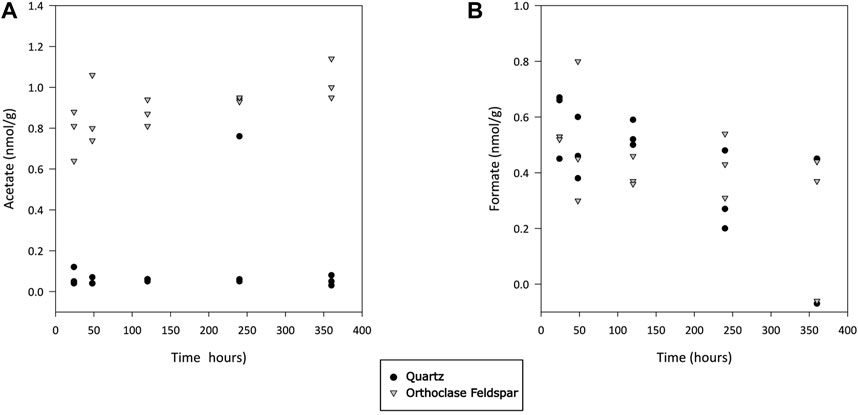
Figure 4. Concentration of acetate (A) and formate (B) during incubation of crushed quartz and feldspar with ultra-pure water. Concentration values have been normalised to the mass of crushed mineral in incubation vials. All values have been blank corrected.
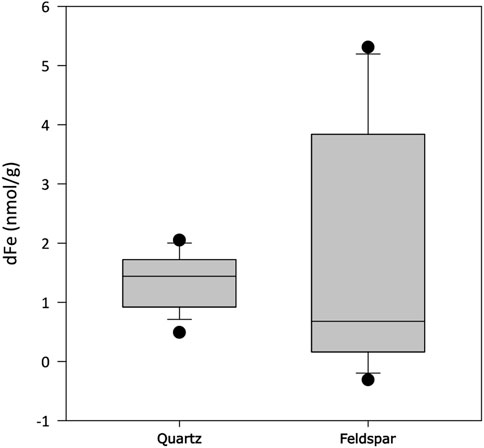
Figure 5. Concentration of dissolved total iron (dFe) when crushed quartz (Quartz) and orthoclase feldspar (Feldspar) minerals are incubated with ultra-pure water for up to 720 h (n = 18). All values have been blank corrected.
Incubations of sample with water under anoxic conditions did not produce quantifiable H2O2 concentrations, given an LOD of 0.3 µM.
The SSA of crushed quartz was measured to be 21 m2/g and the SSA of crushed alkali feldspar was 8.1 m2/g.
The quartz had been furnaced at 1,000°C in an attempt to remove or at least to minimise the potential influence of fluid inclusions (Bray et al., 1991), and this is consistent with there being no quantifiable release of either CH4 or H2 during dry crushing. The release of CO2 during crushing is most likely due to carbonate mineral impurities present in the sample, some of which dissociated into gas during crushing [Eqs 9,10; Martinelli and Plescia (2004); Martinelli and Plescia (2005)]. The trace amounts of carbonates, which may have been converted to CaO during furnacing, would have then been exposed to water during the incubation, producing CO2, Ca2+ and, often, Mg2+ as they dissolve (Figures 1C, 3C). This suggests that even trace concentrations of carbonate minerals (<0.01%; Supplementary Figure S1) in silicate minerals can noticeably influence biogeochemical reactions, as has been noted in field studies of waters draining granitic terrain (White et al., 2005).
Crushing silicates produces both Si and SiO surface free radicals (Narayanasamy and Kubicki, 2005), which can react with water to produce H2 and H2O2, respectively (Eq. 2–5). Further, it has been suggested when H2O is split to produce H2 it must produce stochiometric equivalent concentrations of oxidants (Sherwood Lollar et al., 2021). This is not immediately apparent during our incubations, where H2 generation is apparent, but H2O2 was below the LOD in all samples. Organic matter in the mineral samples was minimised by furnacing, so it is unlikely that oxidation of organic matter is a sink for H2O2.
The presence of carbonate could account for the lack of H2O2 in the quartz incubations, since carbonate is a known HO· scavenger (Buxton and Elliot, 1986). Further, interactions between carbonate and OH·, generated by radiolytic decomposition of H2O, has been suggested as an abiotic source of acetate and formate in fracture waters [Eqs 14–16 (Costagliola et al., 2017; Sherwood Lollar et al., 2021)]. Both acetate and formate were measured in the quartz and alkali feldspar incubations, and it is possible that the low concentrations found in the quartz incubations could be generated by carbonate and HO· interactions. By contrast, the higher concentrations of these ions in the feldspar incubations may arise from dissolution of fluid inclusions in the crushed mineral, which was only furnaced to 450°C, rather than to 1,000°C for quartz, the latter to minimise the potential influence of fluid inclusions on the incubations.
We note that the production of HO· can have both positive and negative effects on subglacial ecosystems, potentially producing VFAs, through the reaction of HO· with organic matter (Anastasio et al., 2007) or with trace carbonates (Costagliola et al., 2017). These VFA’s are readily available carbon sources to these subglacial environments which have otherwise very limited long term inputs of organic matter. However, H2O2 and HO· can also be very damaging to living organisms (Ikai et al., 2010; Sampson et al., 2012). Potentially, our results suggest that even trace amounts of carbonate can rapidly react with HO·, thus potentially protecting microbes in these environments and producing potential energy substrate sources simultaneously.
Quartz is often considered a relatively unreactive mineral, due to its low solubility and slow dissolution kinetics (Crundwell, 2017). However, abrasion increases the solubility of both quartz and feldspar. Figure 2 shows that silicate dissolution is taking place (Figure 2A), even when PHREEQC modelling suggests that this solution is oversaturated with respect to quartz (Figure 2B). This enhanced silicate solubility is a consequence of the excess surface free energy imparted to the minerals during crushing (Petrović et al., 1976; Petrovich, 1981). The large surface area created during crushing also promotes more rapid rates of dissolution. Further, quartz comminution and wetting produces low concentrations of H2 (Figure 1B). Hence, even relatively “unreactive” minerals such as quartz can produce compounds of biological utility when abraded.
Alkali feldspar dissolution kinetics are more rapid than quartz (Lerman, 1988). The water chemistry in the feldspar incubations produced a silicate weathering signature, with monovalent ions present in higher concentrations than divalent ions (Figure 6), consistent with there being no trace carbonate in the feldspar, as well as high dSi concentrations (Figure 2). The concentration of dSi, increased rapidly after the addition of water, whereas concentrations of Na+ and K+ where immediately high and stayed relatively stable, as did the pH solution (pH 11.2; Figure 7), consistent with the results from PHREEQC models and hydrolysis being the initial reaction in solution (Keller and Reesman, 1963; Garrels and Christ, 1965). Hydrolysis produces a leached surface layer on the feldspar surface, depleted in base cations. Si dissolves much more slowly from this leached layer. Further dissolution of base cations is via diffusion through the leached layer, which is also slow (Lerman, 1988). The concentration of dSi increased more rapidly in quartz incubations than in alkali feldspar incubations, potentially because the surface area of the quartz (21 m2/g) was much higher than that of the alkali feldspar (8.1 m2/g). Both solutions are supersaturated with respect to crystalline quartz because comminution produces areas with high excess surface energy on the crushed minerals, such as amorphous zones, dislocations and adhering microparticles (Petrović et al., 1976; Petrovich, 1981). This makes the surface super-soluble with respect to crystalline quartz, and hence the solution becomes supersaturated as Si dissolves from these sites.
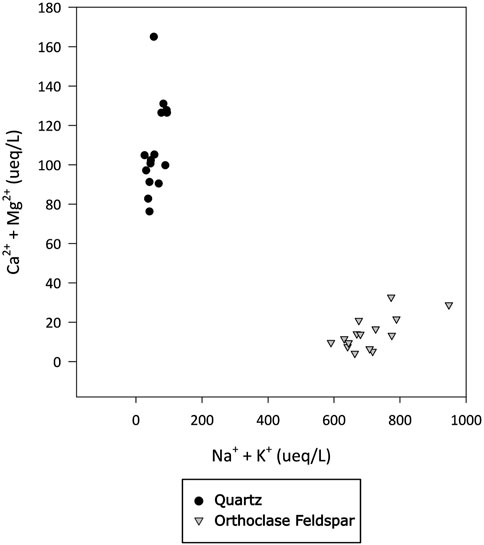
Figure 6. Concentration of divalent (Ca2+ and Mg2+) and monovalent (Na+ and K+) major cations in ueq L-1 in water incubated with quartz or alkali felspar for up to 720 h. Divalent and monovalent ions plotted against each other to identify dominant weathering signature.
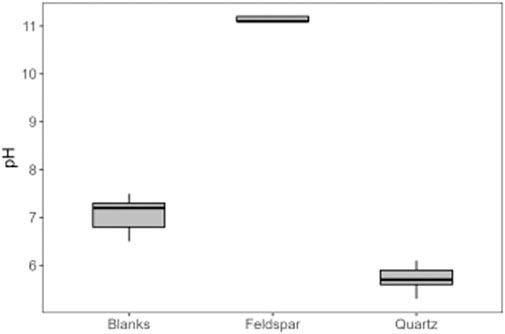
Figure 7. pH of ultrapure water (Blanks), and of solutions of ultrapure water (8 ml) with 6 g of crushed alkali feldspar (Feldspar) or crushed quartz (Quartz), incubated for up to 720 h (n = 18) in serum vials at 0°C.
The SSA of crushed silicate samples has been linked to the generation of Si free radicals and thus H2 production (Telling et al., 2015). However, quartz produced considerably less H2 than alkali feldspar (Figure 1B) despite the higher measured SSA. Increased H2 generation has also been linked to the presence of Al-OH, which are often found in sheet silicates, which can also react with Si· and generate H· (Kameda et al., 2004). These Al-OH bonds could also be present in alkali feldspar samples and be a potential source of additional H2. A potential control on the products of abrasion is the different shearing that these minerals undergo. Potentially, the structure of these minerals favours either homolytic or heterolytic cleavage, resulting in either H· or H+, respectively (Delogu, 2011). Delogu (2011) found crushing quartz increased both H· and H+ simultaneously, as the generation of active sites produces H·, which recombine to form H2 molecules, and silanol groups (SiOH), which can generate H+. However, the data presented here did not follow this trend. The pH of water incubated with crushed quartz did decrease slightly relative to the ultra-pure water incubations, potentially through the mechanisms outlined above. Yet, the high pH generated by surface hydrolysis of the feldspar confounds easy comparison of the experiments in terms of distinguishing between homolytic and heterolytic effects.
Even simple silicate minerals, such quartz and feldspar, contain trace amounts of other minerals which make it difficult to unequivocally determine the mechanochemical reactions initiated by abrasion. These experiments, using naturally occurring minerals, rather than ultrapure minerals with a minimal fluid inclusion content, produces results which are more representative of natural subglacial systems where abrasion is taking place, and highlights some of the potential interactions that occur between bulk and trace minerals. However, these interactions make it challenging to identify the individual reactions taking place in order to quantify the effects of these interactions. This is even the case for the quartz incubations, which were furnaced at 1,000°C in an attempt to remove fluid inclusions and organic matter, and was considered pure (with less than 0.01% of impurities), yet produced CO2, CH4 and acetate and formate upon crushing. These can be produced by the reaction of carbonates with free radicals, as suggested above (Section 4.1), however, this is difficult to confirm without quantifying fluid inclusions, if present, and their composition.
Feldspar samples were furnaced at 450°C to remove any OM contamination, however this temperature does not remove fluid inclusions. Fluid inclusions can be trapped within the mineral structure during the crystallization of magma. The composition of these fluid inclusions is highly variable, containing traces of traces of gases and fluid from the environment where they were formed. Fluid inclusions in crystalline rocks, such as quartz and granitoids (which usually include feldspars), are often rich in hydrocarbon gases (Potter and Konnerup-Madsen, 2003). Further, it is challenging to quantify the fluid inclusions present within minerals. Thus, it is difficult to differentiate between the reactions taking place when freshly abraded surfaces react with water, and the compounds released from these fluid inclusions. There was no evidence of carbonate weathering in the solute of the feldspar samples, therefore it is likely that at least some of the acetate, formate and CH4 measured during the incubation of feldspar samples originates from fluid inclusions.
These experiments allow us to further understand the complex suite of reactions which take place when freshly abraded mineral surfaces react with water, highlighting the potential effects of impurities on the reaction products. We show that the trace carbonate content will determine some of the free radical reactions that take place, particularly when investigating the reactivity of crushed quartz which, due to its slow reaction kinetics, is often considered “unreactive”. Abrasion of quartz generates highly reactive free radicals which can produce bio-utilisable molecules, such as H2, and can also react with mineral impurities found within the mineral structure to produce compounds of interest, such as acetate and formate. These reactions are not only a source of labile organic carbon to subglacial environments, but could have implications for exoplanetary sciences and the origin of life, since inorganic carbon has been converted into simple organic carbon molecules. Abrasion also increases the solubility of silicates, due to the excess surface free energy generated during crushing, supplying subglacial microorganisms with nutrients and exporting dSi into the ocean. This study also highlights some of the limitations associated with using natural samples to identify complex mechanochemical reactions initiated by abrasion, as well as how our current understanding is partially hindered by analytical limitations. However, the use of natural minerals does highlight some of the important interactions that are also likely to take palace in natural subglacial systems.
The original contributions presented in the study are publicly available. This data can be found here: https://doi.org/10.5285/b8aa3ec7-e539-4255-a21a-0c780fbf89f6.
BG-O: Writing–original draft, Visualization, Methodology, Investigation, Formal Analysis, Data curation, Conceptualization. JT: Writing–review and editing, Supervision, Conceptualization. MT: Writing–review and editing, Supervision, Project administration, Funding acquisition, Conceptualization.
The author(s) declare financial support was received for the research, authorship, and/or publication of this article. The research was supported by NERC grant NE/S001670/1, CRUSH2LIFE (BG-O, MT, and JT) and by European Research Council (ERC) Synergy Grant DEEP PURPLE under the European Union’s Horizon 2020 Research and Innovation Program (Grant Number 856416).
We are grateful to Roberts Blukis and Liane G. Benning from the German Research Centre for Geosciences (GFZ) for the XRD analysis performed on the quartz and alkali feldspar samples.
The authors declare that the research was conducted in the absence of any commercial or financial relationships that could be construed as a potential conflict of interest.
All claims expressed in this article are solely those of the authors and do not necessarily represent those of their affiliated organizations, or those of the publisher, the editors and the reviewers. Any product that may be evaluated in this article, or claim that may be made by its manufacturer, is not guaranteed or endorsed by the publisher.
The Supplementary Material for this article can be found online at: https://www.frontiersin.org/articles/10.3389/feart.2024.1371128/full#supplementary-material
Anastasio, C., Galbavy, E. S., Hutterli, M. A., Burkhart, J. F., and Friel, D. K. (2007). Photoformation of hydroxyl radical on snow grains at Summit, Greenland. Atmos. Environ. 41, 5110–5121. doi:10.1016/j.atmosenv.2006.12.011
Baga, A. N., Johnson, G. R. A., Nazhat, N. B., and Saadalla-Nazhat, R. A. (1988). A simple spectrophotometric determination of hydrogen peroxide at low concentrations in aqueous solution. Anal. Chim. Acta 204, 349–353. doi:10.1016/s0003-2670(00)86374-6
Benn, D. I., and Evans, D. J. A. (2010). Erosion processes, forms and landscapes. Glaciers and Glaciation. London: Hodder Education.
Borda, M. J., Elsetinow, A. R., Strongin, D. R., and Schoonen, M. A. (2003). A mechanism for the production of hydroxyl radical at surface defect sites on pyrite. Geochimica Cosmochimica Acta 67, 935–939. doi:10.1016/s0016-7037(02)01222-x
Bray, C. J., Spooner, E. T. C., and Thomas, A. V. (1991). Fluid inclusion volatile analysis by heated crushing, on-line gas chromatography; applications to Archean fluids. J. Geochem. Explor. 42, 167–193. doi:10.1016/0375-6742(91)90066-4
Buxton, G. V., and Elliot, A. J. (1986). Rate constant for reaction of hydroxyl radicals with bicarbonate ions. Int. J. Radiat. Appl. Instrum. Part C. Radiat. Phys. Chem. 27, 241–243. doi:10.1016/1359-0197(86)90059-7
Clausen, L., and Fabricius, I. I. (2000). BET measurements: outgassing of minerals. J. Colloid Interface Sci. 227, 7–15. doi:10.1006/jcis.2000.6880
Costagliola, A., Vandenborre, J., Blain, G., Baty, V., Haddad, F., and Fattahi, M. (2017). Radiolytic dissolution of calcite under gamma and Helium ion irradiation. J. Phys. Chem. C 121, 24548–24556. doi:10.1021/acs.jpcc.7b07299
Crundwell, F. K. (2017). On the mechanism of the dissolution of quartz and silica in aqueous solutions. ACS Omega 2, 1116–1127. doi:10.1021/acsomega.7b00019
Delogu, F. (2011). Hydrogen generation by mechanochemical reaction of quartz powders in water. Int. J. Hydrogen Energy 36, 15145–15152. doi:10.1016/j.ijhydene.2011.08.120
Diamond, L. W. (2001). Review of the systematics of CO2–H2O fluid inclusions. Lithos 55, 69–99. doi:10.1016/s0024-4937(00)00039-6
Dunham, E. C., Dore, J. E., Skidmore, M. L., Roden, E. E., and Boyd, E. S. (2021). Lithogenic hydrogen supports microbial primary production in subglacial and proglacial environments. Proc. Natl. Acad. Sci. U. S. A. 118, e2007051117. doi:10.1073/pnas.2007051117
Gill-Olivas, B., Telling, J., Skidmore, M., and Tranter, M. (2023). Abrasion of sedimentary rocks as a source of hydrogen peroxide and nutrients to subglacial ecosystems. Biogeosciences 20, 929–943. doi:10.5194/bg-20-929-2023
Gill-Olivas, B., Telling, J., Tranter, M., Skidmore, M., Christner, B., O’Doherty, S., et al. (2021). Subglacial erosion has the potential to sustain microbial processes in Subglacial Lake Whillans, Antarctica. Commun. Earth Environ. 2, 134. doi:10.1038/s43247-021-00202-x
Goldstein, R. H. (2001). Fluid inclusions in sedimentary and diagenetic systems. Lithos 55, 159–193. doi:10.1016/s0024-4937(00)00044-x
Ikai, H., Nakamura, K., Shirato, M., Kanno, T., Iwasawa, A., Sasaki, K., et al. (2010). Photolysis of hydrogen peroxide, an effective disinfection system via hydroxyl radical formation. Antimicrob. Agents Chemother. 54, 5086–5091. doi:10.1128/aac.00751-10
Illes, E., Mizrahi, A., Marks, V., and Meyerstein, D. (2019). Carbonate-radical-anions, and not hydroxyl radicals, are the products of the Fenton reaction in neutral solutions containing bicarbonate. Free Radic. Biol. Med. 131, 1–6. doi:10.1016/j.freeradbiomed.2018.11.015
Kameda, J., Saruwatari, K., Tanaka, H., and Tsunomori, F. (2004). Mechanisms of hydrogen generation during the mechanochemical treatment of biotite within D2O media. Earth, Planets Space 56, 1241–1245. doi:10.1186/bf03353346
Keller, W. D., and Reesman, A. L. (1963). Glacial milks and their laboratory-simulated counterparts. Geol. Soc. Am. 74, 61–76. doi:10.1130/0016-7606(1963)74[61:gmatlc]2.0.co;2
Kita, I., Matsuo, S., and Wakita, H. (1982). H2 generation by reaction between H2O and crushed rock - an experimental-study on H2 degassing from the active fault zone. J. Geophys. Res. 87, 10789–10795. doi:10.1029/jb087ib13p10789
Konnerupmadsen, J., and Rosehansen, J. (1982). Volatiles associated with alkaline igneous rift activity - fluid inclusions in the ilimaussaq intrusion and the gardar granitic complexes (south Greenland). Chem. Geol. 37, 79–93. doi:10.1016/0009-2541(82)90068-7
Kuznetsov, S. K., Svetova, E. N., Shanina, S. N., and Filippov, V. N. (2012). Minor elements in quartz from hydrothermal-metamorphic veins in the nether polar ural province. Geochem. Int. 50, 911–925. doi:10.1134/s0016702912090054
Lerman, A. (1988). Dissolution of feldspars. Geochemical processes water and sediment environments. Malabar, florida: Robert E. Krieager Publishing Company.
Martinelli, G., and Plescia, P. (2004). Mechanochemical dissociation of calcium carbonate: laboratory data and relation to natural emissions of CO2. Phys. Earth Planet. Interiors 142, 205–214. doi:10.1016/j.pepi.2003.12.009
Martinelli, G., and Plescia, P. (2005). Carbon dioxide and methane emissions from calcareous-marly rock under stress: experimental tests results. Ann. Geophys. 48, 167–173. doi:10.4401/ag-3191
Narayanasamy, J., and Kubicki, J. D. (2005). Mechanism of hydroxyl radical generation from a silica surface: molecular orbital calculations. J. Phys. Chem. B 109, 21796–21807. doi:10.1021/jp0543025
Parkhurst, D. L., and Appelo, C. J. (1999). User's guide to PHREEQC (Version 2): a computer program for speciation, batch-reaction, one-dimensional transport, and inverse geochemical calculations. Water-Resources Investig. Rep. 99, 312. doi:10.3133/wri994259
Petrovich, R. (1981). Kinetics of dissolution of mechanically comminuted rock-forming oxides and silicates—II. Deformation and dissolution of oxides and silicates in the laboratory and at the Earth's surface. Geochimica Cosmochimica Acta 45, 1675–1686. doi:10.1016/0016-7037(81)90003-x
Petrović, R., Berner, R. A., and Goldhaber, M. B. (1976). Rate control in dissolution of alkali feldspars—I. Study of residual feldspar grains by X-ray photoelectron spectroscopy. Geochimica Cosmochimica Acta 40, 537–548. doi:10.1016/0016-7037(76)90221-0
Potter, J., and Konnerup-Madsen, J. (2003). A review of the occurrence and origin of abiogenic hydrocarbons in igneous rocks. Geol. Soc. Lond. Spec. Publ. 214, 151–173. doi:10.1144/gsl.sp.2003.214.01.10
Sampson, T. R., Liu, X., Schroeder, M. R., Kraft, C. S., Burd, E. M., and Weiss, D. S. (2012). Rapid killing of acinetobacter baumannii by polymyxins is mediated by a hydroxyl radical death pathway. Antimicrob. Agents Chemother. 56, 5642–5649. doi:10.1128/aac.00756-12
Saruwatari, K., Kameda, J., and Tanaka, H. (2004). Generation of hydrogen ions and hydrogen gas in quartz-water crushing experiments: an example of chemical processes in active faults. Phys. Chem. Minerals 31, 176–182. doi:10.1007/s00269-004-0382-2
Sherwood Lollar, B., Heuer, V. B., Mcdermott, J., Tille, S., Warr, O., Moran, J. J., et al. (2021). A window into the abiotic carbon cycle – acetate and formate in fracture waters in 2.7 billion year-old host rocks of the Canadian Shield. Geochimica Cosmochimica Acta 294, 295–314. doi:10.1016/j.gca.2020.11.026
Telling, J., Boyd, E. S., Bone, N., Jones, E. L., Tranter, M., Macfarlane, J. W., et al. (2015). Rock comminution as a source of hydrogen for subglacial ecosystems. Nat. Geosci. 8, 851–855. doi:10.1038/ngeo2533
Tranter, M. (2003). “Geochemical weathering in glacial and proglacial environments,” in Treatise on Geochemistry. Editors H. D. HOLLAND, and K. K. TUREKIAN (Oxford: Elsevier-Permagon).
Tranter, M., Sharp, M. J., Lamb, H. R., Brown, G. H., Hubbard, B. P., and Willis, I. C. (2002). Geochemical weathering at the bed of Haut Glacier d'Arolla, Switzerland - a new model. Hydrol. Process. 16, 959–993. doi:10.1002/hyp.309
Viollier, E., Inglett, P. W., Hunter, K., Roychoudhury, A. N., and Van Cappellen, P. (2000). The ferrozine method revisited: Fe(II)/Fe(III) determination in natural waters. Appl. Geochem. 15, 785–790. doi:10.1016/s0883-2927(99)00097-9
Wadham, J. L., Tranter, M., Skidmore, M., Hodson, A. J., Priscu, J., Lyons, W. B., et al. (2010). Biogeochemical weathering under ice: size matters. Glob. Biogeochem. Cycles 24, 11. doi:10.1029/2009gb003688
White, A. F., Schulz, M. S., Lowenstern, J. B., Vivit, D. V., and Bullen, T. D. (2005). The ubiquitous nature of accessory calcite in granitoid rocks: implications for weathering, solute evolution, and petrogenesis. Geochimica Cosmochimica Acta 69, 1455–1471. doi:10.1016/j.gca.2004.09.012
Keywords: geochemistry, mechanochemistry, subglacial, crushing, nutrients, microbes, comminution, free radicals
Citation: Gill-Olivas B, Telling J and Tranter M (2024) Geochemical reactions initiated by subglacial abrasion of natural quartz and alkali feldspar. Front. Earth Sci. 12:1371128. doi: 10.3389/feart.2024.1371128
Received: 15 January 2024; Accepted: 13 May 2024;
Published: 05 July 2024.
Edited by:
Hongchen Jiang, China University of Geosciences Wuhan, ChinaReviewed by:
Atsushi Tani, Kobe University, JapanCopyright © 2024 Gill-Olivas, Telling and Tranter. This is an open-access article distributed under the terms of the Creative Commons Attribution License (CC BY). The use, distribution or reproduction in other forums is permitted, provided the original author(s) and the copyright owner(s) are credited and that the original publication in this journal is cited, in accordance with accepted academic practice. No use, distribution or reproduction is permitted which does not comply with these terms.
*Correspondence: Beatriz Gill-Olivas, Yi5naWxsb2xpdmFzQGVudnMuYXUuZGs=
Disclaimer: All claims expressed in this article are solely those of the authors and do not necessarily represent those of their affiliated organizations, or those of the publisher, the editors and the reviewers. Any product that may be evaluated in this article or claim that may be made by its manufacturer is not guaranteed or endorsed by the publisher.
Research integrity at Frontiers
Learn more about the work of our research integrity team to safeguard the quality of each article we publish.