 Cheng He
 Huiming Tang
 Kun Fang
 Sixuan Sun1
94% of researchers rate our articles as excellent or good
Learn more about the work of our research integrity team to safeguard the quality of each article we publish.
Find out more
ORIGINAL RESEARCH article
Front. Earth Sci., 20 February 2024
Sec. Geohazards and Georisks
Volume 12 - 2024 | https://doi.org/10.3389/feart.2024.1367778
This article is part of the Research TopicInvestigation, Monitoring, Stability and Risk Assessment of GeohazardsView all 15 articles
Determining the joint roughness accurately will better serve the peak shear strength estimation models of rock joints used for stability assessment of rock masses. Considering the defects of the existing quantitative characterization parameters for two-dimensional (2D) joint roughness, especially the lack of explicit geometric and physical meaning, we proposed two new 2D roughness parameters,
Landslide hazards widely exist in nature (Wang et al., 2022; Zhang et al., 2024a; Zhang et al., 2024b). Among them, rock landslides have been the focus of landslide research due to their extreme destructiveness. Engineering practices show that the stability of rock masses is affected by many factors (Wu and Kulatilake, 2012; Wen et al., 2020; Wen et al., 2023; Wu et al., 2023; Zhang et al., 2024), especially the existence of joints greatly weakens the mechanical properties and integrity of rock masses (Jiang et al., 2015; Cheng et al., 2016; Li et al., 2020; Barton et al., 2023). The shear strength of rock joints, as a main determinant for the stability of rock masses, has always been a research hotspot in rock mechanics (Leichnitz, 1985; Jiang et al., 2006; Bahaaddini et al., 2013; Ban et al., 2020a). Numerous studies have found that joint roughness plays a crucial role in the shear strength of rock joints (Lee et al., 2001; Tang et al., 2012; Liu et al., 2017; Song et al., 2023; An et al., 2024). In 1973, a peak shear strength estimation model of rock joints which intuitively reflected the significant influence of joint roughness on peak shear strength was proposed by Barton (1973). In the model, the joint roughness coefficient (JRC) was proposed for the first time to define the joint roughness. This model is widely used in engineering practice (Barton and Bandis, 1990; Barton et al., 2023) and is expressed as:
where
However, determination of JRC via visual comparison is highly subjective (Lee et al., 1990; Li and Zhang, 2015; Yong et al., 2018a). To overcome this flaw, Barton and Bandis (1990) proposed the straight-edge method by measuring the maximum amplitude of the joint to calculate the JRC. The method was established on the basis of a large number of rock joint mechanics tests. Du et al. (1996) elucidated the physical meaning of the straight-edge method and further proposed an improved straight-edge method. In addition, many scholars have developed new roughness parameters based on morphological characteristic analysis of 10 standard joint profiles and established corresponding regression equations to improve the determination of JRC. Among these, roughness parameters such as
In rock joint direct shear tests, Grasselli (2001) found that the shear direction and the normal stress level had direct impacts on the distribution locations of real contact asperities. Considering this, Tatone and Grasselli (2010) introduced a continuous function to describe the cumulative distribution of inclination angles of those joint line segments where contact may occur on a joint profile and established the relationship between a new proposed roughness parameter
It should be clarified that the ultimate purpose of proposing a more accurate JRC determination method is to better serve the JRC-JCS shear strength estimation model. Therefore, roughness parameters that have strong connections with the shear strength of rock joints based on the shear failure mechanisms of rock joints may further improve the determination of JRC. In addition, roughness parameters have clear geometric and physical meanings, which will make them easy to be understanded and applied. The roughness parameters in the above improved JRC determination methods can effectively describe the morphological characteristics of two-dimensional (2D) joint profiles, but they also tend to have the following defects. (1) Roughness parameters obtained through morphological characteristic analysis of all joint line segments on a joint profile cannot reflect the difference in roughness of the same joint profile in two different shear directions, such as
To overcome the defects mentioned above of the existing quantitative characterization parameters for 2D joint roughness, we propose two new 2D roughness parameters:
Most of the existing 2D roughness parameters reflect only the morphological characteristics of 2D joint profiles and lack clear geometric meaning. To overcome this shortcoming, we construct asperities on rock joint profiles by the following process and give them clear geometric meaning.
(1) Extracting the joint profile at a certain sampling interval (
(2) Rebuilding and adjusting the joint profile (discrete points) in the XY coordinate system, as shown in Figure 1B. First, we plot the joint profile scatter plot in the XY coordinate system. Then, we adjust the joint profile by translation along the y-axis to make the x-axis pass through the lowest point of the joint profile.
(3) Building asperities on the adjusted joint profile and defining the inclination angle and amplitude height of an asperity, as shown in Figure 1C. We define the line segment formed by any two adjacent discrete points as the joint line segment. The region between the joint line segment and the x-axis is defined as the asperity. Thus, all joint line segments on the joint profile are identified and further used to build asperities. Furthermore, we define the acute angle between the joint line segment of the asperity and the horizontal line as the inclination angle of the asperity and the distance from the centre point of the joint line segment of the asperity to the x-axis as the amplitude height of the asperity.
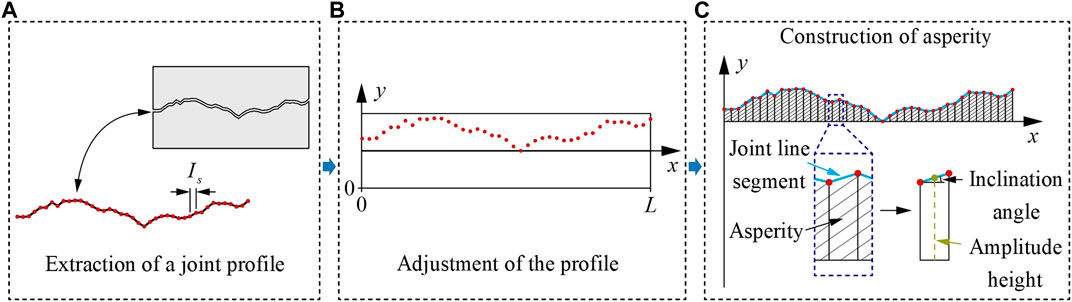
FIGURE 1. Sketch of the construction process of the asperities on the joint profile.
Through the above process, the constructed asperities have clear geometric meaning. Thus, establishing new roughness parameters based on the joint profile containing various asperities will have clear geometric meaning.
Studying the influence of the morphological characteristics of joint surfaces on the shear mechanical behaviours of rock joints is necessary to obtain reasonable roughness quantitative characterization parameters. For the coarse and unfilled coupled joints, Grasselli (2001) indicated that in shear tests, only those zones facing the shear direction (i.e., where the quantity product of the unit outer normal vector and the shear direction unit vector is less than 0) could come into contact, while the others were detached gradually. Then, Grasselli et al. (2002) proposed the concept of potential contact zones to characterize those zones where contact may occur during shearing. This phenomenon that the resistance to shear can be provided only by the potential contact zones was also confirmed by the direct shear tests of several researchers (Zhang et al., 2016; Ban et al., 2020b). Therefore, taking the potential contact zones that control the shear mechanical behaviours of rock joints as major research objects has an experimental basis.
To further develop the new 2D roughness quantitative characterization parameters with clear physical and mechanical meanings, the extracted joint profile shown in Figure 1A is further treated as follows: (1) stretching the joint profile a certain thickness
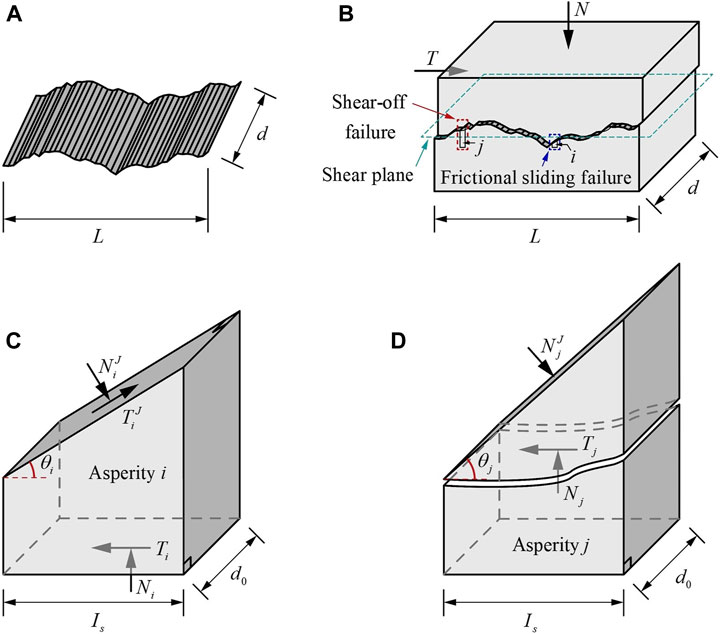
FIGURE 2. Sketch of the construction process of the rock joint shear mechanics analysis model and the force states of asperities on the rock joint. (A) stretching the joint profile to form a joint surface, (B) constructing the shear mechanics analysis model of the rock joint, (C) force states of asperity
Grasselli et al. (2002) suggested that real contact is located only in the steepest part of all potential contact zones. That is, under normal and shear loads, all normal forces will act on the joint planes in real contact due to the climbing effect of the upper joint. In the model shown in Figure 2B, frictional sliding and shear-off are two possible failure modes of real contact asperities (i.e., those asperities whose joint planes are in contact during the shear test) with varying inclination angles, such as asperities
where
Similarly, the local forces acting on the joint plane of asperity
Combining formulas 2–4, the following equation can be further obtained:
However, the local normal force
where
Eq. 7 shows that the normal force corresponding to the transition of the failure mode of the asperity with a higher inclination angle is smaller. Therefore, when the normal load applied to the rock joint increases, more asperities will experience shear-off failure because of the local normal forces increasing and exceeding the respective transition normal forces.
For the rock joint, the local shear resistance of every real contact asperity can be calculated using formula 5 or 6 to calculate the shear strength of the rock joint. However, only Eq. 5 can reflect the influence of the morphological characteristics of varying asperities (i.e., their inclination angles) on the local shear resistance. Therefore, to adequately reflect the influence of the morphological characteristics of the joint surface on the shear resistance of the rock joint, this study assumes that the normal load applied to the rock joint is low (Barton and Choubey, 1977; Kulatilake et al., 2006; Cai et al., 2017). That is, in this condition, most real contact asperities experience frictional sliding failure. To further simplify the problem, all real contact asperities are assumed to experience frictional sliding failure. When contact occurs through surface roughness, the joint slips on the contact zones and forms angle
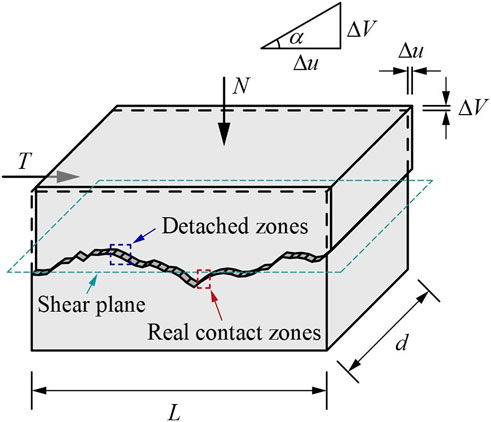
FIGURE 3. Sketch of the sliding failure mechanism of the rock joint.
If these arguments mentioned above are extended to the
where
Thus, the joint shear strength governing law may be obtained by combining formulas 5, 8–10.
Combining Figure 4 and Eq. 11, we find that parameters
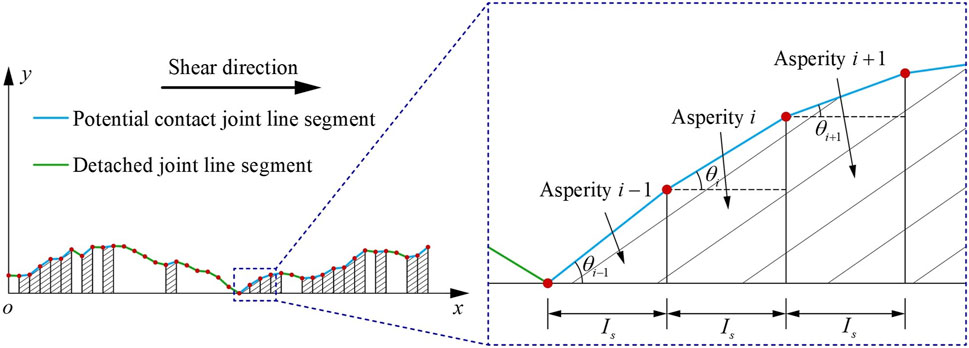
FIGURE 4. Geometric information of the potential contact asperities on the joint profile.
On the other hand, Yang and Chiang (2000) proved that the higher angle zones on the joint surface mainly controlled the mechanical behaviour. Considering this, we use the operator of root mean square to highlight the greater effects of steeper asperities on the rock joint shear strength instead of the arithmetic average when establishing the roughness characterization parameter based on all potential contact asperities on the joint profile.
Thus, a new average inclination angle parameter
Many studies found that those roughness parameters related only to the inclination angle could hardly reflect all the roughness information of rock joint profiles (Zhang et al., 2014; Liu et al., 2017; Wang et al., 2017). As shown in Figure 5A, when the horizontal projected length and inclination angle of the joint profile remain constant, the joint profile becomes flatter with the decrease in the average undulation height (i.e.,
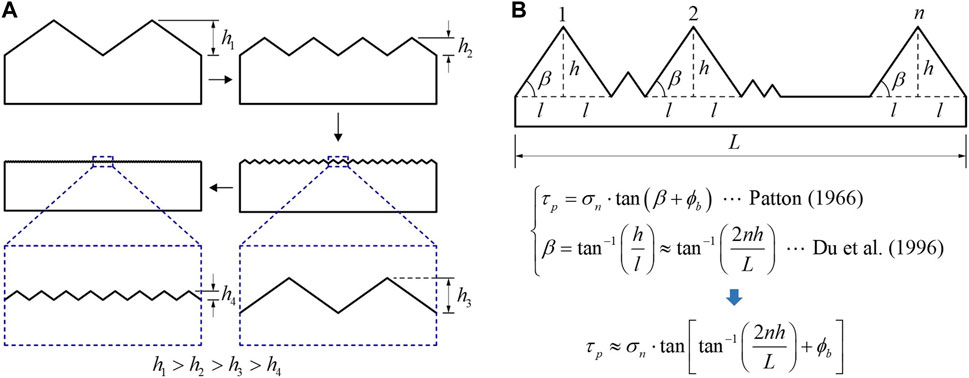
FIGURE 5. Influence of the undulation height on roughness (A) and shear strength (B) of rock joints.
Barton and Bandis (1990) used the ratio of the maximum amplitude height
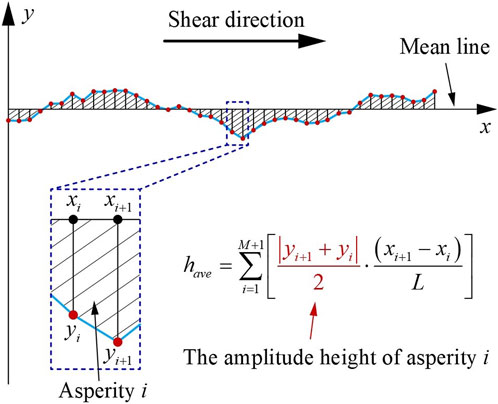
FIGURE 6. Sketch of the definition of an asperity and calculation process of the average height parameter
Similarly, to propose the roughness parameter to characterize the average undulation height with clear physical meaning, understanding the influence of asperities with different amplitude heights on the rock joint shear strength is needed. Du et al. (1996) expounded the physical meaning of the JRC straight-edge method based on the mechanism study of the mechanical effect of the climbing angle. An indication can be obtained from their study that those asperities with larger amplitude heights can provide most of the shear resistance for a rock joint during shearing (see Figure 5B). Therefore, when establishing the undulation height parameter, it is a reasonable idea to take the root-mean-square operator to highlight the greater contributions of larger amplitude heights of asperities to roughness.
Figure 7 shows the calculation process for the amplitude height of potential contact asperity
where the y-axis is the fluctuation direction of the joint profile,
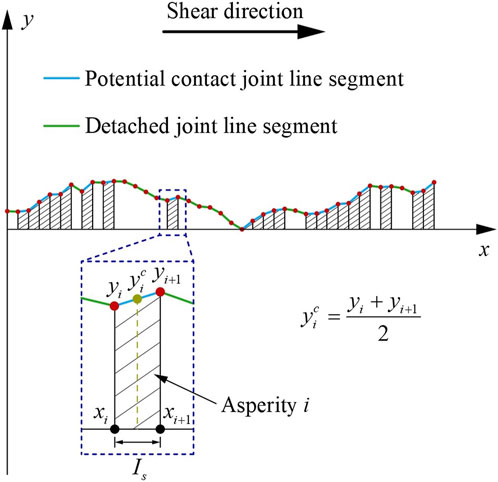
FIGURE 7. Sketch of calculation process for the amplitude height of the potential contact asperity
As described in Section 1, the JRC value obtained by comparing an actual joint profile to 10 standard joint profiles with JRC values ranging from 0 to 20 is subjective. Meanwhile, Li and Zhang (2015) found that since the dataset used by previous researchers was small (i.e., 10 standard joint profiles), the JRC value of a target joint profile may be incorrectly estimated using the equations they published. Therefore, modifying the JRC-JCS model by developing a new quantitative estimation method of JRC using a larger sample population is necessary.
In this study, a sample population composed of 112 joint profiles (including 10 standard joint profiles) studied by Li and Zhang (2015) is used to establish the relationship between the new roughness parameters proposed in Section 2 and the JRC. They also provided the coordinates of points with a sampling interval of 0.4 mm on each profile, and the JRC value of each profile was determined by back-calculation of the rock joint direct shear test using the JRC-JCS model. These rock joint profiles come from a wide variety of rock types, such as sandstone and limestone, and range from 72 to 119.6 mm in horizontal projected length.
Studies have shown that the calculation and analysis of joint profile morphological characteristics are directly affected by the sampling interval (Jang et al., 2014; Wang et al., 2019). Thus, to verify the accuracy of different methods for JRC estimation of the same joint profile obtained at a particular sampling interval, only those established on the digitized results of joint profiles with the same sampling interval should be considered. Bearing in mind that most of the previously published JRC estimation methods were established on the digitized results of joint profiles with a sampling interval of 0.5 mm (Yu and Vayssade, 1991; Yang et al., 2001; Tatone and Grasselli, 2010; Jang et al., 2014; Liu et al., 2017; Yong et al., 2018b; Zhao et al., 2018; Ban et al., 2021), 112 digitized joint profiles are resampled at 0.5 mm sampling interval using linear interpolation in this study.
The results of digitized joint profiles used as the sample population directly affect the accuracy of JRC estimation values (Jang et al., 2014). Therefore, a reliability analysis of resampled digitized results should be conducted. Here, the resampled digitized results of the 10 standard joint profiles are selected for analysis.
The root mean square parameter closely related to the JRC,
where M is the number of joint line segments, and
We compare the
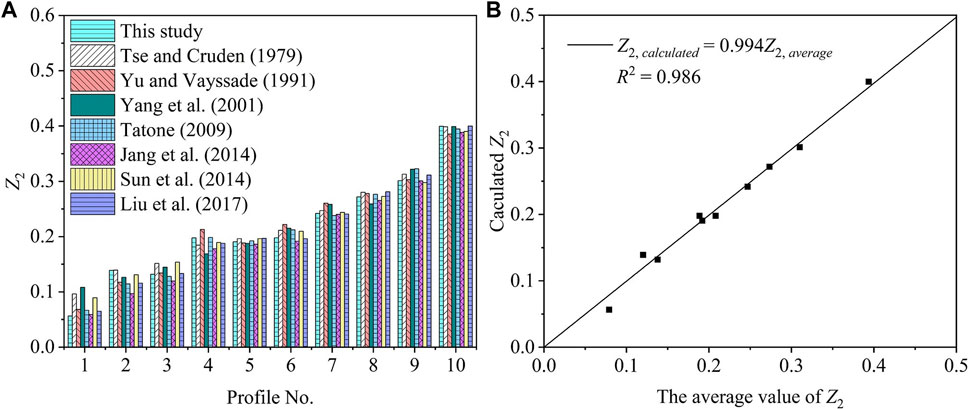
FIGURE 8. Comparison of
The more accurate the values of JRC estimated using roughness parameters are, the better the estimation of the shear strength of rock joints. For this purpose, the functional relation between new roughness parameters and JRC should be established. According to formulas 12, 13, the roughness parameters of these 112 joint profiles have been calculated, and the results for the 10 standard joint profiles among them are shown in Table 1.
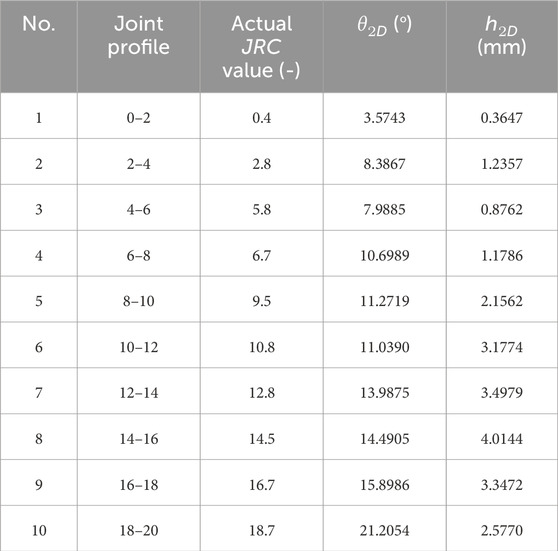
TABLE 1. Calculation results of 2D roughness parameters for 10 standard joint profiles.
The calculated results in Table 1 show that both the average inclination angle (
Based on these findings and two functional relations between roughness parameters and JRC developed in earlier studies (Liu et al., 2017; Ban et al., 2021), three function models (including two modified models and a new proposed model) are applied to fit the relationship between the variables in this study (details are shown in Table 2). A total of 102 profiles were selected from these 112 joint profiles to determine the fitting parameters in these function models. Table 2 indicates that the new function model proposed in this study can better characterize the functional relationship between the new roughness parameters and JRC. Thus, the JRC value of a target rock joint profile is suggested to be estimated by the nonlinear regression equation as following:
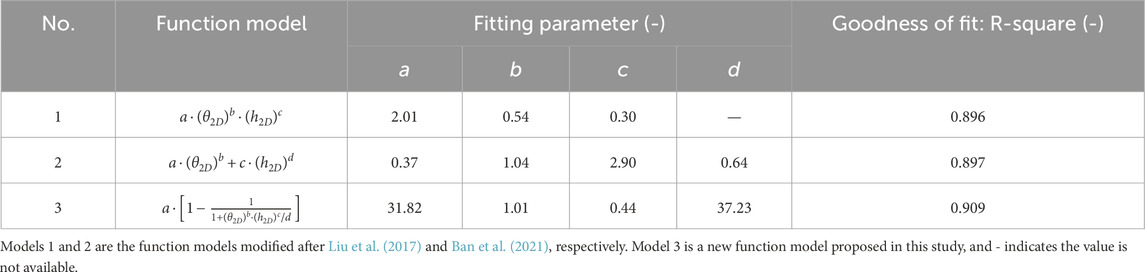
TABLE 2. Summary of the three functional relations between the new roughness parameters and the JRC of 102 joint profiles.
To visualize the fitting effect of the new proposed model, a 2D roughness index, P, is introduced as:
Figure 9 shows the correlations between P and JRC at sampling intervals of 0.5 mm and 1.0 mm. Fitting parameters b and c in Eq. 16 can be determined by Model 3 in Table 2. In addition, the data points of the remaining 10 joint profiles suggested as standard profiles by Barton and Choubey (1977) are also plotted in Figure 9A as a comparison (Zhang et al., 2014; Wang et al., 2019) to further verify the accuracy of Eq. 15 for JRC estimation. Figure 9A shows that the region formed by the predicted boundaries at 90% covers the majority of their data points. Hence, Eq. 15 can be used to accurately estimate the JRC values of the 10 standard rock joint profiles.
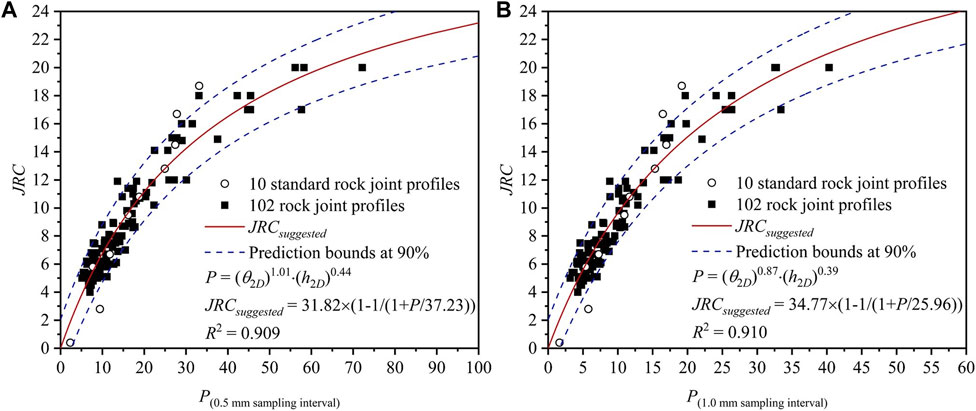
FIGURE 9. Correlations of P with JRC at sampling intervals of 0.5 mm (A) and 1.0 mm (B).
To further verify the applicability and accuracy of the new proposed JRC estimation equation, a comparison of the shear test results of 73 rock joint samples, including 10 rock joint samples with real three-dimensional (3D) joint surfaces and 63 rock joint samples with triangular asperities collected from earlier studies (Xia et al., 2014; Li et al., 2016; Liu et al., 2017; Liu et al., 2018; Wu et al., 2018), and corresponding estimated values obtained by different peak shear strength estimation models is performed. Additionally, the quantitative indices, estimation error
where
In this section, the results of direct shear tests on a total of 10 tensile joint replicas with two different types of real 3D surface morphologies under different constant normal load conditions collected from the studies of Xia et al. (2014) and Liu et al. (2017) are used. Eight peak shear strength estimation models, named Barton Models 1 to 6, Liu’s model and Tatone’s model, are introduced for comparative validation. Table 3 shows the mechanical properties of the materials used for the rock joint replicas. The two joint surface morphologies were represented by nine and fourteen joint profiles parallel to the chosen shear direction in their studies, respectively. We used GetData software to acquire the coordinate data of each joint profile at 0.5 mm sampling interval.
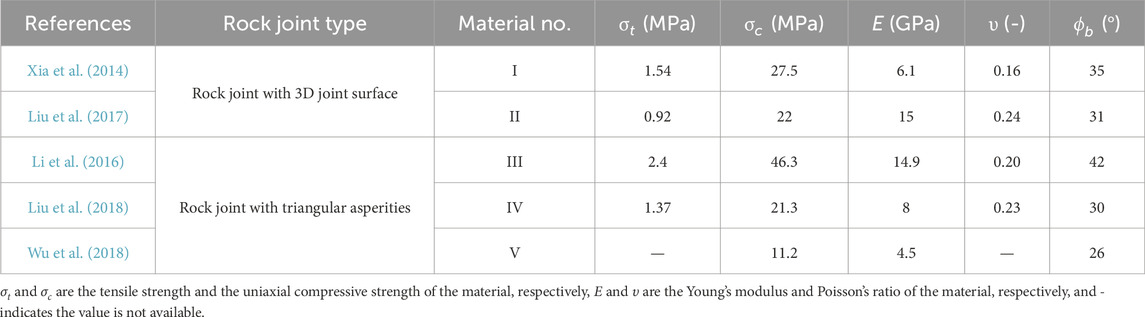
TABLE 3. Characteristics of the materials used for the physical modelling of joint specimens.
The JRC in Barton Models 1 to 6 are determined by Eq. 15, the visual comparison method (Barton and Choubey, 1977), the root mean square method (
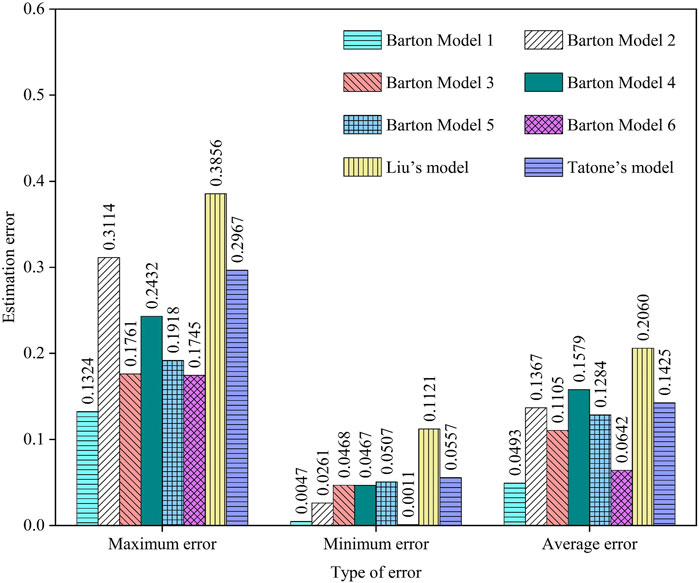
FIGURE 10. Estimation errors of peak shear strength for rock joints with real 3D joint surfaces by eight models.
Rock joints with triangular asperities are usually used for direct shear tests to obtain a better understanding of the shear mechanical behaviour of rock joints with real 3D joint surfaces (Ghazvinian et al., 2010). Li et al. (2016), Liu et al. (2018) and Wu et al. (2018) performed direct shear tests on a series of artificial joint specimens with triangular asperities under different normal stresses. In their tests, the mechanical properties of the casting materials of joint samples (i.e., material No. Ⅲ to Ⅴ) are shown in Table 3.
It should be noted that the JRC estimation methods adopted in Barton Model 5, Barton Model 6 and Liu’s model cannot be used to estimate the JRC values of this type of rock joint. For example, the roughness parameter,
where
However, the cumulative distribution of the inclination angles of the potential contact line segments on a triangular joint profile, such as a rock joint with regular triangular asperities used in the research by Liu et al. (2018) is piecewise and cannot be described by a continuous function (see Figure 11). That is, Eq. 19 cannot be used to fit the curve shown in Figure 11. Furthermore, Table 4 shows the results of estimated peak shear strength obtained by the three models mentioned above and Tatone’s model for the rock joint shown in Figure 11 under a normal stress of 0.5 MPa. The results show that it is a wrong viewpoint of using
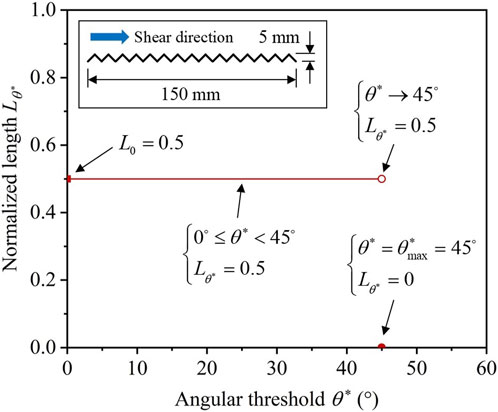
FIGURE 11.
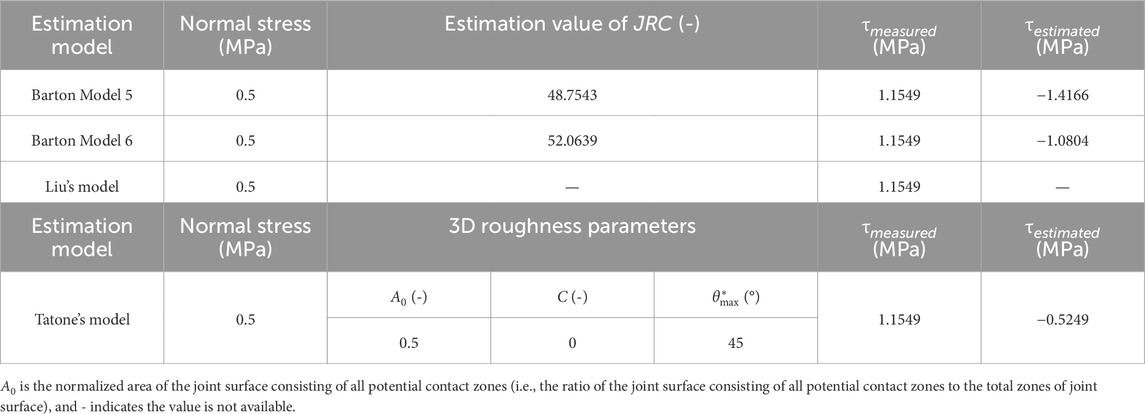
TABLE 4. Summary of estimated peak shear strengths for a rock joint with regular triangular asperities and related parameters.
Thus, Barton Model 1 and Barton Model 3 selected from Section 4.1 are used to estimate the peak shear strength of rock joints with triangular asperities. In addition, Barton Model 7 is further introduced for comparative analysis. The fractal dimension method proposed by Xie and Pariseau (1994), which is commonly used to estimate the JRC values of rock joints with triangular asperities (Indraratna et al., 1998; Ghazvinian et al., 2010; Mirzaghorbanali et al., 2014; Wu et al., 2018), is used to determine the JRC in Barton Model 7. Corresponding estimated values of peak shear strength for 63 rock joint samples with triangular asperities by these three estimation models are obtained. Then, a box diagram (see Figure 12) is further plotted for the statistical analysis of estimation errors. According to Figure 12, the box diagram for Barton Model 1 is flatter and positioned lower, indicating that the estimation errors of this model are more concentrated and closer to 0. Furthermore, the average estimation error and the estimation error of abnormal data (represented by blue rhombuses) of Barton Model 1 are lower than those of other models, which implies that the estimated results of Barton Model 1 are more accurate. Thus, Eq. 15 can also be used for accurate estimation of the roughness of rock joints with triangular asperities.
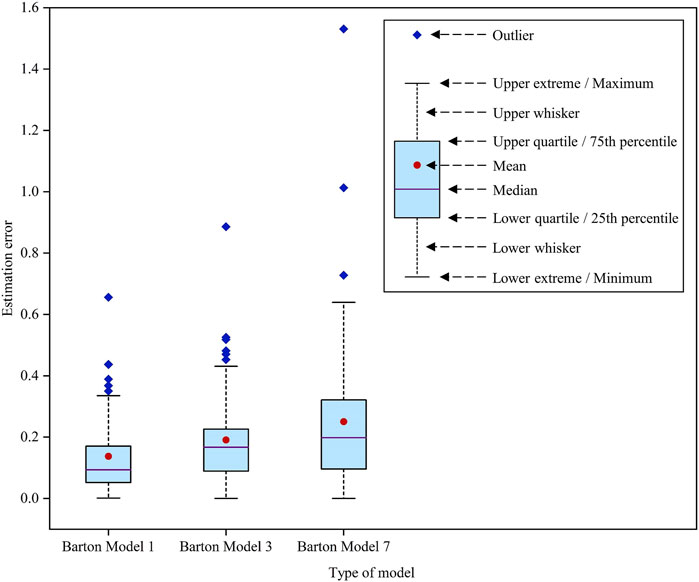
FIGURE 12. Estimation errors of peak shear strength for rock joints with triangular asperities by three models.
Studies have shown that rock joint roughness has anisotropy, i.e., the JRC varies with the shear direction (Tatone and Grasselli, 2010; Zhang et al., 2014; Wang et al., 2019). Thus, reasonable quantitative characterization parameters of 2D roughness should reflect the difference in roughness in different shear directions. The 10 standard joint profiles with a sampling interval of 0.5 mm are taken as examples to investigate whether the JRC estimation method proposed in this study can reflect the anisotropy of joint roughness. As shown in Table 5, the values of
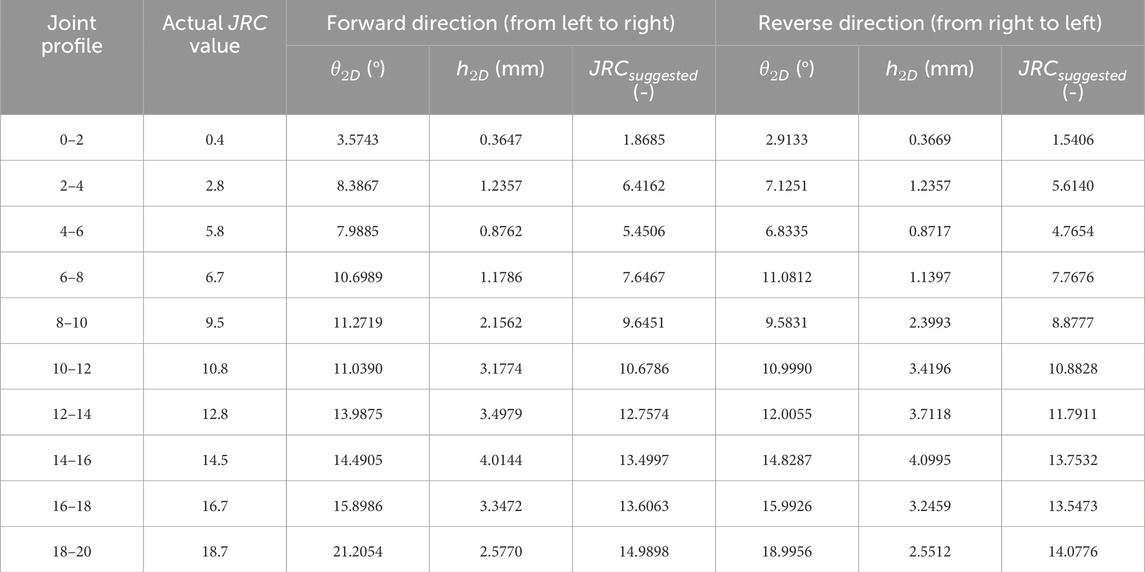
TABLE 5. Summary of
The difference in the values of
The surfaces of natural rock joints are continuous. However, the digitized joint profiles extracted from a rock joint surface can only be obtained when a certain sampling interval is applied. The morphologies of digitized joint profiles extracted from the same location on a rock joint surface at different sampling intervals are apparently different, which will lead to the difference in roughness estimation. Thus, four of the ten standard joint profiles (the actual JRC values of the four profiles are 0.4, 6.7, 12.8, and 18.7) are selected to study the sampling interval effect of roughness.
Figure 13A shows four different morphologies of the same standard joint profile whose JRC value is 12.8 at four different sampling intervals (i.e., 0.5 mm, 1.5 mm, 4.0 mm and 10.0 mm). According to Figure 13A, some features on the profile with a base length less than a certain interval have been lost with increasing sampling interval, leading to smoothing of the joint profile. The parameters
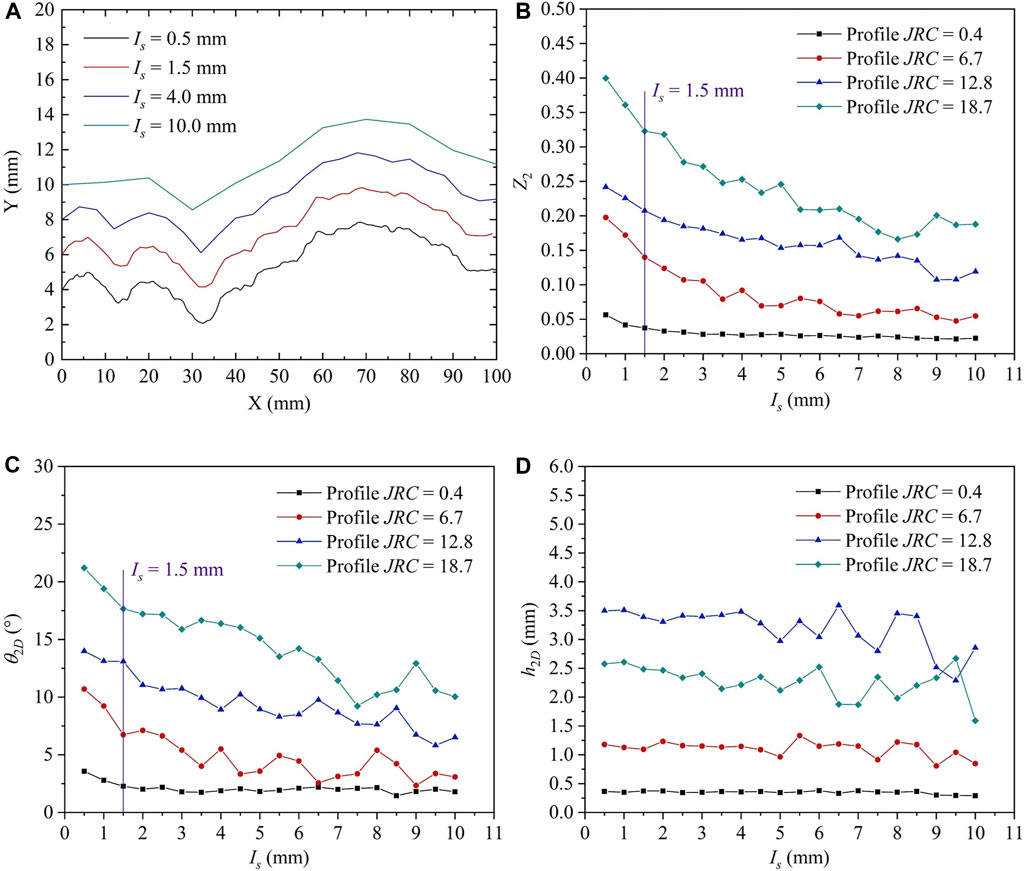
FIGURE 13. Sampling interval effect on 2D roughness of rock joints. (A) the digitized standard joint profile whose JRC value is 12.8 at four different sampling intervals, the parameters
The rock joint profiles at the laboratory scale (approximately 100 mm) have been digitized at sampling intervals of 0.25 mm (Yu and Vayssade, 1991), 0.4 mm (Li and Zhang, 2015; Wang et al., 2019), 0.5 mm (Yu and Vayssade, 1991; Yang et al., 2001; Tatone and Grasselli, 2010; Liu et al., 2017; Ban et al., 2021), 1.0 mm (Yu and Vayssade, 1991; Tatone and Grasselli, 2010) and 1.27 mm (Tse and Cruden, 1979) by previous researchers to characterize their roughness. Figure 13 also indicates that when the sampling interval adopted is greater than 1.5 mm, a significant portion of the roughness information (especially the inclination angle information) of these joint profiles have been lost. Hence, when digitizing laboratory-scale joint profiles, a sampling interval of less than 1.5 mm is recommended to obtain adequate roughness information. We further use function Model 3 mentioned in Section 3.3 to fit the relationship between the roughness parameters
The innovation of this paper is to propose two parameters with clear geometric and physical meanings to characterize the 2D roughness of rock joints. One represents the average inclination angle of all the potential asperities on the whole joint profile, and the other describes their average undulation height. Both parameters are easily obtained and closely related to the shear strength of rock joints. The roughness information of rock joint profiles can be more fully reflected by combining these two parameters. Additionally, it is significant that the new proposed nonlinear regression equation of these two parameters with JRC can accurately estimate the JRC values for realistic and triangular joint surfaces. The improved JRC estimation equation further facilitates the application of the JRC-JCS model in practice.
The limitation is that only the peak shear strength of laboratory-scale rock joints under perfectly matched conditions can be estimated by the modified model proposed in this paper (i.e., Barton Model 1). However, the joint scale and the joint matching degree significantly affect the peak shear strength of rock joints (Zhao, 1997; Johansson, 2016; Ríos-Bayona et al., 2021). Therefore, investigations on the estimation models for the peak shear strength of rock joints on the site scale when considering the joint matching degree are urgent.
Determining the accurate JRC is critical when using the JRC-JCS model to estimate the peak shear strength of rock joints. Thus, this paper focused on the quantitative characterization parameters for 2D roughness of rock joints and their correlation with JRC. Several key conclusions can be drawn as follows.
(1) Two new roughness parameters with clear geometric and physical meaning for 2D rock joint profiles have been proposed. One of them can reflect the average inclination angle characteristic of a joint profile, and the other can characterize its average undulation height. Both parameters are closely related to the shear strength of rock joints and reflect well the anisotropic property of the joint roughness. Furthermore, these two 2D roughness parameters are easily to be understood and obtained.
(2) A new nonlinear regression equation for estimating 2D joint roughness coefficient was proposed. The nonlinear regression equation was established by analysing 102 rock joint profiles at a sampling interval of 0.5 mm. It was verified that the proposed equation could give accurate JRC estimation values of the 10 standard profiles of rock joints. Considering the sampling interval effect of joint roughness, another nonlinear regression equation that could be applied to estimate the JRC values of joint profiles at 1.0 mm sampling interval was provided.
(3) The new proposed nonlinear regression equation is suitable for the JRC estimation of rock joints with real 3D joint surfaces and triangular asperities. The estimated values of the peak shear strength acquired by using the Barton Model 1 and other models are analysed in comparison with the corresponding experimental values for 73 rock joints. According to the comparative analysis results, the average estimation error of the Barton Model 1 is smaller than that of the other models, which indicates that the proposed equation is quite accurate for estimating the JRC of rock joints.
Publicly available datasets were analyzed in this study. This data can be found here: http://dx.doi.org/10.1016/j.ijrmms.2015.03.016.
CH: Writing–original draft, Writing–review and editing. HT: Writing–review and editing. KF: Writing–review and editing. SS: Writing–review and editing.
The author(s) declare financial support was received for the research, authorship, and/or publication of this article. This research was supported by the National Key Scientific Instrument and Equipment Development Projects of China (No. 41827808), the Major Program of National Natural Science Foundation of China (No. 42090055) and the National Natural Science Foundation of China (Grant No. 42177147).
The authors declare that the research was conducted in the absence of any commercial or financial relationships that could be construed as a potential conflict of interest.
All claims expressed in this article are solely those of the authors and do not necessarily represent those of their affiliated organizations, or those of the publisher, the editors and the reviewers. Any product that may be evaluated in this article, or claim that may be made by its manufacturer, is not guaranteed or endorsed by the publisher.
The Supplementary Material for this article can be found online at: https://www.frontiersin.org/articles/10.3389/feart.2024.1367778/full#supplementary-material
An, P., Yong, R., Song, J., Du, S., Wang, C., Xu, H., et al. (2024). Exploring the potential of smartphone photogrammetry for field measurement of joint roughness. Measurement 225, 114055. doi:10.1016/j.measurement.2023.114055
Bae, D., Kim, K., Koh, Y., and Kim, J. (2011). Characterization of joint roughness in granite by applying the scan circle technique to images from a borehole televiewer. Rock Mech. Rock Eng. 44 (4), 497–504. doi:10.1007/s00603-011-0134-9
Bahaaddini, M., Sharrock, G., and Hebblewhite, B. (2013). Numerical direct shear tests to model the shear behaviour of rock joints. Comput. Geotech. 51, 101–115. doi:10.1016/j.compgeo.2013.02.003
Ban, L., Du, W., and Qi, C. (2020a). A modified roughness index based on the root mean square of the first derivative and its relationship with peak shear strength of rock joints. Eng. Geol. 279, 105898. doi:10.1016/j.enggeo.2020.105898
Ban, L., Du, W., Qi, C., and Zhu, C. (2021). Modified 2D roughness parameters for rock joints at two different scales and their correlation with JRC. Int. J. Rock Mech. Min. Sci. 137, 104549. doi:10.1016/j.ijrmms.2020.104549
Ban, L., Qi, C., Chen, H., Yan, F., and Ji, C. (2020b). A new criterion for peak shear strength of rock joints with a 3D roughness parameter. Rock Mech. Rock Eng. 53, 1755–1775. doi:10.1007/s00603-019-02007-z
Barton, N. (1973). Review of a new shear-strength criterion for rock joints. Eng. Geol. 7 (4), 287–332. doi:10.1016/0013-7952(73)90013-6
Barton, N. (1978). Suggested methods for the quantitative description of discontinuities in rock masses. Int. J. Rock Mech. Min. Sci. Geomech. Abstr. 15 (6), 319–368. doi:10.1016/0148-9062(78)91472-9
Barton, N., and Bandis, S. (December 1990). “Review of predictive capabilities of JRC-JCS model in engineering practice,” in proceedings of the international symposium on rock joints. New York, Ny, USA,
Barton, N., and Choubey, V. (1977). The shear strength of rock joints in theory and practice. Rock Mech. 10, 1–54. doi:10.1007/BF01261801
Barton, N., Wang, C., and Yong, R. (2023). Advances in joint roughness coefficient (JRC) and its engineering applications. J. Rock Mech. Geotech. Eng. 15, 3352–3379. doi:10.1016/j.jrmge.2023.02.002
Cai, Y., Tang, H., Ge, Y., Zhang, S., and Tan, Q. (2017). A new evaluation method for three-dimensional surface roughness of rock mass discontinuity. Chin. J. Rock Mech. Eng. 36, 1101–1110. doi:10.13722/j.cnki.jrme.2016.0951
Cheng, C., Chen, X., and Zhang, S. (2016). Multi-peak deformation behavior of jointed rock mass under uniaxial compression: insight from particle flow modeling. Eng. Geol. 213, 25–45. doi:10.1016/j.enggeo.2016.08.010
Du, S., Chen, Y., and Fan, L. (1996). Mathematical expression of JRC modified straight edge. J. Geo. Eng. 4 (2), 36–43.
Fathipour-Azar, H. (2021). Data-driven estimation of joint roughness coefficient. J. Rock Mech. Geotech. Eng. 13 (6), 1428–1437. doi:10.1016/j.jrmge.2021.09.003
Ge, Y., Kulatilake, P., Tang, H., and Xiong, C. (2014). Investigation of natural rock joint roughness. Comput. Geotech. 55, 290–305. doi:10.1016/j.compgeo.2013.09.015
Ghazvinian, A., Taghichian, A., Hashemi, M., and Mar’ashi, S. (2010). The shear behavior of bedding planes of weakness between two different rock types with high strength difference. Rock Mech. Rock Eng. 43, 69–87. doi:10.1007/s00603-009-0030-8
Grasselli, G. (2001). Shear strength of rock joints based on quantified surface description. Toronto, Canada: University of Toronto. doi:10.5075/epfl-thesis-2404
Grasselli, G., Wirth, J., and Egger, P. (2002). Quantitative three-dimensional description of a rough surface and parameter evolution with shearing. Int. J. Rock Mech. Min. Sci. 39 (6), 789–800. doi:10.1016/S1365-1609(02)00070-9
Hong, E., Lee, J., and Lee, I. (2008). Underestimation of roughness in rough rock joints. Int. J. Numer. Anal. Methods Geomech. 32, 1385–1403. doi:10.1002/nag.678
Indraratna, B., Haque, A., and Aziz, N. (1998). Laboratory modelling of shear behaviour of soft joints under constant normal stiffness conditions. Geotech. Geol. Eng. 16, 17–44. doi:10.1023/A:1008880112926
Jang, B., Jang, H., and Park, H. (2006). A new method for determination of joint roughness coefficient, https://media.geolsoc.org.uk/iaeg2006/PAPERS/IAEG_095.PDF.
Jang, H., Kang, S., and Jang, B. (2014). Determination of joint roughness coefficients using roughness parameters. Rock Mech. Rock Eng. 47, 2061–2073. doi:10.1007/s00603-013-0535-z
Jiang, M., Jiang, T., Crosta, G., Shi, Z., Chen, H., and Zhang, N. (2015). Modeling failure of jointed rock slope with two main joint sets using a novel DEM bond contact model. Eng. Geol. 193, 79–96. doi:10.1016/j.enggeo.2015.04.013
Jiang, Y., Li, B., and Tanabashi, Y. (2006). Estimating the relation between surface roughness and mechanical properties of rock joints. Int. J. Rock Mech. Min. Sci. 43 (6), 837–846. doi:10.1016/j.ijrmms.2005.11.013
Johansson, F. (2016). Influence of scale and matedness on the peak shear strength of fresh, unweathered rock joints. Int. J. Rock Mech. Min. Sci. 82, 36–47. doi:10.1016/j.ijrmms.2015.11.010
Kulatilake, P., Balasingam, P., Park, J., and Morgan, R. (2006). Natural rock joint roughness quantification through fractal techniques. Geotech. Geol. Eng. 24, 1181–1202. doi:10.1007/s10706-005-1219-6
Lee, H., Park, Y., Cho, T., and You, K. (2001). Influence of asperity degradation on the mechanical behavior of rough rock joints under cyclic shear loading. Int. J. Rock Mech. Min. Sci. 38 (7), 967–980. doi:10.1016/S1365-1609(01)00060-0
Lee, Y., Carr, J., Barr, D., and Haas, C. (1990). The fractal dimension as a measure of the roughness of rock discontinuity profiles. Int. J. Rock Mech. Min. Sci. Geomech. Abstr. 27 (6), 453–464. doi:10.1016/0148-9062(90)90998-H
Leichnitz, W. (1985). Mechanical properties of rock joints. Int. J. Rock Mech. Min. Sci. Geomech. Abstr. 22 (5), 313–321. doi:10.1016/0148-9062(85)92063-7
Li, Y., and Huang, R. (2015). Relationship between joint roughness coefficient and fractal dimension of rock fracture surfaces. Int. J. Rock Mech. Min. Sci. 75, 15–22. doi:10.1016/j.ijrmms.2015.01.007
Li, Y., Oh, J., Mitra, R., and Hebblewhite, B. (2016). Experimental studies on the mechanical behaviour of rock joints with various openings. Rock Mech. Rock Eng. 49, 837–853. doi:10.1007/s00603-015-0781-3
Li, Y., Tang, C., Li, D., and Wu, C. (2020). A new shear strength criterion of three-dimensional rock joints. Rock Mech. Rock Eng. 53, 1477–1483. doi:10.1007/s00603-019-01976-5
Li, Y., Xu, Q., and Aydin, A. (2017). Uncertainties in estimating the roughness coefficient of rock fracture surfaces. Bull. Eng. Geol. Environ. 76, 1153–1165. doi:10.1007/s10064-016-0994-z
Li, Y., and Zhang, Y. (2015). Quantitative estimation of joint roughness coefficient using statistical parameters. Int. J. Rock Mech. Min. Sci. 77, 27–35. doi:10.1016/j.ijrmms.2015.03.016
Liu, Q., Tian, Y., Ji, P., and Ma, H. (2018). Experimental investigation of the peak shear strength criterion based on three-dimensional surface description. Rock Mech. Rock Eng. 51, 1005–1025. doi:10.1007/s00603-017-1390-0
Liu, Q., Tian, Y., Liu, D., and Jiang, Y. (2017). Updates to JRC-JCS model for estimating the peak shear strength of rock joints based on quantified surface description. Eng. Geol. 228, 282–300. doi:10.1016/j.enggeo.2017.08.020
Liu, X., Zhu, W., Yu, Q., Chen, S., and Li, R. (2017). Estimation of the joint roughness coefficient of rock joints by consideration of two-order asperity and its application in double-joint shear tests. Eng. Geol. 220, 243–255. doi:10.1016/j.enggeo.2017.02.012
Maerz, N., Franklin, J., and Bennett, C. (1990). Joint roughness measurement using shadow profilometry. Int. J. Rock Mech. Min. Sci. Geomech. Abstr. 27 (5), 329–343. doi:10.1016/0148-9062(90)92708-M
Mirzaghorbanali, A., Nemcik, J., and Aziz, N. (August 2014). “A study on the shear behaviour of infilled rock joints under cyclic loading and constant normal stiffness conditions,” in Proceedings of the 2014 coal operators' conference (wollongong), wollongong, Australia, 210–215.
Myers, N. (1962). Characterization of surface roughness. Wear 5 (3), 182–189. doi:10.1016/0043-1648(62)90002-9
Ríos-Bayona, F., Johansson, F., and Mas-Ivars, D. (2021). Prediction of peak shear strength of natural, unfilled rock joints accounting for matedness based on measured aperture. Rock Mech. Rock Eng. 54, 1533–1550. doi:10.1007/s00603-020-02340-8
Sanei, M., Faramarzi, L., Fahimifar, A., Goli, S., Mehinrad, A., and Rahmati, A. (2015). Shear strength of discontinuities in sedimentary rock masses based on direct shear tests. Int. J. Rock Mech. Min. Sci. 75, 119–131. doi:10.1016/j.ijrmms.2014.11.009
Serrano, A., Olalla, C., and Galindo, R. (2014). Micromechanical basis for shear strength of rock discontinuities. Int. J. Rock Mech. Min. Sci. 70, 33–46. doi:10.1016/j.ijrmms.2014.02.021
Song, J., Du, S., Yong, R., Wang, C., and An, P. (2023). Drone photogrammetry for accurate and efficient rock joint roughness assessment on steep and inaccessible slopes. Remote Sens. 15 (19), 4880. doi:10.3390/rs15194880
Sun, F., She, C., and Wan, L. (2014). Research on relationship between JRC of Barton’s standard profiles and statistics parameters independent of sampling interval. Chin. J. Rock Mech. Eng. 33, 3539–3544. doi:10.13722/j.cnki.jrme.2014.s2.018
Tang, H., Ge, Y., Wang, L., Yuan, Y., Huang, L., and Sun, M. (2012). Study on estimation method of rock mass discontinuity shear strength based on three-dimensional laser scanning and image technique. J. Earth Sci. 23 (6), 908–913. doi:10.1007/s12583-012-0301-2
Tatone, B. (2009). Quantitative characterization of natural rock discontinuity roughness in-situ and in the laboratory. Toronto, Canada: University of Toronto.
Tatone, B., and Grasselli, G. (2010). A new 2D discontinuity roughness parameter and its correlation with JRC. Int. J. Rock Mech. Min. Sci. 47 (8), 1391–1400. doi:10.1016/j.ijrmms.2010.06.006
Tatone, B., Grasselli, G., and Cottrell, B. (2010). “Accounting for the influence of measurement resolution on discontinuity roughness estimates,” http://www.onepetro.org/conference-paper/ISRM-EUROCK-2010-042.
Tse, R., and Cruden, D. (1979). Estimating joint roughness coefficients. Int. J. Rock Mech. Min. Sci. Geomech. Abstr. 16 (5), 303–307. doi:10.1016/0148-9062(79)90241-9
Wang, C., Wang, L., and Karakus, M. (2019). A new spectral analysis method for determining the joint roughness coefficient of rock joints. Int. J. Rock Mech. Min. Sci. 113, 72–82. doi:10.1016/j.ijrmms.2018.11.009
Wang, L., Wang, C., Khoshnevisan, S., Ge, Y., and Sun, Z. (2017). Determination of two-dimensional joint roughness coefficient using support vector regression and factor analysis. Eng. Geol. 231, 238–251. doi:10.1016/j.enggeo.2017.09.010
Wang, Y., Tang, H., Huang, J., Wen, T., Ma, J., and Zhang, J. (2022). A comparative study of different machine learning methods for reservoir landslide displacement prediction. Eng. Geol. 298, 106544. doi:10.1016/j.enggeo.2022.106544
Wen, T., Tang, H., Huang, L., Wang, Y., and Ma, J. (2020). Energy evolution: a new perspective on the failure mechanism of purplish-red mudstones from the Three Gorges Reservoir area, China. Eng. Geol. 264, 105350. doi:10.1016/j.enggeo.2019.105350
Wen, T., Wang, Y., Tang, H., Zhang, J., and Hu, M. (2023). Damage evolution and failure mechanism of red-bed rock under drying–wetting cycles. Water 15 (15), 2684. doi:10.3390/w15152684
Wu, Q., and Kulatilake, P. (2012). REV and its properties on fracture system and mechanical properties, and an orthotropic constitutive model for a jointed rock mass in a dam site in China. Comput. Geotech. 43, 124–142. doi:10.1016/j.compgeo.2012.02.010
Wu, Q., Liu, Y., Tang, H., Kang, J., Wang, L., Li, C., et al. (2023). Experimental study of the influence of wetting and drying cycles on the strength of intact rock samples from a red stratum in the Three Gorges Reservoir area. Eng. Geol. 314, 107013. doi:10.1016/j.enggeo.2023.107013
Wu, Q., Xu, Y., Tang, H., Fang, K., Jiang, Y., Liu, C., et al. (2018). Investigation on the shear properties of discontinuities at the interface between different rock types in the Badong formation, China. Eng. Geol. 245, 280–291. doi:10.1016/j.enggeo.2018.09.002
Xia, C., Tang, Z., Xiao, W., and Song, Y. (2014). New peak shear strength criterion of rock joints based on quantified surface description. Rock Mech. Rock Eng. 47 (2), 387–400. doi:10.1007/s00603-013-0395-6
Xie, H., and Pariseau, W. (1994). Fractal estimation of joint roughness coefficients. Chin. Sci. Abstr. Ser. B 255.
Yang, Z., and Chiang, D. (2000). An experimental study on the progressive shear behavior of rock joints with tooth-shaped asperities. Int. J. Rock Mech. Min. Sci. 37 (8), 1247–1259. doi:10.1016/S1365-1609(00)00055-1
Yang, Z., Lo, S., and Di, C. (2001). Reassessing the joint roughness coefficient (JRC) estimation using Z2. Rock Mech. Rock Eng. 34, 243–251. doi:10.1007/s006030170012
Yong, R., Ye, J., Li, B., and Du, S. (2018a). Determining the maximum sampling interval in rock joint roughness measurements using Fourier series. Int. J. Rock Mech. Min. Sci. 101, 78–88. doi:10.1016/j.ijrmms.2017.11.008
Yong, R., Ye, J., Liang, Q., Huang, M., and Du, S. (2018b). Estimation of the joint roughness coefficient (JRC) of rock joints by vector similarity measures. Bull. Eng. Geol. Environ. 77, 735–749. doi:10.1007/s10064-016-0947-6
Yu, X., and Vayssade, B. (1991). Joint profiles and their roughness parameters. Int. J. Rock Mech. Min. Sci. Geomech. Abstr. 28 (4), 333–336. doi:10.1016/0148-9062(91)90598-G
Zhang, G., Karakus, M., Tang, H., Ge, Y., and Zhang, L. (2014). A new method estimating the 2D joint roughness coefficient for discontinuity surfaces in rock masses. Int. J. Rock Mech. Min. Sci. 72, 191–198. doi:10.1016/j.ijrmms.2014.09.009
Zhang, J., Lin, C., Tang, H., Wen, T., Tannant, D., and Zhang, B. (2024a). Input-parameter optimization using a SVR based ensemble model to predict landslide displacements in a reservoir area–A comparative study. Appl. Soft Comput. 150, 111107. doi:10.1016/j.asoc.2023.111107
Zhang, J., Tang, H., Li, C., Gong, W., Zhou, B., and Zhang, Y. (2024b). Deformation stage division and early warning of landslides based on the statistical characteristics of landslide kinematic features. Landslides, 1–19. doi:10.1007/s10346-023-02192-7
Zhang, W., Lin, S., Wang, L., Wang, L., Jiang, X., and Wang, S. (2024). A novel creep contact model for rock and its implement in discrete element simulation. Comput. Geotech. 167, 106054. doi:10.1016/j.compgeo.2023.106054
Zhang, X., Jiang, Q., Chen, N., Wei, W., and Feng, X. (2016). Laboratory investigation on shear behavior of rock joints and a new peak shear strength criterion. Rock Mech. Rock Eng. 49 (9), 3495–3512. doi:10.1007/s00603-016-1012-2
Zhao, J. (1997). Joint surface matching and shear strength part B: JRC-JMC shear strength criterion. Int. J. Rock Mech. Min. Sci. 34 (2), 179–185. doi:10.1016/S0148-9062(96)00063-0
Keywords: rock joint, joint roughness coefficient (JRC), 2D roughness parameter, geometric and physical meaning, peak shear strength
Citation: He C, Tang H, Fang K and Sun S (2024) New 2D roughness parameters with geometric and physical meanings for rock joints and their correlation with joint roughness coefficient. Front. Earth Sci. 12:1367778. doi: 10.3389/feart.2024.1367778
Received: 09 January 2024; Accepted: 02 February 2024;
Published: 20 February 2024.
Edited by:
Tao Wen, Yangtze University, ChinaReviewed by:
Luqi Wang, Chongqing University, ChinaCopyright © 2024 He, Tang, Fang and Sun. This is an open-access article distributed under the terms of the Creative Commons Attribution License (CC BY). The use, distribution or reproduction in other forums is permitted, provided the original author(s) and the copyright owner(s) are credited and that the original publication in this journal is cited, in accordance with accepted academic practice. No use, distribution or reproduction is permitted which does not comply with these terms.
*Correspondence: Huiming Tang, dGFuZ2htQGN1Zy5lZHUuY24=
Disclaimer: All claims expressed in this article are solely those of the authors and do not necessarily represent those of their affiliated organizations, or those of the publisher, the editors and the reviewers. Any product that may be evaluated in this article or claim that may be made by its manufacturer is not guaranteed or endorsed by the publisher.
Research integrity at Frontiers
Learn more about the work of our research integrity team to safeguard the quality of each article we publish.