 Chao Hu
 Yong-hong Zeng
- China Railway Eryuan Engineering Group Co., Ltd., Chengdu, China
There are numerous slope projects involved in railway and highway constructions, and ensuring the stability of slopes, especially those with cracks, is very important. Compared with the limit equilibrium method, the limit analysis method takes into account the soil’s stress-strain behavior and boundary conditions, thereby yielding more rigorous and accurate results. The stability of slopes with cracks was examined using the finite element limit analysis method in this study. Results indicate that the stability of the slope decreases with the crack length, especially for slope with small slope ratio (i.e., α ≤ 1:1.5) and when lc/H exceeds 25%. The influence of crack inclination angle on slope stability increases with crack length, and the safety factor is larger in cases of negative inclination value cases as compared to those in positive inclination value cases when lc/H ≥ 0.33. Values of safety factor are larger in cases of slope with reinforcement as compared to those without reinforcement, and the values of F increase by about 20%. Additionally, the slip planes for slopes with reinforcement are located 10% further away from the slope surface compared to those without reinforcement, and reinforcements enhance the slope integrity.
1 Introduction
Numerous slope projects have been currently encountered in railway and highway constructions. Meanwhile, researchers have conducted many meaningful research on slope stability. For instance, Zhang (2022) conducted an assessment of rainfall erosion on embankment slopes in desert areas, and they also designed corresponding monitoring plans to monitor the displacement of the slope. Dick et al. (2015) reported an early-warning time-of–failure method to help analyze the stability and performance of open-pit mine slopes.
Numerous experimental researches have been carried out to investigate the performance of slopes with cracks. Zhang et al. (2009) conducted centrifuge model tests on slopes and utilized an image analysis system to measure slope deformation during loading. They found that tensional cracks occurring at the top of the slope led to localized strain and reduced slope stability. Lin et al. (2015) reported tilting platform model test results on Jinping dam. They found that the stability of the model decreased with the number of cracks, and cracks mainly formed along faults and propagated along structural weak planes. Mehrjardi et al. (2016) conducted a series of reduced scale model tests to investigate the bearing capacity of slopes under footing load. They observed cracks around the loading plate during the tests, and they also concluded that reinforcements could improve slope performance. Zhou et al. (2020) reported large-scale model tests results on the progressive failure of cracked slopes subjected to rainfall. They found that the preferential flow in the cracks had a significant influence on the instability of slopes. Yin et al. (2023) conducted a comprehensive model test using a tilting platform to examine the characteristics of slope failure. They categorized the slope failure process into three stages. The first stage entailed a deformation phase characterized by scattered local cracks. This was followed by a destabilization stage marked by primary cracks. Finally, the retrogressive failure stage occurred, characterized by a proliferation of secondary crack.
Numerical methods are a more convenient and economic way as compared to the experimental methods above. Chen et al. (2014) reported results on the stability of expansive soil slopes using different limit equilibrium methods. They found that the generation of cracks significantly affected the stability of the slopes, especially when the influence of water was considered. Mukhlisin and Khiyon (2018) investigated the crack location, size, and depth on slop stability using GEO STUDIO 2007 software. They found that safety factors decrease sharply when cracks were located adjacent to the slope crest. Jamalinia et al. (2020) investigated the influence of evaporation on cracked slopes using a finite element method. They found that the presence of cracks could affect the water flux into the slope, which reduced the shear strength and the slope safety factor. Stockton et al. (2019) proposed a limit equilibrium method to analyze the influence of cracks on slop stability, where the cohesion and friction anisotropy were both considered. They concluded that the shearing strength anisotropy had a significant influence on the tension crack formation and slope stability. They also found that in the case of anisotropic conditions with a horizontally weak plane, the slop failure surface tended to become elongated in the horizontal direction, resulting in a decrease of the tension crack depth. Sari et al. (2023) investigated the influence of drainage PVC pipe installed lengthwise into the slope on cracked slope using coupled programs SEEP/W and SLOPE/W. They concluded that the use of PVC pipe could increase the safety factor up to 7.7% for cracked slopes with weak layers.
Among the various numerical methods discussed above, the limit equilibrium method is more popular for designer as compared to numerical simulation methods, and it is recommended in most current specifications. However, the constitutive behavior of soil and boundary conditions can not be considered in this method. In recent years, the limit analysis method has been used in geotechnical engineering (Krabbenhoft et al., 2015; Jamalinia et al., 2020; Xu et al., 2020; Gao et al., 2021). Unlike the limit equilibrium method, the stress - strain relationship can be considered, resulting in a more accurate and rigorous solution (Sloan, 2013). However, to the authors’ best knowledge, the application of this method to cracked slopes is rarely reported in academic literatures.
In summary, cracks have a significant influence on slope stability. However, there is still limited research on numerical analysis of slopes with cracks, especially using the limit analysis method. Therefore, this study utilizes the finite element limit analysis method to investigate the stability of slopes with cracks, and then analyze the influences of crack length, inclination angle, strength, and reinforcement on slope stability and the shape of the failure surface. The results could help to enhance the comprehension of the stability of slope with cracks.
2 Limit analysis method
2.1 Upper bound theorem
Limit analysis can be classified into two categories: upper bound analysis and lower bound analysis. The former is particularly effective in analyzing the failure mechanism of slopes (Sloan, 2013). According to the upper bound theorem, the limit load, which is the minimum value among all the loads corresponding to admissible velocity fields, can be mathematically expressed as Eq. 1:
where S and V are the surface area and volume region, respectively; Ti and fi are surface forces and body forces, respectively; vi is the admissible velocity corresponding to the failure mechanism; and σij and εij are stress and strain, respectively.
The yield criterion can be described using the Mohr-Coulomb model and considering non-flow criterion for soils, which can be expressed as Eqs 2, 3:
where Y is the yield function; σ1 and σ3 are the maximum and minimum stresses, respectively; ψ is the dilation angle; c and ϕ are the cohesion strength and friction angle, respectively; and c* and ϕ* are the cohesion strength and friction angle influenced by the dilation angle, respectively.
The factor of safety, F is expressed as Eq. 4:
where c, and ϕ, are reduced cohesion strength and friction angle, respectively.
Although limit analysis method is a powerful method in geotechnical stability analysis as explained above, they still have limitations due to the need for assuming the shape of slip planes before calculation. To address this limitation, Sloan (2013) proposed the finite element limit analysis method, which combines the benefits of finite element method and limit analysis method to determine the safety factor through an automated search process. Furthermore, by incorporating mesh adaptive techniques into the calculation, it enables to identify slip plane directly. In the finite element limit analysis method, the object domain is discretized using nonlinear elements. Subsequently, the solution is transformed into an optimization problem, represented by the following (Eq. 5):
where σ is a global vector of stresses;
In this study, the computational analysis was conducted using the software OptumG2 (Krabbenhoft et al., 2015), where the crack was modeled by the Shear Joint element with smaller strength than adjacent soil. OptumG2 is a finite element program that offers various analysis types, including limit analysis and elastoplastic deformation analysis. The unique feature of OptumG2 lies in its implementation of the former analysis, which is based on the limit analysis theorem. This method provides a more efficient and convenient way for directly analyzing geotechnical stability, in contrast to the traditional elastoplastic methods and limit equilibrium methods. Moreover, OptumG2 enables the acquisition of rigorous lower and upper bounds, which help to bracket the true solution from below and above. In terms of modeling capabilities, the software facilitates easy and intuitive geometry modeling by automatically recognizing intersections, closed surfaces, and other relevant features. Additionally, OptumG2 offers a range of constitutive models and special elements specifically designed for modeling interfaces, reinforcements, and joints. For further information regarding OptumG2, more details can be referred to Krabbenhoft et al. (2015). For detailed calculation principles and software features, readers can refer to references Sloan (2013) and Xu et al. (2018).
2.2 Validation
In the following sections, the factor of safety, F, and the corresponding slip planes were determined using the flowchart illustrated in Figure 1.
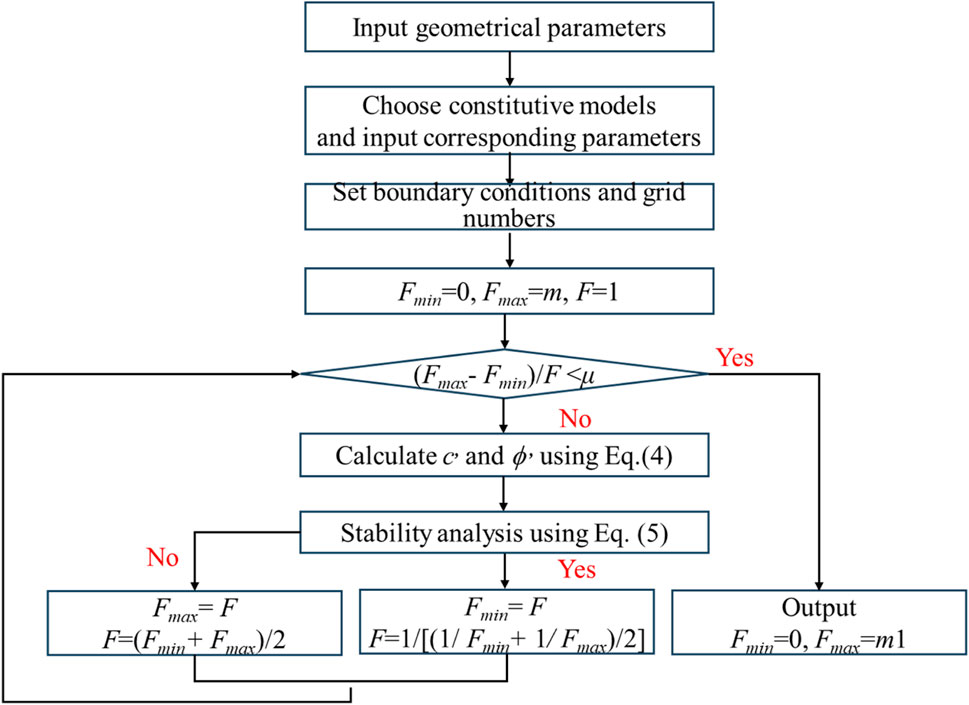
FIGURE 1. Flowchart to calculate F.
Gao et al. (2005) reported centrifuge model tests results on a slope with three layers. The dimension of the slope and shear strength of soils are shown in Figure 2A. The slope model in the centrifuge test was accelerated to 60 g, and vertical cracks were observed at the top of the slop. The slip planes from the centrifuge model test and the proposed method in this study are shown in Figure 2A. Results in Figure 2A indicate that the shape of the slip planes from the proposed method are consistent with those from the model tests.
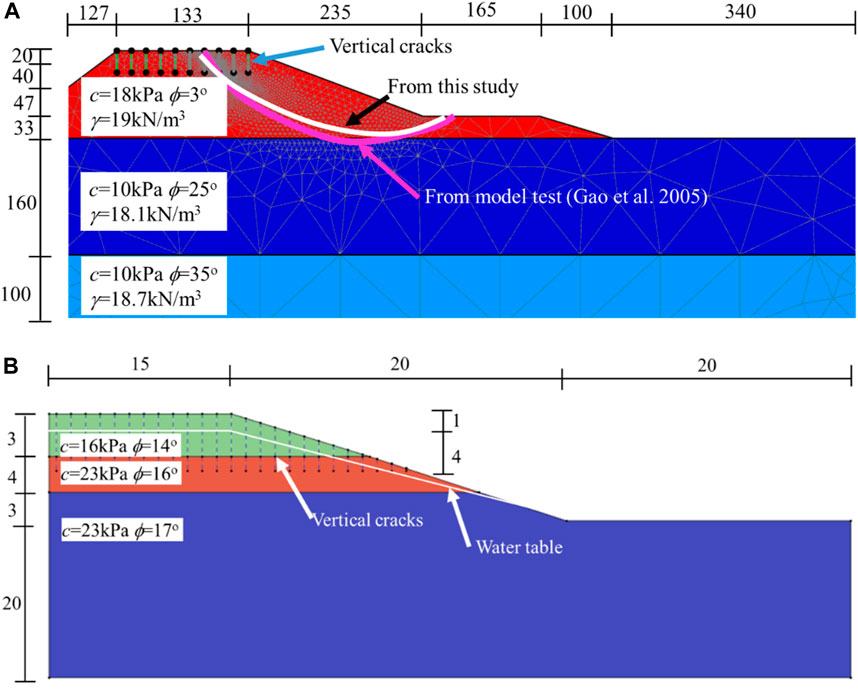
FIGURE 2. (A) Comparison of the slip planes from different method (Unit: m); (B) Schematic diagram of the slope model with cracks (Chen et al., 2014; unit: m).
Chen et al. (2014) performed a numerical analysis on a slope with cracks using different limit equilibrium methods implemented in the Sliding software. The slope, as depicted in Figure 2B, has a height of 30 m and consists of three layers with parameters listed in Table 1. The maximum length of the vertical crack is 5 m. The cohesive strength and friction angle of the cracks were taken as 14 kPa and 4° in numerical analysis (Chen et al., 2014). The vertical crack located at the top of the slope with a depth of 5 m and a horizontal spacing of 1 m.
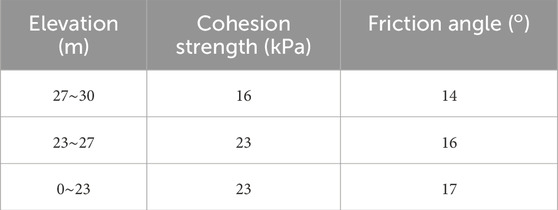
TABLE 1. Parameters of the slope with cracks used for comparison.
Computed results of safety factor, F from different methods for slopes with and without crack are listed in Table 2. Results in Table 2 indicate that the safety factor, F obtained from the finite element limit analysis method in this study are close to those from different limit equilibrium methods reported by Chen et al. (2014). Additionally, the safety factor obtained from this study falls within the range reported by Chen et al. (2014). The results presented in Table 2 also indicate that taking into account the vertical cracks within the slope results in lower safety factors as compared to that without cracks.
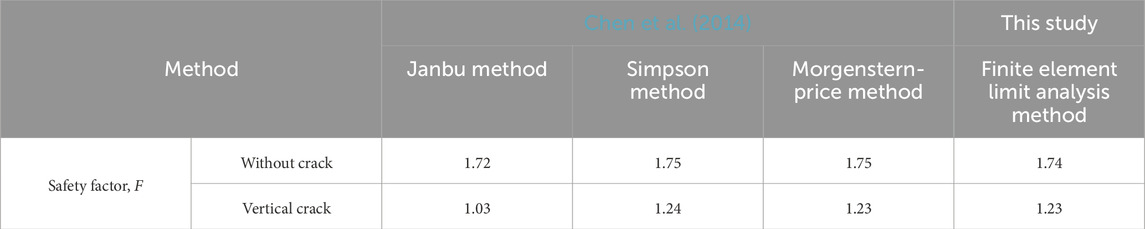
TABLE 2. Safety factors calculated from different methods.
3 Parametric analysis
In section, parametric analysis was carried out to investigate the influence of crack length, crack inclination, and crack strength, respectively using the above validated finite element limit analysis method. The following control model shown in Figure 3A with parameters listed in Table 3 is used in this section. It should be noted that all the parameters are the same as those in Table 3 except that specified in the following analysis.
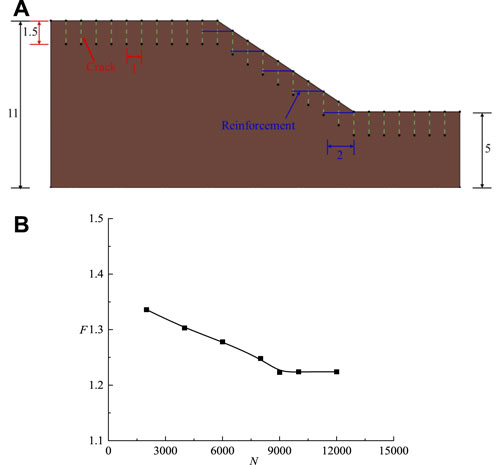
FIGURE 3. (A) Control slope model with cracks (Unit: m); (B) Variations of F with N.
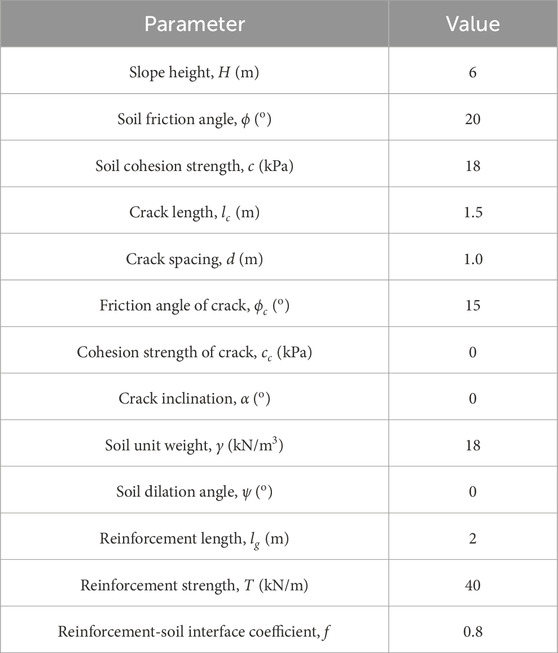
TABLE 3. Parameters used in control model.
Many previous researches have corroborated the presence of cracks within slope except those near the slope surface. However, due to the irregular distribution of cracks within slopes and the challenge of quantitatively characterizing their distribution, current research predominantly focuses on vertical cracks near the slope surface (Chen et al., 2014; Mukhlisin and Khiyon, 2018; Jamalinia et al., 2020; Sari et al., 2023). So the cracks were set near the slope surface in this study.
The horizontal movement of the model was limited to the right and left sides, and no displacement was permitted at the bottom. The Reinforcement element in OptumG2 was used to model the reinforcement in the model. The mesh number could affect the accuracy of the results. Figure 3B show shows the variations of the safety factor, F of the control slope model with mesh number N. Results in Figure 3B indicate that the values of safety factor are influenced by the mesh numbers (i.e., grid density). However, F is independent on N when N is larger than 9,000. So N was set as 10,000 in this study. Besides, a mesh adaptive technique was used to help identify the slip planes (Kumar and Chauhan, 2023).
In the following sections, the parameter η is represented by the following (Eq. 6)
where Fc is the safety factor of the control model shown in Figure 3A.
3.1 Crack length
Figure 4 shows the variations of η with crack lengths, lc. Results in Figure 4 indicate that: ① When the slope ratio, α = 1:1, η decreases linearly with normalized crack length, lc/H. However, it is important to note that the F remains larger than 1.0 within the parameters analyzed in this study, indicating that the slope is in a stable state. ② Compared with the values of η obtained when α = 1:1, larger values of η are observed when α = 1:1.5 and 1:2. Additionally, unlike the linear trend observed for α = 1:1, the calculated values of η for α = 1:1.5 and 1:2 initially decrease slowly with lc/H until reaching a critical value of lc/H =25%, beyond which a significant decreasing trend is observed. ③ The use of reinforcements enhances the stability of slopes with cracks, especially when lc/H > 25%. Furthermore, the effectiveness of the reinforcement is greater when the crack length is larger. For example, for slopes with lc = 2 m and 4 m, the safety factor can be increased by approximately 15% and 18% respectively as compared to the those without reinforcement. ④ Overall, the results in Figure 4 indicate that crack length have a negative impact on slope stability, especially when the slope ratio α is large.
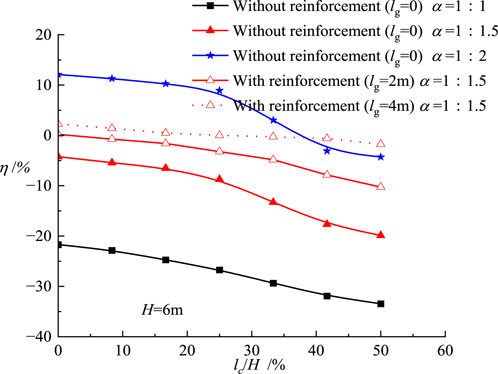
FIGURE 4. Variations of η with the length of cracks.
To further analyze the reasons for the variation of the safety factor, η with crack length, lc shown in Figure 4, Figure 5 shows the shape of slip plane for the slope with an angle ratio α = 1:1.5 but different crack lengths, lc. Numerous previous studies have indicated that slip planes typically originate from the slope crest and extend downward to the slope toe (Griffiths and Marquez, 2007; Li et al., 2009; Tschuchnigg et al., 2015), which is consistent with the results shown in Figure 5. Consequently, the cracks located to the right of the slope toe (Figure 3A) have minimal impact on the stability.
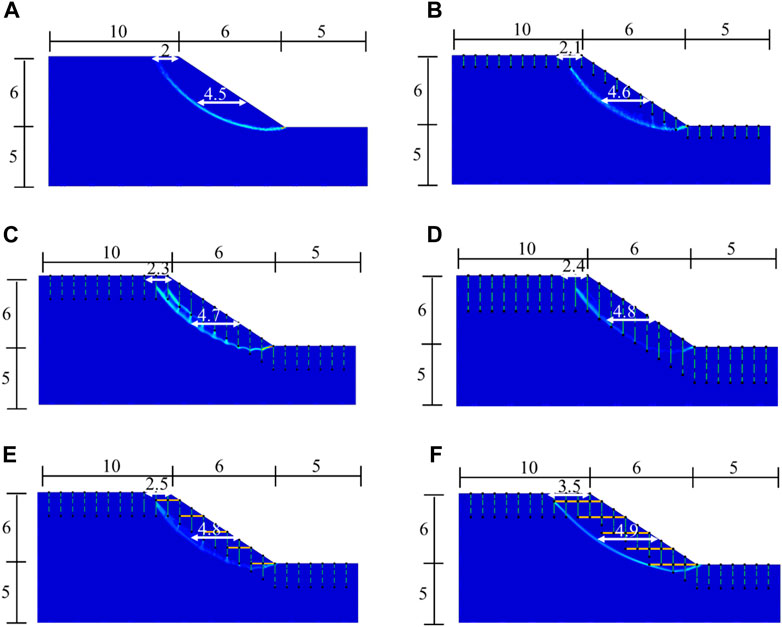
FIGURE 5. Slip planes in cases of slopes with different crack length (Unit: m): (A) without reinforcement (lg = 0) and lc = 0; (B) without reinforcement (lg = 0) and lc = 1 m; (C) without reinforcement (lg = 0) and lc =2 m; (D) without reinforcement (lg = 0) and lc =3 m; (E) with reinforcement (lg = 2 m) and lc =2 m; (F) with reinforcement (lg = 4 m) and lc =2 m.
Results in Figure 5 indicate than: ① The slip plane is arc-shaped when lc = 0 (Figure 5A), and the exit of the slip plane is located at the toe of the slope. ② The shape of the slip plane in case of lc = 1 m (Figure 5B) is almost the same as that in Figure 5A (lc = 0), and there is almost no intersection between the slip plane and the crack. As a result, the corresponding values of η in Figure 2 are close to each other. ③ When the crack length, lc increases to 2 m and 3 m (Figures 5C, D), the slip planes intersect with several cracks. Due to the lower strength of the cracks compared to the adjacent soil, the values of η in Figure 4 decrease significantly at these points. ④ Compared with the unreinforced case (Figure 5C), the slip plane is located farther away from the slope surface when reinforcements are used (Figures 5E, F), especially the reinforcement length is larger, resulting in less steep slip plane. Therefore, the corresponding values of η are relatively larger in these cases.
3.2 Crack inclination
The safety factors, F for slopes with different crack inclinations β, crack lengths lc, and reinforcement lengths lg are listed in Table 4. An inclination of β = 0° denotes a vertical crack, while β = 45° and −45° represent cracks rotating counterclockwise and clockwise, respectively, at an angle of 45° from the downward vertical line.
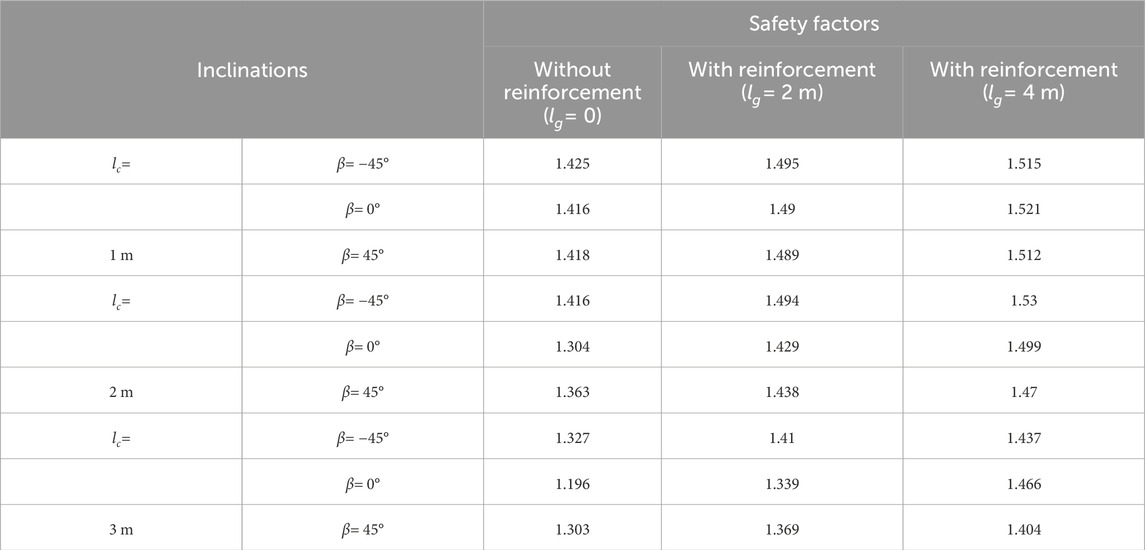
TABLE 4. Safety factors in cases of slopes with different crack inclinations.
Results shown in Table 4 for slopes without reinforcement indicate that: ① When the crack length, lc is 1 m, the inclination of the crack, β has almost no influence on the safety factor of slopes. This phenomenon may be attributed to the short length of the crack, leading to no crack intersecting with the slip plane. ② The minimum and maximum values of the safety factor, F are obtained when the crack inclination, β is 0°and −45°, respectively in the case of lc = 2 m. ③ The influence of the crack inclination, β on the safety factor, F is more significant when lc increases to 3 m as compared to those in cases of lc = 1 m and 2 m.
Results shown in Table 4 also indicate that the utilization of reinforcement leads to an increase in values of the safety factor, F. Additionally, this effect is more significant for slopes with longer lengths and smaller crack inclinations.
The reasons for the variation of the safety factor, F with crack inclination, β shown in Table 4 can be explained by examining the shape of slip planes illustrated in Figure 6 for slopes with crack length lc = 3 m. Results in Figure 6 indicate that: ① Cracks intersecting with the slip planes display noticeable deformation when β = −45° (Figure 6A). Although there are several inclined cracks in the slope, only relative small deformation is observed between two adjacent sliding soil masses, especially those in the middle of the slope. ② The failure mechanism of the slope is toppling collapse when the cracks are vertical (β = 0° shown in Figure 6B). Larger relative movement along the cracks is observed in this case, leading to a lower value of safety factor in Table 4. ③ The failure mechanism shown in Figure 6C is similar to that in Figure 6A, where only minimal relative deformation is observed between two adjacent sliding soil masses at the top of the slope. Besides, the slip planes overall align with the direction of the cracks, leading to a smaller value of F as compared to that in Figure 6A. ④ Compared with the failure mechanisms without reinforcement shown in Figures 6A–C, a global failure mechanism is observed in Figures 6D–F due to the reinforcement, which enhances slope integrity. The slip planes and deep cracks intersect with the reinforcement, leading to the soil masses moving together, and meanwhile, a greater value of safety factor is obtained. Furthermore, theses slip planes are located farther away from the slope surface as compared to those shown in Figures 6A–C.
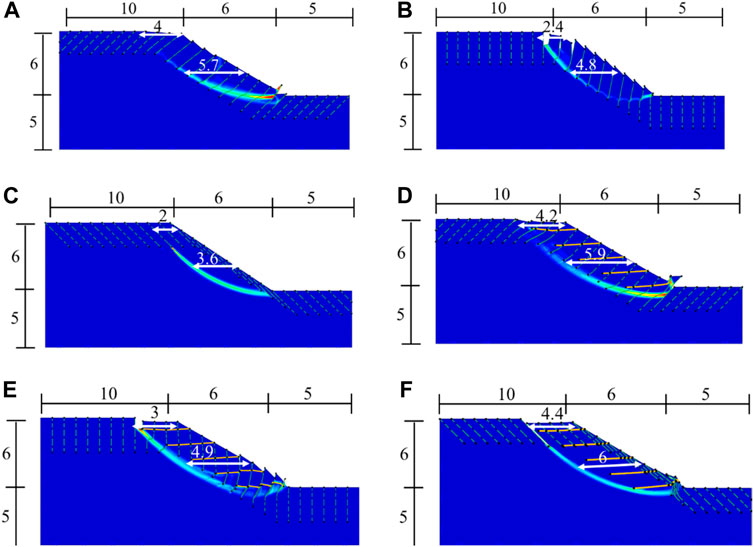
FIGURE 6. Slip planes in cases of different crack inclinations (Unit: m; crack length, lc = 3 m): (A) without reinforcement (lg = 0) and β = −45°; (B) without reinforcement (lg = 0) and β = 0°; (C) without reinforcement (lg = 0) and β = 45°; (D) with reinforcement (lg = 4 m) and β = −45°; (E) with reinforcement (lg = 4 m) and β = 0°; (F) with reinforcement (lg = 4 m) and β = 45°.
3.3 Crack strength
Figure 7 shows the relationship between η and the crack friction angle, ϕc. Results in Figure 7 indicate that: ① Values of η for slopes without reinforcement are almost independent of the crack friction angle, ϕc in the case of slope with shallow cracks (i.e., ϕc = 1 m). This could be attributed the deep slip plane, leading to no intersection with cracks. ② As the crack length, ϕc increases to 2 m and 3 m, η remains constant regardless of the crack strength, ϕc when ϕc is small. However, these η values show a notable increase when ϕc exceeds 6°. Furthermore, the influence of ϕc on η becomes more significant with the crack length, lc. ③ The values of η are greater for reinforced slopes, especially when the crack strength is lower. For example, for a slope with a crack length of 2 m and crack friction angle ranging from 0 to 10°, the use of reinforcements can increase the safety factor by approximately 13%.
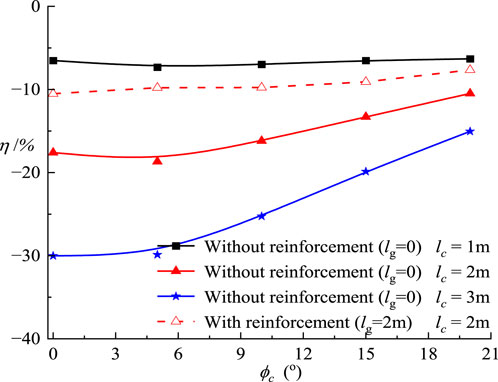
FIGURE 7. Variations of η with friction angle of cracks.
Figure 8 shows the shape of slip planes for slopes with different soil friction angles when the crack length is 3 m. Results in Figure 8 indicate that the soil friction angle affects the shape of the slip planes. When the soil friction angle is relatively large, the slip planes are more close to the slope surface, resulting in a smaller failure zone and a larger safety factor.
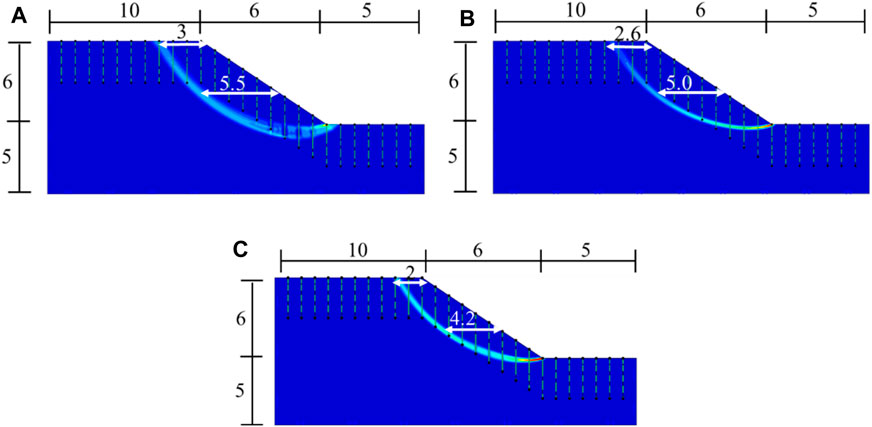
FIGURE 8. Slip planes in cases of different soil friction angle (Unit: m; lc = 3 m): (A) ϕ=10°; (B) ϕ=15°; (C) ϕ=25°.
4 Conclusion
The stability of slopes with cracks was analyzed using the finite element limit analysis method. The following conclusions are drawn:
(1) The influence of crack length on slope stability becomes more significant as the slope gradient decreases. When lc/H exceeds 25%, a significant decrease in slope stability is observed. Using Reinforcements can increase the stability of the slope with crack, and leads to the slip planes being farther away from the slope surface. For slopes with lc = 2 m and 4m, the safety factor can be increased by approximately 15% and 18% respectively as compared to the those without reinforcement.
(2) When the crack length is relatively short, the crack inclination angle has almost no effect on slope stability. However, when the crack length is longer (lc/H ≥ 0.33), the slope safety factor is relatively higher for slopes with a negative crack inclination angle than that with a positive value. Reinforcement can enhance the overall integrity of the slope, improving slope stability.
(3) Although the shape of slip planes is not influenced by the crack strength, the slope stability increases with the strength of the cracks, especially when the crack length is longer. For a slope with a crack length of 2 m and crack friction angle ranging from 0 to 10°, the use of reinforcements can increase the safety factor by approximately 13%.
5 Discussions
The finite element limit analysis method is used in this study to analyze the stability of slope with cracks. Limit analysis can be classified into two categories: upper bound analysis and lower bound analysis. The former is particularly effective in analyzing the failure mechanism of slopes (Sloan, 2013). So the upper bound limit analysis solution of slope factor are calculated using the software OptumG2. The limit analysis solutions are more rigorous than those from the traditional limit equilibrium method due to the incorporation of constitutive models and boundary conditions in the analysis. However, it should be noted that the accurate deformation cannot be obtained, which is the main shortcoming of this method.
Water plays an important role in cracked slopes. However, the software utilized in this study, OptumG2 does not incorporate the coupling of water-related processes such as rainfall infiltration and water evaporation with crack progression. So the influence of water on them can not be considered in this method.
Data availability statement
The raw data supporting the conclusion of this article will be made available by the authors, without undue reservation.
Author contributions
CH: Conceptualization, Formal Analysis, Investigation, Methodology, Writing–original draft. Y-HZ: Supervision, Writing–original draft, Writing–review and editing. H-YY: Formal Analysis, Software, Validation, Writing–original draft.
Funding
The author(s) declare financial support was received for the research, authorship, and/or publication of this article. This research was funded by Key R&D Program of Shandong Province (Grant No. 2020CXGC010310).
Acknowledgments
The authors are grateful to reviewers for their helpful comments and suggestions.
Conflict of interest
Authors CH, Y-HZ, and H-YY were employed by China Railway Eryuan Engineering Group Co., Ltd.
Publisher’s note
All claims expressed in this article are solely those of the authors and do not necessarily represent those of their affiliated organizations, or those of the publisher, the editors and the reviewers. Any product that may be evaluated in this article, or claim that may be made by its manufacturer, is not guaranteed or endorsed by the publisher.
References
Chen, S. X., Dai, Z. J., Lu, D. J., Luo, H. M., and Li, Y. F. (2014). Stability analysis considering fracture distribution and strength for expansive soil slope. Shuili Xuebao 45 (12), 1442–1449. doi:10.13243/j.cnki.slxb.2014.12.007
Dick, G. J., Eberhardt, E., Cabrejo-Liévano, A. G., Stead, D., and Rose, N. D. (2015). Development of an early-warning time-of-failure analysis method-ology for open-pit mine slopes utilizing ground-based slope stability radar monitoring data. Can. Geotech. J. 52 (4), 515–529. doi:10.1139/cgj-2014-0028
Gao, C. S., Xu, G. M., Zhang, L., and Yang, S. H. (2005). Centrifuge modeling of deformation and failure of slope. Chin. J. Geotech. Eng. 27 (4), 478–481.
Gao, M. H., Zhang, Y. X., Wang, Z. Q., Zhao, J. Q., Sun, C., Zhou, J. M., et al. (2021). Graphic analysis method for stability of cracked slopes based on upper limit theorem. Sci. Technol. Eng. 21 (16), 6830–6837. doi:10.3969/j.issn.1671-1815.2021.16.043
Griffiths, D. V., and Marquez, R. M. (2007). Three-dimensional slope stability analysis by elasto-plastic finite elements. Géotechnique 57 (6), 537–546. doi:10.1680/geot.2007.57.6.537
Jamalinia, E., Vardon, P. J., and Steele-Dunne, S. C. (2020). The impact of evaporation induced cracks and precipitation on temporal slope stability. Comput. Geotech. 122, 103506. doi:10.1016/j.compgeo.2020.103506
Krabbenhoft, K., Lyamin, A., and Krabbenhoft, J. (2015). Opium computational engineering (OptumG2). Comput. Softw.
Kumar, P., and Chauhan, V. B. (2023). On the eccentrically loaded strip footing resting over a circular cavity in the rock mass: adaptive finite-element analysis, observations, and recommendations. Int. J. Geomech. 23 (2), 04022287. doi:10.1061/ijgnai.gmeng-7985
Li, L. C., Tang, C. A., Zhu, W. C., and Liang, Z. Z. (2009). Numerical analysis of slope stability based on the gravity increase method. Comput. Geotech. 36 (7), 1246–1258. doi:10.1016/j.compgeo.2009.06.004
Lin, P., Liu, X., Zhou, W., Wang, R., and Wang, S. (2015). Cracking, stability and slope reinforcement analysis relating to the Jinping dam based on a geomechanical model test. Arab. J. Geosci. 8, 4393–4410. doi:10.1007/s12517-014-1529-1
Mehrjardi, G. T., Ghanbari, A., and Mehdizadeh, H. (2016). Experimental study on the behaviour of geogrid-reinforced slopes with respect to aggregate size. Geotext. Geomembranes 44 (6), 862–871. doi:10.1016/j.geotexmem.2016.06.006
Mukhlisin, M., and Khiyon, K. N. (2018). The effects of cracking on slope stability. J. Geol. Soc. India 91, 704–710. doi:10.1007/s12594-018-0927-5
Sari, P. T. K., Mochtar, I. B., and Chaiyaput, S. (2023). Effectiveness of horizontal sub-drain for slope stability on crack soil using numerical model. Geotech. Geol. Eng. 41 (8), 4821–4844. doi:10.1007/s10706-023-02550-1
Sloan, S. W. (2013). Geotechnical stability analysis. Géotechnique 63 (7), 531–571. doi:10.1680/geot.12.RL.001
Stockton, E., Leshchinsky, B. A., Olsen, M. J., and Evans, T. M. (2019). Influence of both anisotropic friction and cohesion on the formation of tension cracks and stability of slopes. Eng. Geog. 249, 31–44. doi:10.1016/j.enggeo.2018.12.016
Tschuchnigg, F., Schweiger, H. F., Sloan, S. W., Lyamin, A. V., and Raissakis, I. (2015). Comparison of finite-element limit analysis and strength reduction techniques. Géotechnique 65 (4), 249–257. doi:10.1680/geot.14.P.022
Xu, P., Jing, G. L., Qiu, J. J., Lin, Z. Z., and Wang, Z. M. (2018). Limit analysis on yield acceleration and failure model of reinforced soil retaining walls using two-wedge method. Rock Soil Mech. 39 (8), 2765–2770. doi:10.16285/j.rsm.2016.2419
Xu, P., Li, T., and Hatami, K. (2020). Limit analysis of bearing capacity and failure geometry of GRS bridge abutments. Comput. Geotech. 127, 103758. doi:10.1016/j.compgeo.2020.103758
Yin, Y., Deng, Q., Li, W., He, K., Wang, Z., Li, H., et al. (2023). Insight into the crack characteristics and mechanisms of retrogressive slope failures: a large-scale model test. Eng. Geog. 327, 107360. doi:10.1016/j.enggeo.2023.107360
Zhang, G., Hu, Y., and Zhang, J. M. (2009). New image analysis-based displacement-measurement system for geotechnical centrifuge modeling tests. Meas 42 (1), 87–96. doi:10.1016/j.measurement.2008.04.002
Zhang, W. W. (2022). Study on evaluation method of rainfall erosion and maintenance scheme for embankment slope of heavy haul railway in UAD desert area. Railw. Constr. Technol. 05, 95–98.
Keywords: slope, crack, limit analysis, stability, reinforcement
Citation: Hu C, Zeng Y-h and Yao H-y (2024) Stability analysis of slopes with cracks using the finite element limit analysis method. Front. Earth Sci. 12:1364347. doi: 10.3389/feart.2024.1364347
Received: 02 January 2024; Accepted: 14 February 2024;
Published: 04 March 2024.
Edited by:
Zhenwei Dai, China Geological Survey (Geosciences Innovation Center of Central South China), ChinaReviewed by:
Ong Yang, China University of Geosciences Wuhan, ChinaLongwei Yang, China Coal Technology Engineering Group, China
Copyright © 2024 Hu, Zeng and Yao. This is an open-access article distributed under the terms of the Creative Commons Attribution License (CC BY). The use, distribution or reproduction in other forums is permitted, provided the original author(s) and the copyright owner(s) are credited and that the original publication in this journal is cited, in accordance with accepted academic practice. No use, distribution or reproduction is permitted which does not comply with these terms.
*Correspondence: Yong-hong Zeng, c2R4cGx0QGdtYWlsLmNvbQ==