 Jian Zhang1
 Shenhai Zheng
- 1Sujiaoke Chongqing Testing and Certification Co., Ltd., Chongqing, China
- 2Chongqing Urban Investment Infrastructure Construction Co., Ltd., Chongqing, China
- 3College of Civil Engineering, Chongqing University of Arts and Sciences, Chongqing, China
- 4College of Computer Science and Technology, Chongqing University of Posts and Telecommunications, Chongqing, China
The automated classification of rock images is of paramount importance in geological analysis, as it serves as the foundational criterion for the categorization of rock lithology. Despite recent advancements in leveraging deep learning technologies to enhance the efficiency and precision of image classification, a crucial aspect has been overlooked: these methods face a performance bottleneck when attempting to apply it directly to rock classification methods. To address this limitation, we propose a multiple granularity Spatial disorder Hierarchical residual Network (SHN). This approach involves learning from objects annotated at different levels, thereby facilitating the transfer of hierarchical knowledge across levels. By enabling lower-level classes to inherit pertinent attributes from higher-level superclasses, our method aims to capture the intricate hierarchical relationships among different rock types. Especially, we introduce a multi-granularity spatial disorder module to aid neural networks in discerning discriminative details across various scales. This module enables processed images to exhibit region independence, compelling the network to adeptly identify discriminative local regions at diverse granularity levels and extract pertinent features. Furthermore, in light of the absence of a comprehensive rock dataset, this study amassed 4,227 rock images of diverse compositions from various places, culminating in the creation of a robust rock dataset for classification. Rigorous experimentation on this dataset yielded highly promising results, demonstrating the effectiveness of our proposed method in addressing the challenges of rock image classification.
1 Introduction
Rock, as a primary component of the earth’s crust, constitutes a stable ensemble with a fixed external form. The lithology of rocks serves as a crucial basis for accurately analyzing rock porosity and oil saturation, while also forming the foundation for studying geological reservoir characteristics, geological modeling, and calculating reserves. Therefore, the analysis of rock lithology holds significant research significance in many scenarios. Thanks to the convenience and universality of imaging equipment, different types of image acquisition, including in the field of rock classification, have become simple. This offers a promising opportunity for the study of rock lithology. Furthermore, geological researchers have made extensive efforts to fully take advantage of this opportunity, with one of the most important efforts being the application of deep learning to rock image classification. This expands the application of deep learning in geological analysis.
Fine-grained image and video recognition has a wide range of research and application in both the academic and industrial fields (Yan et al., 2021; Tong et al., 2024). It’s more challenging than traditional recognition problems because it aims to distinguish subclasses of large-category objects in images, such as different types of birds. Since there are subtle inter-class differences among multiple subclasses within a large category, the key to fine-grained recognition lies in first locating the parts of the image that are conducive to the final recognition, such as the beak, eyes, and claws of birds. Additionally, the collaboration of multi-granularity features and multi-scale information within each other can improve the performance of fine-grained image classification (Yang and Song, 2023).
For rock image classification, single fine granularity classification can be employed (Chen et al., 2023). A high accuracy depth transfer learning method (Polat et al., 2021b) is proposed to identify rock types quickly and accurately by classifying 12 deep rock types using thin section images. However, the definition of granularity is subjective, and image quality may affect recognition results. These challenges increase the difficulty of constructing fine granularity classification for rock. In comparison to single-granularity classification, a more preferable solution is to adopt hierarchical multi-granularity labels in HMC to describe objects, providing a more flexible approach for annotators with different knowledge backgrounds. Hierarchical multi-granularity classification (HMC) (Silla and Freitas, 2011) aims to leverage hierarchical multi-granularity labels and embed the label hierarchy into the loss function or network architecture. Chen et al. (2022) proposed a hierarchical network structure HRN, and designed a hierarchical feature interaction method that can utilize samples labeled at different levels and enhance the ability to distinguish between fine-grained categories.
The rock lithology is the basis for rock image classification, including color, structure, composition, cementing material, special minerals, etc. Currently, according to the lithological characteristics of various types of rocks, rocks can be divided into three major categories, namely, Igneous rocks, Sedimentary rocks, and Metamorphic rocks (Liu et al., 2023). Among them, igneous rocks are generally considered as original rocks, formed by the cooling and solidification of volcanic lava or magma erupted from volcanoes, so their composition is generally determined by magma composition. Sedimentary rocks and metamorphic rocks belong to secondary rocks, formed by various evolutions of igneous rocks, so their composition is more complex. Sedimentary rocks are mainly formed by the influence of high pressure, weathering, and transportation on igneous rocks, while metamorphic rocks are formed under the metamorphic action of igneous rocks or sedimentary rocks. In addition to being divided into three major categories, rocks can also be further subdivided into thirteen small categories according to indicators such as rock texture, particle size, composition, and structure (Ma et al., 2021). These unique nature of rock provides direct support for our study of multiple granularity hierarchical network.
Specially, to better identify discriminative local regions, we introduce a multi-granularity spatial disorder module into the classification network. The spatial disorder module fragments and reorganizes the image, breaking the overall correlation of the image. This compels the network to search for locally relevant regions that are more beneficial for classification, as important discriminative points for fine-grained image classification are often found in these local areas. Additionally, we incorporate the concept of multi-granularity (Lang et al., 2019; Chen and Miao, 2020) to comprehensively explore local regions of different granularities (Qian et al., 2020) from multiple granularity layers to enhance feature extraction and improve classification accuracy. The contributions of this study are as follows.
• A rock image classification method SHN based on HMC is proposed. A novel network structure is built to add parent features as skip connections to child features through a hierarchical feature interaction module. Embedding the label hierarchy into the loss function and network architecture introduces layers with specific granularity to separate hierarchical features from the main network, which enables coarse-layer rock lithology features to be inherited by finer layers.
• A spatial disorder module is introduced to enhance the classification accuracy of the multi-granularity network. This module operates by segmenting and disrupting the input image, breaking the correlation between local regions and enabling the network to better identify discriminative local areas.
• Design a hierarchical multi-granularity classification network loss based on multi-class cross entropy loss to enhance the classification ability of fine-grained subclasses.
• Extensive experiments are conducted with the state-of-the-art method HRN on a self-made rock image dataset, verifying the effectiveness of SHN on the rock classification task.
2 Related works
2.1 Rock lithology image classification
Currently, deep learning technology is gradually maturing, and significant progress has been made in the field of geological research, both domestically and internationally, particularly in the classification, recognition, and retrieval of rock images. Fan et al. (2020b) addressed the need for rapid identification of rock lithology by field geological surveyors using a lightweight CNN model. Ran et al. (2019) achieved the recognition of six common rock types in the field environment based on deep convolutional networks. Koeshidayatullah et al. (2020) employed DCNN-based object detection and image classification methods to identify carbonate rock lithofacies images, demonstrating that this approach is more cost-effective, faster, and more reproducible than traditional lithofacies analysis. Fan et al. (2020a) utilized two lightweight CNNs to recognize and classify 28 rock images. Liu et al. (2020) conducted intelligent recognition of underground rock masses in rock mining using a simplified VGG16 under the Faster-RCNN object detection framework for feature extraction and learning from eight rock images. Polat et al. (2021a) employed DenseNet121 and ResNet50 models to classify thin sections of six volcanic rock images. Although the aforementioned methods have achieved satisfactory results, the relatively singular choice of models suggests the potential for expanding experiments to compare different networks. Furthermore, further optimization of the model structure can enhance the speed and accuracy of recognition.
2.2 Multi-granularity classification
HMC has found extensive applications in various fields. For example, Bengio et al. (2010) proposed a label embedding hierarchical structure for multi-classification problems. Liu et al. (2013) designed and established a hierarchical structure for a probability label tree. Unlike the tree structure modeling methods mentioned above, Jia et al. (2011) proposed in 2011 to establish a category hierarchy of a directed acyclic graph, which can include more diverse and slightly redundant multi-granularity information. This approach is conducive to a more reliable exploration of different granularity relationships in modeling, leading to improved classification performance. In text classification, an increasing number of works (Chen et al., 2020; Huang et al., 2019) utilize label hierarchy structures to enhance accuracy. In image classification, HMC systems have been used for annotating medical images (Dimitrovski et al., 2011) and classifying diatom images (Dimitrovski et al., 2012).
Research based on deep neural networks (DNN) typically follows two main paths: mapping the label hierarchy structure to the network architecture (Cerri et al., 2014; Peng et al., 2018), or applying a loss function with hierarchical constraints (Jia et al., 2014; Giunchiglia and Lukasiewicz, 2020). HMC with Local Multi-Layer Perceptrons (HMC-LMLP) (Cerri et al., 2016) proposes training a series of MLP networks, each corresponding to a hierarchical level. The input for each MLP uses the output provided by a previously trained MLP to enhance the feature vector of instances. This supervised incremental greedy process continues until reaching the last level of the hierarchy. HMC Network (HMCN) (Wehrmann et al., 2018) consists of multiple local outputs, with each hierarchical level of the class hierarchy having a local output layer, along with a global output layer capturing the cumulative relationships propagated through the entire network. All local outputs are then connected and aggregated with the global output to generate the final consistent prediction. HMC-LMLP and HMCN embed the label hierarchy structure into their network architectures. Their loss functions sum up the binary cross-entropy loss for each hierarchical level, assuming independence between each label, thus neglecting implicit hierarchical relationships between two semantic labels.
The task of multi-granularity image recognition can employ part-based/attention-based approaches to identify discriminative regions in the image and learn region-based feature representations. For instance, Fu et al. (2017) proposed a Reinforced Attention Proposal Network to obtain distinctive attention regions and a region-based multi-scale feature representation. Sun et al. (2018) introduced the OneSqueeze Multi-Excitation Module to learn multiple attention region features for each input image, and then applied multi-attention multi-class constraints within a metric learning framework. Zheng et al. (2017) utilized a channel grouping network to generate multiple parts through clustering and then classified these part features to predict the category of the input image. In comparison to early part/attention-based methods, recent approaches often tend to be weakly supervised and do not require annotations for parts or key regions. Specifically, Peng et al. (2017) proposed a spatial constraint to ensure the model selects discriminative regions and used a dedicated clustering algorithm to integrate features from these regions. Yang et al. (2018) introduced a method to detect information regions and carefully examined them to make final predictions. However, the correlation between regions contributes to a more profound understanding of objects, and this is often overlooked in previous work. Research (Noroozi and Favaro, 2016) also indicates that leveraging the positional information of regions can enhance the visual representation capacity of neural networks, thereby improving the performance of classification and detection tasks.
3 Detailed method
3.1 Network architecture
As shown in Figure 1, we propose a multiple granularity Spatial disorder Hierarchical residual Network, called SHN. The network architecture comprises a spatial disorder module, a trunk network, a hierarchical feature interaction module, two parallel output channels and Grad-CAM feature visualization. The trunk network is responsible for extracting features from input images, and any commonly used network can be applied. In this study, we opt for ResNet-50 as the trunk network, given its widespread usage in feature extraction.
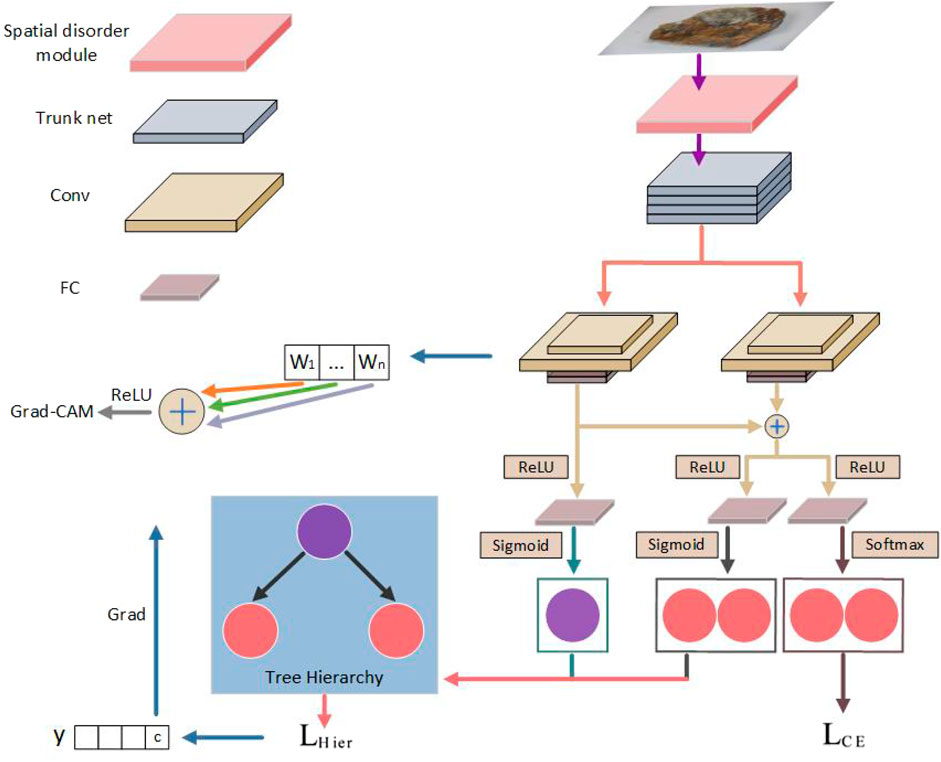
Figure 1. The overview of the proposed Multiple Granularity Spatial Disorder Hierarchical Residual Network.
The hierarchical feature interaction module consists of granularity-specific blocks and residual connections. These blocks share a consistent structure, comprising two convolutional layers and two fully connected (FC) layers. Each block is tailored to extract specialized features for a particular hierarchical level. The residual connections initially linearly combine features of fine-level subclasses with those of coarse-level superclasses. Consequently, subclasses possess both unique attributes and inherit attributes from their superclasses. Subsequently, a non-linear transformation (ReLU) is applied to the combined features.
Within our SHN model, two output channels are established. The first output channel computes the probabilistic classification loss based on the tree hierarchy, where each Sigmoid node corresponds to a distinct label in the hierarchy. Sigmoid is employed for non-linear projection instead of Softmax, as Sigmoid reflects independent relations while Softmax implies mutual exclusion. The Sigmoid nodes from each hierarchical level are then organized according to the tree hierarchy to adhere to hierarchical constraints. The second output channel computes the multi-class cross-entropy loss at the leaf level, prioritizing attention to mutually exclusive fine-grained classes during training. For simplicity, we denote the first and second output channels as OHier and OCE, respectively. The detailed network design and operation is shown in Figure 2.

Figure 2. Structure diagram of the hierarchical residual network using spatial disorder module.
3.2 Multiple granularity spatial disorder module
As shown in Figure 3, the spatial disorder module relies on destruction and construction learning (DCL) (Simonyan and Zisserman, 2014), a novel fine-grained image classification model. This model introduces a DCL stream to automatically learn from discriminative regions. Firstly, inspired by commonly used disruption methods in natural language processing, a region confusion mechanism is proposed to partition input images and randomly shuffle them. Simultaneously, an adversarial loss is introduced to mitigate the impact of noise, facilitating destructive learning by the network. Subsequently, a region alignment network is introduced to restore the original layout of regions and model correlations between local regions through reconstruction.
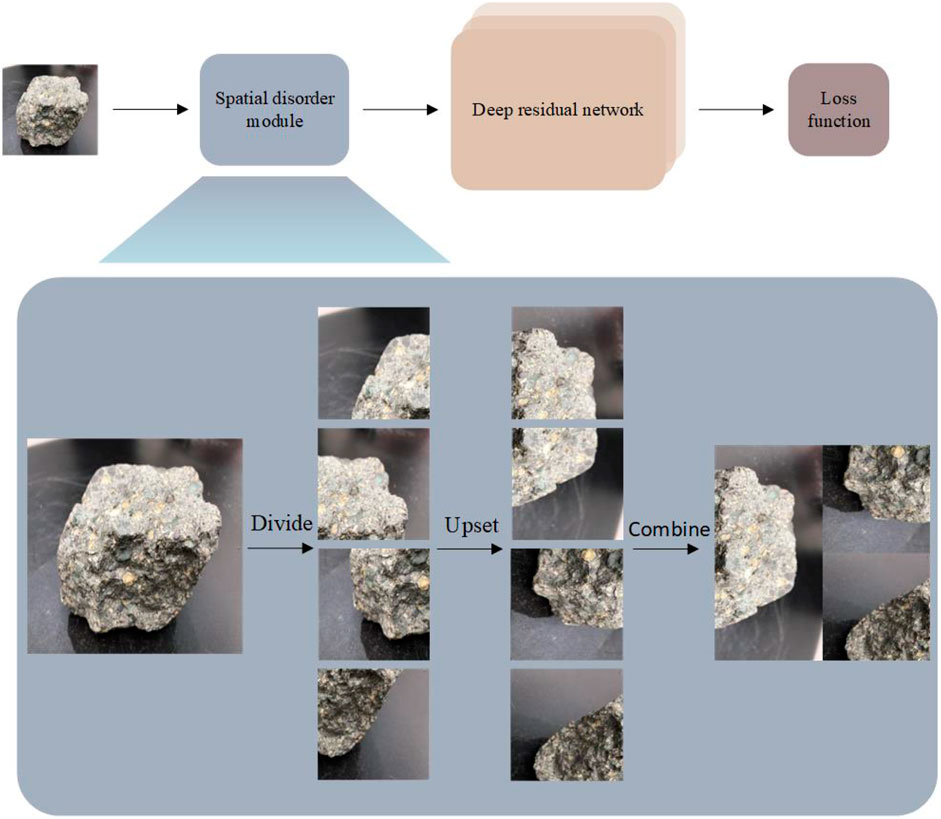
Figure 3. The process of rock images through spatial disorder module.
The spatial disorder module mentioned earlier aims to encourage the network to focus on learning how to identify locally discriminative regions in an image, rather than the overall relevance of the image. However, these discriminative regions may not all be at the same level of granularity. This paper proposes that one purpose of the spatial chaos module is for the network to not only learn the coarse-grained features of the original image, but also to identify useful features in small local regions.
Granular computing is a method of thinking and methodology that operates at different levels of granularity. The concept of multi-granularity in granular computing can be seen as a multi-level and multi-perspective approach to problem solving. The original images input to the neural network can be seen as the coarsest level of granularity information. From the perspective of granular computing, the spatial disorder module mentioned earlier is the process of refining the granularity of the image to obtain finer granularity information.
If the image is spatially disrupted by other granularity modules and each granularity is guided independently based on this concept, the model can learn more information at different granularities and make more robust decisions. Figure 4 shows the result of rock images passing through spatial disorder module of different Granular. In this paper different granularities are used to process image data.

Figure 4. The result of rock images passing through spatial disorder module of different granularities.
3.3 Hierarchical multi-granularity classification network loss
In Fine-Grained Visual Categorization (FGVC), the widely adopted approach for distinguishing fine-grained categories is the utilization of multi-class cross-entropy loss. To enhance the discriminative capabilities specifically for fine-grained leaf classes, we integrate LCE into our model. LCE utilizes softmax outputs from OCE, where each node corresponds to a fine-grained leaf label in the tree hierarchy. The softmax outputs indicate mutually exclusive relationships among fine-grained classes, aligning with the hierarchy constraint outlined in the tree structure. As shown in Eq. 1, we merge LCE with LHier in the following manner:
The combined loss determines whether to incorporate LCE based on whether xl is labeled at fine-grained leaf categories. In the end, as shown in Eq. 2, the total loss on dataset D is:
This loss can simultaneously constrain the spatial disorder module and the multi-layer hierarchical network. By minimizing this loss function, robust and effective classification results can be obtained.
4 Experiments
4.1 Datasets
Currently, there is a lack of publicly available rock datasets. In this paper, 4,227 rock images of various rock types were collected from the natural history museums of Chongqing, Chengdu University of Technology, and the digital cloud platform of Wuhan University to create a basic rock dataset for classification.
Our collected images align with the methodology proposed by Chang et al. (2021), where the rock images in the dataset are divided into three major categories of sedimentary rocks, metamorphic rocks and igneous rocks according to the lithology of rocks. This paper divides sedimentary rocks into four subcategories of volcaniclastic rocks, clastic rocks, clay rocks and biochemical rocks; divides metamorphic rocks into four subcategories of contact metamorphic rocks, regional metamorphic rocks, dynamic metamorphic rocks and hydrothermal metamorphic rocks; divides igneous rocks into five subcategories of ultramafic rocks, mafic rocks, intermediate rocks, acidic rocks and alkaline rocks. The specific data distribution is shown in Table 1.
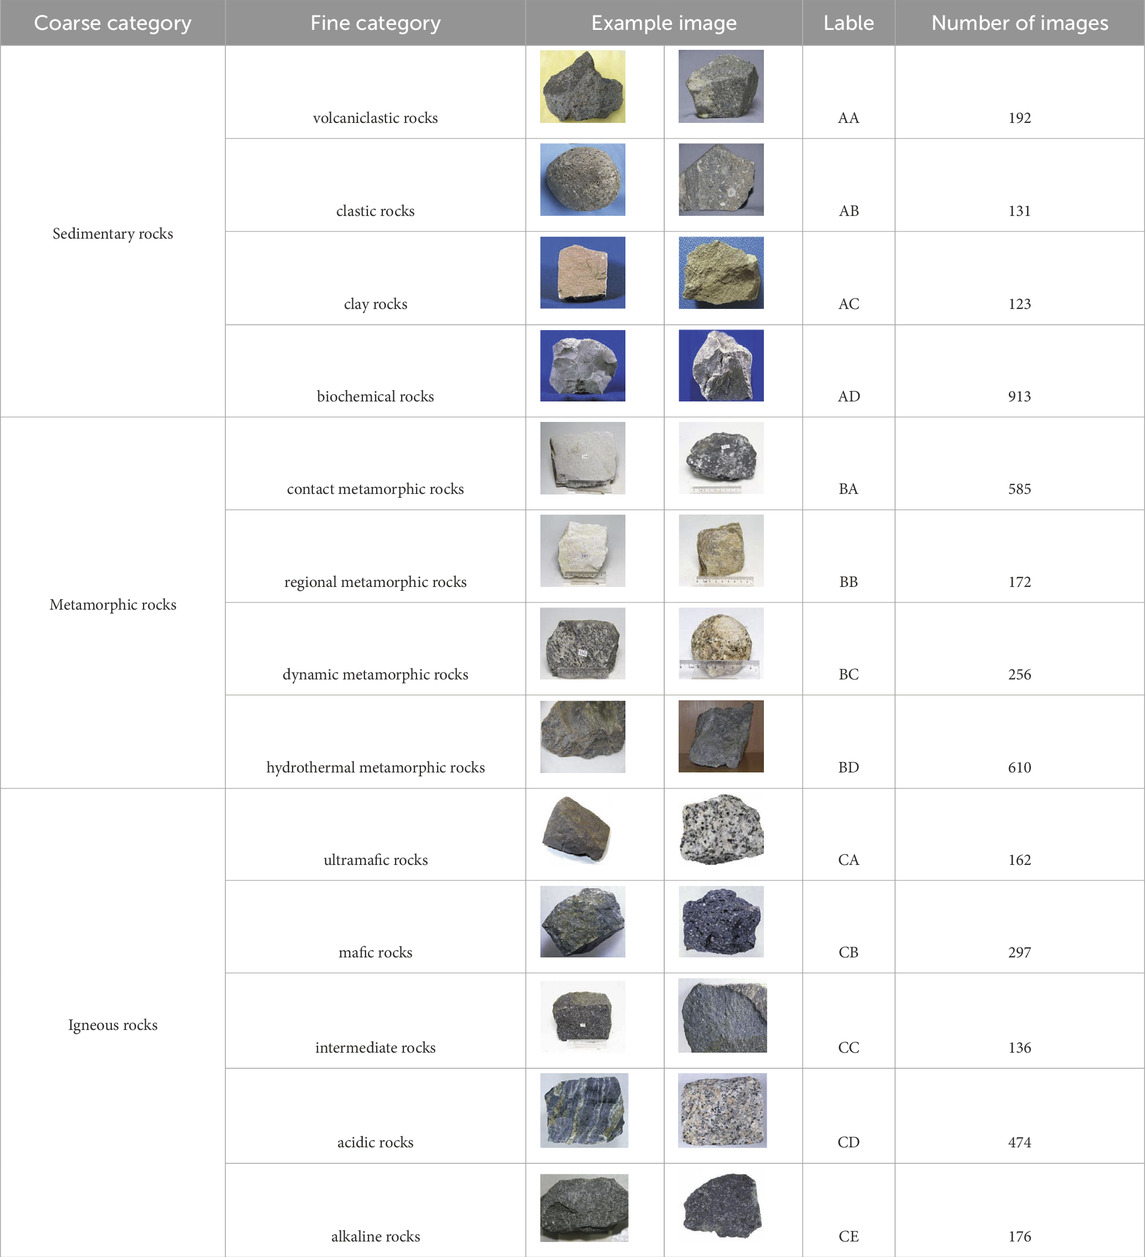
Table 1. Data distribution.
In the experiment, the dataset was divided with 50% used for training and the remaining 50% for testing. Furthermore, the performance of neural network models mainly depends on the knowledge learned from the dataset. The larger and more diverse the dataset, the better the learning effect and the higher the performance of the neural network model. Therefore, in order to better train the neural network, this paper expanded the rock images through various methods such as brightness adjustment, contrast adjustment, random rotation, and deep convolutional generative adversarial network (DCGAN). After expansion on the training set, this paper finally formed a dataset of 8,400 rock images oriented to the task of rock image classification.
The experimental platform is Ubuntu 22.04 LTS system. Under the Pycharm integrated development environment, use PyTorch 2.1.0 to build a network model to conduct model training on the NVIDIA GeForce RTX 2080.
4.2 Evaluation metrics
To systematically assess the performance of the proposed method on Fine-Grained Visual Categorization (FGVC) for crock classification datasets, we employ two evaluation metrics. The first metric adheres to FGVC conventions and utilizes overall accuracy (OA). The HMC models produce a probability vector for each class (coarse and fine category). Considering the hierarchical label structure, we extract the maximum value from the output probability vector corresponding to each hierarchical level as the predicted label and compute the overall accuracy on the test set. The second criterion, commonly employed in HMC literature, evaluates the area under the average precision and recall curve (AU). Instead of calculating precision and recall curves (PRC) for individual classes, AU computes an average PRC to assess the output probability vector of all classes in the hierarchy. Specifically, for a given threshold value, one point (Prec, Rec) in the average PRC is computed as Eqs 3, 4:
where TP (true positive) is the number of positive samples correctly identified by the network; TN (true negative) is the number of negative samples incorrectly identified by the network; FN (false negative) is the number of negative samples correctly identified by the network; FP (false positive) is the number of positive samples incorrectly identified by the network. i means the ith rock image and n is the total numbers of the tested images.
4.3 Experiment settings
In our experimental setup, we consistently resized input images to a dimension of 448 × 448 pixels and conducted a total of 180 and 300 training epochs, in order to observe how the various training methods perform in short and long training epochs. The test operation was repeated 3 times for each experimental setting, and the results were derived from the average of 3 times experiments to ensure the reliability of the experimental results. Furthermore, we always use the original dataset to train the HRN model. For the backbone of our model, we leverage a pretrained ResNet-50 architecture, specifically pretrained on the ImageNet dataset. Our optimization strategy involves employing stochastic gradient descent (SGD) with a momentum value of 0.9 and a weight decay of 0.0005. Throughout the training process, we set the batch size to eight to balance computational efficiency and model performance. Additionally, we initialize the learning rates for both the convolutional layers and the fully connected (FC) layers newly introduced for hierarchical interaction to 0.002. This comprehensive approach aims to fine-tune the model effectively and achieve optimal performance in our experiments.
4.4 Experiment results
In the lower right corner of Figure 5, it represents the training method on both coarse and fine category. The first-level classification channel always uses the original data set, while in the second-level classification channel, a different data set is used. For example, in 1+2+1+4+1 (21, 212), one represents the original dataset, two represents the processed dataset with a granularity of 2, four represents the processed dataset with a granularity of 4, and the numbers in brackets represent the ratio of each training stage period, that is, two to one to two to one to 2. In order to observe the effects of different training methods in short training epochs during 180 training epochs, we divided the training methods into two categories. The first training method is to first use the original data set to train the SHN model, and then use the processed data set with a granularity of 2, 3, 4. The second training method is to alternately use these different data sets. The results show that the coarse category test accuracy of the training method that alternately uses the original data set and the processed data set with granularity of two and four is higher than other training methods and the HRN model, and its fine category test accuracy is much higher than other training methods, even Slightly higher than the HRN model. In summary, in short training epochs, the training method of alternately using the original data set can improve the accuracy of coarse and fine category test accuracy. It is worth noting that using the original dataset in the final training stage can significantly improve the fine-category testing accuracy.
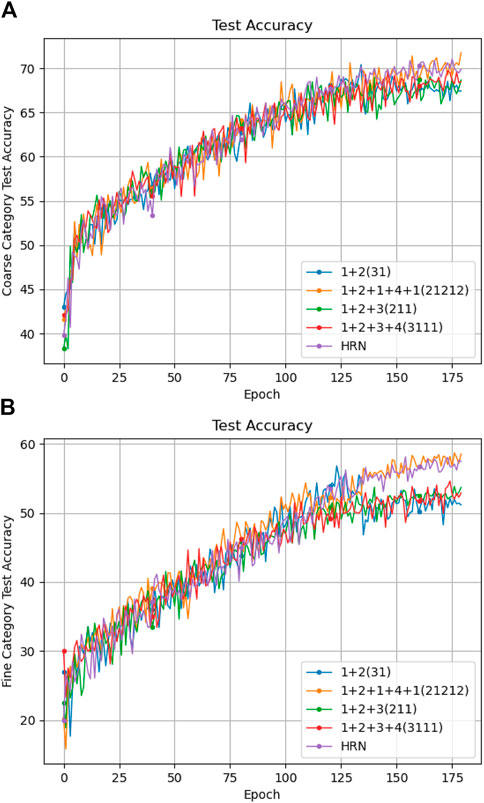
Figure 5. Classification accuracy of different settings under 180 epochs. (A) show the coarse category test accuracy and (B) show the fine category test accuracy respectively.
Turning to Figure 6, as mentioned above, in 300 training epochs, in order to observe the effects of different training methods in long training epochs, we adopted three training methods. The first training method is to use alternate the original data set and the processed data sets with granularity two and four. The second training method is to sequentially use the original data set and the processed data sets with granularity of 2, 4, and 6. The third training method is different from the first two training methods in that it first uses the processed data sets with a granularity of two and four, and then uses the original data set. The results show that in terms of coarse category test accuracy, there is little difference in the effects of various training methods, but the third one is slightly higher than the first and second training methods and the HRN model. In terms of fine category test accuracy, the third training method is significantly higher than the first and second training methods, and slightly higher than the HRN model. In summary, in long training epochs, the third training method can better improve the accuracy of coarse and fine category testing, that is, using the original data set in the final training stage can significantly improve the test accuracy.
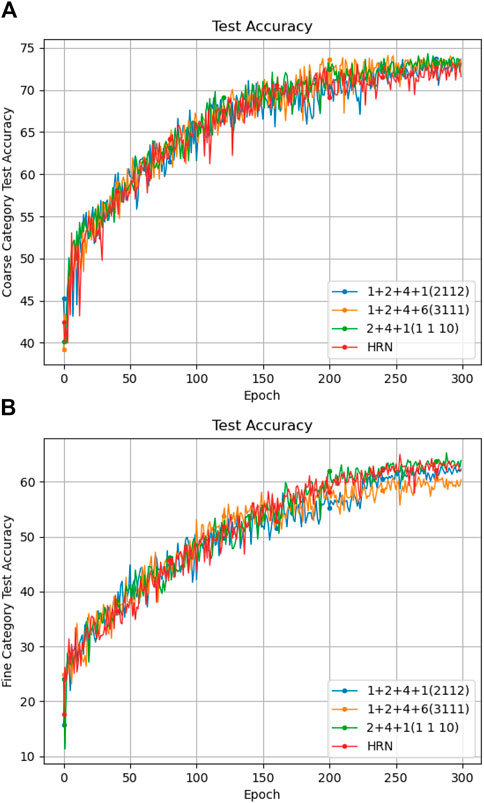
Figure 6. Classification accuracy of different settings under 300 epochs. (A) show the coarse category test accuracy and (B) show the fine category test accuracy respectively.
The experimental evaluation in Table 2 shows the accuracy, recall, and specificity rates of 13 classification results (mean and standard deviation results of all the three experiments). In comparison to the HRN model, the SHN model exhibits a certain degree of accuracy improvement across all 13 classifications. The accuracy improvement is particularly significant in categories other than BC, notably in AB, AD, and BB, with increases of approximately 20%, 14%, and 17%, respectively. Except for category AB, the recall rates for all other categories have also improved. Among them, the improvements in AA, AB, AD, BB, BC, and BD categories are significant, with increases of approximately 11%, 20%, 14%, 16%, 12%, and 12%, respectively. Regarding specificity, the model shows a notable improvement in categories AD, BA, and CD, with increases of approximately 8%, 6%, and 4%, respectively. Specificity rates for other categories have also seen improvements. These results demonstrate the significant effectiveness of the SHN model in identifying true positives.
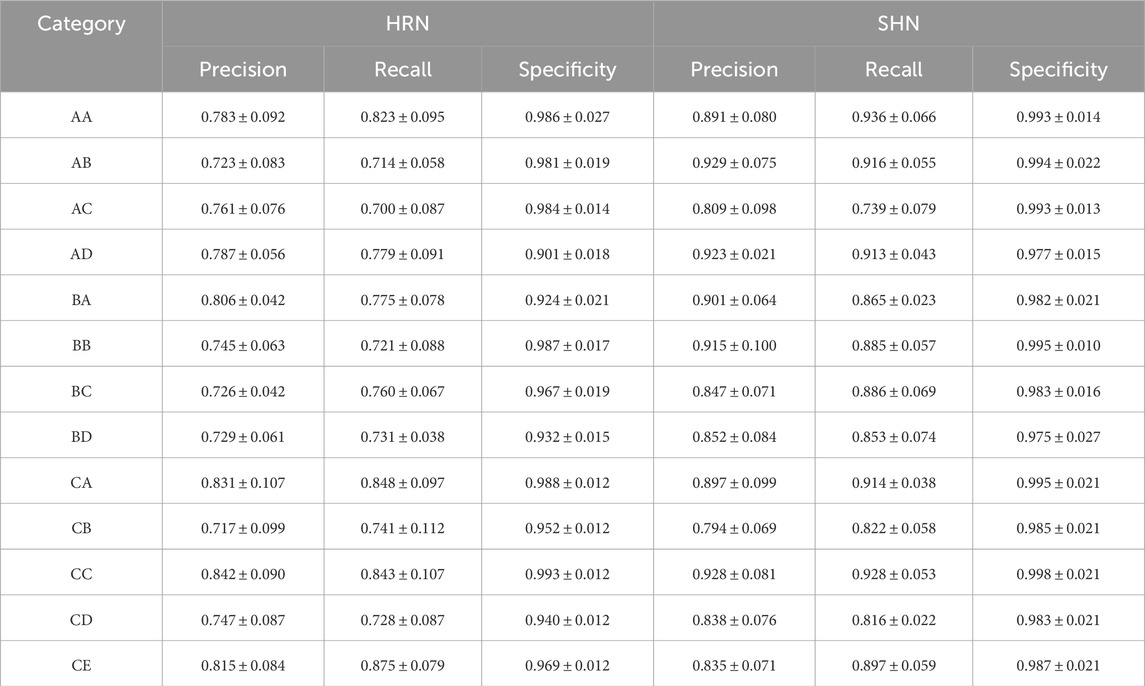
Table 2. Experimental evaluation.
The confusion matrix is based on the classification judgments made by the classification model in relation to the true categories, summarizing the records in the dataset in matrix form. In this matrix, rows represent predicted values, while columns represent true values. One obtained confusion matrix from the three experiments is shown in Figure 7. From the figure, it is evident that the improved network demonstrates higher prediction accuracy compared to the traditional HRN network. Specifically, the prediction correct to error ratios of categories AB, AD, BB, BC and BD are significantly improved, about 20%, 14%, 16%, 12%, and 13% respectively, and other categories are also slightly improved.
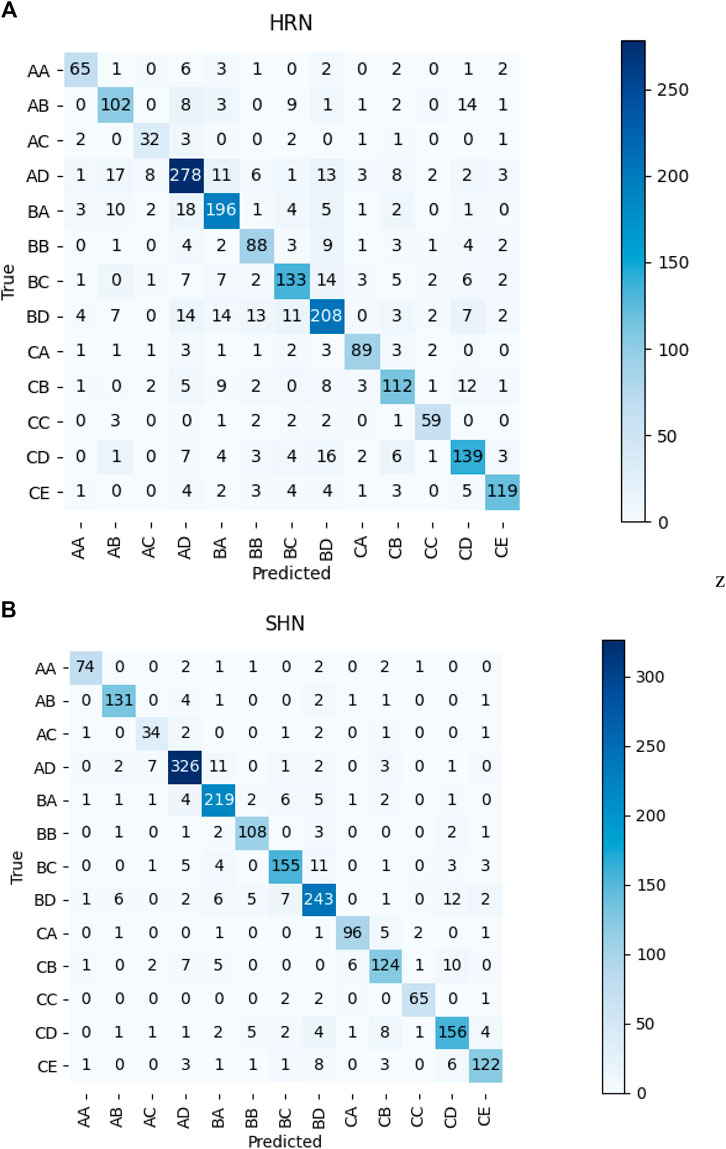
Figure 7. Confusion Matrix of tested method. (A) show the confusion matrix of HRN and (B) show the confusion matrix of SHN respectively.
We visualize HRN and our SHN predictions in Figure 8. It find that the SHN predictions are more focused on the discriminant areas. The SHN-based model can consistently highlight the discriminant areas, which proves the robustness of our SHN. In summary, This is sufficient evidence to illustrate the advancement achieved by our improved network in comparison to the traditional HRN network.
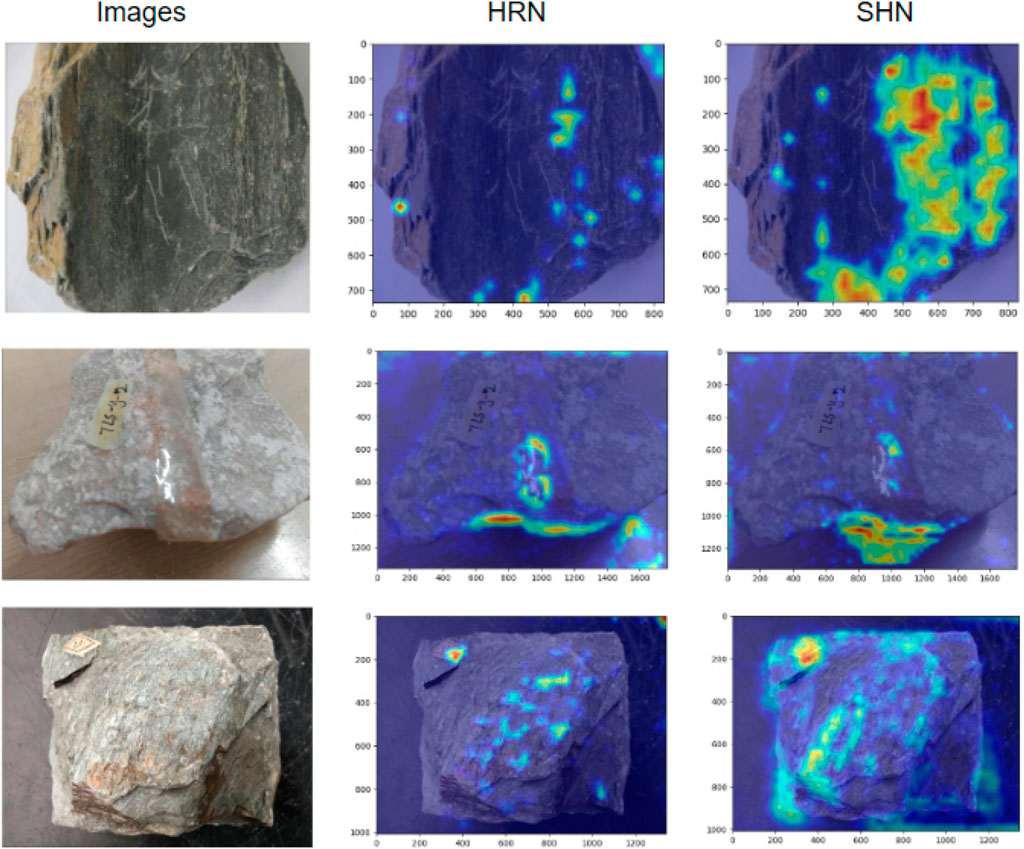
Figure 8. Two-dimensional activation thermodynamic diagram generated by HRN and our SHN.
5 Conclusion
In this work, we propose a multiple granularity spatial disorder hierarchical residual network (SHN) for rock image classification and feature visualization. Through SHN, different levels of labeled samples can be effectively used to enhance the model network’s classification ability of fine-grained rock images. The residual network is used to interact between features at different levels, so that child-level features can inherit from parent-level features. We designed a multiple granularity spatial disorder module to guide the network to learn to find discriminative regions at different granularities to improve the network’s discriminative accuracy in classifying rock images. Our extensive experiments on rock datasets collected from various platforms also demonstrate the effectiveness of our approach. In the future, we hope to better combine the spatial confusion module with the hierarchical residual network to achieve better classification results.
It is known that rock type identification should consider image classification, incorporating aspects like color, structure, and composition. However, some characteristics are beyond image capture, posing a challenge. We will explore more faithful feature learning and explainable methods to address these limitation and enhance our approach.
Data availability statement
The raw data supporting the conclusion of this article will be made available by the authors, without undue reservation.
Author contributions
JZ: Investigation, Methodology, Writing–original draft, Writing–review and editing. ML: Formal Analysis, Funding acquisition, Project administration, Writing–original draft. JG: Methodology, Project administration, Supervision, Writing–review and editing. DW: Conceptualization, Investigation, Writing–review and editing. MW: Funding acquisition, Validation, Visualization, Writing–review and editing. SZ: Supervision, Validation, Writing–original draft, Writing–review and editing.
Funding
The author(s) declare that financial support was received for the research, authorship, and/or publication of this article. This work was supported in part by the project of “Research and Application of Key Technologies for Intelligent Monitoring and Dynamic Early Warning of Municipal Tunnel Construction Safety Based on Global Perception”.
Acknowledgments
We appreciate the reviewers for their thorough review of our manuscript and their numerous valuable comments and suggestions to enhance the quality of this paper. We also want to recognize the timely support provided by the natural history museums of Chongqing, Chengdu University of Technology, and the digital cloud platform of Wuhan University in assisting with the creation of a foundational rock dataset.
Conflict of interest
Authors JZ and JG were employed by Sujiaoke Chongqing Testing and Certification Co., Ltd. Authors ML and DW were employed by Chongqing Urban Investment Infrastructure Construction Co., Ltd.
The remaining authors declare that the research was conducted in the absence of any commercial or financial relationships that could be construed as a potential conflict of interest.
Publisher’s note
All claims expressed in this article are solely those of the authors and do not necessarily represent those of their affiliated organizations, or those of the publisher, the editors and the reviewers. Any product that may be evaluated in this article, or claim that may be made by its manufacturer, is not guaranteed or endorsed by the publisher.
References
Bengio, S., Weston, J., and Grangier, D. (2010). Label embedding trees for large multi-class tasks. Adv. neural Inf. Process. Syst. 23.
Cerri, R., Barros, R. C., and De Carvalho, A.CPLF (2014). Hierarchical multi-label classification using local neural networks. J. Comput. Syst. Sci. 80 (1), 39–56. doi:10.1016/j.jcss.2013.03.007
Cerri, R., Barros, R. C., de Carvalho, A. C. P. L. F., and Jin, Y. (2016). Reduction strategies for hierarchical multi-label classification in protein function prediction. BMC Bioinforma. 17 (1), 1–24. doi:10.1186/s12859-016-1232-1
Chang, D., Pang, K., Zheng, Y., Ma, Z., Song, Y.-Z., and Guo, J. (2021). “Your flamingo is my bird: fine-grained, or not,” in Proceedings of the IEEE/CVF Conference on Computer Vision and Pattern Recognition, New Orleans, LA, USA, June 18 2022 to June 24 2022, 11476–11485.
Chen, B., Huang, X., Xiao, L., Cai, Z., and Jing, L. (2020). Hyperbolic interaction model for hierarchical multi-label classification. Proc. AAAI Conf. Artif. Intell. 34, 7496–7503. doi:10.1609/aaai.v34i05.6247
Chen, J., Wang, P., Liu, J., and Qian, Y. (2022). “Label relation graphs enhanced hierarchical residual network for hierarchical multi-granularity classification,” in Proceedings of the IEEE/CVF Conference on Computer Vision and Pattern Recognition, New Orleans, LA, USA, June 18 2022 to June 24 2022, 4858–4867.
Chen, W., Su, L., Chen, X., and Huang, Z. (2023). Rock image classification using deep residual neural network with transfer learning. Front. Earth Sci. 10, 1079447. doi:10.3389/feart.2022.1079447
Chen, Y., and Miao, D. (2020). Granular regression with a gradient descent method. Inf. Sci. 537, 246–260. doi:10.1016/j.ins.2020.05.101
Dimitrovski, I., Kocev, D., Loskovska, S., and Džeroski, S. (2011). Hierarchical annotation of medical images. Pattern Recognit. 44 (10-11), 2436–2449. doi:10.1016/j.patcog.2011.03.026
Dimitrovski, I., Kocev, D., Loskovska, S., and Džeroski, S. (2012). Hierarchical classification of diatom images using ensembles of predictive clustering trees. Ecol. Inf. 7 (1), 19–29. doi:10.1016/j.ecoinf.2011.09.001
Fan, G., Chen, F., Chen, D., and Dong, Y. (2020a). Recognizing multiple types of rocks quickly and accurately based on lightweight cnns model. IEEE Access 8, 55269–55278. doi:10.1109/access.2020.2982017
Fan, G., Chen, F., Chen, D., Li, Y., and Dong, Y. (2020b). A deep learning model for quick and accurate rock recognition with smartphones. Mob. Inf. Syst. 2020, 1–14. doi:10.1155/2020/7462524
Fu, J., Zheng, H., and Mei, T. (2017). “Look closer to see better: recurrent attention convolutional neural network for fine-grained image recognition,” in Proceedings of the IEEE conference on computer vision and pattern recognition, Honolulu, HI, USA, July 21 2017 to July 26 2017, 4438–4446.
Giunchiglia, E., and Lukasiewicz, T. (2020). Coherent hierarchical multi-label classification networks. Adv. neural Inf. Process. Syst. 33, 9662–9673.
Huang, W., Chen, E., Liu, Qi, Chen, Y., Huang, Z., Liu, Y., et al. (2019). “Hierarchical multi-label text classification: an attention-based recurrent network approach,” in Proceedings of the 28th ACM international conference on information and knowledge management, Beijing, China, November 3-7, 2019, 1051–1060.
Jia, D., Ding, N., Jia, Y., Frome, A., Murphy, K., Bengio, S., et al. (2014). “Large-scale object classification using label relation graphs,” in Computer Vision–ECCV 2014: 13th European Conference, Zurich, Switzerland, September 6-12, 2014, 48–64. doi:10.1007/978-3-319-10590-1_4
Jia, D., Satheesh, S., Berg, A., and Li, F. (2011). Fast and balanced: efficient label tree learning for large scale object recognition. Adv. Neural Inf. Process. Syst. 24.
Koeshidayatullah, A., Morsilli, M., Lehrmann, D. J., Al-Ramadan, K., and Payne, J. L. (2020). Fully automated carbonate petrography using deep convolutional neural networks. Mar. Petroleum Geol. 122, 104687. doi:10.1016/j.marpetgeo.2020.104687
Lang, G., Miao, D., and Fujita, H. (2019). Three-way group conflict analysis based on pythagorean fuzzy set theory. IEEE Trans. Fuzzy Syst. 28 (3), 447–461. doi:10.1109/tfuzz.2019.2908123
Liu, B., Sadeghi, F., Tappen, M., Shamir, O., and Liu, Ce (2013). “Probabilistic label trees for efficient large scale image classification,” in Proceedings of the IEEE conference on computer vision and pattern recognition, OR, USA, June 23 2013 to June 28 2013, 843–850.
Liu, X., Wang, H., Jing, H., Shao, A., and Wang, L. (2020). Research on intelligent identification of rock types based on faster r-cnn method. Ieee Access 8, 21804–21812. doi:10.1109/access.2020.2968515
Liu, Z., Li, D., Liu, Y., Yang, Bo, and Zhang, Z.-X. (2023). Prediction of uniaxial compressive strength of rock based on lithology using stacking models. Rock Mech. Bull. 2 (4), 100081. doi:10.1016/j.rockmb.2023.100081
Ma, He, Han, G., Peng, L., Zhu, L., and Jin, S. (2021). Rock thin sections identification based on improved squeeze-and-excitation networks model. Comput. Geosciences 152, 104780. doi:10.1016/j.cageo.2021.104780
Noroozi, M., and Favaro, P. (2016). “Unsupervised learning of visual representations by solving jigsaw puzzles,” in European conference on computer vision, Amsterdam, The Netherlands, October 11-14, 2016, 69–84. doi:10.1007/978-3-319-46466-4_5
Peng, H., Li, J., He, Yu, Liu, Y., Bao, M., Wang, L., et al. (2018). “Large-scale hierarchical text classification with recursively regularized deep graph-cnn,” in Proceedings of the 2018 world wide web conference, Lyon, France, April 23-27, 2018, 1063–1072.
Peng, Y., He, X., and Zhao, J. (2017). Object-part attention model for fine-grained image classification. IEEE Trans. Image Process. 27 (3), 1487–1500. doi:10.1109/tip.2017.2774041
Polat, Ö., Ali, P., and Ekici, T. (2021a). Automatic classification of volcanic rocks from thin section images using transfer learning networks. Neural Comput. Appl. 33 (18), 11531–11540. doi:10.1007/s00521-021-05849-3
Polat, Ö., Ali, P., and Ekici, T. (2021b). Classification of plutonic rock types using thin section images with deep transfer learning. Turkish J. Earth Sci. 30 (04), 551–560. doi:10.3906/yer-2007-19
Qian, J., Liu, C., Miao, D., and Yue, X. (2020). Sequential three-way decisions via multi-granularity. Inf. Sci. 507, 606–629. doi:10.1016/j.ins.2019.03.052
Ran, X., Xue, L., Zhang, Y., Liu, Z., Sang, X., and He, J. (2019). Rock classification from field image patches analyzed using a deep convolutional neural network. Mathematics 7 (8), 755. doi:10.3390/math7080755
Silla, C. N., and Freitas, A. A. (2011). A survey of hierarchical classification across different application domains. Data Min. Knowl. Discov. 22, 31–72. doi:10.1007/s10618-010-0175-9
Simonyan, K., and Zisserman, A. (2014). Very deep convolutional networks for large-scale image recognition. arXiv preprint arXiv:1409.1556.
Sun, M., Yuan, Y., Zhou, F., and Ding, E. (2018). “Multi-attention multi-class constraint for fine-grained image recognition,” in Proceedings of the european conference on computer vision (ECCV), Munich, Germany, September 8–14, 2018, 805–821.
Tong, T., Yin, Z., Li, J., Wang, H., Wu, D., and Wang, R. (2024). End-to-end distortion modeling for error-resilient screen content video coding. IEEE Trans. Multimedia 26, 4458–4468. doi:10.1109/TMM.2023.3323895
Wehrmann, J., Cerri, R., and Barros, R. (2018). “Hierarchical multi-label classification networks,” in International conference on machine learning, Stockholm Sweden, 10-15 July 2018, 5075–5084.
Yan, Z., Xiong, L., Liu, X., Yu, W., and Ma, S. (2021). Fine-grained classification based on bilinear feature fusion and yolov3. J. Image Graph. 26 (4), 847–856. doi:10.11834/jig.200031
Yang, Ze, Luo, T., Wang, D., Hu, Z., Gao, J., and Wang, L. (2018). “Learning to navigate for fine-grained classification,” in Proceedings of the European conference on computer vision (ECCV), Munich, Germany, September 8–14, 2018, 420–435.
Yang, Z., and Song, W. (2023). Selecting and fusing coarse-and-fine granularity features for fine-grained image recognition. J. Image Graph. 28 (7), 2081–2092. doi:10.11834/jig.220052
Keywords: hierarchical classification, multi-granularity, spatial disorder, deep learning, rock image analysis
Citation: Zhang J, Liu M, Guo J, Wu D, Wang M and Zheng S (2024) SHN: rock image classification and feature visualization using multiple granularity spatial disorder hierarchical residual network. Front. Earth Sci. 12:1364209. doi: 10.3389/feart.2024.1364209
Received: 01 January 2024; Accepted: 07 June 2024;
Published: 05 July 2024.
Edited by:
Justin L. Payne, University of South Australia, AustraliaReviewed by:
Özlem Polat, Sivas Cumhuriyet University, TürkiyeJianxiu Wang, Tongji University, China
Copyright © 2024 Zhang, Liu, Guo, Wu, Wang and Zheng. This is an open-access article distributed under the terms of the Creative Commons Attribution License (CC BY). The use, distribution or reproduction in other forums is permitted, provided the original author(s) and the copyright owner(s) are credited and that the original publication in this journal is cited, in accordance with accepted academic practice. No use, distribution or reproduction is permitted which does not comply with these terms.
*Correspondence: Shenhai Zheng, emhlbmdzaEBjcXVwdC5lZHUuY24=