 Yuanjie Ma1
 Yaping Zhang
- 1School of Information Science and Technology, Yunnan Normal University, Kunming, China
- 2Faculty of Geography, Yunnan Normal University, Kunming, China
The riparian zone is an area where land and water are intertwined, and vegetation is rich and complexly distributed. The zone can be directly involved in ecological regulation. In order to protect the ecological environment of the riparian zone, it is necessary to monitor the distribution of vegetation. However, there are many disturbing factors in extracting riparian vegetation, the most serious of which are water bodies with similar colours to the vegetation. To overcome the influence of water bodies on vegetation extraction from UAV imagery of riparian areas, this paper proposes a novel approach that combines the marked watershed algorithm with vegetation index recognition. First, the image is pre-segmented using edge detection, and the output is further refined with the marked watershed algorithm. Background areas are classified as potential regions for vegetation distribution. Subsequently, the final vegetation distribution is extracted from these potential vegetation areas using the vegetation index. The segmentation threshold for the vegetation index is automatically determined using the OTSU algorithm. The experimental results indicate that our method, when applied to UAV aerial imagery of the riparian zone, achieves an overall accuracy of over 94%, a user accuracy of over 97%, and a producer accuracy of over 93%.
1 Introduction
Riparian zones are three-dimensional transition zones where terrestrial and aquatic ecosystems directly interact and are among the most biodiverse and productive ecosystems on Earth (Rusnák et al., 2022). In addition, the riparian zone is referred to as the “critical transition zone,” which is a conduit for large flows of materials and energy between terrestrial and aquatic ecosystems (Zhang et al., 2019) and plays an important role in water quality regulation, soil conservation, habitat protection, biodiversity maintenance, climate regulation, riparian landscape, and aquatic ecosystem function. Therefore, riparian zones are key ecosystems within river basins (Zhang et al., 2019). However, as open freshwater ecosystems at the interface of terrestrial and aquatic realms, riparian zones are less resilient to negative impacts caused by climate change, direct human activities, or artificial demands on water resources (Rusnák et al., 2022). Moreover, with the increase in urbanization and industrial activities, riparian zones have been severely damaged. According to relevant studies, in Europe, the area of pristine wetlands has been reduced by 80% (Verhoeven, 2014). In addition, in the Xilin River Basin in Inner Mongolia, due to poor management of reservoirs, the amount of water discharged from the reservoirs is unable to meet the ecological water demand of the downstream riparian zone. In hydrologically wet, average and dry years, only 36%, 19%, and 15% of the ecological water demand can be met, which will directly lead to a reduction in the area of vegetation and a consequent decline in the ecological role of the riparian zone (Duo and Yu, 2020). Therefore, protecting and restoring riparian zone vegetation is critical to maintaining ecosystem health and promoting sustainable development, and there is a growing need worldwide to protect or restore the ecological health and function of rivers and associated wetlands.
The first task in protecting and restoring riparian zone vegetation is how to extract its vegetation cover area. Remote sensing technology provides a continuous data set from a satellite perspective, which helps to determine the spatial coverage and structural complexity of vegetation and its functioning (Rusnák et al., 2022). However, most current studies of satellite remote sensing systems are coarse in spatial resolution (e.g., Sentinel 2A (10 m); Landsat TM (30 m); SPOT5 HRV multispectral (10 m)). In their natural state, riparian ecosystems are characterized by a high degree of spatial and temporal heterogeneity (Rusnák et al., 2022). Therefore, sensors with moderate spatial resolution (>4 m × 4 m) may not be sufficient to detect and analyze riparian areas because their pixel size often exceeds the physical size of vegetation cover changes in these areas, and thus satellite remote sensing images are insufficient to obtain reliable vegetation measurements (Duo and Yu, 2020). Unlike satellite remote sensing, unmanned aerial vehicle systems (UAVs) are well suited for riparian zones and riverine ecosystems because of their unprecedented fine scale (Müllerová et al., 2021). UAVs can now be equipped with a variety of sensors, such as visible bands, multispectral, hyperspectral sensors, and Lidar. Among them, RGB images (visible band) are especially widely used due to their convenience, speed, and low price. It has been demonstrated that UAVs deployed with RGB cameras are sufficient to map vegetation cover dynamics (Laslier et al., 2019). Even more, it is possible to achieve high-accuracy classification of riparian zone vegetation using RGB images instead of multispectral and hyperspectral sensors (Rusnák et al., 2022). Therefore, the use of aerial drone images for vegetation distribution studies has become a very promising research direction.
Currently, with the development of research, some methods for vegetation cover extraction based on UAV RGB images have emerged, such as extraction methods based on spectral indices and texture information (Laslier et al., 2019; Gao, et al., 2020; Kutz et al., 2022; Xu et al., 2023), and extraction methods based on machine learning and deep learning (Bhatnagar et al., 2020; Hamylton et al., 2020; Onishi and Lse, 2021; Behera et al., 2022). Compared to machine learning and deep learning vegetation extraction methods, spectral and texture-based vegetation extraction methods not only do not require training datasets, but are also more computationally efficient and easier to interpret. As a result, they have been widely used in riparian zone processing. For example, Zhang et al. (2019) proposed a new green-red vegetation index (NGRVI) according to the construction principle of green-red vegetation index (GRVI) and modified green-red vegetation index (MGRVI). The results show that the NGRVI based on UAV visible light images can accurately extract the vegetation information in arid and semi-arid areas, and the extraction accuracy can reach more than 90%. In conclusion, NGRVI can accurately and effectively reflect the vegetation information in arid and semi-arid areas, and become an important technical means for retrieving biological and physical parameters using visible light images. Laslier et al. (2019) pre-processed UAV images to obtain orthomosaics and calculated vegetation indices, from which texture variables were extracted. Their findings determined that a traditional RGB camera mounted on a UAV was adequate for mapping vegetation cover in the study area. This particular technology demonstrated the feasibility of capturing images and generating information about vegetation cover dynamics at a low cost, given the affordability of RGB cameras. Due to the lack of near-infrared in the visible band, many researchers have resorted to utilizing the spectral reflectance characteristics in the visible band to construct various visible vegetation indices (Zhang et al., 2019), such as Visible-band Difference Vegetation Index (VDVI) (Wang et al., 2015), Difference Enhanced Vegetation Index (DEVI) (Zhou et al., 2021), Normalised Green-Red Difference Index (NGRDI) (Meyer and Neto, 2008), Modified Green-Red Vegetation Index (MGRVI) (Bendig et al., 2015), Red-Green-Blue Vegetation Index (RGBVI) and Normalised Green-Blue Difference Index (NGBDI) (Xu et al., 2017). However, because visible vegetation indices can only determine the type of ground cover by its colour, it is difficult to distinguish similarly coloured features using only simple indices. For example, if a clear body of water is more than 2 m deep and is surrounded by abundant vegetation, the reflection and refraction of light can cause the water’s colour to change to a vegetative green. In addition, the presence of algae and plankton in a body of water can cause aerial images taken by a drone to appear darker green, especially in urban areas. The high-resolution imagery captured by UAVs enables us to acquire detailed information on vegetation distribution within the riparian zone, facilitating real-time monitoring and assessment of its ecological health status. However, given that the riparian zone is a complex ecosystem, the vegetation distribution is intricately linked to the diverse environments of rivers and lakes. Moreover, the close color proximity of water bodies and vegetation poses a significant challenge in accurately identifying vegetation from UAV aerial imagery. Water bodies are often misidentified as vegetation when detected using the Visible Band Vegetation Index (VBVI). Meanwhile, due to the complexity of the riparian environment, high-resolution images acquired by UAVs often have various disturbances, such as waves, shadows, sunlight reflections, etc., in the water area, which further increases the difficulty of vegetation extraction. Therefore, it is necessary to incorporate other information (e.g., texture information) to jointly delineate and extract the vegetation cover area. Unfortunately, there is still a lack of research on efficiently extracting vegetation in complex riparian zones from high-resolution RGB images from UAVs.
Based on observing and analyzing the UAV RGB images of the riparian zone, this study proposes a novel method for vegetation extraction in the riparian zone by combining the marked watershed algorithm and vegetation index recognition. The basic ideas of this method are to 1) distinguish water bodies and non-water bodies by texture. 2) Discriminate between vegetation and non-vegetation by vegetation index after excluding water bodies. Unlike the traditional marked watershed algorithm, this method is characterized by obtaining the potential vegetation distribution area through the background marker of the marked watershed algorithm, which avoids the problem of over-segmentation. Specifically, the method extracts the texture information in RGB images by the Canny operator and then marks the potential complex riparian vegetation cover area by a marked watershed algorithm. Finally, the vegetation cover area is extracted by setting a threshold through the visible light vegetation index. The experiments prove that the method can efficiently and accurately extract the vegetation in complex riparian zones, and effectively solve the problem that it is difficult to distinguish between green water bodies and vegetation by visible light vegetation index. This study will provide practical technical support for sustainable ecological restoration and management of riparian zones. In order to show the effectiveness of the proposed method, six UAV aerial images of the riparian zone with different regions were selected for experimental demonstration.
2 Materials and methods
2.1 Materials
In this study, a DJI Phantom 4 RTK drone was used for data acquisition and captured UAV remote sensing images in R, G, and B bands with a size of 5472*3648 pixels. The drone images were captured at a relative flight height of 120 m, with a Ground Sample Distance (GSD) of 3.5 cm/px. The images were taken on 21 July 2023, between 10 a.m. and 4 p.m. In order to illustrate the validity and generalizability of the experimental results, we selected six strongly representative UAV aerial images of riparian zones with different surface features and water conditions for the experimental study, as shown in Figure 1. For example, the water surface is calm, the water body is uniform in color, and the riverbank is almost completely covered by vegetation (Figure 1A). The water body has different depths, resulting in the uneven color of the water body and sunlight reflection, and there are some floating objects on the water surface and some bare soil and roads in the vegetation-covered area on the river bank (Figure 1B). There is visible floating debris and trash on the water, shadows obscure part of the water surface, and power lines are passing over the water surface, causing obscuration (Figure 1C). Vegetation is abundant, and sunlight reflects off the water surface, creating pronounced ripples (Figure 1D). The water surface exhibites ripple distribution and the water body’s depth varies (Figure 1E). The presence of algae causes uneven green coloration on the water surface (Figure 1F).
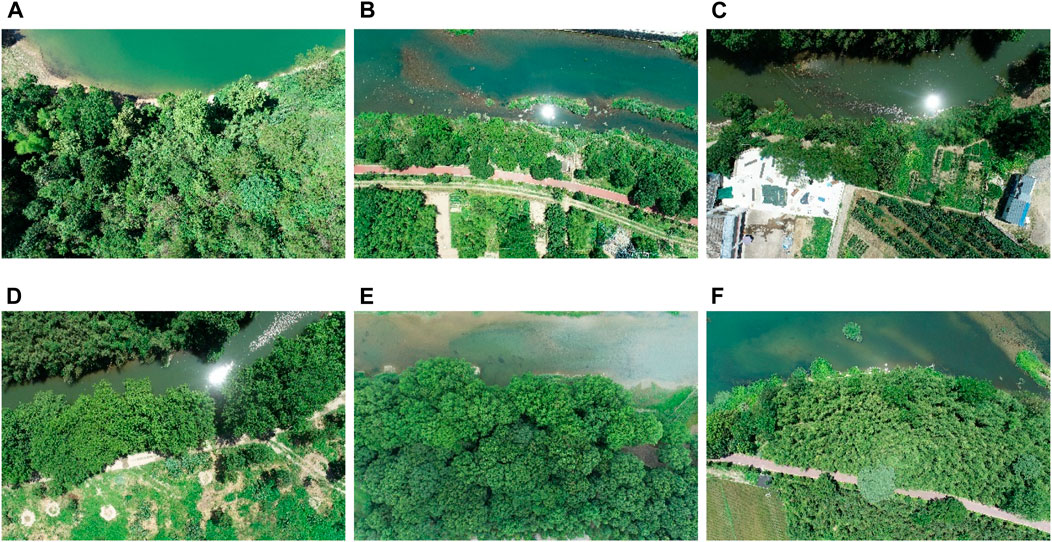
Figure 1. Aerial drone images of the complex riparian zone: (A) Region I, (B) Region II, (C) Region III, (D) Region IV, (E) Region V, (F) Region VI.
2.2 Methods
2.2.1 Algorithm implementation process and flowchart
The implementation process of the vegetation extraction method proposed in this paper consists of seven steps, as depicted in Figure 2. The pseudo-code of the vegetation extraction process is presented in Algorithm 1, and the algorithm is implemented using Python and OpenCV.
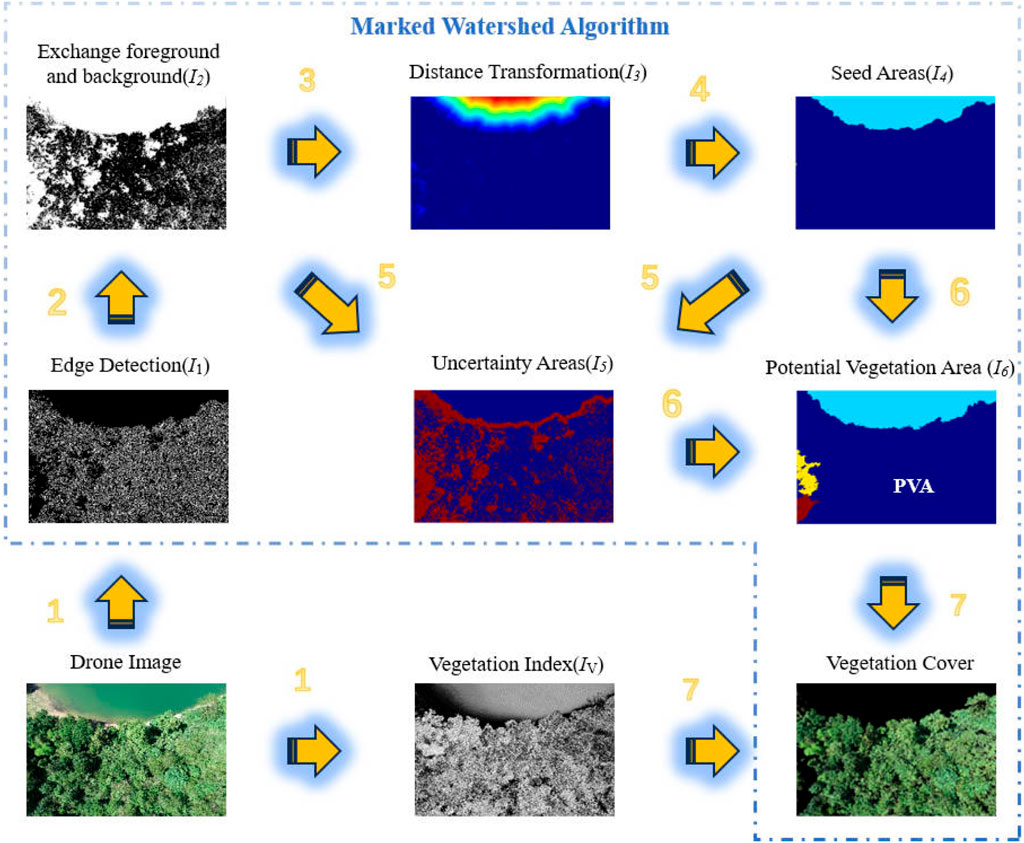
Figure 2. Implementation process of the vegetation extraction method.
Algorithm 1.Vegetation extraction.
Input: UAV RGB image
Output: Vegetation coverage area in the image
1 Perform edge detection and vegetation index calculation for the input image to obtain images I1 and Iv, respectively;
2 The image I1 was binarised, and Its areas of high-frequency texture (potential vegetation) were set as the background, followed by a morphological closing operation to eliminate holes and then an opening operation to reduce noise to obtain the image I2;
3 The image I2 was subjected to distance transformation to obtain the image I3;
4 Perform threshold segmentation and binarization for the distance transformation image I3 to obtain the watershed seed area image I4;
5 The image I2 subtracts the image I4 to obtain uncertainty areas;
6 Perform marked watershed algorithm with seed areas, uncertainty areas, and UAV RGB image as inputs to extract the potential vegetation areas;
7 Perform threshold segmentation for potential vegetation areas with vegetation indices to obtain final vegetation cover areas.
By performing “Distance Transformation,” the distance from foreground pixels to the nearest background pixels can be calculated, resulting in a grayscale image where higher grayscale levels indicate greater distances from the background. The “seed area” is generated through threshold segmentation and binarization of the “distance transformation” image. By subtracting the “seed area” from image I2 described in Algorithm 1, we obtain the “uncertainty area” image. In the marking watershed algorithm, diffusing the “seed area” towards the “uncertainty area” results in the segmentation outcome. Since all vegetation in these results is located within the background region, this area is identified as the “Potential Vegetation area”.
It is important to note that, in order to present the processing results more clearly, we have utilized the appropriate color mode for display. In image I3, the color change from red to blue represents the distance between the foreground pixels and the background pixels, and the red color indicates the distance is further away; in image I4, the light blue on the top and the yellow and red on the left local zoom represent different seed areas, and the dark blue in the middle represents the background. In image I5, the red color represents the uncertain areas; in image I6, the dark blue area labeled “PVA” is the potential vegetation area.
2.2.2 Vegetation index
Vegetation index is a technique developed from remote sensing. By analyzing the differences in the different spectral curves presented by different objects in images taken by multi/hyperspectral satellites, data in specific bands can be combined to highlight the representation of specific object characteristics. This technique can distinguish between object types or related object characteristics, such as plant or vegetation abundance, in remotely sensed images. As there are more types of vegetation indices, they should be selected according to the actual situation, such as remote sensing image type, band composition, land cover type, vegetation type, etc., to achieve more accurate extraction results. For general RGB images, vegetation indices containing only visible bands should be selected. Common visible band vegetation indices are shown in Eqs 1–6:
In the equations: ρr, ρg, ρb are the image pixel values of the red, green and blue 3 bands respectively.
2.2.3 OTSU image segmentation
The OTSU method (Otsu, 1979) is an algorithm used to determine optimal segmentation thresholds for image binarization. This algorithm automatically calculates the thresholds based on the characteristics of the image (Yang et al., 2014). The specific calculation process is shown in Eq. 7:
where
The OTSU method, also known as the maximum inter-class variance method, offers several advantages: it involves simple calculations, is convenient to use, and is unaffected by the image’s brightness. Additionally, it enables fast segmentation in a simple bimodal scene. However, there are also some disadvantages to consider. The method is susceptible to noise interference, and when the image lacks distinct bimodal peaks, accurate segmentation cannot be achieved. Furthermore, its effectiveness diminishes when applied to images with multiple peaks.
2.2.4 Canny operator
The Canny operator is an exact edge detection algorithm known for its robust resistance to interference. It incorporates dual thresholds and multi-level characteristics, which make it adaptable to complex images. The fundamental principle of Canny edge detection involves converting an image to grayscale and identifying edges by detecting significant variations in grey values (Ding and Goshtasby, 2001; McIlhagga, 2011). This is based on the observation that changes in luminance typically occur at the edges of the image. Mathematically, this can be achieved by calculating the first-order partial derivatives, where points with extremely large partial derivatives represent the edges of the image (Liu and Jezek, 2004), the specific calculation process is shown in Eq. 8.
Where Gx, Gy denote the first-order partial derivatives at the point (x,y) in the image f, respectively.
2.2.5 Marked watershed algorithm
The Watershed algorithm belongs to the category of image segmentation algorithms. Its principle involves mapping the same gray levels in an image to contour lines in geography, creating a topographic surface defined by the gray values of the image. Basins are formed in areas with extremely low gray values (Kornilov & Safonov, 2018). If we imagine water flooding the surface from the lowest point, dams are built to prevent adjacent basins from merging. These dams, known as watershed lines, serve as the segmentation lines for the image. The watershed algorithm has several advantages, including its simplicity, intuitiveness, and potential for parallelization. However, it has a significant drawback, which is over-segmentation caused by numerous local minima in the image. To mitigate the severe over-segmentation issue, the marked watershed algorithm has been proposed.
In the marked watershed algorithm, the foreground and the background are automatically determined by integrating techniques like edge detection, binarization, and morphological operations. Then, a distance transformation is conducted to generate the watershed seed areas. However, since vegetation texture tends to be more intricate, while water bodies exhibit relatively uniform and cohesive textures, we designate the water bodies as the foreground to obtain smoother segmentation boundaries in vegetation extraction.
2.2.6 Kappa coefficient
Classification accuracy is also calculated using the Kappa coefficient (Foody, 2002), the specific calculation process is shown in Eq. 9.
where Po represents the agreement between predicted results and actual results, which can be calculated using a confusion matrix. Pe refers to the agreement between predicted results and actual results when the predictions are made randomly. As the Kappa coefficient approaches 1, it signifies an increased degree of concordance in classification. When approaching 0, it suggests that classification performance is equivalent to random predictions. However, once it approaches −1, it indicates reduced consistency in classification compared to random predictions.
3 Results
3.1 Extracting vegetation cover using only vegetation indices
In Figure 1, the green vegetation information of each region appears to be highly similar. To select an optimal threshold for vegetation recognition, we plotted the histogram corresponding to the VDVI and identified the lowest value of 0.11 between the double peaks. This threshold has proven to be more accurate in extracting vegetation information from our images. Consequently, we have chosen to use this threshold consistently throughout our subsequent VDVI-based vegetation extraction processes.
The results of threshold segmentation after calculating the VDVI vegetation index for each subplot in Figure 1 are shown in Figure 3. As can be seen from the figure, all subplots have water bodies that are difficult to completely separate from the vegetation. Because the color of the water body is similar to the vegetation, setting a larger segmentation threshold can further separate the water body. However, it will also lead to a large amount of vegetation loss.
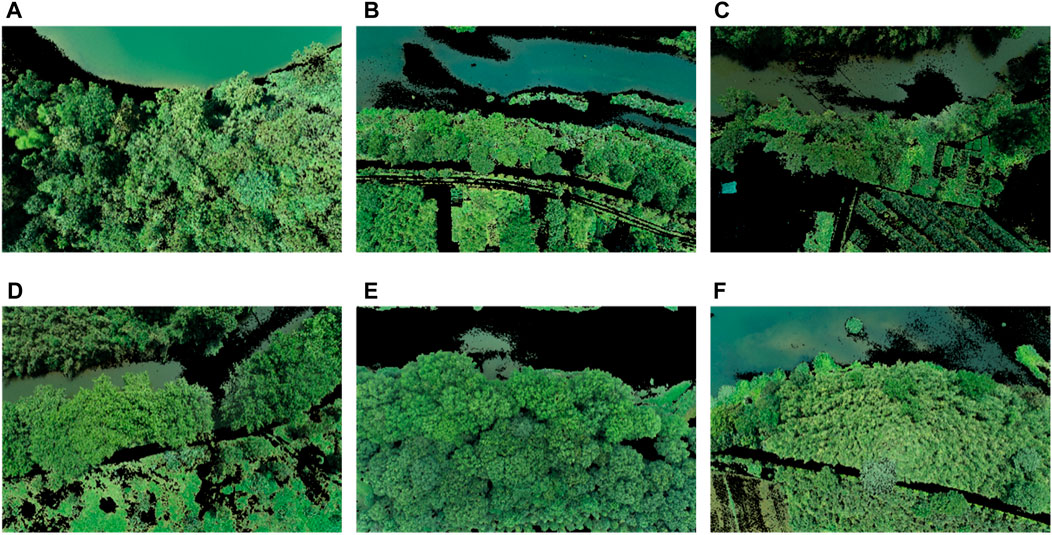
Figure 3. The results of extracting vegetation cover using only vegetation indices (green indicates areas identified as vegetation, while black indicates areas identified as non-vegetation): (A) Region I, (B) Region II, (C) Region III, (D) Region IV, (E) Region V, (F) Region VI.
3.2 Extracting vegetation cover using only texture information
Figure 4 shows the threshold segmentation results of the Canny edge detection for each subplot shown in Figure 1. It can be seen that all subplots can effectively separate water bodies, but they cannot completely exclude the non-vegetated surface cover. Additionally, the most serious issue is that a large number of voids appear within the vegetation cover. The Otsu algorithm is utilized to automatically determine the threshold value in this method. While setting a larger segmentation threshold can help in further separating the non-vegetated surface cover, it comes at the cost of potentially losing a significant amount of vegetation and creating larger voids within the vegetation cover.
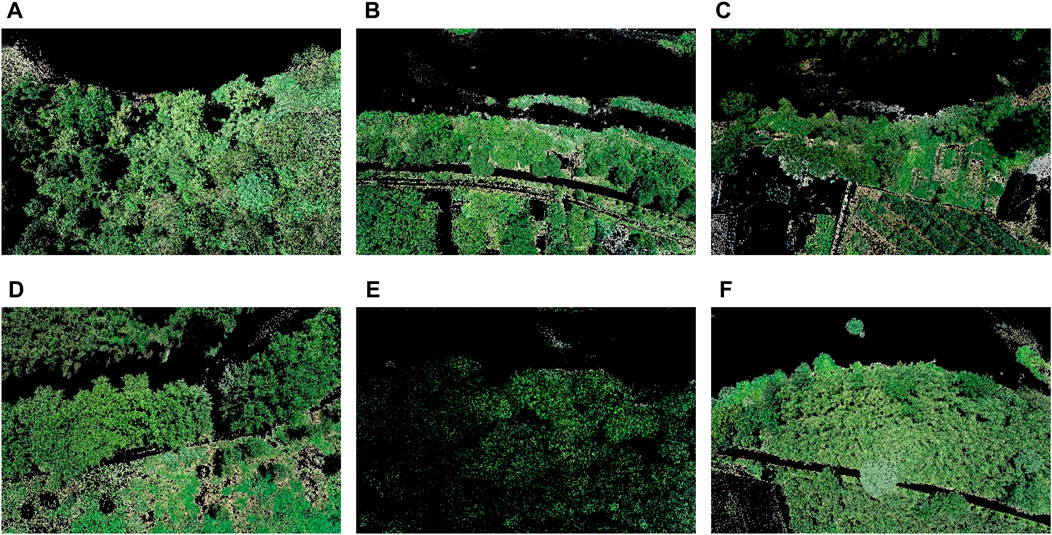
Figure 4. The results of extracting vegetation cover using canny edge detection only: (A) Region I, (B) Region II, (C) Region III, (D) Region IV, (E) Region V, (F) Region VI.
3.3 Extraction of vegetation cover using our method
The results of extracting the vegetation cover of each subplot in Figure 1 using the method proposed in this paper are shown in Figure 5. It can be seen from the figure that all the water bodies, which can easily be confused with vegetation, have been excluded completely in all the subplots, while the vegetation has been retained to the maximum extent.
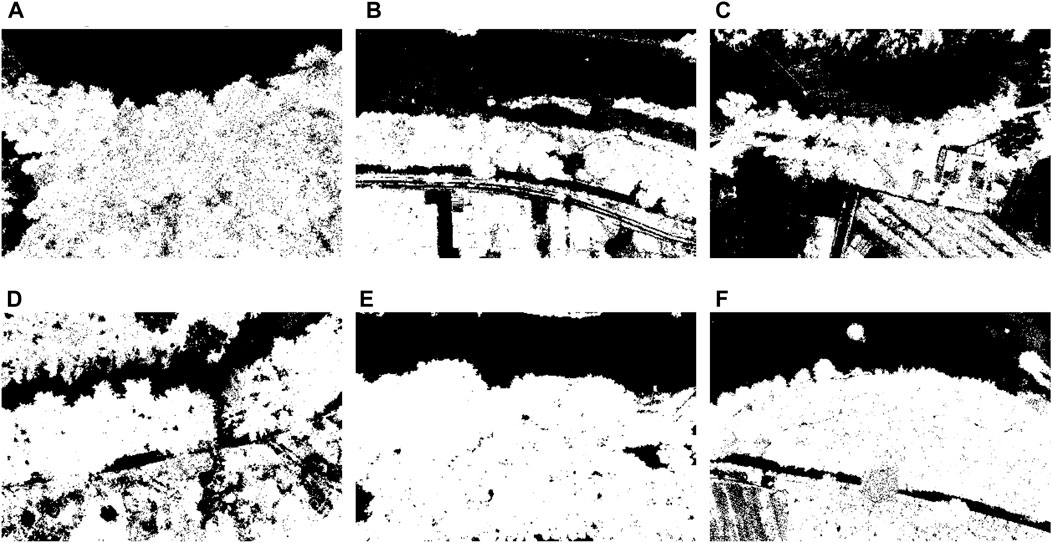
Figure 5. The results of extracting vegetation cover using our method: (A) Region I, (B) Region II, (C) Region III, (D) Region IV, (E) Region V, (F) Region VI.
To quantitatively assess the accuracy of vegetation extraction, water bodies were manually labeled and removed from each subplot in Figure 1. The VDVI vegetation index was then calculated, and the vegetation was extracted. The extraction results were compared with those obtained by the method in this paper, and the confusion matrix was calculated to obtain the overall accuracy, producer accuracy, and user accuracy, as shown in Table 1. The table shows that the overall accuracy of all regions is above 95% except for region (c), where the overall accuracy is slightly below 95%. The user accuracy is very high in all regions, while the producer accuracy is slightly lower. Among them, the producer accuracy of region (c) is slightly lower than 90% because there is relatively less vegetation cover in the region (c), and more dark shadows cover the vegetation. This causes the edge detection algorithm to have lower values in these areas, which are swamped and marked as the foreground in the watershed algorithm, resulting in non-vegetated areas.
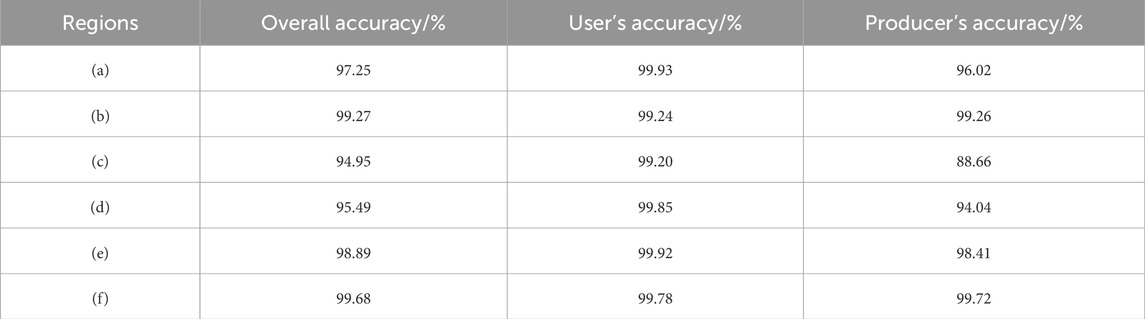
Table 1. Accuracy after interference removal using our method.
3.4 Vegetation extraction for public datasets with ground truth using our method
The Urban Drone Dataset (UDD) (Chen et al., 2018) was collected using the DJI Phantom 4 at heights ranging from 60 to 100 m. The image size is 3000 × 4000 or 4096 × 2160. This dataset is divided into three types: UDD3, UDD5, and UDD6, each representing different scenarios. To validate the accuracy of our method, we selected three images (Figures 6A–C) from UDD5 that resemble the riparian zone environment, and their corresponding ground truth labels were provided (Figures 6D–F). The results of extracting the vegetation cover of each subplot in Figures 6A–C using the method proposed in this paper are shown in Figures 6G–I. The extraction results are compared with the true values of the images, and the extraction accuracy is calculated, as shown in Table 2.
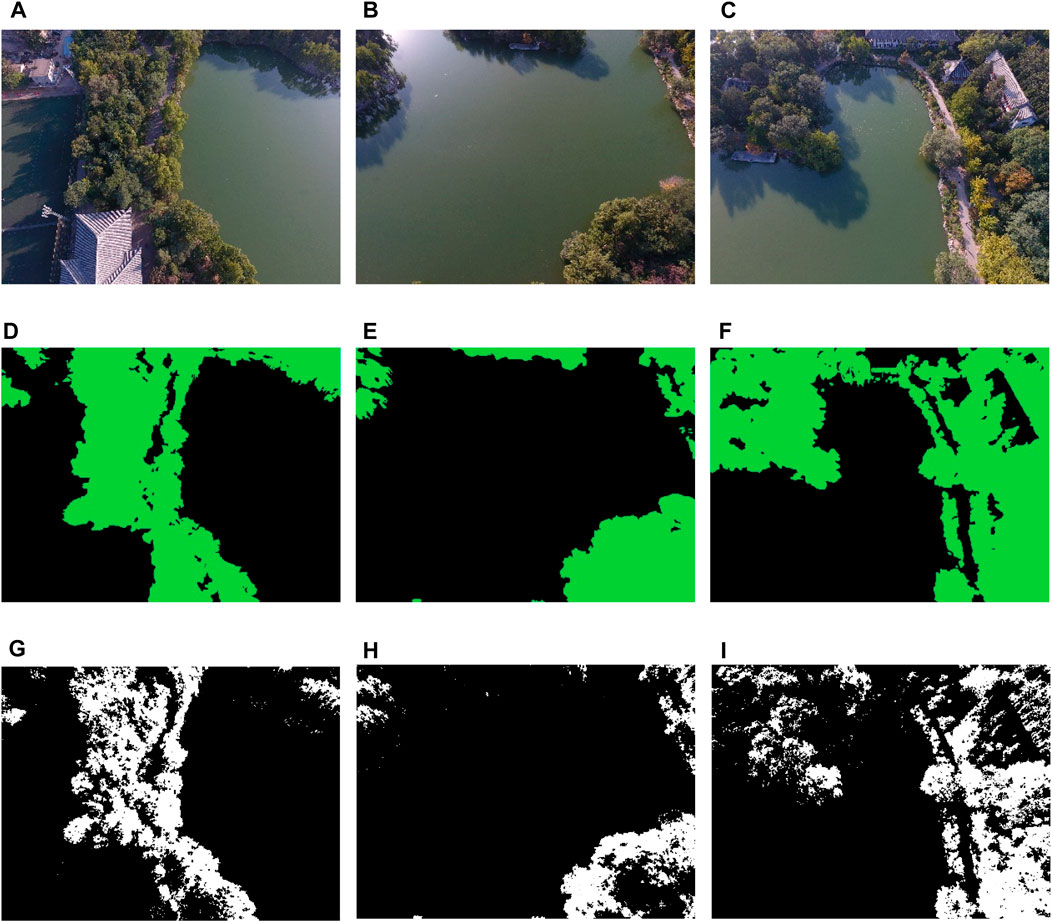
Figure 6. The Urban Drone Dataset image and corresponding vegetation extraction results, (A–C): original images of three different regions, (D–F): labeled image corresponding to the original image, where green indicates vegetation, and other colors represent non-vegetation, (G–I): The results of extracting vegetation cover using our method.
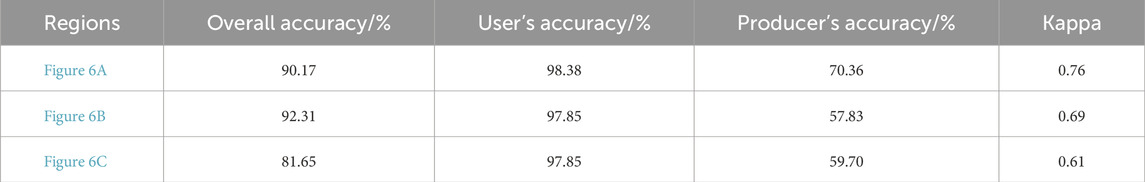
Table 2. VDVI extraction accuracy after eliminating interference.
From Figure 6, it can be seen that the original image in UDD5 is darker and has more shadows and reflections. On the other hand, from Table 2, the overall accuracy and kappa coefficient of classification of this paper’s method for Figures 6A–C are 90.17%, 92.31%, 81.65%, and 0.76, 0.69, 0.61, respectively. However, the producer accuracy is lower, 70.36%, 57.83%, and 59.7% in Figures 6A–C, respectively. Figure 6B has the highest Overall Accuracy, but it has a lower Kappa than Figure 6A due to its uneven distribution of error pixels. Specifically, compared to Figures 6A,B has fewer errors in recognizing water body pixels as vegetation pixels, leading to a slightly higher Overall Accuracy. The uniformity of the error pixel distribution directly influences the Kappa coefficient. Figure 6B has fewer error pixels, and the distribution location of these pixels is not uniform enough, resulting in a lower Kappa coefficient for Figure 6B than for Figure 6A.
4 Discussion
4.1 Choice of edge detection operator
The Canny and Sobel operators are widely used algorithms for image edge detection. The Canny operator determines image edges by considering the direction and magnitude of the gradient, while the Sobel operator calculates the gradient using pixel value differences (simple subtraction of two pixels). As a result, the Canny operator can preserve edge continuity more effectively during edge detection, resulting in more detailed and clearer detected edges, especially in scenes that require high-precision edge detection, such as image recognition. On the other hand, the Sobel operator may introduce significant errors when processing right-angled edges. However, it is faster than the Canny operator, making it more suitable for real-time applications requiring higher speed, such as video surveillance.
In order to find edge detection operators suitable for the characteristics of riparian zone images, in this study, we considered the Canny operator and Sobel operator, which are outstanding in edge recognition accuracy and noise point sensitivity. We converted Figures 1A–C from RGB images to grayscale images and then utilized Canny and Sobel edge detection operators and marked the areas in the images where segmenting the boundaries along the water body was challenging using red boxes, as illustrated in Figure 7. These challenging regions exhibit characteristics such as shallow water bodies near the shore, with a color that appears closer to the shore, and contain various undesirable elements, including scum, garbage, and power lines. All these interferences directly affect the edge detection effect of the two operators. However, it is evident that Canny detection retains more edge information than Sobel detection and provides a more refined detection. Therefore, we chose the Canny operator as the pre-extraction segmentation algorithm before the detection of the watershed algorithm.
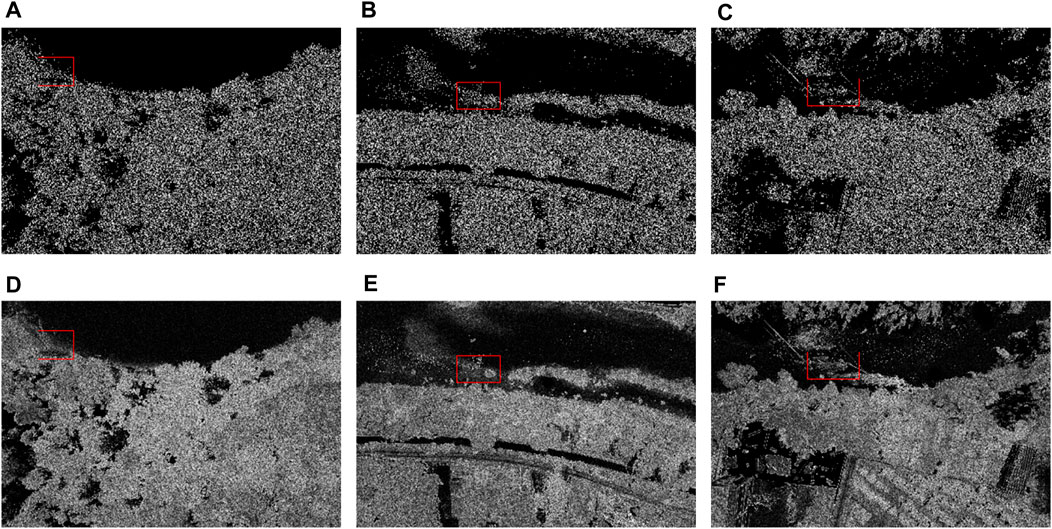
Figure 7. The results using different edge detection operators: (A), (B), and (C) correspond to the detection results using the Canny operator for areas depicted in Figures 1A–C, respectively; (D), (E), and (F) correspond to the detection results using the Sobel operator for areas shown in Figures 1A–C, respectively.
The watershed algorithm was used to segment the results of Canny and Sobel edge detection for Figures 1A–C, as shown in Figure 8. It can be seen from the images that the segmentation results based on the Canny operator are more accurate. As indicated by the yellow boxes in the images, we can observe that for Figure 1B, the segmentation result based on the Canny operator successfully separated non-water areas locally (Figure 8B), while the result from the Sobel operator did not (Figure 8E). Similarly, for Figure 1C, the segmentation result based on the Canny operator segmented water areas locally (Figure 8C), while the result from the Sobel operator did not (Figure 8F). Comparing Figure 1 and Figure 8, we can see that although Figure 8 shows some oversegmentation, water bodies and potential vegetation were separated into different colour areas. Therefore, after extracting the potential vegetation areas, vegetation extraction can be achieved using vegetation indices.
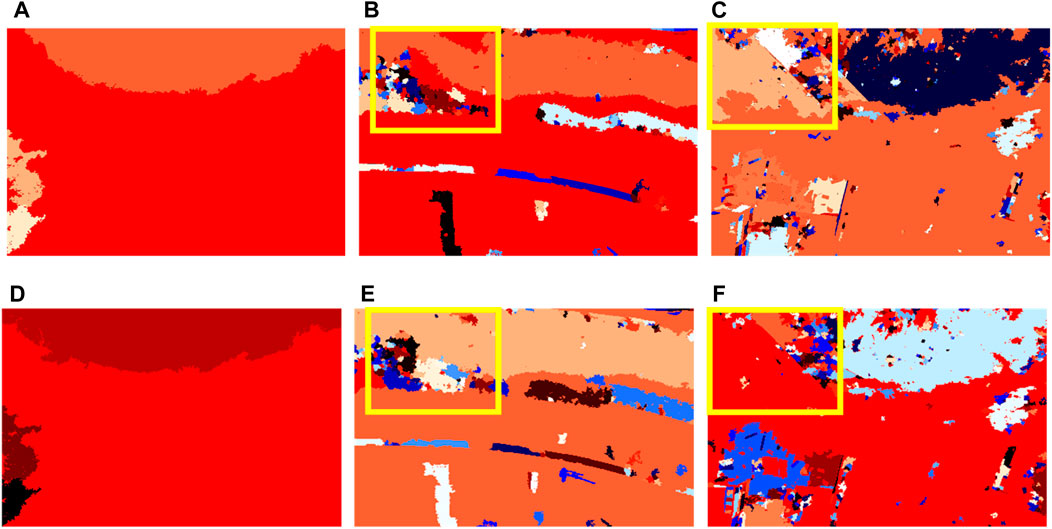
Figure 8. The results of watershed segmentation based on different edge detection operators, (A–C): based on Canny edge detection, (D–F): based on Sobel edge detection.
4.2 Choice of visible light vegetation indices
Several visible light vegetation indices are currently proposed, depending on the purpose of the application. Each of these indices has advantages and disadvantages in distinguishing land cover types. In order to select the most appropriate index, six visible light indices were selected for testing in this paper. First, a UDD5 scene image (Figure 6A) was selected. After removing the water body interference using the method in this paper, the potential vegetation areas were extracted by vegetation segmentation using VDVI, DEVI, RGBVI, MGRVI, NGRDI, and NGBDI, respectively. Following the vegetation extraction approach used in Figure 6A, we also processed Figure6B,C. As shown in Table 3, for different vegetation indices, we calculated the average of each evaluation metric across the three images.
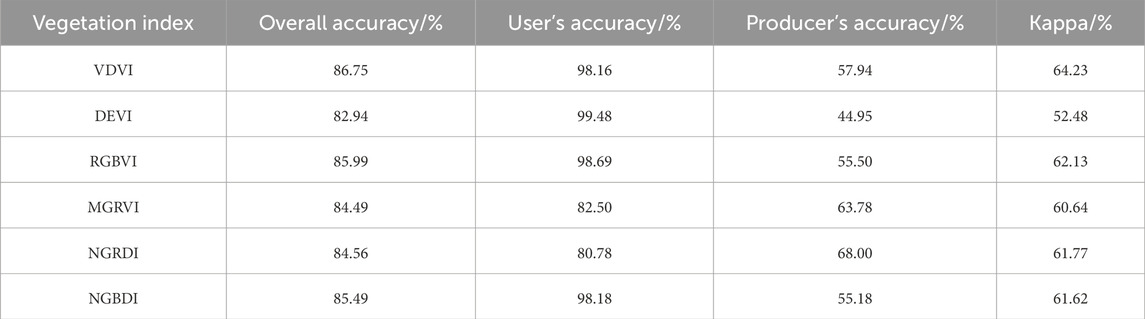
Table 3. Mean extraction accuracy of different vegetation indices.
As can be seen from Table 3, VDVI has the highest accuracy, with the overall accuracy and kappa coefficient reaching 86.75% and 0.6423, respectively. Secondly, for the sub-map with relatively complex land cover types (Figure 1C), Figure 9 presents the histograms of the six visible vegetation indices of the potentially vegetated areas after removing the water body using this method.
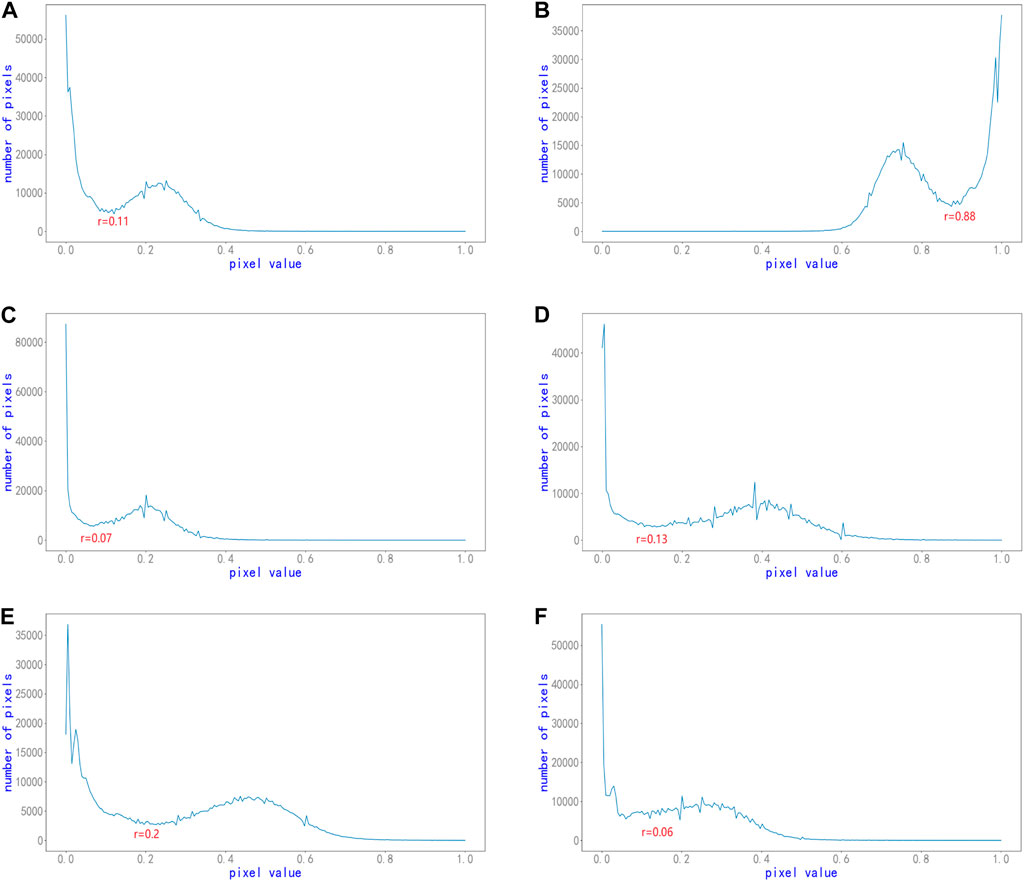
Figure 9. Histograms of different vegetation indices: (A) VDVI, (B) DEVI, (C) NGRDI, (D) MGRVI, (E) RGBVI, (F) NGBDI for Figure 1C).
As can be seen in Figure 9, although the histogram distributions of the different vegetation indices varied greatly, they basically maintained a bimodal distribution. This ensures the correctness of the subsequent segmentation of vegetation and non-vegetation using the OTSU method. The optimal segmentation thresholds for subplots from (a) to (f) in Figure 9 are 0.11, 0.88, 0.07, 0.13, 0.2, and 0.06, respectively. Among them, the histogram distribution of the VDVI indices satisfies both the undulating and smooth requirements, leading to more accurate segmentation results.
4.3 Selection of P parameter values in marked watershed algorithm
In Figure 2, the maximum value resulting from the Distance Transformation is multiplied by a percentage value (denoted as P), and this product is set as a threshold. This threshold is then used for threshold segmentation of the Distance Transformation image I3 to obtain the Seed Areas image I4. By adjusting the value of P, we can influence the number of Seed Areas and, consequently, the segmentation results that follow. The marked watershed algorithm utilizes the P parameter value to regulate the smoothness of boundaries and the fineness of segmentation results. Higher p values produce smoother boundaries and more consistent area segmentation, while lower p values generate more detailed but less consistent boundaries. As a key factor in determining the efficacy and outcome of the algorithm, the P parameter value significantly impacts the overall performance. For instance, Figures 10A–C presents an example where P is systematically increased at 0.2 intervals from 0.3 for Figure 1B. The figures clearly illustrate the decrease in the number of seed areas with an increase in P. However, too few seed areas may result in certain water bodies being overlooked in the segmentation process, leading to their inclusion in the potential vegetation areas. This, in turn, may cause errors in the final vegetation segmentation, as depicted in the red-boxed portion of Figures 10D–F.
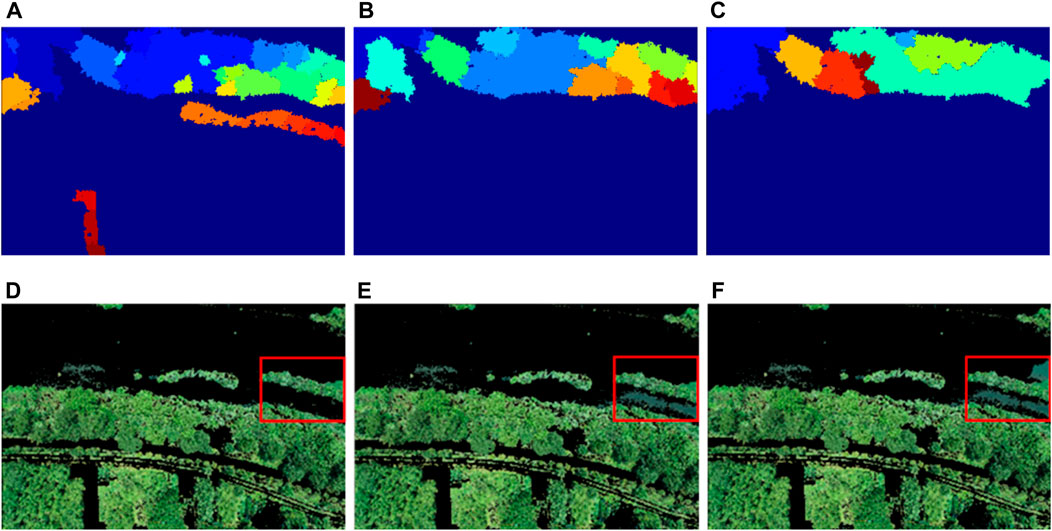
Figure 10. The effects of different p values for Figure 1B: Specifically, (A) and (D) correspond to P equaling 0.3, (B) and (E) represent P equaling 0.5, while (C) and (F) depict P equaling 0.7.
4.4 Defects and deficiencies—special textures and shadows
The segmentation process, which involves distinguishing water body areas from potential vegetation areas, relies heavily on the disparity between the textures of water bodies and vegetation. Consequently, areas with water bodies exhibiting similar textures to vegetation textures will likely be erroneously classified as potential vegetation areas during the segmentation. Additionally, if such areas also exhibit high values for the VDVI index, it becomes challenging to differentiate them from actual vegetation using the approach outlined in this paper. This challenge is demonstrated by the red and yellow boxed sections in Figures 11A, B and the white boxes in Figures 11C, D. However, if the water body areas do not exhibit high VDVI values, the method outlined in this paper can still successfully remove these areas at the OTSU segmentation stage, as shown in the blue box portion of Figures 11E, F.
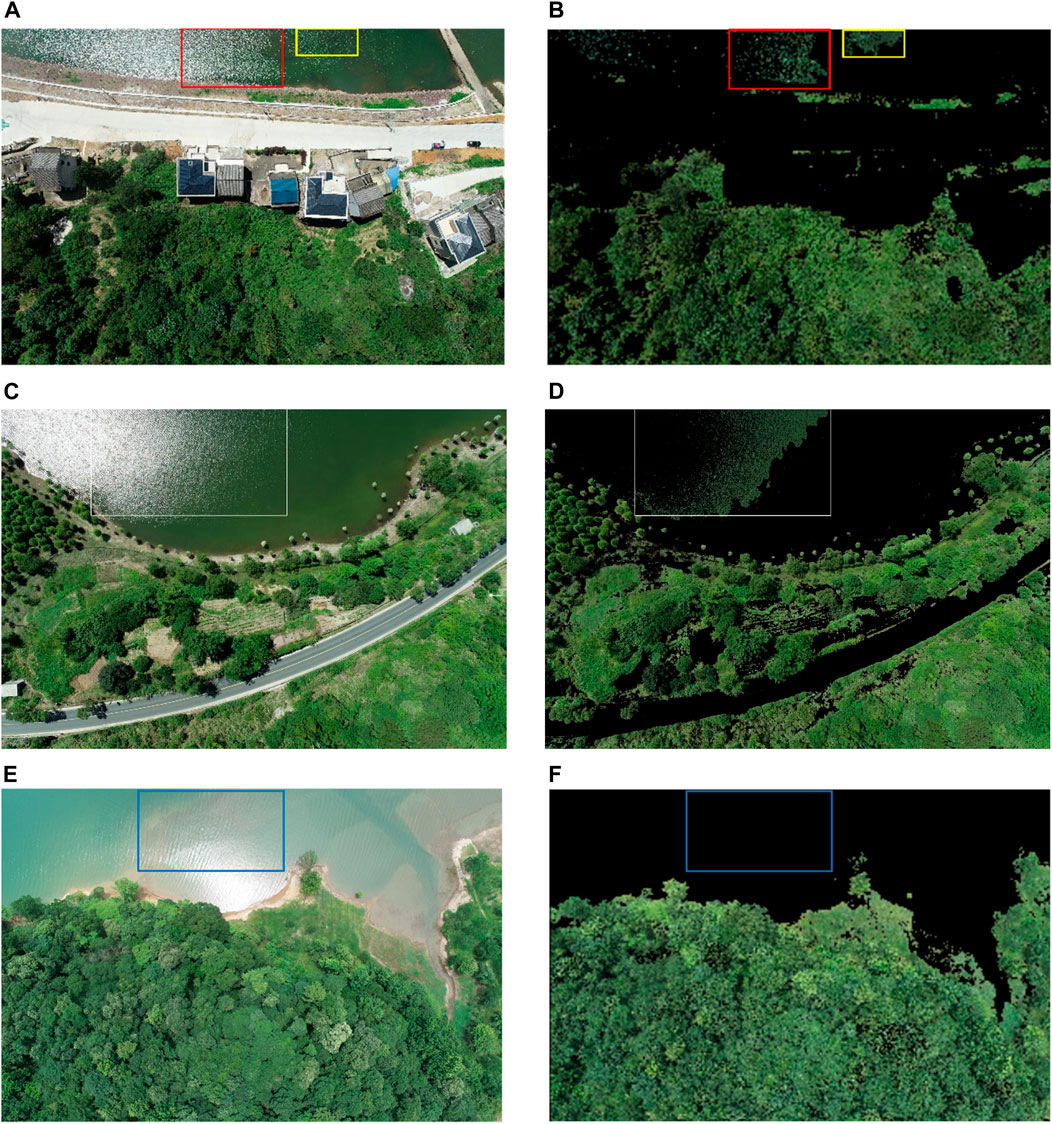
Figure 11. Vegetation extraction results for different water colours and ripples, (A–D): High-strength water ripple, (E F): Low-strength water ripple.
Table 2 demonstrates that the method proposed in this paper achieves a high overall accuracy and a high user accuracy, implying that our approach has fewer instances of misclassification. However, the lower producer accuracy suggests that the method occasionally fails to correctly classify certain categories, as illustrated in Figure 6. This discrepancy can be attributed primarily to the time and angle at which the image was captured. As can be seen in Figure 6, the images of the UDD5 dataset were basically taken in the evening with insufficient light, while the sun was tilted at a large angle. The low illumination condition (C) in Figure 6 was utilized for vegetation extraction with the method described in this paper, and the results are depicted in Figure 12, this lighting condition results in darker shadows on vegetation (indicated by the red box) and shaded water bodies (indicated by the yellow box). These darker shadows cause a loss of textural information in the areas where the watershed algorithm cannot flood, and as such, they cannot be excluded from the segmentation process (as indicated by the yellow box). Additionally, these darker shadows significantly lower VDVI values, resulting in a greater loss of vegetation categories (as indicated by the red box). However, these problems can be easily overcome by selecting a clear and cloudless midday period for data acquisition, which avoids low light and strong shadows, thus achieving high segmentation accuracy.
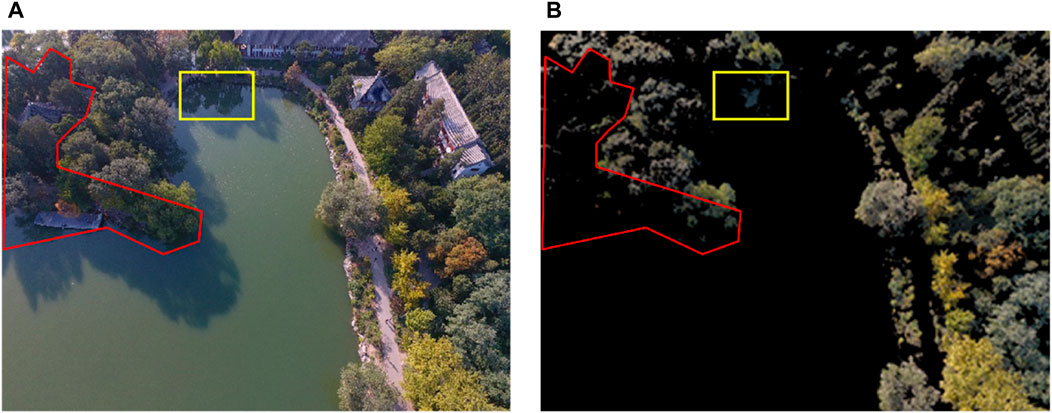
Figure 12. Effect of shadows and reflections on vegetation extraction: (A) Original image, (B) Vegetation extraction results of the method in this paper..
5 Conclusion
In this study, we have introduced a straightforward and efficient approach capable of automatically extracting riparian zone vegetation from aerial UAV images containing only visible bands despite the numerous disturbing factors encountered in complex riparian zones. Some of these factors include shallows, green algae, flotsam, sunlight reflections, and tree shadows. Specifically:
1 The method proposed in this paper presents a novel idea to solve the challenge of vegetation extraction in riparian zones and can achieve this goal solely based on the visible band vegetation index. This approach has significant practical applications.
2 Although the method proposed in this paper demonstrates some ability to mitigate factors that interfere with vegetation extraction, further research is required to address other characteristic interferences that are similar to vegetation. This includes optimizing the method for scenarios characterized by high-intensity ripple interference.
3 Regarding the accuracy assessment, the dense vegetation and high image resolution in the study area pose challenges in manually labeling images to obtain ground-truth data. This complexity may introduce limitations to the accuracy of the truth-value images used in our accuracy validation. Consequently, future research should aim to further investigate this issue, with the goal of acquiring more accurate vegetation distribution maps of the riparian zone to serve as reference data.
4 Currently, research on vegetation extraction has expanded to the field of deep learning. However, there is still a lack of deep learning techniques for semantic segmentation of riparian zone vegetation due to the challenges in manually labeling images for training. The proposed method in this article can provide helpful vegetation labels for riparian zone images, addressing the issue of insufficient existing datasets and serving as a reference for future research on deep learning-based vegetation extraction.
Data availability statement
The original contributions presented in the study are included in the article/Supplementary material, further inquiries can be directed to the corresponding authors.
Author contributions
YM: Data curation, Formal Analysis, Software, Validation, Visualization, Writing–original draft. XC: Conceptualization, Formal Analysis, Funding acquisition, Investigation, Methodology, Software, Supervision, Visualization, Writing–original draft, Writing–review and editing. YZ: Investigation, Project administration, Resources, Supervision, Validation, Visualization, Writing–original draft, Writing–review and editing.
Funding
The author(s) declare that financial support was received for the research, authorship, and/or publication of this article. This research was funded by two sources. The first source of funding was the Yunnan Provincial Agricultural Basic Research Joint Special Project, supported by the Yunnan Provincial Science and Technology Department, with Grant No. 202101BD070001-042. The second source of funding came from the Yunnan Ten-thousand Talents Program, supported by the Yunnan Provincial Department of Human Resources and Social Security.
Conflict of interest
The authors declare that the research was conducted in the absence of any commercial or financial relationships that could be construed as a potential conflict of interest.
Publisher’s note
All claims expressed in this article are solely those of the authors and do not necessarily represent those of their affiliated organizations, or those of the publisher, the editors and the reviewers. Any product that may be evaluated in this article, or claim that may be made by its manufacturer, is not guaranteed or endorsed by the publisher.
References
Behera, T. K., Bakshi, S., and Sa, P. K. (2022). Vegetation extraction from UAV-based aerial images through deep learning. Comput. Electron. Agric. 198, 107094. doi:10.1016/j.compag.2022.107094
Bendig, J., Yu, K., Aasen, H., Bolten, A., Bennertz, S., Broscheit, J., et al. (2015). Combining UAV-based plant height from crop surface models, visible, and near infrared vegetation indices for biomass monitoring in barley. Int. J. Appl. Earth Observation Geoinformation 39, 79–87. doi:10.1016/j.jag.2015.02.012
Bhatnagar, S., Gill, L., and Ghosh, B. (2020). Drone image segmentation using machine and deep learning for mapping raised bog vegetation communities. remote Sens. 12, 2602. doi:10.3390/rs12162602
Chen, Y., Wang, Y., Lu, P., Chen, Y., and Wang, G. (2018). “Large-scale structure from motion with semantic constraints of aerial images,” in Pattern Recognition and Computer Vision: First Chinese Conference, PRCV 2018, Guangzhou, China, November 23-26, 2018 (Springer International Publishing), 347–359.
Ding, L., and Goshtasby, A. (2001). On the Canny edge detector. Pattern Recognit. 34, 721–725. doi:10.1016/s0031-3203(00)00023-6
Duo, L., and Yu, R. (2020). New grassland riparian zone delineation method for calculating ecological water demand to guide management goals. River Res. Appl. 36, 1838–1851. doi:10.1002/rra.3707
Foody, G. M. (2002). Status of land cover classification accuracy assessment. Remote Sens. Environ. 80, 185–201. doi:10.1016/s0034-4257(01)00295-4
Gao, L., Wang, X., Johnson, B. A., Tian, Q., Wang, Y., Verrelst, J., et al. (2020). Remote sensing algorithms for estimation of fractional vegetation cover using pure vegetation index values: a review. ISPRS J. Photogrammetry Remote Sens. 159, 364–377. doi:10.1016/j.isprsjprs.2019.11.018
Hamylton, S. M., Morris, R. H., Carvalho, R. C., Roder, N., Barlow, P., Mills, K., et al. (2020). Evaluating techniques for mapping island vegetation from unmanned aerial vehicle (UAV) images: pixel classification, visual interpretation and machine learning approaches. Int. J. Appl. Earth Observation Geoinformation 89, 102085. doi:10.1016/j.jag.2020.102085
Kornilov, A. S., and Safonov, I. V. (2018). An overview of watershed algorithm implementations in open source libraries. J. Imaging 4, 123. doi:10.3390/jimaging4100123
Kutz, K., Cook, Z., and Linderman, M. (2022). Object based classification of a riparian environment using ultra-high resolution imagery, hierarchical landcover structures, and image texture. Sci. Rep. 12, 11291. doi:10.1038/s41598-022-14757-y
Laslier, M., Hubert-Moy, L., Corpetti, T., and Dufour, S. (2019). Monitoring the colonization of alluvial deposits using multitemporal UAV RGB-imagery. Appl. Veg. Sci. 22, 561–572. doi:10.1111/avsc.12455
Liu, H., and Jezek, K. C. (2004). Automated extraction of coastline from satellite imagery by integrating Canny edge detection and locally adaptive thresholding methods. Int. J. Remote Sens. 25, 937–958. doi:10.1080/0143116031000139890
Mcllhagga, W. (2011). The Canny edge detector revisited. Int. J. Comput. Vis. 91, 251–261. doi:10.1007/s11263-010-0392-0
Meyer, G., and Neto, J. (2008). Verification of color vegetation indices for automated crop imaging applications. Comput. Electron. Agric. 63, 282–293. doi:10.1016/j.compag.2008.03.009
Müllerová, J., Gago, X., Bučas, M., Company, J., Estrany, J., Fortesa, J., et al. (2021). Characterizing vegetation complexity with unmanned aerial systems (UAS) – a framework and synthesis. Ecol. Indic. 131, 108156. doi:10.1016/j.ecolind.2021.108156
Onishi, M., and Lse, T. (2021). Explainable identification and mapping of trees using UAV RGB image and deep learning. Sci. Rep. 11, 903. doi:10.1038/s41598-020-79653-9
Otsu, N. (1979). A threshold selection method from gray-level histograms. IEEE Trans. Syst. Man, Cybern. 9, 62–66. doi:10.1109/tsmc.1979.4310076
Rusnák, M., Goga, T., Michaleje, L., Šulc Michalková, M., Máčka, Z., Bertalan, L., et al. (2022). Remote sensing of riparian ecosystems. Remote Sens. 14, 2645. doi:10.3390/rs14112645
Verhoeven, J. T. (2014). Wetlands in Europe: perspectives for restoration of a lost paradise. Ecol. Eng. 66, 6–9. doi:10.1016/j.ecoleng.2013.03.006
Wang, X., Wang, M., Wang, S., and Wu, Y. (2015). Extraction of vegetation information from visible unmanned aerial vehicle images. Trans. Agric. Eng. 31, 152–159. doi:10.3969/j.issn.1002-6819.2015.05.022
Xu, A., Wang, F., and Li, L. (2023). Vegetation information extraction in karst area based on UAV remote sensing in visible light band. Optik - Int. J. Light Electron Opt. 272, 170355. doi:10.1016/j.ijleo.2022.170355
Xu, F., Gao, Z., Jiang, X., Ning, J., Zheng, X., Song, D., et al. (2017). Mapping of green tide using true color aerial photographs taken from a unmanned aerial vehicle. Remote Sensing and Modeling of Ecosystems for Sustainability XIV. SPIE 10405, 152–157. doi:10.1117/12.2271724
Yang, K., Li, M., Liu, Y., Cheng, L., Duan, Y., and Zhou, M. (2014). River delineation from remotely sensed imagery using a multi-scale classification approach. IEEE J. Sel. Top. Appl. Earth Observations Remote Sens. 7, 4726–4737. doi:10.1109/jstars.2014.2309707
Zhang, X., Zhang, F., Qi, Y., Deng, L., Wang, X., and Yang, S. (2019). New research methods for vegetation information extraction based on visible light remote sensing images from an unmanned aerial vehicle (UAV). Int. J. Appl. Earth Observation Geoinformation 78, 215–226. doi:10.1016/j.jag.2019.01.001
Keywords: UAV, riparian zone, marked watershed algorithm, vegetation index, vegetation extraction
Citation: Ma Y, Chen X and Zhang Y (2024) Vegetation extraction in riparian zones based on UAV visible light images and marked watershed algorithm. Front. Earth Sci. 12:1363571. doi: 10.3389/feart.2024.1363571
Received: 31 December 2023; Accepted: 22 March 2024;
Published: 08 April 2024.
Edited by:
Jie Cheng, Beijing Normal University, ChinaCopyright © 2024 Ma, Chen and Zhang. This is an open-access article distributed under the terms of the Creative Commons Attribution License (CC BY). The use, distribution or reproduction in other forums is permitted, provided the original author(s) and the copyright owner(s) are credited and that the original publication in this journal is cited, in accordance with accepted academic practice. No use, distribution or reproduction is permitted which does not comply with these terms.
*Correspondence: Xu Chen, Y2hlbnh1QHlubnUuZWR1LmNu; Yaping Zhang, emhhbmd5cEB5bm51LmVkdS5jbg==