 Qinlai Lian
 Yu Zhang
 Xiaoyu Liu1,2
- 1Laboratory for Coastal Ocean Variation and Disaster Prediction, College of Ocean and Meteorology, Guangdong Ocean University, Zhanjiang, China
- 2CMA-GDOU Joint Laboratory for Marine Meteorology, South China Sea Institute of Marine Meteorology, Guangdong Ocean University, Zhanjiang, China
- 3Key Laboratory of Climate, Resources and Environment in Continental Shelf Sea and Deep Ocean, Guangdong Ocean University, Zhanjiang, China
- 4Shenzhen Institute of Guangdong Ocean University, Shenzhen, China
This study utilizes the Weather Research and Forecasting (WRF) to comparatively analyze the impact of three vertical grid resolution (VGR) enhancement schemes on the simulation of super typhoon Lekima under two different horizontal resolutions. The relationship between structural changes and typhoon intensity is explored from the perspective of the simulated three-dimensional thermodynamic and dynamic structure of the typhoon. The main conclusions obtained are as follows: Typhoon track simulation is not sensitive to the setting of VGR, while intensity simulation is greatly affected by it. Increasing VGR in the lower layer can enhance the simulated intensity of the typhoon, but when VGR enhancement is made in the middle layer, the simulated typhoon intensity decreases. For VGR enhancement in the upper levels, it is only when coupled with a simultaneous increase in horizontal resolution that the simulated typhoon intensity is enhanced. Different VGR enhancement schemes result in significant differences in the simulated thermodynamic and dynamic structures of the typhoon, which is a crucial factor causing variations in simulated typhoon intensity. In terms of dynamics, increasing VGR in the lower layer reduces the hydrostatic stability of the lower troposphere, which enhances convection and improves its symmetry. This leads to strengthened inflow and outflow activities of the typhoon, resulting in a stronger simulated typhoon with a tighter and straighter eyewall. In terms of thermal structure, increasing VGR in both the lower and upper levels enhances the warm core of the typhoon, thereby increasing its simulated intensity. However, the warm core simulated with upper layer enhancement extends to a higher altitude. This may be related to two different heating mechanisms, where lower layer VGR enhancement has a more pronounced effect on changes in boundary layer latent heat flux, while upper layer VGR enhancement promotes more sinking of high-entropy air from higher levels.
1 Introduction
Tropical cyclones (TCs) are cyclonic vortex systems with a warm core structure generated over warm sea surfaces in tropical or subtropical regions (Kepert, 2010). Influenced by the Warm Pool in the Northwest Pacific, this region stands out as the most active for TC activity globally (Chan and Liu, 2004; Klotzbach, 2006). TCs in this area typically follow a northwestward track under the combined effects of the beta effect and large-scale steering flows, constituting threats to the coastal areas of Southeast China (Chan, 2010). These regions are often severely affected by the landfall of TCs, posing significant risks to the lives and properties of the coastal residents (Zhang and Chen, 2019; Ren et al., 2022). Therefore, enhancing the forecast capability of TCs in the Northwest Pacific is crucial for disaster prevention and mitigation.
In recent years, advancements in observation technologies, data assimilation, and numerical models have led to substantial improvements in TC track forecasts (Pu et al., 2009; Tan et al., 2022). However, there still exist significant errors in the prediction of TC intensity (Duan et al., 2005; Chen et al., 2021). The intensity of TCs is significantly influenced by their thermal and dynamic structures. Studies have shown that enhanced inflow and outflow activities, vigorous convection, a strong warm core, and abundant sea surface heat flux transport all contribute to the further intensification of TCs (Holland and Merrill, 1984; Kepert, 2010). Additionally, the symmetry of the thermal and dynamic structures also play a crucial role in affecting TC intensity (Chen and Zhang, 2013; Tang et al., 2019). The distribution of atmospheric pressure fields in different layers of a TC usually exhibits central symmetry. However, the wind fields in the inflow and outflow layers, the TC warm core in the mid-levels, and the convective activity near the eyewall often show a certain degree of asymmetry (Li et al., 2014; Niu et al., 2021). The asymmetry in the inflow and outflow layer wind fields can affect the enthalpy flux transfer between the TC and the external environment, thereby influencing the intensity of the TC (Black and Anthes, 1971; Jin et al., 2023). The relationship between the symmetry of the warm core and intensity is more closely related. Tao et al. (2016) conducted a statistical analysis of a large number of TC cases between 1979 and 2010 and found that TCs with a more symmetrical warm core structure tend to be more intense. Moreover, typhoons with highly symmetrical convective rings tend to experience a faster intensification process. Conversely, those with less symmetry exhibit intermittent enhancement processes (Willoughby et al., 1982). In the case of mature typhoons undergoing convective structure changes, such as eyewall replacement, their intensity is more prone to weakening (Willoughby, 1990). Additionally, in the case of Hurricane Frances, the asymmetric enthalpy flux generated by the cold wake can influence the distribution of convection, thereby affecting the intensity of the TC (Lee and Chen, 2012). Therefore, improving the understanding of the thermal and dynamic structures of TCs and clarifying their relationship with TC intensity are essential steps to enhance the forecast capability of TC intensity.
The scarcity of observational data limits the study of the thermal and dynamic structures of TCs. Numerical models can provide high spatiotemporal resolution simulation data, enabling a detailed investigation of the three-dimensional structure of TCs. Numerous studies have demonstrated that increasing model horizontal resolution can yield finer TC simulated structures, thereby improving the simulation of TC intensity (Fierro et al., 2009; Gentry and Lackmann, 2010). However, as a three-dimensional system, TCs also exhibit high vertical complexity. While increasing horizontal resolution, due consideration should be given to the influence of vertical grid resolution (VGR). The setting of VGR in the model should be matched with horizontal resolution to avoid the generation of false gravity waves (Lindzen and Fox-Rabinovitz, 1989), which can lead to model instability and affect simulation results (Persson and Warner, 1991; Powers et al., 2017). There have been some studies that have focused on the impact of changes in vertical resolution on the simulation of typhoon intensity. For example, Zhang et al. (2015) found in an idealized typhoon experiment that increasing VGR can improve the simulation of typhoon intensity, but as the resolution is further increased, the simulation effect becomes worse. Li et al. (2014) discovered that increasing the VGR of the model at different height levels can produce significant changes in the simulated intensity of typhoons. Ma et al. (2012) further pointed out that increasing VGR in the lower levels of the model can result in stronger typhoon simulation intensity. However, these studies have paid less attention to the structure of typhoons, and none of them have explored the impact of changes in resolution on the three-dimensional thermodynamic structure of typhoons. In addition, there are significant differences in the VGR refinement schemes among these studies, and the improvement effects also vary for different typhoon cases.
Therefore, when conducting high-resolution simulations, it is essential to explore how to set the VGR of the model to improve the simulation of TC intensity. Furthermore, understanding how the simulated three-dimensional thermal and dynamic structures of TCs affect TC intensity is also a crucial question. In this study, Super Typhoon Lekima is selected, which occurred in 2019 and made landfall in East China, causing severe disaster impacts along its track (Tan et al., 2020). The clear eyewall structure of Lekima makes it suitable for a detailed study of TC structure. In Section 2 the model experiment and methodology are described. Section 3 analyzes the simulated paths and intensities under different schemes. Section 4 and 5 explore the impact of VGR enhancement in simulated typhoon dynamics and thermal structure, respectively. Finally, Section 6 concludes and discusses the findings.
2 Model experiment and methodology
2.1 Model experiment
The non-hydrostatic mesoscale model Weather Research and Forecasting (ARW) Version 4.0 (WRF) was employed as the numerical model for this study, in accordance with current academic standards. The initial fields are generated using the 0.25° horizontal resolution ERA5 reanalysis data provided by ECMWF, and the detailed experimental setup is shown in Table 1 (Chen et al., 2022). The simulation period is from 00:00:00 on 6 August 2019 to 00:00:00 on 10 August 2019, covering various stages of typhoon development, maintenance, and weakening. To obtain detailed simulated typhoon structures, the model is configured with two horizontal resolutions: one at 6 km and another at 3 km, with a time integration interval of 30 and 10 s, respectively. The model top is set at 50 hPa. The China Meteorological Administration Tropical Cyclone Data Center (CMA) dataset is used as the observational data to verify the performance of the model in simulating Lekima (Ying et al., 2014; Lu et al., 2021).
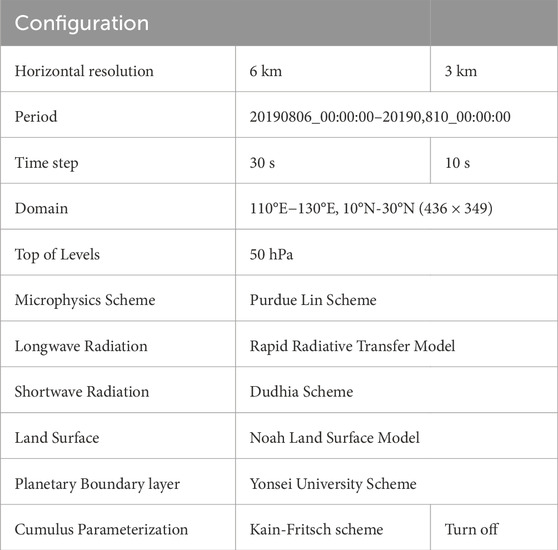
Table 1. Experimental configuration.
The WRF4.0 model employs a hybrid vertical coordinate system, where the low atmosphere uses terrain-following coordinates and the high atmosphere uses isobaric coordinates. The vertical coordinate is given by:
In Eq. (1),
The vertical layer thickness is given by:
In Eq. (2),
This study set up three different vertical layer distribution schemes to investigate the impact of low-, middle-, and high-level atmospheric VGR on typhoon simulation. The vertical distribution of the mean radial wind speed within the 200 km radius of the typhoon center at the time of maximum wind speed is analyzed in the control experiment (Figure 1A). Based on the inflow and outflow vertical distribution, η ranges of 0.8–1, 0.3–0.8, and 0–0.3 are defined as the low, middle, and high layers, respectively. Keeping the remaining layers unchanged, 10 additional layers are added to the low, middle, and high layers based on C40_6 (C40_3), and name them as L50_6 (L50_3), M50_6 (M50_3) and H50_6 (H50_3), respectively. The numerical values behind the underline represent the horizontal resolution of 6 km or 3 km used in the experiment.
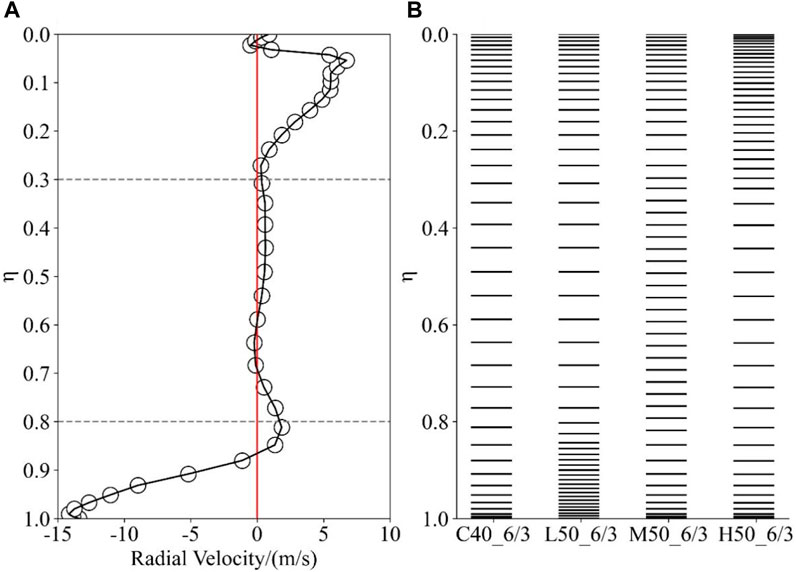
Figure 1. Profile of (A) mean radial wind within 200 km radius at time of typhoon maximum Intensity (12:00 on the 8th), and (B) vertical layer distribution as set in each experiment.
2.2 Case selection: Typhoon Lekima (2019)
Typhoon Lekima (1909) formed on 29 July 2019 (UTC) over the western Pacific east of the Philippines. It is upgraded to a tropical storm on August 4, and further strengthened to a severe tropical storm on August 5. Lekima continued to intensify and is upgraded to a typhoon on August 6, then to a super typhoon later that same day, with maximum sustained wind speed reaching 62 m/s and a minimum sea surface level pressure of 915 hPa. It made landfall in Chengnan Town, Wenling City, Zhejiang Province, China, at around 01:45 on August 10, with the maximum near-center wind force reaching 16 on the Beaufort Scale (52 m/s) and a minimum sea surface level pressure of 930 hPa.
2.3 Eye wall location and slope
In order to quantitatively describe the characteristics of the typhoon eyewall, this study defines two parameters: Eyewall Position (EWP) and Eyewall Slope (EWS). Based on the high reflectivity feature of the typhoon eyewall (Hence and Houze, 2011), within the 200 km radius of the typhoon core, the position with the azimuthally averaged maximum reflectivity at each height level is identified as the Eyewall Position (EWP). The Eyewall Slope (EWS) is defined as the slope of the line connecting the eyewall positions at the lowest and highest altitude levels. The larger the EWS, indicating a less inclined eyewall.
2.4 Static stability
Following Kepert (2010), static stability (
In Eq. (3), g is gravitational acceleration,
2.5 Warm core area and height
The warm core intensity of typhoons is quantitatively described using temperature anomalies (TA), warm core area index (WCAI), and warm core height (WCH) (Fu et al., 2011). The TA is obtained by subtracting the average temperature on the corresponding isobaric surface from the temperature at each point. The average temperature on the isobaric surface is obtained by averaging the temperatures within a 1000-km radius of the typhoon on the isobaric surface. The WCAI is defined as the number of grid points in the azimuthally-averaged vertical TA profile with values greater than a specific threshold, which in this study is 12 K. The WCH refers to the height at which the maximum TA, after azimuthal averaging, is located. The azimuthal averaging method involves considering the tropical cyclone center as the origin and drawing equidistant concentric circles outward. Within each circle, the average of the physical quantity is computed, representing the azimuthal mean value at the inner radius of that circle.
2.6 Precipitation asymmetry
To quantify the asymmetry of typhoon precipitation, this paper employs Fourier expansion along the azimuthal direction for the precipitation field. It uses the first harmonic asymmetry within the 200 km radius of the typhoon core to characterize its asymmetry degree, where a larger numerical value indicates a more uneven distribution of precipitation. The specific procedure involves establishing a polar coordinate system with the typhoon center as the origin. The azimuthal angle (θ) is spaced at 1° intervals, and the radial direction (r) is spaced at 6 km or 3 km intervals. The model data is interpolated to a 1° × 6 (3) km grid using a nearest-neighbor interpolation method. Subsequently, the precipitation field R (r, θ) is subjected to a Fourier series expansion (Boyd, 2001):
In Eq. (4),
The asymmetry of the typhoon core precipitation field is represented by the ratio of the amplitude components between the first harmonic and the zeroth harmonic (Eq. 7):
2.7 Drag coefficient and water vapor exchange coefficient
The drag coefficient (
In Eq. (8),
In Eq. (9),
3 Track and intensity
Concerning the simulation of the Lekima track, Figure 2C, F present the time series of simulated tracks and track deviations for each experiment. Among the three VGR enhancement schemes, simulations featuring enhanced VGR in the upper layers demonstrate superior track simulation performance. Specifically, H50_6 and H50_3 show smaller average deviations in track simulation compared to their control experiments, a result validated during both the typhoon intensification and weakening stages (Table 2). Improving VGR in the lower layers also contributes to the enhancement of track simulation, albeit to a lesser extent than observed in the experiments with enhanced VGR in the upper layers. Middle layers VGR enhancement does not yield a significant improvement in track simulation. Increasing the horizontal resolution to 3 km does not improve the simulation of the Lekima track; instead, track simulation deviations increase in all four experiments.
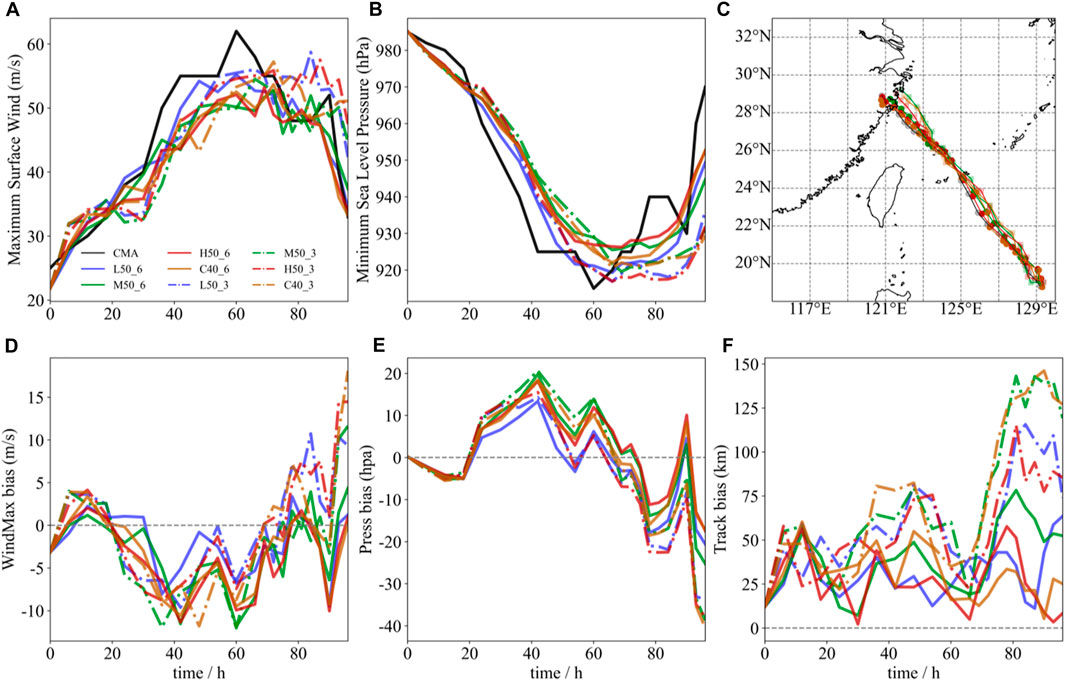
Figure 2. Temporal variation of (A) the maximum surface wind speed at 10 m (m/s), (B) the minimum sea level pressure (hPa) and (C) track for each experiment and the CMA best-track data (OBS). (D–F) represent maximum surface wind speed bias, minimum sea level pressure bias and track bias, respectively.
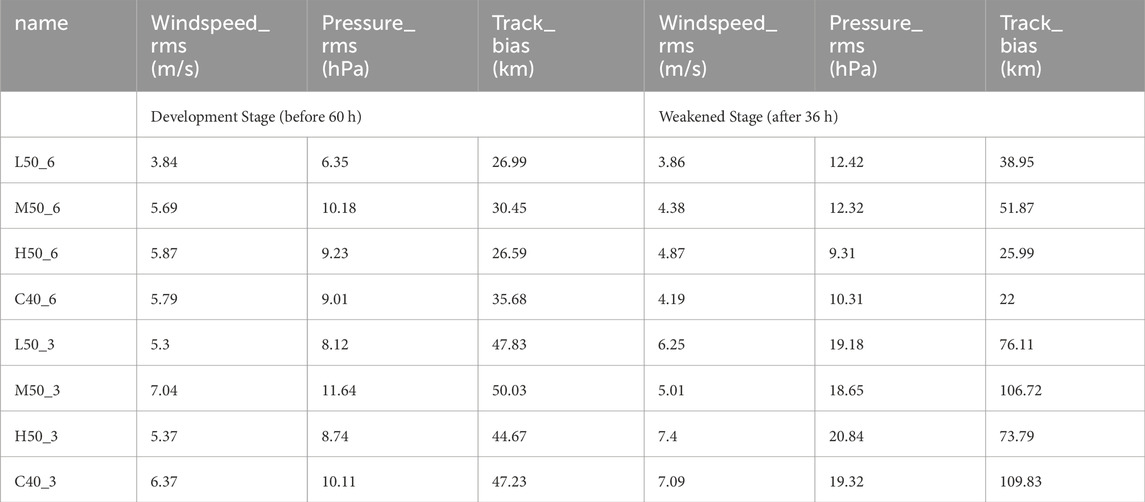
Table 2. Root mean square error (RMSE) of maximum surface wind (Windspeed_rmse), minimum sea level pressure (Pressure_rmse), and track (Track_rmse).
For intensity, this study uses Maximum Surface Wind Speed (MSWS) and Minimum Sea Level Pressure (MSLP) as standards for measuring typhoon intensity. Figure 2A, B provide the time series of MSWS and MSLP for each experimental simulation. Figure 2D, F present the time series of deviations in MSWS and MSLP, respectively. Enhancing VGR in the lower layers improves the simulation of intensity, and this improvement remains unaffected by changes in horizontal resolution. It is particularly noticeable during the typhoon intensification stage, with L50_6 and L50_3 having smaller MSWS RMSE and MSLP RMSE compared to their control experiments (Table 2). Middle layers VGR enhancement has a negative effect on the simulation of typhoon intensity under both horizontal resolutions. Specifically, M50_6 and M50_3 do not increase Lekima’s maximum intensity. Although M50_3 slightly reduces MSWS RMSE and MSLP RMSE during the weakening stage, overall, enhancing VGR in the middle layer increases MSWS RMSE and MSLP RMSE during the simulation period. Enhancing VGR in the high layers, at a horizontal resolution of 6 km, does not improve the forecast accuracy of typhoon intensity. Specifically, H50_6 shows a general increase in MSWS RMSE and MSLP RMSE during the simulation period. When the horizontal resolution is increased to 3 km, H50_3’s intensity forecast accuracy improves, particularly during the intensification stage (Table 2).
In summary, experiments with improvement in VGR in the lower layer demonstrate superior performance in simulating typhoon intensity. VGR enhancement in the middle layers leads to a reduction in typhoon intensity, accompanied by a decline in both intensity and track simulation. VGR improvement in the upper layer results in optimal track simulation but is influenced by horizontal resolution in terms of intensity. At a 6 km resolution, H50_6 does not exhibit significant improvement. However, upon increasing the horizontal resolution to 3 km, H50_3’s intensity simulation performance shows a notable enhancement.
4 Dynamic structure
The intensity of a typhoon is closely related to its three-dimensional structure. Section 4 will focus on the impact of different VGR schemes on the simulated dynamic structure of Lekima. This includes radial and tangential winds, vertical velocity, eye-wall slope, convective asymmetry, and static stability as key dynamic parameters. As the typhoon reaches its maximum intensity, its structure becomes clearer. Therefore, this study analyzes the period when Lekima reached its maximum intensity (12:00 on 8 August 2019).
4.1 Radial wind and tangential wind
The vertical distribution of azimuthally averaged radial and tangential winds (the extraction of radial and tangential winds is referenced from Braun et al. (2006)) for each experiment is depicted in Figure 3. In all experiments, the vertical distribution of radial winds exhibits low-level inflow and upper-level outflow. The inflow region is in the low levels outside the eyewall, with a height not exceeding 850 hPa. In the mid-levels, the airflow is primarily tangential, with a minimal radial wind component. The air within the eye region is relatively stable, with only a small amount of air inflow in the low levels. When horizontal resolution is 6 km, the typhoon core wind fields in L50_6 and C40_6 exhibit a similar vertical distribution, following the basic pattern of low-level inflow and upper-level outflow. In M50_6 and H50_6, the inflow and outflow activities are more dispersed in the vertical direction, and abnormal radial winds in the mid-levels weaken the tangential winds. Both show strong outflow activity in the mid-levels (600–300 hPa). When the horizontal resolution is increased to 3 km, L50_3 exhibits minimal changes compared to L50_6. However, for M50_3 and H50_3, the outflow activity in the mid-levels significantly weakens, and the outflow activity becomes more concentrated in the main outflow layer above 200 hPa.
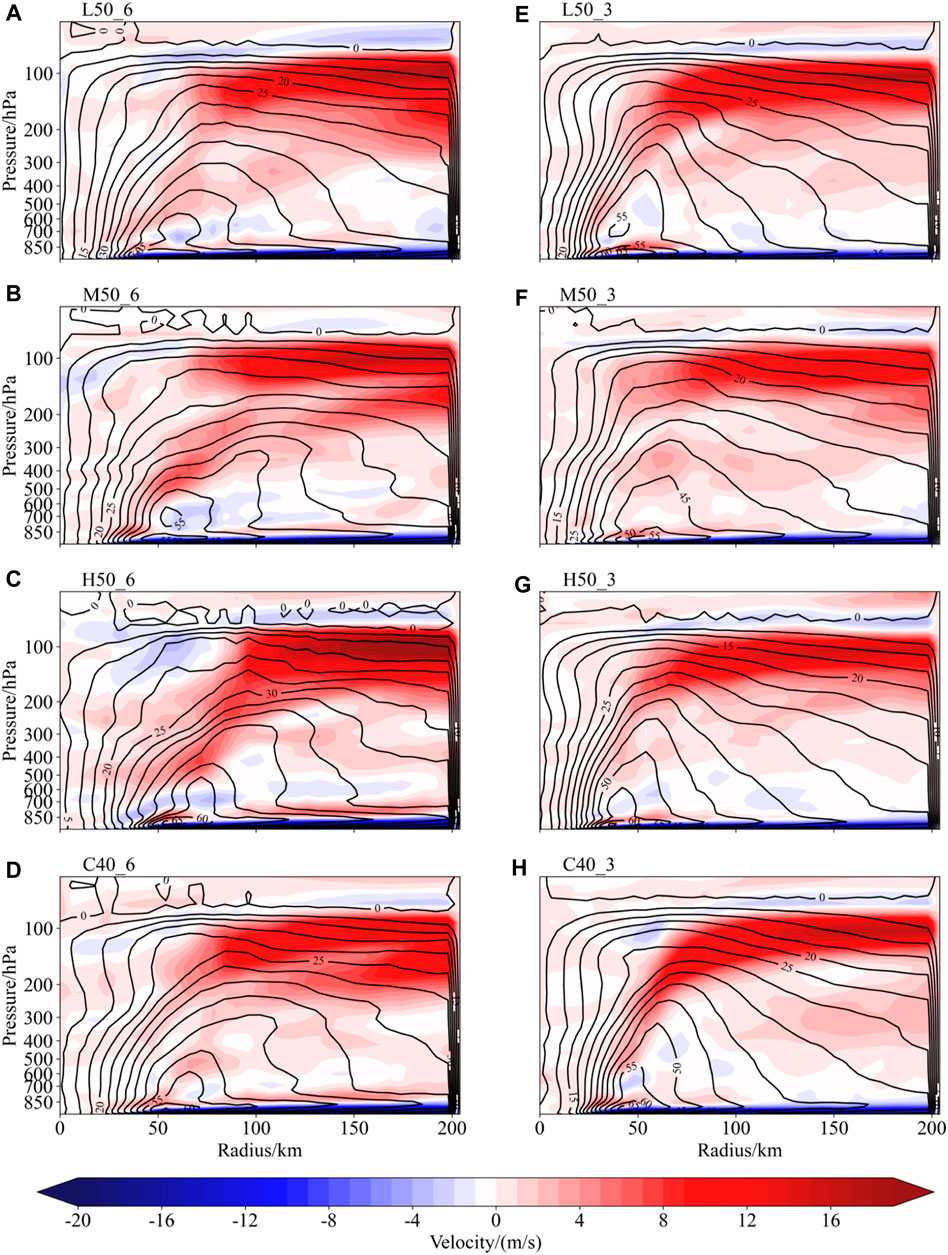
Figure 3. Height-radius cross-sections of azimuthal mean radial wind (shaded color, Positive value for inflow, negative value for outflow) and tangential wind (contour line) at 12:00 on August 8, 2019 for each experiment. [(A–H) represent individual experiments, respectively. See Figure 1B for specific meanings].
The horizontal distribution of azimuthally averaged radial winds in the lower layer (below 900 hPa) and upper layer (200–100 hPa) for each experiment is illustrated in Figure 4. When horizontal resolution is 6 km, the distribution of inflow and outflow areas in the lower layer is generally consistent among experiments. The outflow area is concentrated in the left-front quadrant in the direction of typhoon movement, with other vast regions predominantly occupied by inflow. However, there are variations in the intensity of inflow and outflow among experiments. In L50_6, the inflow in the lower layer is the strongest, with an expanded inflow range, resulting in a more robust and uniform convergence. The outflow activity in the upper layer also intensifies, and the outflow area in the direction of movement is expanding. In M50_6, the inflow in the lower layer weakens, forming a band-like distribution of high inflow values. Due to the decrease in inflow, the outflow also weakens. The inflow in H50_6 is closest to that in C40_6, but the outflow in the upper layer intensifies on the right side of the Lekima’s moving direction. When the horizontal resolution is increased to 3 km, significant changes occur in the intensity and distribution of inflow and outflow in the lower layer for each experiment. The inflow activity on the left-rear side of the typhoon’s moving direction significantly strengthens, while the inflow on the right side noticeably weakens, leading to a large outflow area in the right-rear quadrant. Except for C40_3, other VGR enhanced experiments at a 3 km horizontal resolution show a significant weakening of outflow activity in the left-front quadrant. All VGR enhanced experiments enhance the symmetry of typhoon low-level inflow.
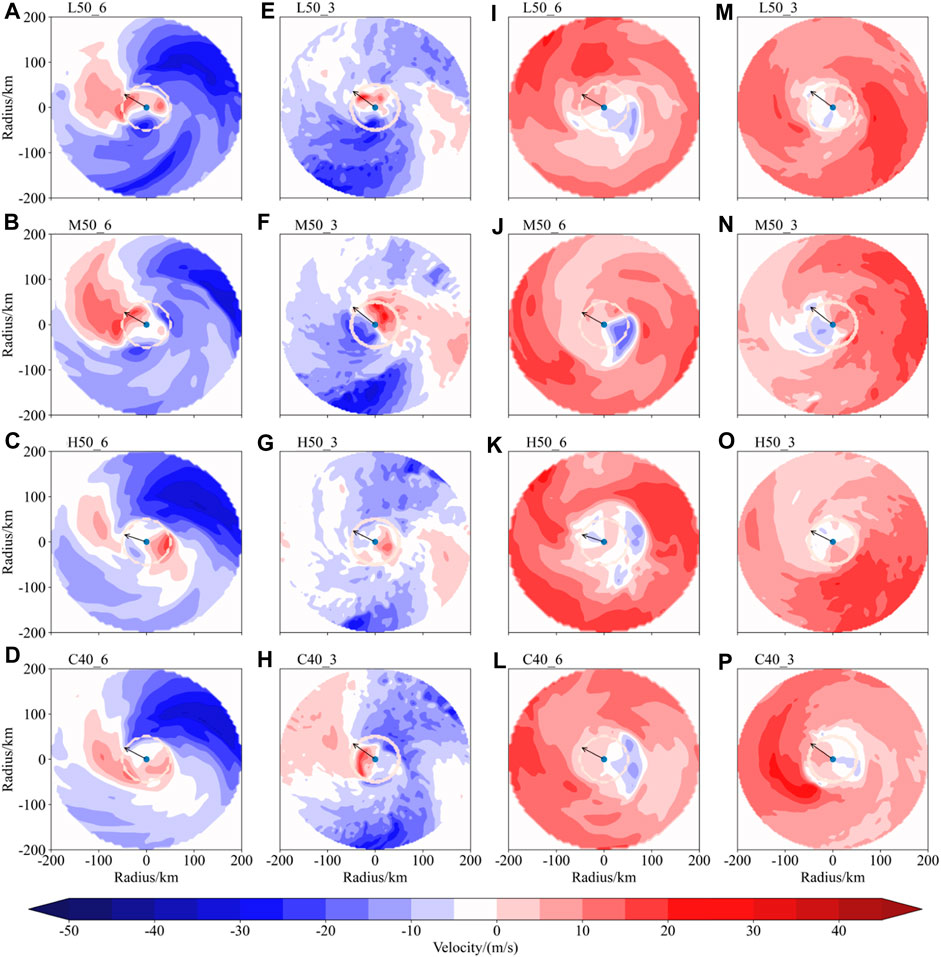
Figure 4. Distribution of azimuthal mean radial wind at lower levels (below 900 hpa) (A–H) and upper levels (200–100 hpa) (I–P) at 12:00 on August 8, 2019 for each experiment (black arrow represents the direction of typhoon movement, and dotted circle’s radius is 50 km).
4.2 Vertical velocity and reflectivity
The eyewall is the primary area of updraft in a typhoon, accounting for approximately 60% of the total upward transport. This is mainly accomplished by updrafts with speeds exceeding 1 m/s at the eyewall, and the upward motion at the eyewall exhibits significant asymmetry (Jorgensen et al., 1985; Black et al., 1996; Corbosiero and Molinari, 2003). Additionally, since the atmosphere above the boundary layer in a typhoon is in near-gradient balance, the eyewall typically tilts outward with height increases. This tilt significantly affects the efficiency of convective latent heat release, thereby influencing typhoon intensity (Kepert, 2010). In this section, we will analyze the vertical motion and reflectivity structure in the eyewall region, exploring the impact of lower, middle, and upper layers VGR on the convective asymmetry and eyewall features of the typhoon.
In the profiles of vertical velocity and reflectivity for each experiments (Figure 5), when horizontal resolution is 6 km, L50_6 exhibits a larger reflectivity center near the eyewall, a larger EWS, and a smaller EWP, indicating a straighter eyewall and a more compact typhoon eye. The high reflectivity region (dBz ≥ 10) at the top of the eyewall in M50_6 is lower, only reaching around 300 hPa, while the corresponding period in C40_6 can reach above 200 hPa. The EWS of M50_6 is the smallest at 0.21, indicating a greater tilt of its eyewall and a disorganized eyewall structure with more dispersed convective activity. H50_6 has the maximum vertical velocity near the eyewall, with dense contour lines, and the core of maximum vertical velocity is near 300 hPa. Additionally, the reflectivity center value at the eyewall in H50_6 is the smallest among the four experiments. Its EWP is the largest among the four experiments, indicating that its eyewall is farther from the center of the typhoon, and the energy released from convective latent heat may not effectively heat the warm core. When the horizontal resolution is increased from 6 km to 3 km, the eyewalls of all experiments are enhanced, with increased reflectivity and EWS. Among the four experiments at a horizontal resolution of 3 km, L50_3 and H50_3 have larger EWS, while M50_3 has a smaller EWS.
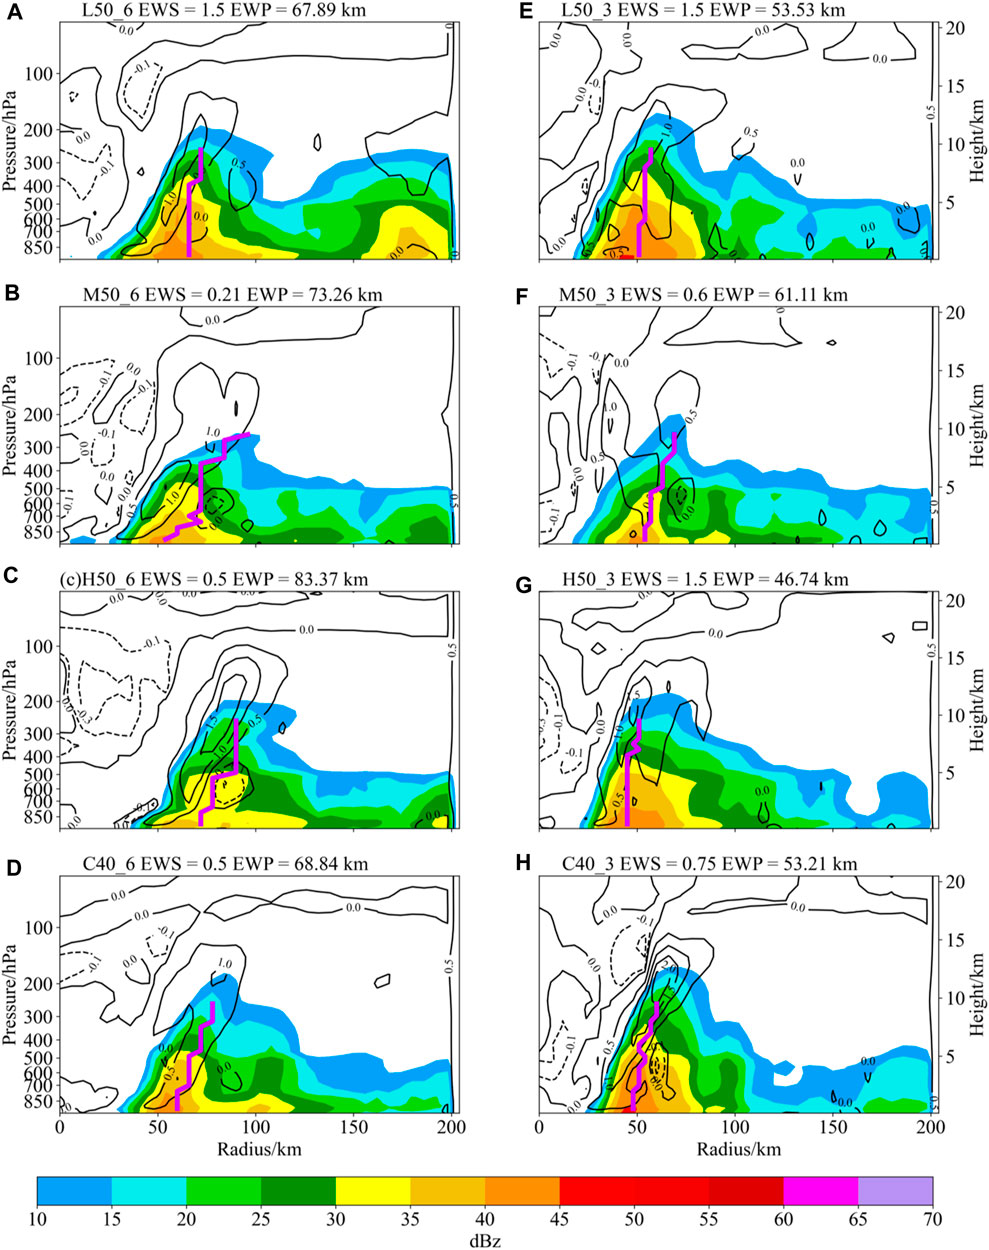
Figure 5. Height-radius cross-sections of azimuthal mean vertical velocity (contour line) and reflectivity (shaded color) at 12:00 on August 8, 2019 for each experiments (purple thick line represents the eyewall profile, [(A–H) represent individual experiments, respectively. See Figure 1B for specific meanings].
The profiles of extreme ascent and descent velocity for each experiments are shown in Figure 6. Extreme vertical velocities in the eyewall region play a crucial role in influencing typhoon intensity. Updrafts exceeding 10 m/s are particularly important as they facilitate the transfer of substantial momentum and moisture (Rotunno et al., 2009; Zheng et al., 2020; Jin et al., 2023). At a 6 km horizontal resolution, the vertical velocity distribution of L50_6 is similar to C40_6, with a relatively small vertical gradient of vertical velocity. M50_6 has a small variation in low-level vertical velocity but exhibits larger extreme ascent velocities in the mid to upper levels. H50_6 shows larger extreme ascent velocities near 200 hPa. When the horizontal resolution is 3 km, C40_3 has larger extreme ascent velocities in the upper and middle-lower levels, with the maximum intensity at 200–100 hPa. In L50_3 and M50_3 experiments, the distribution of extreme ascent velocities is similar to C40_3, but the overall intensity is lower than C40_3. In the high-resolution H50_3 experiment, there is a significant change in the distribution of extreme ascent velocities. Extreme ascent velocities in the mid to lower levels are notably enhanced, with extreme ascent velocities near 500 hPa significantly higher than the other three experiments. This can promote convection to reach greater heights, thereby enhancing typhoon intensity.
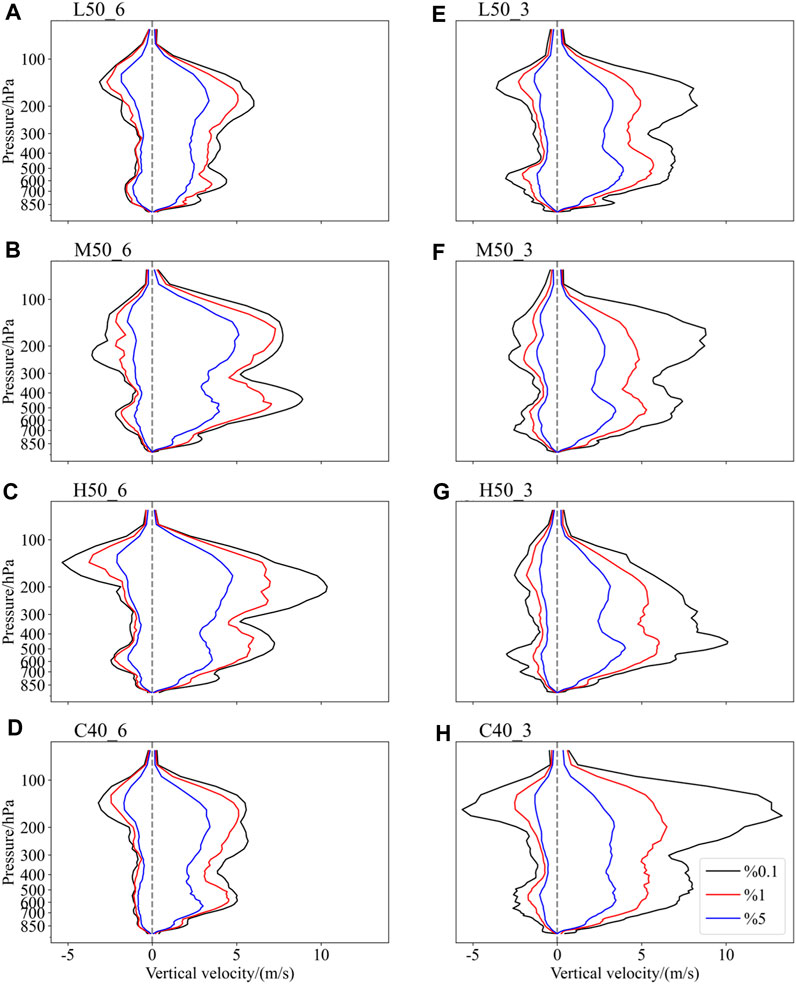
Figure 6. Vertical distribution of the threshold of the extreme updraft and downdraft within a 100 km radius at 12:00 on August 8, 2019 for each experiment [blue for the top 5%, red for the top 1%, and black for the top 0.1%, and (A–H) represent individual experiments, respectively. See Figure 1 for specific meanings].
4.3 Convective asymmetry and static stability
The intensity of precipitation in the typhoon core can characterize the strength of convection, while lower precipitation asymmetry represents a more symmetric and stable structure of the typhoon, which is conducive to the rapid intensification of the typhoon (Chen and Zhang, 2013; Chen et al., 2022). Figure 7A shows the time series of the asymmetry of core precipitation in each experiment. During the typhoon intensification period, when the horizontal resolution is 6 km, the experiments are sorted in descending order of precipitation asymmetry as follows: M50_6, H50_6, L50_6, and C40_6. When the horizontal resolution is increased to 3 km, the experiments are similarly sorted in descending order of core precipitation asymmetry: M50_3, H50_3, L50_3, and C50_3. The asymmetry of convection in the 3 km group is significantly stronger than in the 6 km group, which may also be the main reason for the significant increase in extreme ascending and descending speeds in the typhoon core region in the 3 km compared to the 6 km experimental group in Figure 6.
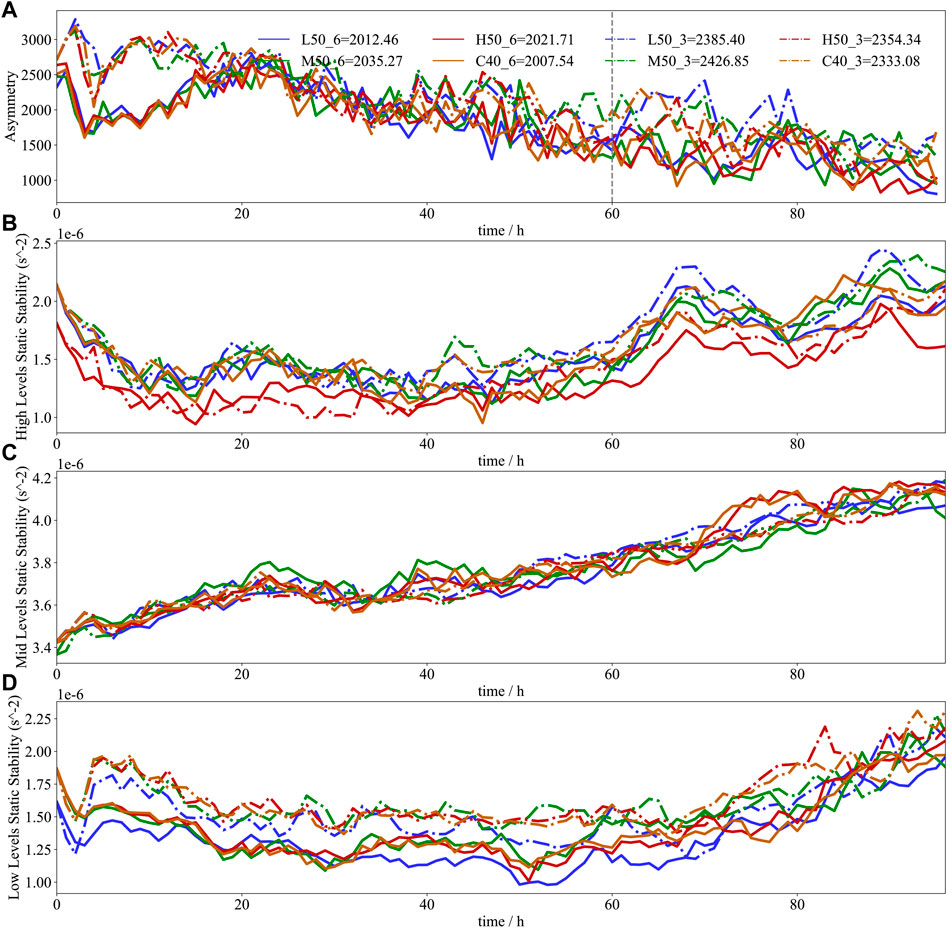
Figure 7. (A) Typhoon core precipitation asymmetry (labeled numbers represent the average asymmetry during the first 60 h). Average static stability within the core of the typhoon (within a radius of 200 km), including (B) upper levels (between 100 hPa and 250 hPa), (C) middle levels (between 500 hPa and 700 hPa) and (D) lower levels (below 900 hPa).
Furthermore, static stability (
Figure 7B, C, D present the
Figure 7C illustrates the changes in
As shown in Figure 7B, the stability is lowest for H50_6 and H50_3. Enhancing VGR at the upper levels can decrease the hydrostatic stability in the upper atmosphere. Additionally, Figure 7A indicates that increasing VGR at the upper levels can also enhance the convective asymmetry of typhoons. However, the effect of upper layer VGR enhancement on typhoon intensity simulations differs under different horizontal resolutions. When horizontal resolution is 6 km, increasing upper layer VGR leads to a decrease in the slope of the typhoon eyewall and a weakening of the simulated intensity. Under these conditions, increasing the VGR at the upper layer does not effectively strengthen the simulated intensity of Lekima, which is consistent with previous research findings (Ma et al., 2012; Zhang et al., 2015). However, when the horizontal resolution is increased to 3 km, enhancing the VGR at the upper layer significantly strengthens the simulated intensity. The differences in hydrostatic stability and asymmetry between the two sets of experiments are relatively small, and it is difficult to explain the source of the intensity simulation differences solely from this perspective. This may also be related to thermodynamic structures such as the warm core of the typhoon, which will be discussed in the next section.
5 Thermal structure
Typhoons are cyclonic vortex formed by latent heat release heating and sinking heating in the eye region, resulting in a warm-core structure. The structural characteristics, height, and intensity of the warm core significantly affect typhoon intensity (Fei, 1997; Komaromi and Doyle, 2017). In this section, two indices, the Warm Core Area Index (WCAI) and the Warm Core Height (WCH), will be used to quantitatively analyze the stimulated thermodynamic structural characteristics of Likema and explore the impact of VGR on typhoon thermodynamic structure. The definitions and calculation methods of these two indices have been detailed in Section 2.
5.1 Warm core
Figure 8 presents the azimuthally averaged radial height profiles of temperature anomalies, revealing the intensity and distribution characteristics of the warm core in each experiment. In Figure 8, a larger warm core center TA and WCAI (TA ≥ 12k) indicate a stronger warm core, and lower layer VGR enhancement can significantly enhance the intensity of the warm core. Conversely, middle layer encryption weakens the intensity of the warm core. Among experiments with the same horizontal resolution, the warm core intensity is strongest in the lower layer VGR enhancement experiments. The strength of the warm core after upper layer VGR enhancement is affected by the horizontal resolution. The warm core intensity of H50_6 is weaker than that of C40_6, and the warm core center is deviated from the low-pressure center, increasing the asymmetry of the warm core to some extent. However, when the horizontal resolution is increased to 3 km, the warm core intensity of H50_3 becomes stronger. Additionally, after increasing the horizontal resolution, the warm core intensity of each experiment decreased to varying degrees, with the most significant decrease observed in C40_3.
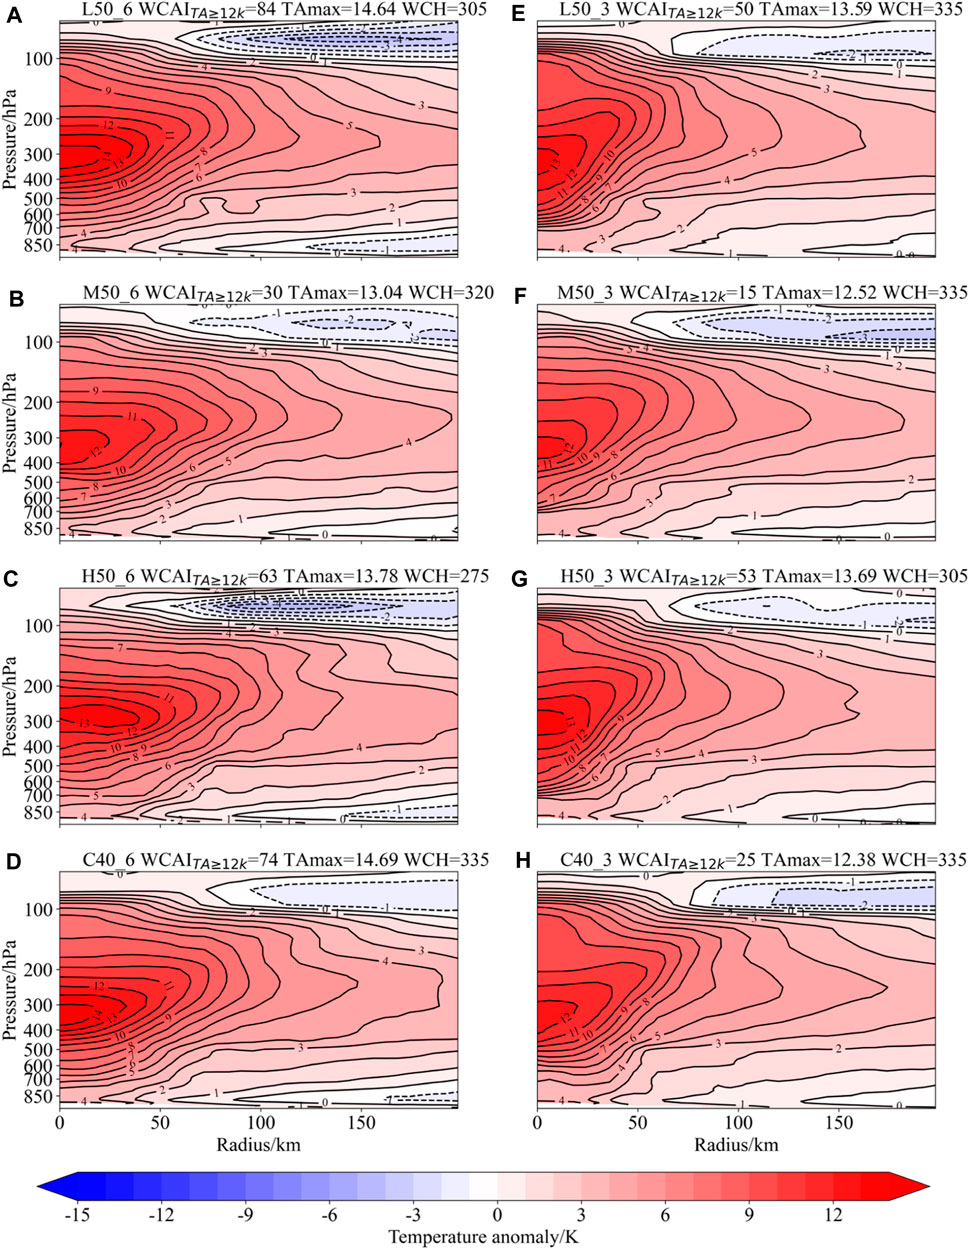
Figure 8. Height-radius cross-sections of azimuthal mean TA on August 8, 2019 for each experiments [(A–H) represent individual experiments, respectively. See Figure 1B for specific meanings].
Concerning warm core height, both lower and middle layer VGR enhancement at 6 km resolution can increase WCH. However, at 3 km horizontal resolution, the changes in WCH are not as pronounced. Upper layer VGR enhancement at both 3 km and 6 km resolutions increases WCH, with H50_6 showing the most significant change, reaching a WCH of 275 hPa. In terms of horizontal resolution, the WCH of the 3 km experiment group is generally higher than that of the 6 km experiment group. Therefore, increasing horizontal resolution tends to decrease warm core height.
Figure 9 divides the warm core along the direction of typhoon movement into four quadrants (Right Front (RF), Left Front (LF), Left Rear (LR), and Right Rear (RR)). It shows the warm core area ratio (a) and warm core height (b) based on quadrant statistics. When horizontal resolution is 6 km, L50_6 exhibits the lowest warm core asymmetry, with minimal differences in warm core area among quadrants. The warm core heights (WCH) in each quadrant are generally around 305 hPa, indicating consistent warm core heights. M50_6 has a warm core concentrated in the RF and LR quadrants, accounting for 65% of the total warm core area. Additionally, the warm core height on the right side is greater than the left side, showing a pronounced asymmetry in warm core distribution. H50_6’s warm core is predominantly concentrated in the RF quadrant, with only 8.2% in the LR quadrant. It exhibits a clear asymmetry, with the WCH on the left side greater than the right side, and the warm core center deviates from the low-pressure center. When the horizontal resolution is increased to 3 km, L50_3 maintains the best symmetry in its warm core, with minimal differences in warm core area and height among quadrants. M50_3 continues to exhibit the strongest warm core asymmetry among the three VGR enhancement experiments. In contrast, H50_3 shows significant changes. At a 3 km horizontal resolution, warm core symmetry is significantly improved.
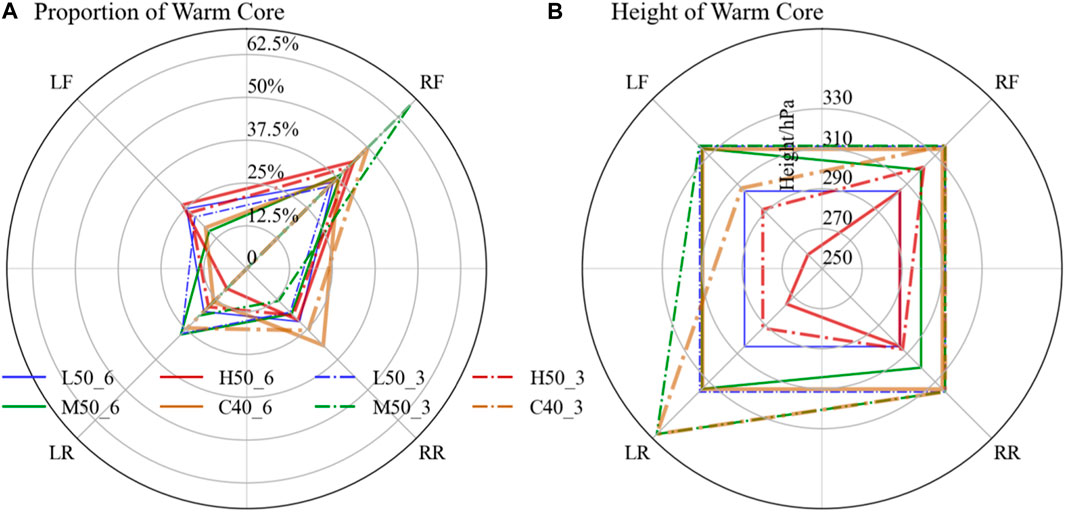
Figure 9. (A) Proportion of warm core area (TA greater than 12 K) and (B) height in Each Quadrant on 8 August 2019 at 12:00.
5.2 Surface flux
The ocean is the primary underlying surface for the generation and development of typhoons, providing the necessary water vapor and energy for their intensification. A larger ratio of the enthalpy flux exchange coefficient (
Figure 10A, B present the time series of the average drag coefficient (
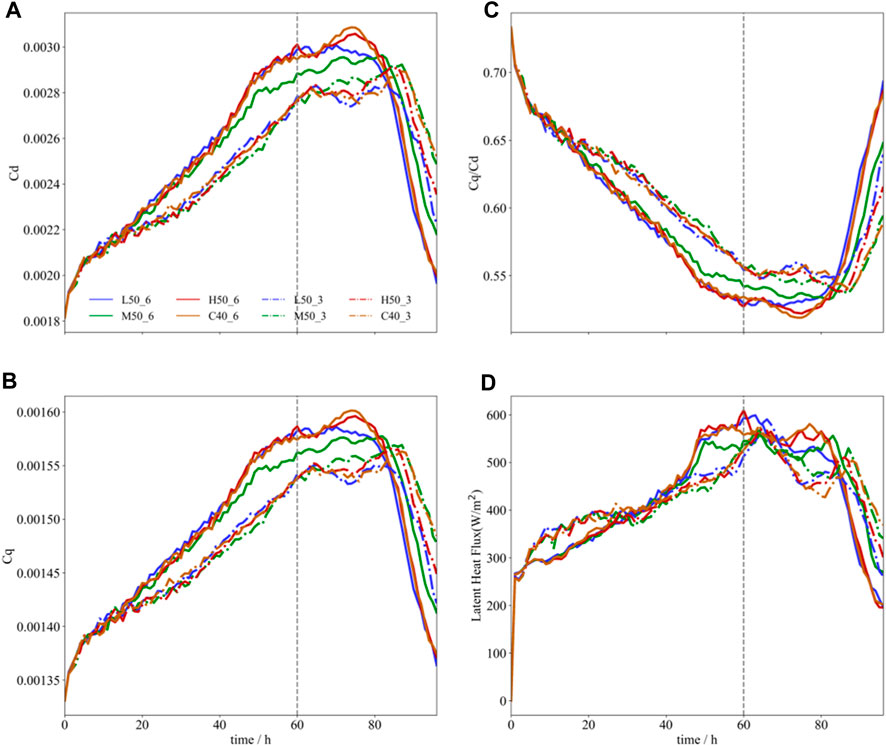
Figure 10. Temporal variation of (A) drag coefficient (
Regarding latent heat flux (Figure 10D), at a 6 km horizontal resolution, the differences among most experiments are minimal during various periods. However, around the 60th hour (the peak intensity of the typhoon), M50_6 shows slightly lower values compared to other experiments. When the horizontal resolution is increased to 3 km, the differences among all experiments become less apparent. Increasing horizontal resolution is effective in enhancing latent heat flux in the early stages of the simulation (approximately before the 30th hour). However, in the middle and later stages, the 3 km group generally exhibits lower latent heat flux than the 6 km group.
Figure 11 further illustrates the distribution of latent heat flux in the core region of the typhoon at the moment of maximum intensity. The regions with high latent heat flux values (greater than 600 W/m2) in each experiments show a good correspondence with the inflow region in Figure 4. At a 6 km horizontal resolution, all experiments exhibit high-value regions near the eyewall of the typhoon. Additionally, in the control experiment C40_6, the high-value regions are mainly concentrated in the front and right front of the typhoon movement. With increased VGR, high-value regions also appear in the left rear, reflecting a higher level of symmetry in the distribution of latent heat flux. Specifically, in L50_6 and H50_6, the latent heat flux significantly strengthens, both in terms of the range and intensity of the high-value regions. In the M50_6 experiment, the high-value regions in the front and left front narrowed, and the overall intensity of the latent heat flux decreases. When the horizontal resolution is increased to 3 km, the high-value region in the front of the typhoon significantly weakens or disappears. Apart from the eyewall, the high-value regions are mainly concentrated in the left rear, increasing the asymmetry in the distribution of latent heat. Moreover, in the 3 km experimental group, the differences in latent heat flux among the three VGR enhancement schemes (lower, meddle, and upper layer) are not significant. Therefore, at a 3 km horizontal resolution, the distribution of latent heat flux is not highly sensitive to the VGR settings in the model.
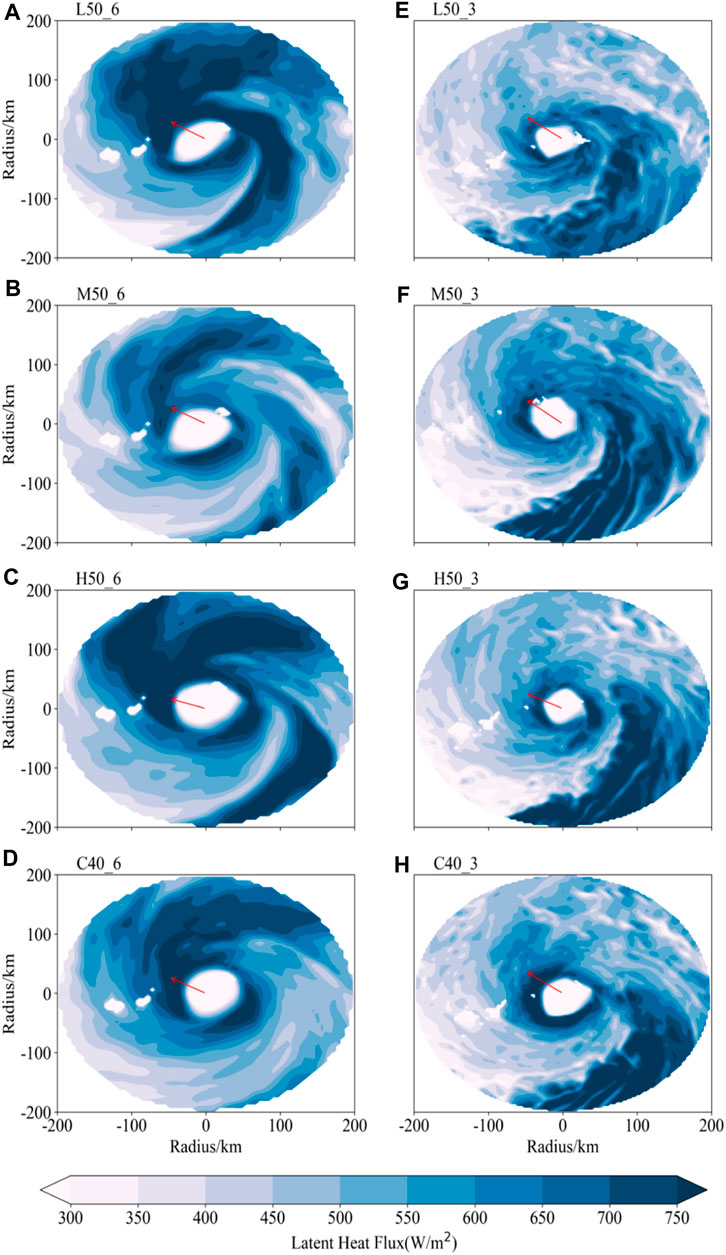
Figure 11. Horizontal distribution of latent heat flux for each experiment at 12:00 on 8 August 2019 [red arrow represents the direction of typhoon movement, and (A–H) represent individual experiments, respectively. See Figure 1B for specific meanings].
The above analysis indicates that latent heat flux is sensitive to the setting of VGR. Increasing VGR at both the lower and upper layer can enhance the latent heat transport and make its distribution more symmetric in simulated typhoons, while increasing VGR at the middle layer has the opposite effect. The boundary layer processes that affect latent heat flux, such as inflow, outflow, and convective triggering, are highly sensitive to the setting of VGR (Zhang and Wang, 2003). The increased drag coefficient resulting from the refinement at the lower and upper layer enhances bottom friction, which may contribute to the increased latent heat flux and more symmetric distribution (Ma et al., 2012). On the other hand, increasing VGR at the middle layer suppresses convective activity, leading to a reduction in latent heat transport.
5.3 Pseudo-equivalent potential temperature
The descent and warming of high-entropy air in the upper levels have a significant impact on enhancing and sustaining the warm core of a typhoon (Willoughby, 1998), The pseudo-equivalent potential temperature (
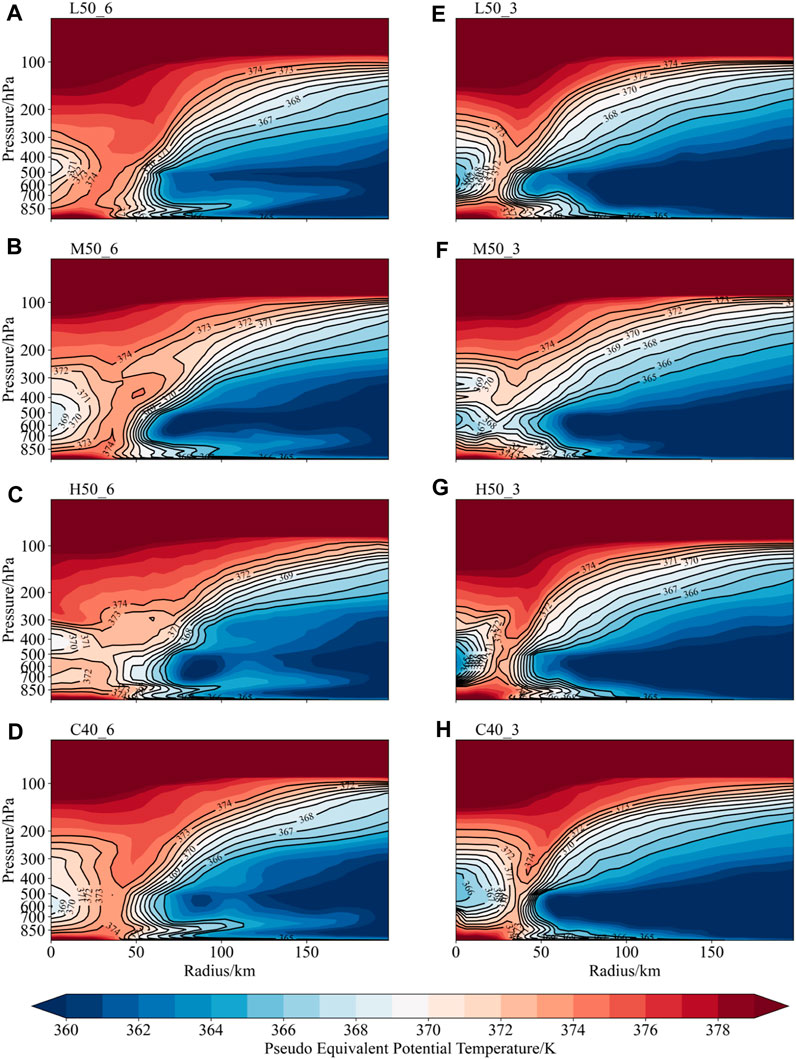
Figure 12. Height-radius cross-sections of azimuthally-averaged pseudo-equivalent potential temperature for each experiment at 12:00 on 8 August 2019 [(A–H) represent individual experiments, respectively. See Figure 1B for specific meanings].
In previous studies on the thermal and dynamic structure of typhoons, researchers have noted that in the eye region of a typhoon, the lower levels are characterized by moist air, the middle levels exhibit an inversion layer, and the upper levels contain dry and warm high-entropy air (Gierens et al., 1999; Braun, 2002; Xu and Wang, 2010; Durden, 2013). Within the eye region of a typhoon, there is intense subsidence, and this descending high-entropy air heats the warm core of the typhoon, leading to a decrease in central atmospheric pressure (Willoughby, 1998). Figure 12 illustrates that the simulated thermal and dynamic structure of the typhoon cores in all experiments is consistent with previous research. High-entropy air with
In the vicinity of the eyewall in L50_6, the 374 K
The sensitivity of the warm core intensity to VGR settings is higher. Increasing lower layer VGR enhances the warm core intensity and reduces asymmetry, while middle layer VGR enhancement has the opposite effect. The effect of enhancing upper layer VGR on warm core intensity depends on the horizontal resolution. At a horizontal resolution of 6km, upper layer VGR enhancement leads to a decrease in warm core intensity. However, as the horizontal resolution increases, the warm core intensity also increases. The enhancement of the warm core by lower and upper layer VGR seems to be aided by a lower asymmetry in latent heat flux distribution and the heating effect of sinking air at higher levels. After middle layer VGR enhancement, the decreased latent heat flux and internal circulation that hinders sinking air at higher levels limit the development of the warm core.
This study explores the impact of VGR settings at different heights on typhoon simulations from the perspective of thermodynamic structure. Compared to previous studies (Ma et al., 2012; Zhang et al., 2015), the finest 3 km experimental group obtained a more detailed and reliable typhoon structure. Furthermore, this study complements previous research on the impact of upper layer VGR enhancement on typhoon simulations. In fact, when the horizontal resolution is sufficiently high, increasing the same number of vertical layers at either the lower or upper levels has a similar enhancing effect on typhoon simulation intensity.
6 Conclusion
This study utilizes the WRF numerical model at horizontal resolutions of 6 km and 3 km to compare the differences in the simulated three-dimensional thermal and dynamic structures of typhoons resulting from three VGR enhancement schemes at low, middle, and upper layer. The relationship between structural changes and typhoon intensity is explored, yielding the following main conclusions:
Track and Intensity Simulation: The experimental results obtained from different enhancement schemes show little difference, indicating that the track simulation of Lekima is not sensitive to the vertical resolution settings. For intensity simulation, the control experiment exhibits an overall weaker simulation of typhoon intensity during its developmental phase. Increasing the VGR at lower layer enhances simulated typhoon intensity, resulting in improved performance. However, intensity decreases when enhancing resolution at middle layer, increasing simulation biases. Upper layer enhancement results are significantly influenced by horizontal resolution; at 6 km, there’s insignificant improvement in simulated typhoon intensity, while at 3 km, the intensity simulation is effectively improved.
Dynamic Structure Simulation: Changes in VGR significantly affect the wind fields and stability in the inflow and outflow layers, and eyewall morphology. Specifically, increasing the vertical resolution of the lower layer would decrease the static stability of the lower layer and enhance the activities of typhoon inflow layer, which would promote the convection activities of typhoon. The asymmetry of convection would decrease accordingly, and the simulated typhoon intensity would be stronger, and the slope of typhoon eye wall would be greater. Enhancing resolution at middle layer increases outflow, strengthens asymmetry in convective activity, reduces simulated typhoon intensity, and results in a looser and less steep eyewall. Higher VGR at upper layer reduces stability, enhances outflow layer vertical motion, but increases asymmetry in convective activity, resulting in a decrease in simulated typhoon intensity. However, coupled with increased horizontal resolution, the simulated intensity is strengthened, with a steeper typhoon eyewall.
Thermal Structure Simulation: Changes in VGR affect low-level surface fluxes and upper-level high-entropy air, influencing the simulated structure and intensity of the typhoon’s warm core, and subsequently affecting the simulated typhoon intensity. Lower layer VGR enhancement experiments exhibit a more uniform distribution of surface latent heat flux, coupled with strong descent of high-entropy air, resulting in the strongest and most symmetrical warm core. Middle layer enhancement experiments show slightly lower latent heat flux intensity and significant asymmetry in distribution, yielding the weakest warm core and typhoon intensity. Upper layer enhancement reduces stability in the outflow layer, intensifies descent of high-entropy air in the typhoon eye region, and effectively enhances the warm core. Coupled with increased horizontal resolution, this effect is further strengthened, resulting in a stronger and more symmetrical typhoon warm core, and consequently, an improved simulation of typhoon intensity.
In summary, resolution settings play a crucial role in fine-scale typhoon simulations, directly impacting the simulated intensity. Using Typhoon Lekima as an example, increasing VGR at lower layer significantly improves the simulation, while the improvement is less pronounced when enhancing resolution at middle layer. Increasing resolution at upper layer requires concurrent enhancement of horizontal resolution for better typhoon simulation results. The suggested VGR settings provided in this study are specific to the uncoupled WRF model and apply solely to the Lekima typhoon case. Further experiments are required to validate the applicability of these settings to other typhoon cases and coupled models such as HWRF and COAWST, ensuring more reliable conclusions.
Data availability statement
The original contributions presented in the study are included in the article/supplementary material, further inquiries can be directed to the corresponding author.
Author contributions
QL: Writing–review and editing, Conceptualization, Formal Analysis, Software, Visualization, Writing–original draft, Data curation. YZ: Supervision, Writing–review and editing, Conceptualization. XL: Writing–review and editing. JX: Writing–review and editing, Project administration, Supervision.
Funding
The author(s) declare that financial support was received for the research, authorship, and/or publication of this article. This research was supported by the National Natural Science Foundation of China (Project Nos 42130605 and 72293604), Shenzhen Science and Technology Program (Project No. JCYJ20210324131810029), and the construction of marine science as a key discipline in high-level universities (231420003, 080503032101).
Acknowledgments
We express our sincere gratitude for these funding. We acknowledge the support of Guangdong Provincial Observation and Research Station for Tropical Ocean Environment in Western Coastal Waters (GSTOEW).
Conflict of interest
The authors declare that the research was conducted in the absence of any commercial or financial relationships that could be construed as a potential conflict of interest.
Publisher’s note
All claims expressed in this article are solely those of the authors and do not necessarily represent those of their affiliated organizations, or those of the publisher, the editors and the reviewers. Any product that may be evaluated in this article, or claim that may be made by its manufacturer, is not guaranteed or endorsed by the publisher.
References
Black, M. L., Burpee, R. W., and Marks, F. D. (1996). Vertical motion characteristics of tropical cyclones determined with airborne Doppler radial velocities. J. Atmos. Sci. 53 (13), 1887–1909. doi:10.1175/1520-0469(1996)053<1887:vmcotc>2.0.co;2
Black, P. G., and Anthes, R. A. (1971). On the asymmetric structure of the tropical cyclone outflow layer. J. Atmos. Sci. 28 (8), 1348–1366. doi:10.1175/1520-0469(1971)028<1348:otasot>2.0.co;2
Braun, S. A. (2002). A cloud-resolving simulation of hurricane bob (1991): storm structure and eyewall buoyancy. Mon. Weather Rev. 130 (6), 1573–1592. doi:10.1175/1520-0493(2002)130<1573:acrsoh>2.0.co;2
Braun, S. A., Montgomery, M. T., and Pu, Z. (2006). High-resolution simulation of hurricane bonnie (1998). Part i: the organization of eyewall vertical motion. J. Atmos. Sci. 63 (1), 19–42. doi:10.1175/JAS3598.1
Briegel, L. M., and Frank, W. M. (1997). Large-scale influences on tropical cyclogenesis in the western north pacific. Mon. Weather Rev. 125 (7), 1397–1413. doi:10.1175/1520-0493(1997)125<1397:lsiotc>2.0.co;2
Chan, J. C. 2010. Movement of tropical cyclones. Global perspectives on Tropical cyclones: from science to mitigation: 133–148. doi:10.1142/9789814293488_0004
Chan, J. C. L., and Liu, K. S. (2004). Global warming and western north pacific typhoon activity from an observational perspective. J. Clim. 17 (23), 4590–4602. doi:10.1175/3240.1
Charnock, H. (1955). Wind stress on a water surface. Q. J. R. Meteorological Soc. 81 (350), 639–640. doi:10.1002/qj.49708135027
Chen, G., et al. (2021). Verification on forecasts of typhoons over western north pacific and south China sea in 2019.
Chen, H., and Zhang, D.-L. (2013). On the rapid intensification of hurricane wilma (2005). Part ii: convective bursts and the upper-level warm core. J. Atmos. Sci. 70 (1), 146–162. doi:10.1175/JAS-D-12-062.1
Chen, P., et al. (2022). Analysis of ocean response during rapid intensification of typhoon lekima. J. Guangdong Ocean Univ. 42 (04), 72–82. doi:10.3969/j.issn.1673-9159.2022.04.009
Corbosiero, K. L., and Molinari, J. (2003). The relationship between storm motion, vertical wind shear, and convective asymmetries in tropical cyclones. J. Atmos. Sci. 60 (2), 366–376. doi:10.1175/1520-0469(2003)060<0366:trbsmv>2.0.co;2
Duan, Y., et al. (2005). Review of the research in the intensity change of tropical cyclone. Acta Meteorol. Sin. (5), 636–645. doi:10.11676/qxxb2005.062
Duran, P., and Molinari, J. (2019). Tropopause evolution in a rapidly intensifying tropical cyclone: a static stability budget analysis in an idealized axisymmetric framework. J. Atmos. Sci. 76 (1), 209–229. doi:10.1175/jas-d-18-0097.1
Durden, S. L. (2013). Observed tropical cyclone eye thermal anomaly profiles extending above 300 hpa. Mon. Weather Rev. 141 (12), 4256–4268. doi:10.1175/MWR-D-13-00021.1
Emanuel, K. A. (1995). Sensitivity of tropical cyclones to surface exchange coefficients and a revised steady-state model incorporating eye dynamics. J. Atmos. Sci. 52 (22), 3969–3976. doi:10.1175/1520-0469(1995)052<3969:sotcts>2.0.co;2
Fei, J. (1997). - instability of perturbation in typhoons under the conditions of approximate actual wind field. J. Trop. Meteorology 3 (1), 69.
Fierro, A. O., Rogers, R. F., Marks, F. D., and Nolan, D. S. (2009). The impact of horizontal grid spacing on the microphysical and kinematic structures of strong tropical cyclones simulated with the wrf-arw model. Mon. Weather Rev. 137 (11), 3717–3743. doi:10.1175/2009MWR2946.1
Fu, J., et al. (2011). Study on the investigation of the variation of the warm core structures for typhoons just before and after landing on the main land of the China. Bulietin Sci. Technol. 27 (01). doi:10.13774/j.cnki.kjtb.2011.01.008
Gentry, M. S., and Lackmann, G. M. (2010). Sensitivity of simulated tropical cyclone structure and intensity to horizontal resolution. Mon. Weather Rev. 138 (3), 688–704. doi:10.1175/2009MWR2976.1
Gierens, K., Schumann, U., Helten, M., Smit, H., and Marenco, A. (1999). A distribution law for relative humidity in the upper troposphere and lower stratosphere derived from three years of mozaic measurements. Ann. Geophys. 17 (9), 1218–1226. doi:10.1007/s00585-999-1218-7
Holland, G. J., and Merrill, R. T. (1984). On the dynamics of tropical cyclone structural changes. Q. J. R. Meteorological Soc. 110 (465), 723–745. doi:10.1002/qj.49711046510
Jin, R., Li, Y., Chen, X., and Li, M. (2023). Characteristics of the upper-level outflow and its impact on the rapid intensification of typhoon roke (2011). Front. Earth Sci. 10. doi:10.3389/feart.2022.1021308
Jorgensen, D. P., Zipser, E. J., and LeMone, M. A. (1985). Vertical motions in intense hurricanes. J. Atmos. Sci. 42 (8), 839–856. doi:10.1175/1520-0469(1985)042<0839:vmiih>2.0.co;2
Kepert, J. D. 2010. Tropical cyclone structure and dynamics. Global perspectives on Tropical cyclones: from science to mitigation: 3–53. doi:10.1142/9789814293488_0001
Kieu, C., and Wang, Q. (2017). Stability of the tropical cyclone intensity equilibrium. J. Atmos. Sci. 74 (11), 3591–3608. doi:10.1175/JAS-D-17-0028.1
Kieu, C., and Zhang, D. L. (2018). The control of environmental stratification on the hurricane maximum potential intensity. Geophys. Res. Lett. 45 (12), 6272–6280. doi:10.1029/2018gl078070
Klotzbach, P. J. (2006). Trends in global tropical cyclone activity over the past twenty years (1986–2005). Geophys. Res. Lett. 33 (10). doi:10.1029/2006GL025881
Komaromi, W. A., and Doyle, J. D. (2017). Tropical cyclone outflow and warm core structure as revealed by hs3 dropsonde data. Mon. Weather Rev. 145 (4), 1339–1359. doi:10.1175/MWR-D-16-0172.1
Lee, C.-Y., and Chen, S. S. (2012). Symmetric and asymmetric structures of hurricane boundary layer in coupled atmosphere–wave–ocean models and observations. J. Atmos. Sci. 69 (12), 3576–3594. doi:10.1175/JAS-D-12-046.1
Li, Y., Cheung, K. K. W., and Chan, J. C. L. (2014). Numerical study on the development of asymmetric convection and vertical wind shear during tropical cyclone landfall. Q. J. R. Meteorological Soc. 140 (683), 1866–1877. doi:10.1002/qj.2259
Lindzen, R., and Fox-Rabinovitz, M. (1989). Consistent vertical and horizontal resolution. Mon. Weather Rev. 117, 2575–2583. doi:10.1175/1520-0493(1989)117<2575:cvahr>2.0.co;2
Lu, X., Yu, H., Ying, M., Zhao, B., Zhang, S., Lin, L., et al. (2021). Western north pacific tropical cyclone database created by the China meteorological administration. Adv. Atmos. Sci. 38 (4), 690–699. doi:10.1007/s00376-020-0211-7
Ma, Z., Fei, J., Huang, X., and Cheng, X. (2012). Sensitivity of tropical cyclone intensity and structure to vertical resolution in wrf. Asia-Pacific J. Atmos. Sci. 48, 67–81. doi:10.1007/s13143-012-0007-5
Niu, Z., Zou, X., and Huang, W. (2021). Typhoon warm-core structures derived from fy-3d mwts-2 observations. Remote. Sens. 13, 3730. doi:10.3390/rs13183730
Persson, P. O. G., and Warner, T. T. (1991). Model generation of spurious gravity waves due to inconsistency of the vertical and horizontal resolution. Mon. Weather Rev. 119 (4), 917–935. doi:10.1175/1520-0493(1991)119<0917:mgosgw>2.0.co;2
Powers, J. G., Klemp, J. B., Skamarock, W. C., Davis, C. A., Dudhia, J., Gill, D. O., et al. (2017). The weather research and forecasting model: overview, system efforts, and future directions. Bull. Am. Meteorological Soc. 98 (8), 1717–1737. doi:10.1175/BAMS-D-15-00308.1
Pu, Z. (2009). Assimilation of satellite data in improving numerical simulation of tropical cyclones: progress, challenge and development. Data assimilation for atmospheric, oceanic and hydrologic applications. Berlin, Heidelberg: Springer Berlin Heidelberg, 163–176.
Ren, H., Ke, S., Dudhia, J., and Li, H. (2022). Wind disaster assessment of landfalling typhoons in different regions of China over 2004–2020. J. Wind Eng. Industrial Aerodynamics 228, 105084. doi:10.1016/j.jweia.2022.105084
Rotunno, R., Chen, Y., Wang, W., Davis, C., Dudhia, J., and Holland, G. J. (2009). Large-eddy simulation of an idealized tropical cyclone. Bull. Am. Meteorological Soc. 90 (12), 1783–1788. doi:10.1175/2009BAMS2884.1
Tan, Z., et al. (2020). Dagnosis on the heavy precipitation of typhoon lekima. J. Nanjing Univ. Inf. Sci. Technol. Nat. Sci. Ed. 12 (4), 450–459. doi:10.13878/j.cnki.jnuist.2020.04.006
Tan, Z.-M., Lei, L., Wang, Y., Xu, Y., and Zhang, Y. (2022). Typhoon track, intensity, and structure: from theory to prediction. Adv. Atmos. Sci. 39 (11), 1789–1799. doi:10.1007/s00376-022-2212-1
Tang, X., Ping, F., Yang, S., Li, M., and Peng, J. (2019). On the rapid intensification for typhoon meranti (2016): convection, warm core, and heating budget. Front. Earth Sci. 13 (4), 791–807. doi:10.1007/s11707-019-0799-z
Tao, Y., et al. (2016). Asymmetrical structures of the temperature and humidity of tropical cyclones. J. Trop. Meteorology 22 (3), 296–304. doi:10.16555/j.1006-8775.2016.03.004
Willoughby, H. E. (1990). Temporal changes of the primary circulation in tropical cyclones. J. Atmos. Sci. 47 (2), 242–264. doi:10.1175/1520-0469(1990)047<0242:tcotpc>2.0.co;2
Willoughby, H. E. (1998). Tropical cyclone eye thermodynamics. Mon. Weather Rev. 126 (12), 3053–3067. doi:10.1175/1520-0493(1998)126<3053:tcet>2.0.co;2
Willoughby, H. E., Clos, J. A., and Shoreibah, M. G. (1982). Concentric eye walls, secondary wind maxima, and the evolution of the hurricane vortex. J. Atmos. Sci. 39 (2), 395–411. doi:10.1175/1520-0469(1982)039<0395:cewswm>2.0.co;2
Wu, J. (1982). Wind-stress coefficients over sea surface from breeze to hurricane. J. Geophys. Res. 87, 9704–9706. doi:10.1029/jc087ic12p09704
Xu, J., and Wang, Y. (2010). Sensitivity of tropical cyclone inner-core size and intensity to the radial distribution of surface entropy flux. J. Atmos. Sci. 67 (6), 1831–1852. doi:10.1175/2010JAS3387.1
Ying, M., Zhang, W., Yu, H., Lu, X., Feng, J., Fan, Y., et al. (2014). An overview of the China meteorological administration tropical cyclone database. J. Atmos. Ocean. Technol. 31 (2), 287–301. doi:10.1175/JTECH-D-12-00119.1
Zhang, D.-L., and Wang, X. (2003). Dependence of hurricane intensity and structures on vertical resolution and time-step size. Adv. Atmos. Sci. 20 (5), 711–725. doi:10.1007/BF02915397
Zhang, D.-L., Zhu, L., Zhang, X., and Tallapragada, V. (2015). Sensitivity of idealized hurricane intensity and structures under varying background flows and initial vortex intensities to different vertical resolutions in hwrf. Mon. Weather Rev. 143 (3), 914–932. doi:10.1175/MWR-D-14-00102.1
Zhang, J., and Chen, Y. (2019). Risk assessment of flood disaster induced by typhoon rainstorms in guangdong province, China. Sustainability 11 (10), 2738. doi:10.3390/su11102738
Keywords: WRF, vertical resolution, thermal and dynamic structures, typhoon intensity, Lekima
Citation: Lian Q, Zhang Y, Liu X and Xu J (2024) The impact of WRF vertical resolution on the simulated thermal-dynamic structures and intensity of Typhoon Lekima. Front. Earth Sci. 12:1363482. doi: 10.3389/feart.2024.1363482
Received: 12 January 2024; Accepted: 05 March 2024;
Published: 20 March 2024.
Edited by:
Vijay Tallapragada, NCEP Environmental Modeling Center (EMC), United StatesReviewed by:
Mrinal Biswas, National Center for Atmospheric Research (UCAR), United StatesBin Chen, Chinese Academy of Meteorological Sciences, China
Copyright © 2024 Lian, Zhang, Liu and Xu. This is an open-access article distributed under the terms of the Creative Commons Attribution License (CC BY). The use, distribution or reproduction in other forums is permitted, provided the original author(s) and the copyright owner(s) are credited and that the original publication in this journal is cited, in accordance with accepted academic practice. No use, distribution or reproduction is permitted which does not comply with these terms.
*Correspondence: Yu Zhang, emhhbmd5dUBnZG91LmVkdS5jbg==