 Ren Zhongxin
 Yang Xiaoping1
- 1National Oil and Gas Pipeline Network Group, Shanghai, China
- 2Petroleum Engineering School, Southwest Petroleum University, Chendu, China
Underground gas storage (UGS) is the most economical and effective means to guarantee stable gas supply. During gas production process, the evaporation of formation water leads to the increase of water content in the gas, and the salinity of the remaining formation water increases. This work applied numerical simulation to analyze the effect of salt deposition on flowing bottomhole pressure, production capacity and storage capacity. The simulation results show that the minimum and maximum pressure of UGS is more likely to be reached during multi-cycle production under the conditions of salt deposition. Under the initial water condition, reservoir drying can improve the gas storage capacity. At the end of the tenth cycle, the storage capacity increases by 1.4%. It is concluded that the study on the impact of formation water evaporation on storage capacity is helpful for the prevention and control of salt formation water in UGS with high salinity.
1 Introduction
The use of fossil energy is a key factor in environmental change and pollution (Wu et al., 2016; Liu et al., 2018; Pachiannan et al., 2019; Tang et al., 2022). The large amount of fossil energy consumption causes greenhouse gas emissions, which increase the concentration of greenhouse gases in the atmosphere (Tang et al., 2015; Han et al., 2017; Mac Kinnon et al., 2018; Tong et al., 2020). Low carbon energy has been recognized as a key means to achieve sustainable development (Dostál and Ladányi, 2018). Natural gas is known as a clean energy source that produces less carbon dioxide pollution than other fossil fuels such as coal and oil (Tang et al., 2021a; Hu et al., 2021; He et al., 2022; Zhu et al., 2022). Compared to conventional energy sources, natural gas has relatively low carbon emissions and is considered an important energy source for the transition to renewable energy (Ullah Khan et al., 2017; Whiting et al., 2017; Gillessen et al., 2019; Zeren and Akkuş, 2020). The peak shaving are a challenge for the efficient use of natural gas. UGS peak shaving has the advantages of large storage capacity, good safety, and low storage costs. It is the main and economic way of gas supply peaking method (Chen et al., 2018; Firme et al., 2019; Jelušič et al., 2019; Sedaee et al., 2019; Animah and Shafiee, 2020).
According to the experience of countries around the world, the use of underground gas storage for regulation is the most effective way to ensure the safe and stable supply of natural gas (Zhang et al., 2020; Molíková et al., 2022; Li et al., 2023). In 2021, China’s natural gas consumption reaches 354.2 billion m3, up 8.6% compared with 2020. China’s natural gas consumption is expected to reach 430 billion m3 by 2025, with an average annual increment of 21 billion m3 (Braungardt et al., 2019; Kvamme and Saeidi, 2021; Wei et al., 2021; Zhu et al., 2022). The construction of UGS has accelerated with the increase in natural gas consumption. Hence, achieving efficient development of UGS has become one of the difficulties faced by the natural gas industry (Xiao et al., 2020).
Chinese UGS industry started late compared to developed western countries (Zhang et al., 2017; Bian et al., 2020). Depleted reservoir UGS is the most common and economical form of UGS. At present, there are more than 400 such reservoirs in the world, covering more than 75% of the total number of UGS. Salt deposition occurs when the initial salinity of formation water is high (Zeidouni et al., 2009; Spycher and Pruess, 2010; André et al., 2014; Miri et al., 2014; Peysson et al., 2014; Tang et al., 2015; Miri et al., 2015; Jeddizahed and Rostami, 2016; Tang et al., 2021b). However, the study of salt deposition mainly focuses on the process of CO2 geological sequestration (Kim et al., 2013; Cui et al., 2018; Li et al., 2021; Zhao et al., 2021). However, there are few studies on the changes of production capacity and storage capacity due to formation water evaporation after multi-cycle production of UGS. Water evaporation in the reservoir can enhance formation permeability and porosity without formation water supply. The porosity and permeability of the cores after evaporation are elevated compared with the porosity and permeability under initial water saturation conditions, with an average increase of 42% in porosity and 39% in permeability (Tang et al., 2022). The improved storage volume can be calculated based on the drying radius of the gas well during the production of the gas storage. The drying radius of gas storage is increasing with the increase of production cycle.
This paper analyzes the effect of reservoir salt deposition on bottomhole flow pressure, production capacity and storage capacity based on a numerical model. Taken the Wen23 UGS as an example, the changes in production capacity and storage capacity after multiple-cycle production are studied.
2 Building model of salt deposition in reservoir
During the development of the gas reservoir, the pressure drop in the near-wellbore causes the gas to flow towards the well and the water vapor content in the gas phase increases. Salt deposition occurs when the salinity of the formation water reaches its maximum solubility. Evaporation of formation water and salt formation have a major impact on the gas-liquid phase balance and solid phase precipitation in the system, and they also have an impact on gas flow capacity and reservoir storage capacity during gas production.
2.1 The water saturation model near-wellbore
Figure 1 shows the schematic diagram of the volume element of the single well model.
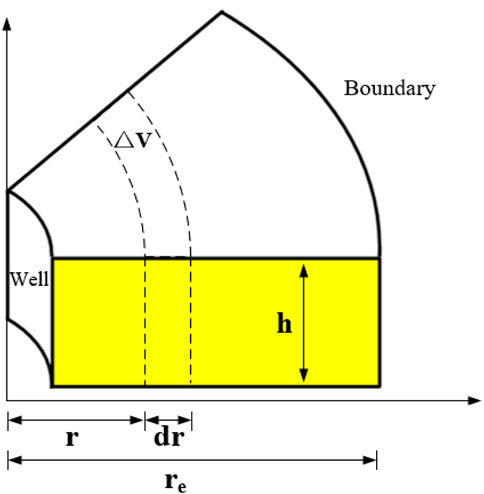
FIGURE 1. The schematic diagram of the volume element of the single well model.
Pore volume of volume elements within the formation:
Where △V is the pore volume of volume element, cm3; r is the reservoir radius, cm; h is the thickness of reservoir, cm; ϕ is the porosity, %.
The amount of change in the volume of the water phase is as follows due to the decrease of water saturation in the system caused by the evaporation of the water phase:
Where Vw is the amount of change in the volume of the water phase, cm3; Sw is the water content saturation, %.
The pressure in the near-well zone decreases, causing evaporation of the aqueous phase and an increase in water saturation as the gas flows through. The water phase change within the volume element can also be expressed as follows:
Where q is the gas production volume, cm3/s; t is the production time, s; ω is the saturated content of water vapor in natural gas, cm3/cm3.
And the content of water vapor in natural gas is as follows:
Where p is the pressure, MPa; A and B are the correlation factor.
In steady seepage, the radial pressure drop in a gas well based on Darcy’s law is as follows;
Where μg is the viscosity of gas, mPa·s; Bg is the volume factor; K is the reservoir permeability, mD; Krg is the gas phase relative permeability.
Combining Eqs 3–5, the following equations are obtained:
The expression of the volume factor is as follows:
Combining Eqs 6, 7, the following equation is obtained:
The formation water has a certain salinity, the presence of salt inhibits the evaporation of the water phase, reducing the water vapor content in the gas phase, according to Morin’s theory, certain modifications to Eq 8:
Where c is the molar concentration of salt in formation water, mol/L.
The value of c is mainly based on whether the formation water is in a saturated state during salt deposition, and c is expressed as follows:
Where ci is the molar concentration of salt in formation water under initial conditions, mol/L; cc is the molar concentration of salt when the formation is saturated with water, mol/L; Swi is the initial water content saturation, %.
2.2 Water saturation model in the near-wellbore considering evaporation of formation water
Water vapor content in the gas phase is related to temperature, pressure and salinity. During the flow of gas to the wellbore, the pressure gradually decreases and the water vapor content in the gas phase increases. The salinity of the formation water around the wellbore increases, and even salt deposition occurs. Assume that no transport of formation water occurs in the reservoir, so the salt ion content remains constant at any point in the formation:
As the pressure decreases, evaporation of formation water accelerates and the salinity of formation water will change
Therefore, the salinity of the formation water under a certain moment is as follows:
Salt deposition occurs in the formation when C > Ccritical.
Where Swi is the water content saturation at moment i, %; Swi+1 is the water content saturation at moment i+1, %; Ci is the salinity of formation water at moment i, mol/L; Ci+1 is the salinity of formation water at moment i+1, mol/L; Const is the constant.
The p, Ci, Swi at time i is brought into the Eq 13 to obtain the salinity of the formation water at time i+1. The phase software is used to calculate the solubility of NaCl at different pressure and salinity, and when the salinity of the formation water exceeds the solubility of NaCl, which is used to determine the values Ci in Eq 13 at different times:
The formation salt deposition model is more complex, and the solution needs to rely on numerical simulation software before it can be calculated. The idea of solving the near-well water content saturation distribution model is shown in Figure 2.
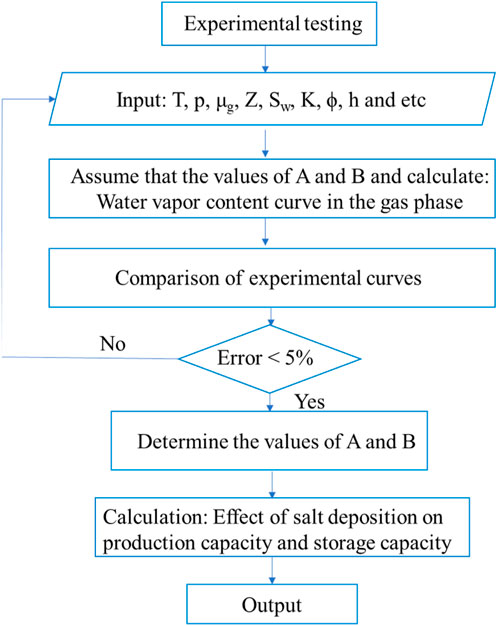
FIGURE 2. The idea of solving the near-well water content saturation distribution model.
3 Numerical simulation model of single well
The numerical simulation software CMG is used to model the radial mechanism of a single well with multi-cycle production UGS. This model can be used to study the effect of water evaporation and salt deposition on production capacity and reservoir capacity in UGS.
3.1 Rock physical properties, fluid properties and phase parameters
To simplify the simulation, pure CH4 is used for both the formation fluid and injection gas composition for the simulation. The model mainly considers the effect of salt deposition on the production capacity and storage capacity of UGS. Na+ and Cl− in the formation water are supersaturated to precipitate NaCl crystals. NaCl crystals affect the reservoir properties by depositing in the pore space. The main chemical reaction equation is shown in Eq 15.
Salt deposition and evaporation of formation water can lead to changes in reservoir porosity and permeability. The pore-permeability relationship is given by the experimental data.
The relative permeability curve is taken from laboratory long core experiments. The relative permeability is shown as in Figure 3.
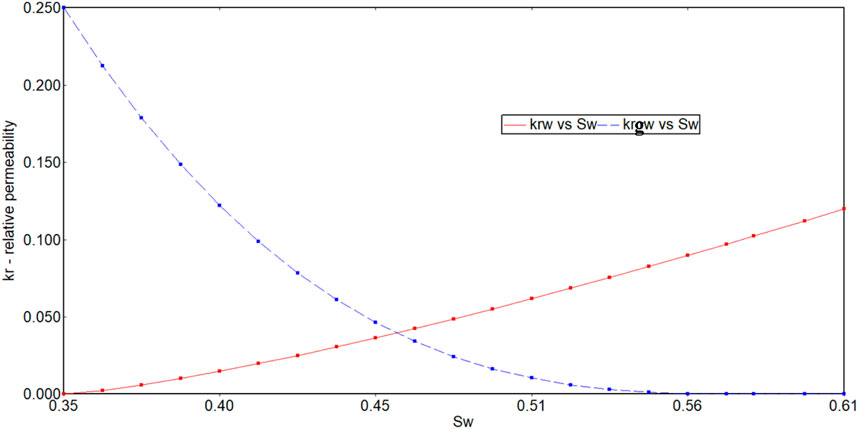
FIGURE 3. Gas-water relative permeability curve.
3.2 Basic program setting
In order to study the effect of formation salt formation caused by formation water evaporation on the production and storage capacity of gas storage, the radial mechanism model of multi-cycle injection and production single well of gas storage was established by using numerical simulation software CMG. The model grid was divided into 10×1×5, and the radial mesh size was 1m, 2m, 3m, 5m, 8m, 13m, 21m, 34m, 40 m and 47 m, respectively. The layer is 40 m thick and 200 m longitudinally. The grid plane distribution and three-dimensional distribution are shown in Figure 4. The reservoir parameters are set according to the field data of the gas reservoir. The average permeability is 10.66mD, the average porosity is 11.16%, the bound water saturation is 0.35, and the formation water salinity is 300000ppm. Table 1 shows the parameters used in modeling and their values.
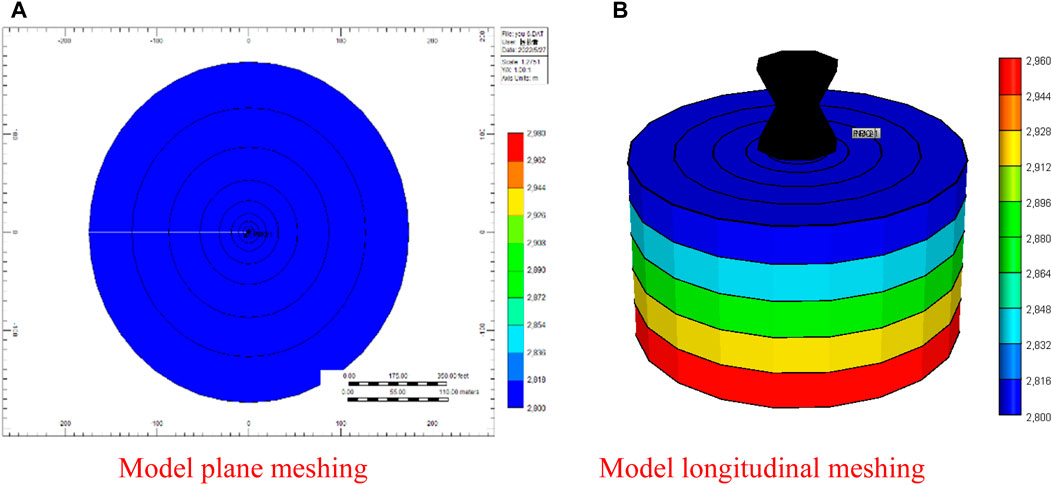
FIGURE 4. Numerical model grid division diagram.
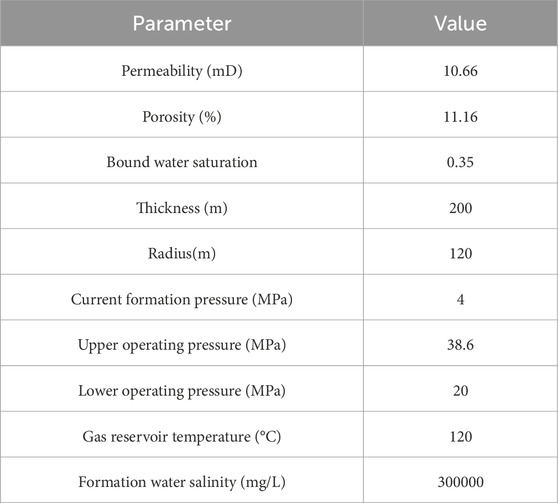
TABLE 1. Model setting parameters.
A well of UGS is set up in the middle of the model, and all layers are shot open. The basic program is set up in 2 phases, including cushion gas stage and UGS multi-cycle production stage.
(1) Cushion gas stage: The gas injection volume of single well is about 400,000 m3/d.
(2) UGS multi-cycle production stage: In this stage, UGS is injected to the maximum pressure of 38 MPa, then gas is exploited to the minimum pressure of 20 MPa. The maximum injection volume and maximum gas extraction volume are both 600,000 m3/d in a single cycle. The natural gas is injected in the UGS from July to December and extracted from January to June every year. This work can predict the changes in production capacity and storage capacity after multiple-cycle production by simulating salt deposition in the near-wellbore.
4 Analysis of salt deposition
The model is calculated separately for two sets of schemes, including considering salt deposition and not considering salt deposition. The rest of the model conditions are the same. The results of the two schemes are compared to analyze the gas production capacity.
4.1 Effect of salt deposition on bottomhole pressure
The bottomhole pressures in injection wells and production wells are shown in Figures 5, 6. There is no significant change in bottom flow pressures in injection wells and production wells without considering salt deposition. In the condition of considering salt deposition, the bottom flow pressures of injection well rise to the maximum pressure as the production cycle increases. The reason for this phenomenon is that salt deposition is more severe in the near-well zone and a larger pressure is required to inject the same amount of gas. Similarly, the bottom flow pressure of injection well reaches the minimum pressure earlier without considering salt deposition.
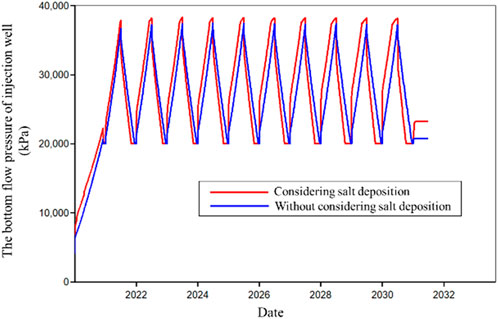
FIGURE 5. Comparison of bottomhole flow pressure in considering salt deposition conditions and without considering salt deposition conditions of injection well.
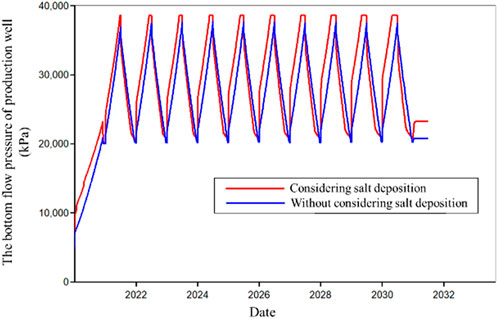
FIGURE 6. Comparison of bottomhole flow pressure in considering salt deposition conditions and without considering salt deposition conditions of production well.
4.2 Effect of salt deposition on production capacity
The impact of salt deposition on production capacity of gas well can be divided into two parts. Firstly, the evaporation of formation water increases the flow space and the flow capacity of gas, thus increasing the production capacity. In addition, salt crystals can block the pores in the formation and reduce the production capacity of the gas well. These two mechanisms affect the production capacity of gas well.
Two scenarios with different conditions are calculated in this work. The first is a comparison of the effect of salt deposition on gas well production capacity under considering water evaporation conditions and without considering water evaporation conditions. Then this work investigates the effect of salt deposition on gas well production capacity with formation water supplement. The results are shown in Figure 7. The evaporation of formation water increases the gas phase flow capacity without formation water supply.
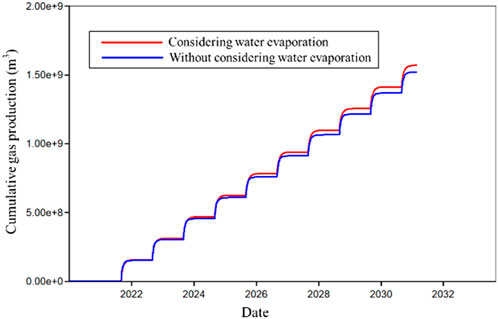
FIGURE 7. Comparison of cumulative gas production under different water production conditions without considering movable water.
The comparison of cumulative gas production under different water production conditions with considering movable water is shown in Figure 8. The damage of salt deposition gradually increases and the production capacity of gas wells is severely reduced under the conditions of formation water supplement.
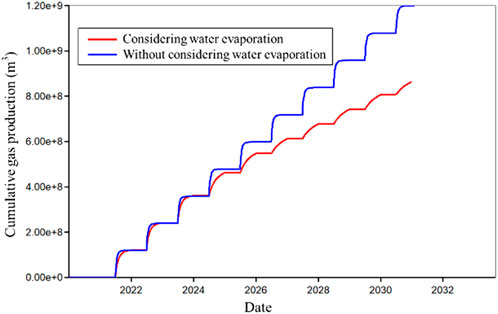
FIGURE 8. Comparison of cumulative gas production under different water production conditions with considering movable water.
4.3 Effect of salt deposition on storage capacity
A pressure drop funnel is formed in the near-wellbore during production of a gas well. The natural gas in the reservoir evaporates the formation water causing ion oversaturation during the gas from the far-end to the bottom of the well, resulting in salt deposition., The dry gas flows from the bottom of the well to the far-end and evaporates formation water during the gas injection process. More space can be used to store natural gas, enhancing the storage capacity of the UGS.
The drying volume is the volume of evaporation of formation water under reservoir conditions. The proportion of increase in geological reserves is the percentage of increased reserves to the control reserves of a single well. The calculation methods of the drying volume and the proportion of increase in geological reserves are as follows.
where Vm is the drying volume, “r” is the drying radius, “h” is the thickness of reservoir and Sw is the initial water saturation.
where Vp is the volume of natural gas underground conditions and “Bg” is the volume factor of natural gas.
where K is the proportion of increase in geological reserves and “G” is geological reserves of natural gas.
Table 2 shows the calculation results of the drying volume, working gas volume and geological reserves with the various production cycle. The drying radius of reservoir is expanding with the increase of production cycle under initial water saturation conditions. The working gas volume increased by 5.4×10⁶ m3 by the tenth cycle. The geological reserves increased by 1.4% compared to the control reserves of single well.
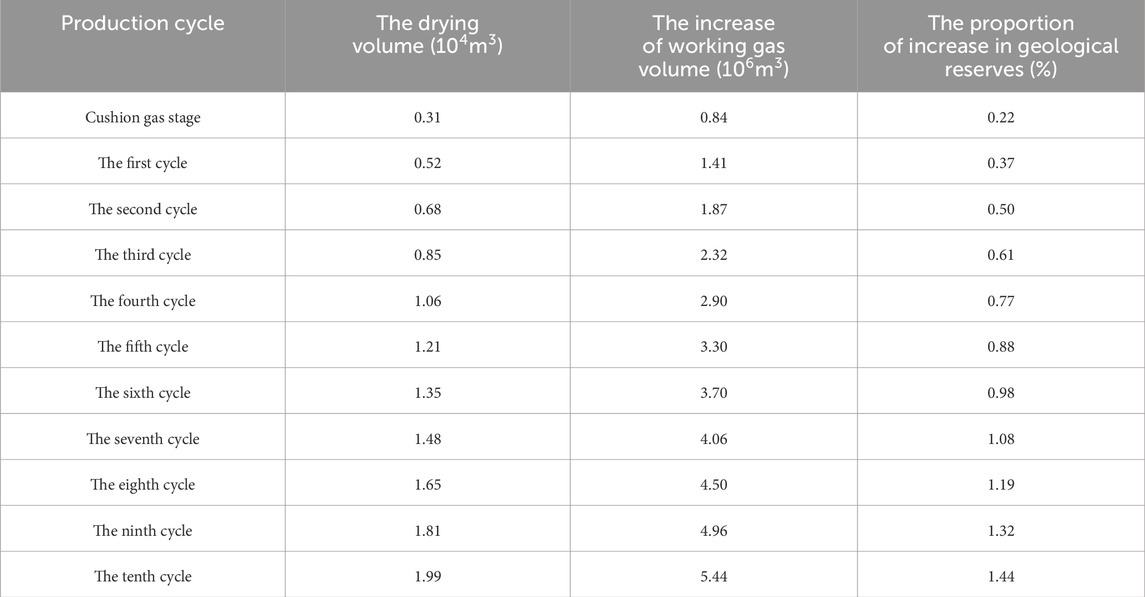
TABLE 2. The calculation results of the drying volume, working gas volume and the proportion of increase in geological reserves with the various production cycle.
4.4 Effect of production rates
Four groups of schemes were set, and salt formation damage under different production rates was studied by comparing the daily production rates (20, 40, 60 and 80×104 m3/d), the salinity was 300000ppm, the lower limit of bottom-hole flow pressure in production Wells was 20MPa, and the upper limit of gas injection Wells was 38.6 MPa.
The cumulative gas production curves under different production rates are shown in Figures 9–12. When the production rate is 40×104 m3/d, there is no significant change in cumulative gas production. When the output is 60×104 m3/d, there is a significant decrease in daily gas production in the 7th cycle. When the yield was 80×104 m3/d, the salt formation damage was aggravated in the 5th cycle. As shown in Figure 12, the cumulative gas production capacity decline rate histogram shows that when the production is 60×104 m3/d, the gas production capacity decline rate rises to 22.89% after ten cycles, and the salt formation damage is serious. The conclusions are as follows: the higher the production, the greater the salt formation risk and the more serious the formation salt formation. When the production is greater than 60×104 m3/d, the daily gas capacity decreases significantly and the salt formation is serious. Low gas production is conducive to controlling the risk of salt formation, and it is recommended to produce less than 60×104 m3/d.
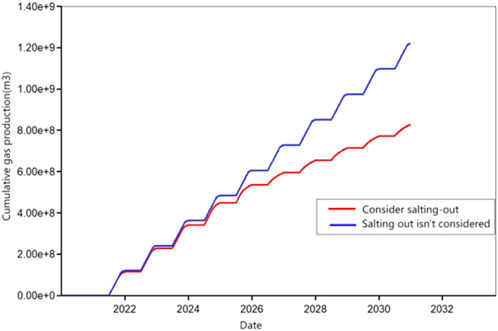
FIGURE 9. Cumulative gas production curve at a production rate of 80×104 m3/d.
FIGURE 10. Cumulative gas production curve at a production rate of 60×104 m3/d.
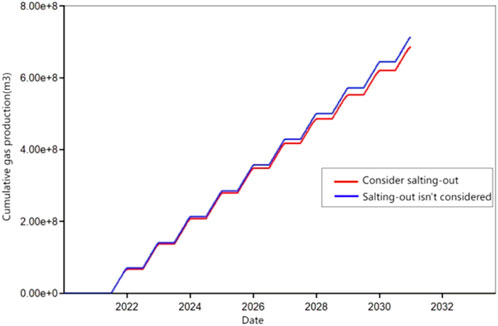
FIGURE 11. Cumulative gas production curve at a production rate of 40×104 m3/d.
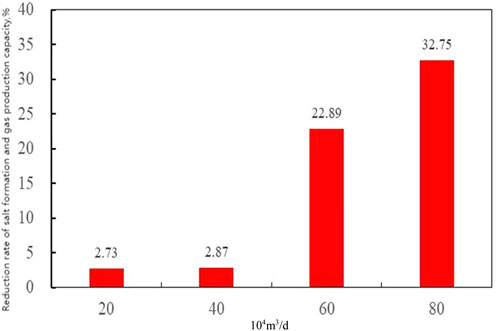
FIGURE 12. Histogram of gas production capacity decline rate.
5 Conclusion
In this work, numerical simulation is performed to analyze the effect of salt deposition on flowing bottomhole pressure, production capacity and storage capacity in UGS.
(1) Salt deposition makes the buttonhole pressure of the well more dramatic, and the minimum and maximum pressure of UGS is more likely to be reached during multi-cycle production under the conditions of salt deposition.
(2) The evaporation of formation water increases the gas phase flow capacity without formation water supply. The damage of salt deposition gradually increases and the production capacity of gas wells is severely reduced under the conditions of formation water supplement.
(3) The working gas volume increased by 5.4×10⁶ m3 by the tenth cycle. The geological reserves increased by 1.4% compared to the control reserves of single well.
Data availability statement
The raw data supporting the conclusion of this article will be made available by the authors, without undue reservation.
Author contributions
ZR: Writing–review and editing.
Funding
The author(s) declare that no financial support was received for the research, authorship, and/or publication of this article.
Conflict of interest
Authors RZ, YX, CD, and MD were employed by National Oil and Gas Pipeline Network Group.
The remaining author declares that the research was conducted in the absence of any commercial or financial relationships that could be construed as a potential conflict of interest.
Publisher’s note
All claims expressed in this article are solely those of the authors and do not necessarily represent those of their affiliated organizations, or those of the publisher, the editors and the reviewers. Any product that may be evaluated in this article, or claim that may be made by its manufacturer, is not guaranteed or endorsed by the publisher.
References
André, L., Peysson, Y., and Azaroual, M. (2014). Well injectivity during CO2 storage operations in deep saline aquifers – Part 2: numerical simulations of drying, salt deposit mechanisms and role of capillary forces. Int. J. Greenh. Gas Control 22, 301–312. doi:10.1016/j.ijggc.2013.10.030
Animah, I., and Shafiee, M. (2020). Application of risk analysis in the liquefied natural gas (LNG) sector: an overview. J. Loss Prev. Process Industries 63, 103980. doi:10.1016/j.jlp.2019.103980
Bian, H., Xia, Y., Lu, C., Qin, X., Meng, Q., and Lu, H. (2020). Pore structure fractal characterization and permeability simulation of natural gas hydrate reservoir based on CT images. Geofluids 2020, 6934691–6934699. doi:10.1155/2020/6934691
Braungardt, S., van den Bergh, J., and Dunlop, T. (2019). Fossil fuel divestment and climate change: reviewing contested arguments. Energy Res. Soc. Sci. 50, 191–200. doi:10.1016/j.erss.2018.12.004
Chen, S., Zhang, Q., Wang, G., Zhu, L., and Li, Y. (2018). Investment strategy for underground gas storage facilities based on real option model considering gas market reform in China. Energy Econ. 70, 132–142. doi:10.1016/j.eneco.2017.12.034
Cui, G., Ren, S., Zhang, L., Wang, Y., and Zhang, P. (2018). Injection of supercritical CO2 for geothermal exploitation from single- and dual-continuum reservoirs: heat mining performance and salt precipitation effect. Geothermics 73, 48–59. doi:10.1016/j.geothermics.2018.01.010
Dostál, Z., and Ladányi, L. (2018). Demands on energy storage for renewable power sources. J. Energy Storage 18, 250–255. doi:10.1016/j.est.2018.05.003
Firme, P. A. L. P., Roehl, D., and Romanel, C. (2019). Salt caverns history and geomechanics towards future natural gas strategic storage in Brazil. J. Nat. Gas Sci. Eng. 72, 103006. doi:10.1016/j.jngse.2019.103006
Gillessen, B., Heinrichs, H., Hake, J. F., and Allelein, H. J. (2019). Natural gas as a bridge to sustainability: infrastructure expansion regarding energy security and system transition. Appl. Energy 251, 113377. doi:10.1016/j.apenergy.2019.113377
Han, S., Zhang, B., Sun, X., Han, S., and Höök, M. (2017). China’s energy transition in the power and transport sectors from a substitution perspective. Energies 10 (5), 600. doi:10.3390/en10050600
He, Y.-W., He, Z.-Y., Tang, Y., Xu, Y.-J., Long, J.-C., and Sepehrnoori, K. (2022). Shale gas production evaluation framework based on data-driven models. Petroleum Sci. 20, 1659–1675. doi:10.1016/j.petsci.2022.12.003
Hu, H., Zhu, Y.-Q., Li, S.-Y., and Li, Z. (2021). Effects of green energy development on population growth and employment: evidence from shale gas exploitation in Chongqing, China. Petroleum Sci. 18 (5), 1578–1588. doi:10.1016/j.petsci.2021.08.013
Jeddizahed, J., and Rostami, B. (2016). Experimental investigation of injectivity alteration due to salt precipitation during CO2 sequestration in saline aquifers. Adv. Water Resour. 96, 23–33. doi:10.1016/j.advwatres.2016.06.014
Jelušič, P., Kravanja, S., and Žlender, B. (2019). Optimal cost and design of an underground gas storage by ANFIS. J. Nat. Gas Sci. Eng. 61, 142–157. doi:10.1016/j.jngse.2018.11.003
Kim, M., Sell, A., and Sinton, D. (2013). Aquifer-on-a-chip: understanding pore-scale salt precipitation dynamics during CO2 sequestration. Lab a chip 13 (13), 2508–2518. doi:10.1039/c3lc00031a
Kvamme, B., and Saeidi, N. (2021). A zero emission scheme for producing energy from natural gas hydrates and conventional natural gas. Petroleum 7 (4), 364–384. doi:10.1016/j.petlm.2021.10.003
Li, H., Yu, G., Li, C., Xie, Z., Liu, C., Zhang, D., et al. (2023). Prediction model and risk quantification of natural gas peak production in central Sichuan paleo-uplift gas reservoirs. Geofluids 2023, 1–15. doi:10.1155/2023/4858118
Li, Y., Suo, R., Li, X., Hu, L., Gao, P., Zhao, S., et al. (2021). Quantitative experimental investigation of multiple P-T effects on primary drainage process during scCO2 storage in deep saline aquifers. J. Hydrology 596, 126143. doi:10.1016/j.jhydrol.2021.126143
Liu, G., Dong, X., Jiang, Q., Dong, C., and Li, J. (2018). Natural gas consumption of urban households in China and corresponding influencing factors. Energy Policy 122, 17–26. doi:10.1016/j.enpol.2018.07.016
Mac Kinnon, M. A., Brouwer, J., and Samuelsen, S. (2018). The role of natural gas and its infrastructure in mitigating greenhouse gas emissions, improving regional air quality, and renewable resource integration. Prog. Energy Combust. Sci. 64, 62–92. doi:10.1016/j.pecs.2017.10.002
Miri, R., Aagaard, P., and Hellevang, H. (2014). Examination of CO2–SO2 solubility in water by SAFT1. Implications for CO2 transport and storage. J. Phys. Chem. B 118 (34), 10214–10223. doi:10.1021/jp505562j
Miri, R., van Noort, R., Aagaard, P., and Hellevang, H. (2015). New insights on the physics of salt precipitation during injection of CO2 into saline aquifers. Int. J. Greenh. Gas Control 43, 10–21. doi:10.1016/j.ijggc.2015.10.004
Molíková, A., Vítězová, M., Vítěz, T., Buriánková, I., Huber, H., Dengler, L., et al. (2022). Underground gas storage as a promising natural methane bioreactor and reservoir? J. Energy Storage 47, 103631. doi:10.1016/j.est.2021.103631
Pachiannan, T., Zhong, W., Rajkumar, S., He, Z., Leng, X., and Wang, Q. (2019). A literature review of fuel effects on performance and emission characteristics of low-temperature combustion strategies. Appl. Energy 251, 113380. doi:10.1016/j.apenergy.2019.113380
Peysson, Y., André, L., and Azaroual, M. (2014). Well injectivity during CO2 storage operations in deep saline aquifers—Part 1: experimental investigation of drying effects, salt precipitation and capillary forces. Int. J. Greenh. Gas Control 22, 291–300. doi:10.1016/j.ijggc.2013.10.031
Sedaee, B., Mohammadi, M., Esfahanizadeh, L., and Fathi, Y. (2019). Comprehensive modeling and developing a software for salt cavern underground gas storage. J. Energy Storage 25, 100876. doi:10.1016/j.est.2019.100876
Spycher, N., and Pruess, K. (2010). A phase-partitioning model for CO2–brine mixtures at elevated temperatures and pressures: application to CO2-enhanced geothermal systems. Transp. Porous Media 82 (1), 173–196. doi:10.1007/s11242-009-9425-y
Tang, X., Snowden, S., McLellan, B. C., and Höök, M. (2015a). Clean coal use in China: challenges and policy implications. Energy Policy 87, 517–523. doi:10.1016/j.enpol.2015.09.041
Tang, Y., Hu, S., He, Y., Wang, Y., Wan, X., Cui, S., et al. (2021b). Experiment on CO2-brine-rock interaction during CO2 injection and storage in gas reservoirs with aquifer. Chem. Eng. J. 413, 127567. doi:10.1016/j.cej.2020.127567
Tang, Y., Long, K., Wang, J., Xu, H., Wang, Y., He, Y., et al. (2021a). Change of phase state during multi-cycle injection and production process of condensate gas reservoir based underground gas storage. Petroleum Explor. Dev. 48 (2), 395–406. doi:10.1016/s1876-3804(21)60031-9
Tang, Y., Wang, N., He, Y., Wang, Y., Shan, Y., Zhang, H., et al. (2022). Impact of salt deposition induced by water evaporation on petrophysical properties and pore structure in underground gas storage through dynamic and static experiments. J. Hydrology 617, 129033. doi:10.1016/j.jhydrol.2022.129033
Tang, Y., Yang, R., Du, Z., and Zeng, F. (2015b). Experimental study of formation damage caused by complete water vaporization and salt precipitation in sandstone reservoirs. Transp. Porous Media 107 (1), 205–218. doi:10.1007/s11242-014-0433-1
Tong, Q., Lin, H.-Y., Qin, X.-Y., Yan, R.-S., Guo, Y.-F., and Wei, X.-Y. (2020). Scenario analysis on abating industrial process greenhouse gas emissions from adipic acid production in China. Petroleum Sci. 17 (4), 1171–1179. doi:10.1007/s12182-020-00450-0
Ullah Khan, I., Hafiz Dzarfan Othman, M., Hashim, H., Matsuura, T., Ismail, A. F., Rezaei-DashtArzhandi, M., et al. (2017). Biogas as a renewable energy fuel – a review of biogas upgrading, utilisation and storage. Energy Convers. Manag. 150, 277–294. doi:10.1016/j.enconman.2017.08.035
Wei, N., Bai, R., Zhao, J., Zhang, Y., and Xue, J. (2021). The prospect of natural gas hydrate (NGH) under the vision of Peak Carbon Dioxide Emissions in China. Petroleum 7 (4), 357–363. doi:10.1016/j.petlm.2021.11.001
Whiting, K., Carmona, L. G., and Sousa, T. (2017). A review of the use of exergy to evaluate the sustainability of fossil fuels and non-fuel mineral depletion. Renew. Sustain. Energy Rev. 76, 202–211. doi:10.1016/j.rser.2017.03.059
Wu, K., Paranjothi, G., Milford, J. B., and Kreith, F. (2016). Transition to sustainability with natural gas from fracking. Sustain. Energy Technol. Assessments 14, 26–34. doi:10.1016/j.seta.2016.01.003
Xiao, J.-z., Kong, W.-c., Wang, X.-l., and Li, M. (2020). Numerical modeling and assessment of natural gas pipeline separation in China: the data from Henan Province. Petroleum Sci. 17 (1), 268–278. doi:10.1007/s12182-019-00400-5
Zeidouni, M., Pooladi-Darvish, M., and Keith, D. (2009). Analytical solution to evaluate salt precipitation during CO2 injection in saline aquifers. Energy Procedia 1 (1), 1775–1782. doi:10.1016/j.egypro.2009.01.232
Zeren, F., and Akkuş, H. T. (2020). The relationship between renewable energy consumption and trade openness: new evidence from emerging economies. Renew. Energy 147, 322–329. doi:10.1016/j.renene.2019.09.006
Zhang, G., Li, B., Zheng, D., Ding, G., Wei, H., Qian, P., et al. (2017). Challenges to and proposals for underground gas storage (UGS) business in China. Nat. Gas. Ind. B 4 (3), 231–237. doi:10.1016/j.ngib.2017.07.025
Zhang, J., Tan, Y., Zhang, T., Yu, K., Wang, X., and Zhao, Q. (2020). Natural gas market and underground gas storage development in China. J. Energy Storage 29, 101338. doi:10.1016/j.est.2020.101338
Zhao, Y., Zhang, Q., and Chen, X. (2021). Experimental investigation on effect of water film thickness in unsaturated sandstone cores on CO2 transport during geologic storage. J. Hydrology 601, 126595. doi:10.1016/j.jhydrol.2021.126595
Keywords: underground gas storage, salt deposition, high salinity, storage capacity, production capacity
Citation: Zhongxin R, Xiaoping Y, Dawei C, Ning W and Da M (2024) Study of the effect of salt deposition on production capacity and storage capacity in underground gas storage. Front. Earth Sci. 12:1362776. doi: 10.3389/feart.2024.1362776
Received: 29 December 2023; Accepted: 27 February 2024;
Published: 07 March 2024.
Edited by:
Paolo Capuano, University of Salerno, ItalyCopyright © 2024 Zhongxin, Xiaoping, Dawei, Ning and Da. This is an open-access article distributed under the terms of the Creative Commons Attribution License (CC BY). The use, distribution or reproduction in other forums is permitted, provided the original author(s) and the copyright owner(s) are credited and that the original publication in this journal is cited, in accordance with accepted academic practice. No use, distribution or reproduction is permitted which does not comply with these terms.
*Correspondence: Ren Zhongxin, NzY1ODAyMjI4QHFxLmNvbQ==