 Qinghui Xie
 Junhao Chen1,2
95% of researchers rate our articles as excellent or good
Learn more about the work of our research integrity team to safeguard the quality of each article we publish.
Find out more
ORIGINAL RESEARCH article
Front. Earth Sci. , 03 May 2024
Sec. Structural Geology and Tectonics
Volume 12 - 2024 | https://doi.org/10.3389/feart.2024.1361706
This article is part of the Research Topic Advances of New Technologies in Seismic Exploration View all 22 articles
The H shale gas block in the Yangtze plate of China has undergone multistage tectonic evolution, which has resulted in the development of faults and natural fractures that are multistage, multi-scale, multi-type, and multi-strike in nature. To precisely characterize the natural fractures, this study used the seismic attribute analysis method to conduct a multi-scale prediction and natural fracture modelling. Initially, manual fault interpretation and the conventional seismic attributes including variance attribute, curvature and edge detection are used to interpret large-to medium-scale faults. Subsequently, the ant-tracking attribute based on the divided-frequency seismic cubes is used to predict and quantitatively interpret the mid- and small-scale fractures; The third step is to quantitatively divide the ant-tracking attribute value into multiple scales and convert them linearly into fracture intensity. The fourth step is to establish a multi-scale fracture model. This approach has established a comprehensive prediction workflow, progressing from large-scale to small-scale analysis, and shifting from qualitative to quantitative assessment. Compared with traditional fracture prediction and modeling methods, this method not only enhances the accuracy, but also satisfies the engineering requirements of multi-scale modeling. By applying the method in the H shale gas block, we gained a microscopic understanding of the fractures, which are predominantly NW, NE, and nearly NS trending, with a minimal occurrence of nearly EW trending faults/fractures. This method can be effectively applied to characterize multi-scale fractures in areas similar to the geological background of the H shale gas block.
Shale gas exploration and development level in China’s terrestrial facies and marine-terrestrial transitional facies is at a low level. Significant uncertainties in resource evaluation hinder effective shale gas development on a large scale (Sun and Liu, 2018; Li, 2023a). Yangtze plate of China has widely developed shale formations with marine, marine-terrestrial transitional, and terrestrial facies. Shales in the Upper Ordovician Wufeng formation-Lower Silurian Longmaxi formation of the marine deepwater shelf facies are widely distributed and rich in shale gas resources, serving as vital shale gas-producing formations in southern China (He et al., 2022; Zhou et al., 2022). Due to the drastic modification of multi-period and strong tectonic movements, the shale reservoirs in the Longmaxi-Wufeng formation in the Yangtze plate has developed a complex natural fracture system (Shi et al., 2019; Li, 2023b; Fan et al., 2024), which is a distinctive geological trait of marine shale gas reservoirs in China. The highly developed natural fractures within shale reservoirs are both storage spaces and seepage channels, thereby impacting shale gas’s preservation conditions (Xu et al., 2019; Shan et al., 2021; Wang J. et al., 2021). However, fractures intersecting the wellbore can lead to drilling risks such as mud leakage, blocking, and jamming. When fracturing, fractures can also easily cause fracturing fluid filtration loss and sand plugging, affecting the fracturing treatment’s efficacy. Therefore, accurately characterizing the spatial distribution of the natural fracture system within the shale reservoir, as an important link in the integration of geological engineering, is essential for optimizing shale gas sweet spot selection, horizontal well deployment, drilling, and fracturing engineering (Shi et al., 2019).
Currently, there are 2 main challenges in the description of shale gas fractures. Firstly, the prediction accuracy of natural fractures is still insufficient. Three-dimensional seismic data have the advantages of large coverage and high lateral resolution. For large-to medium-scale faults, manual interpretation can directly identify them, and conventional seismic attributes show various degrees of response. For the identification of medium-to small-scale natural fractures, methods and techniques that can reflect the abrupt change (discontinuity) of seismic reflection waveform are mainly used to carry out the work. However, limited by the quality and resolution of seismic data, there are challenges for more subtle fracture prediction. For fine- and micro-scale fractures, they can only be identified by core, imaging logging, conventional logging and other data. Obtaining such data is often costly and limited in quantity, making it challenging to perform three-dimensional description and prediction of micro-scale natural fractures. Therefore, how to make full use of 3D seismic data to improve the prediction accuracy of natural fractures has become a challenge. Secondly, there is currently no unified standard for the scale division for natural fractures. Classifications have been based on different perspectives depending on research needs. In geological research, faults/fractures are typically categorized into five grades based on their extension scale, depth, and location, taking into account structural control and sedimentation, namely, Grade I to Grade IV (Zhao et al., 2023). In geophysics, fractures are typically categorized as large, medium, or small based on their relationship with seismic wavelength (Wang et al., 2018; Chen et al., 2016). In shale fracture research, some scholars classify it according to measurement method and fracture size into three scales: large, medium and small, while others divide it into five scales: large, medium, small, fine and micro (Wu et al., 2015; Lyu et al., 2021; Zeng et al., 2021). The impact of faults/natural fractures on shale gas preservation and exploitation, as well as fracturing and construction, varies depending on their scale. Therefore, it is crucial to classify the fractures appropriately based on various engineering requirements and actual data.
Seismic prediction techniques for faults/natural fractures can be broadly divided into two categories: pre-stack prediction and post-stack prediction (Liang, 2019; Zhu, 2019; Xie et al., 2022). The former mainly utilizes difference in fast and slow transverse waves or the azimuthal anisotropy of longitudinal waves to predict the orientation, development and even the effectiveness of the fractures (Jiang et al., 2020; Zhou et al., 2020; Wang L. et al., 2021; Cui et al., 2022). It requires expensive 3D seismic acquisition and processing techniques, such as multi-wave and multi-component seismic data, as well as high-density and azimuth seismic data. The latter mainly utilizes post-stack 3D seismic attributes for fracture identification and prediction. However, due to the acquisition environments and cost limitations, the seismic data are mostly acquired in narrow azimuth. And ellipse fitting is not possible in narrow azimuth, making it challenging to perform pre-stack fracture prediction based on split azimuth. In general, the current seismic prediction methods for faults/natural fractures mainly rely on post-stack seismic data. For the identification of relatively larger scale faults, the commonly used seismic attributes include amplitude, coherence, variance, curvature, azimuth, instantaneous phase, Hilbert transform attribute and other attributes (Qi et al., 2017; Wen, 2020; Ojha et al., 2023). Additionally, there is increasing research using image recognition methods to enhance fault edge and identify faults, achieving good results (Hosseini-Fard et al., 2022; Mousavi et al., 2022). However, these attributes cannot quantitatively identify the development density and orientation of faults/fractures. Moreover, the identification ability of relatively smaller faults/fractures is more limited. The more sophisticated fracture prediction mainly relies on the edge enhancement detection technologies such as ant tracking. Ant tracking can not only predict relatively small-scale fractures, but also quantitatively analyze the development density and orientation of fractures, providing a solid data basement for fracture modeling. Conventional ant tracking is often based on full-frequency seismic data. As the requirement for fracture prediction accuracy increases, more and more researchers began to explore improved ant tracking technology, such as combining spectrum decomposition technique with ant tracking algorithm, and achieved better results (Huang et al., 2021; Yu et al., 2021; Wei et al., 2023).
In order to characterize the spatial distribution of natural fracture system in shale reservoirs, improve the accuracy of fracture prediction, and reasonably divide the scale of the natural fractures, multi-scale fracture prediction and multi-scale fracture modelling were carried out by using seismic attribute analysis techniques taking the H shale gas block of the Yangtze Plate as the research object. First, the relatively larger-scale faults were qualitatively interpreted using optimized seismic multi-attributes combined with manual interpretation, to establish a macroscopic understanding of regional tectonics. Secondly, the finer faults/fractures were predicted and quantitatively interpreted by ant-tracking attribute, to establish a microscopic understanding of regional fractures. Thirdly, the scales of ant tracking anomalies value are divided according to the comparison of ant tracking and discontinuity features of seismic sections. Finally, the divided ant tracking anomalies value is linearly converted into multi-scale fracture intensity. Based on this, the multi-scale discrete fracture modeling is carried out.
The assumption of the following methods is amplitude preservation processing of the seismic data. The noise suppression processing should meet the requirements of maintaining relatively amplitude, waveform, frequency, and phase. The amplitude compensation processing should also meet the requirement of maintaining relatively amplitude. For example, the amplitude curve before and after spherical diffusion compensation should maintain the corresponding amplitude relationship in the vertical direction.
The fundamental theory of variance error analysis employs local discontinuities between adjacent seismic traces to depict the lateral non-uniformity of stratigraphy, lithology, etc. It is particularly effective in identifying large-scale or large-fault-displacement faults. When faults exist in the subsurface, the reflection characteristics of these geological anomalies deviate from those in nearby seismic traces, resulting in local discontinuities in the traces. By scrutinizing the variance between seismic traces, it becomes feasible to detect faults or other anomalies (Li, et al., 2017; Wang et al., 2022a).
The algorithm of the variance body is is outlined as follows: Initially, the variance value for each sample point is computed, Subsequently, the required variance value is derived through weighted normalization with a specified. The variance volume is then calculated by utilizing the following equation, which yields the variance value for a sampling point (Eqs 1–6). Notably, the larger the variance, the smaller the similarity between adjacent traces.
In the formula,
The variance value of each sampling point throughout the whole 3D seismic data body is calculated according to the aforementioned formula, ultimately yielding a new 3D variance attribute body.
Curvature attribute is used to describe the degree of bending at a point on a curve or surface, whose mathematical definition is the ratio of angle to arc length change rate. It can be expressed using the second derivative of the point (Eq 7) (Cheng, 2020; Zhang et al., 2021).
For curvature calculations, least squares are typically used to fit a quadratic surface
Curvature attributes are applied to evaluate the pattern distribution of geological bodies in geometric space, enabling the effective identification of geometric structures such as faults, fractures, bends and folds (Yang et al., 2015; Zheng et al., 2019). Curvature has clear geological implications, as shown in Figure 1. When the stratum is horizontal or obliquely flat, the normal vectors of the stratum are parallel to each other and the curvature is zero. When the stratum is an anticline or uplifted, the normal vectors are divergent and the curvature is defined as positive. When the stratum is synclinal, the normal vectors are convergent and the curvature is defined as negative. The absolute value of curvature is small when the occurrence of seismic events is wide and gentle. On the contrary, it is large when the stratum occurrence changes dramatically. Currently, the curvature attribute has been widely recognized for its effectiveness in fault detection, tectonic morphology identification and fracture prediction. Curvature attributes mainly include minimum curvature, maximum curvature, principal curvature, most-positive curvature, most-negative curvature, dip curvature, strike curvature, curvedness and shape index.
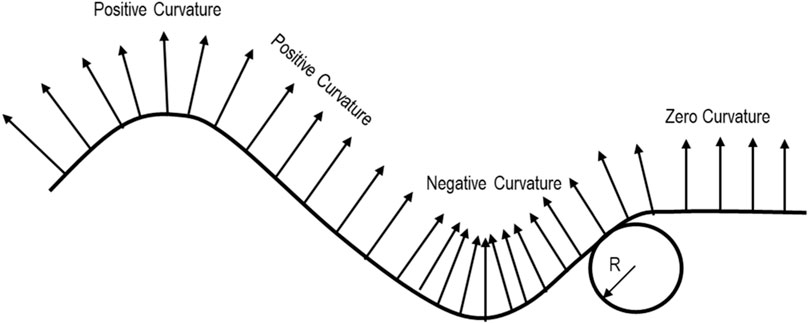
Figure 1. Geological meaning of curvature attribute.
From an image processing perspective, an edge corresponds to a reflection of the grayscale discontinuity of the image pixel. It is therefore defined as the pixel set, whose surrounding pixels have step changes or roof changes in grayscale. Image edges carry rich in information and serve as crucial feature parameters for geo-target recognition and image interpretation. The essence of edge detection lies in calculating and extracting the demarcation line between targets, as well as between targets and backgrounds by mathematical algorithms. The discontinuous features of seismic response, such as small fractures and lenticular body edges, are manifested in the image as edge features. Therefore, by employing edge detection technology, it becomes easier to discover and identify geological features, aiding geological interpretation.
The classical edge detection method typically uses the gradient operators. These operators detect the edge points based on the maximum of the first derivative or zero crossing of the second derivative, which has led to various differential operators, such as Sobel operator, Robert operator, Prewitt operator, and LOG operator. The Sobel operator is usually directional, meaning it can only detect vertical or horizontal edges, or both. The Prewitt operator is a directional operator (Zhang et al., 2018; Liu et al., 2019; Liu et al., 2022). When filtered with different directions of the Prewitt operator, it can produce edges with different directional. The LOG operator uses a Gaussian operator to smooth the original image before applying a Laplace operator. However, its detected zero-crossing does not always correspond to the edges one by one, leading to the possibility of pseudo-edges. The Robert edge detection operator uses local differences to identify edges, making it a typical operator for gradient edge detection. Its mathematical expression can be found in Eqs 9–11.
Where
The ant algorithm, first proposed by Italian scholar Colorni et al. (1992) in the early 1990s, is a heuristic bionic evolutionary algorithm based on population, which simulates the collective foraging behavior of ants in nature. To illustrate this principle, Colorni provided an example of an artificial ant algorithm, as shown in Figure 2. Point A represents the nest, point E represents the physical source, and HC represents the obstacle. The ants proceed from the nest to point B. Then, they can either pass through H or C to reach point D before finally reaching the food source. The distance from point B to point H is twice the distance from point B to point C, which is denoted as d. The ants will leave pheromones along their path. At the initial moment (t = 0), the ants will randomly choose a path to forage. From a statistical perspective, the number of ants on both paths is equal. However, after a certain time (t = 1), since the distance of path BHD is twice the distance of path BCD, the number of round trips of ants on path BCD is twice the number of round trips of ants on path BHD. Consequently, the amount of pheromones left behind is also twice. As a result, the number of ants choosing path BCD afterward will be twice the number of ants on BHD. Over time, an increasing number of ants will choose the path BCD to forage, thus achieving the objective of foraging in the shortest time.
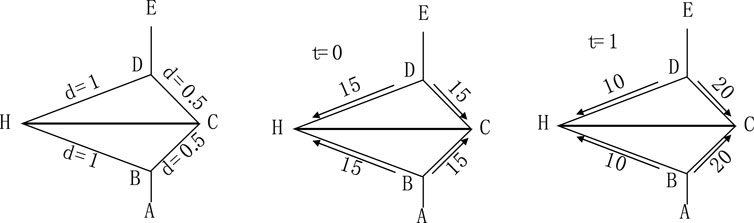
Figure 2. Schematic diagram of ant colony foraging.
SLB then applied “ant tracking” algorithm to the seismic attribute analysis in Petrel platfom. The ant tracking technique, utilizing this algorithm, automatically analyzes and identifies fracture systems, resulting in the generation of an ant-tracking attribute with clear fracture traces.
Although there are many seismic attributes conducive to fault edge enhancement, there are limitations. Each seismic attribute has its unique parameter characteristics and provides faults information from different perspectives, resulting in varying fault recognition effects in the same area. Additionally, seismic attributes are still facing a common problem in seismic interpretation known as multiplicity. To address the limitations and multiplicity of seismic attributes, the interpretation accuracy of seismic attributes can be improved through seismic attribute fusion technology (Li et al., 2017; Wang J. et al., 2021; Yue et al., 2022). The attribute fusion technology combines two or more attribute data using mathematical proportion operation, enabling the fused data to simultaneously display the characteristics and key information of different attributes at the same time. This approach avoids the limitations and multiplicity associated with single attribute interpretation (Chen et al., 2022), thereby enhancing the ability to extract geological information. Attribute fusion technology is generally categorized into linear fusion, nonlinear fusion, and color fusion. In this study, the attribute fusion method employed involves linear proportional fusion. The specific approach is as follows: first, select relatively sensitive seismic attributes; Next, through multiple attribute fusion experiments, determine the optimal linear fusion proportion; Finally, fuse the selected attributes by setting appropriate proportions.
Shale gas area block H is located in the Yangtze plate of China. After the formation of the Jinning movement, the Yangtze plate has successively undergone the transformation of Caledonian, Hercynian, Indosinian, Yanshanian and Himalayan tectonic movements, with multiple tectonic evolution stages such as passive continental margin basin, foreland basin and cratonic basin. During the late Ordovician and early Silurian, the convergence of the Cathaysian plate and the Yangtze plate was strengthened by the Caledonian movement, forming a series of ancient uplifts around the Yangtze block, such as Xuefeng uplift, central Sichuan uplift and central Guizhou uplift. With the exposure of sea level, the Yangtze area changed from a shallow shelf in the Middle Ordovician to a post-uplift detention basin surrounded by uplift. Between the alternation of Ordovician and Silurian, two large-scale global transgressions and multi-period volcanic activities occurred. The rise of sea level caused the formation of under-compensated and anoxic water environment, and the deposition of thick organic-rich shale (Chen et al., 2020; Wang et al., 2022b).
The existing cores and outcrops show that the thickness of the organic-rich black shale (TOC>2%) in H block is about 20 m, mainly located in the middle and upper part of the Wufeng formation and the bottom of the first member of the Longmaxi formation. The Wufeng formation mainly develops black siliceous shale, and thin dark gray shale at the bottom; The Longmaxi formation mainly develops black siliceous shale, gray mudstone and dark gray siltstone. They have high organic carbon content (3.2% on average) and good gas content (3.5 m3/t on average), which are the main target of shale gas exploration in the study area (Xu, 2020; Li et al., 2022). By well-seismic calibration, it was determined that the Longmaxi-Wufeng formation displayed as a set of relatively continuous strong seismic events on seismic data.
Previous studies have confirmed that the fractures in Yangtze area have the characteristics of multi-stage, multi-scale, multi-type and multi-strike (Xie et al., 2021; Chen et al., 2022; Xie et al., 2022). In order to clarify the fracture development of Block H, we applied the multi-scale fracture prediction workflow shown in Figure 3. All methods in the workflow are implemented on Petrel, which is a comprehensive geophysical and geological research platform. Longmaxi-Wufeng formation is the target formation.
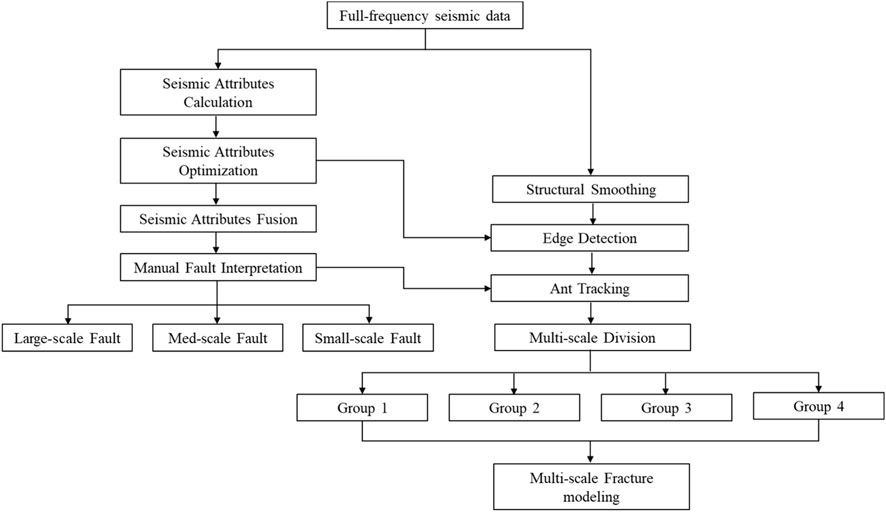
Figure 3. Workflow proposed in this study for multi-scale fracture prediction.
During the fault interpretation stage, various seismic attributes such as the RMS attribute, frequency attribute, variance attribute, maximum curvature attribute, and edge detection attribute are extracted along the layers to analyze and determine the developmental characteristics of medium- and large-scale faults in the study area.
The variance attribute can only reflect the development of some large-scale faults. Compared to other seismic attributes, it fails to capture certain fault responses by variance attribute. For example, near east-west trending fault group No. 1, whose imaging is unclear, making it difficult to discern the intersection relationship of the faults (Figure 4). On the other hand, the edge detection attribute and curvature are particularly responsive to faults. Such as faults No. 2, No. 3, and No. 4. In the variance attribute, these faults manifest as discontinuous breakpoints with unclear extension directions (Figure 4A). However, in edge detection attribute and curvature, these faults are clearly visible, greatly reducing the complexity of interpretation (Figure 4). However, the curvature attribute is very sensitive to small changes in seismic events, leading to many non-fault/fracture responses and a large amount of background noise (as shown in the noise area in Figure 4B). Edge detection attribute can produce a color thickening effect at the edge of the fault (as shown in the thickening area in Figure 4C), making faults appear less crisp and potentially misleading interpreters. Given the distinct characteristics and differences between these two attributes, their sensitivity to faults varies. Compared with the curvature attribute, some fault responses are more linear on the edge detection attribute plane, such as faults 2 and 3. While, some faults are more crisp in curvature, such as fault 4.
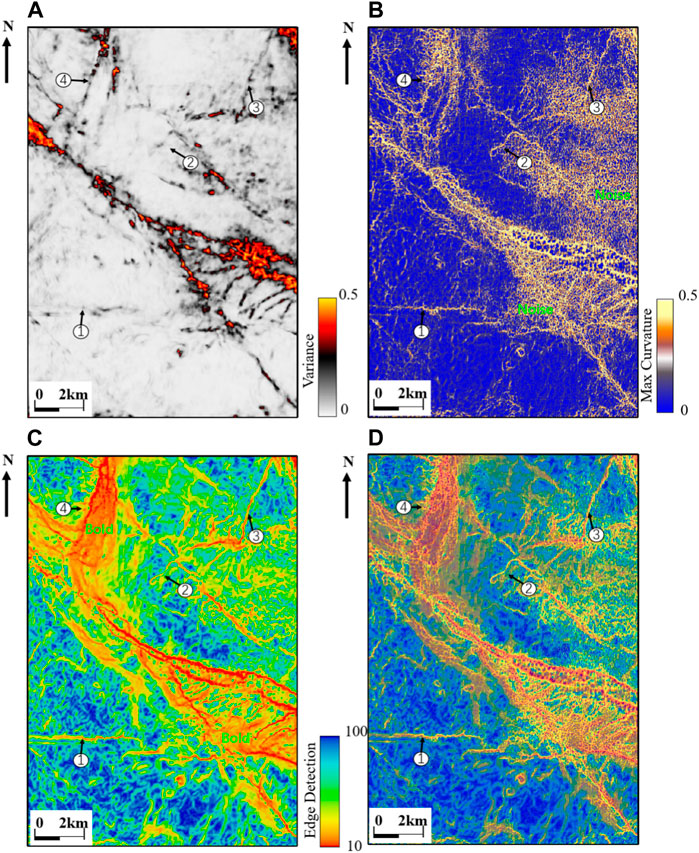
Figure 4. Various seismic attributes along Longmaxi-Wufeng formation. (A) Variance attribute. (B) Max curvature. (C) Edge detection attribute. (D) Fusion map combining max curvature and edge detection attribute.
After comprehensively considering the advantages and disadvantages of each attribute, the curvature and edge detection attributes were selected for attribute fusion as they are more effective in fault identification. By fusing these attributes, the result (Figure 4D) are obtained that combines the advantages of both attributes. For example, No. 2, No. 3, and No. 4 faults are more clearly displayed, reducing noise of curvature and the fault-thickening effect of edge detection attribute.
The fused seismic attributes effectively provide a macroscopic understanding of the faults in the area, indicating the fault orientation and the intersection relationship between the faults for fault interpreters. By combining seismic sections for manual fault interpretation, we effectively reduced the multiplicity of fault interpretation.
According to commonly used fracture scale division rules (Wu et al., 2015; Lyu et al., 2021) and different fault controlling effect in the study area, we divided the interpreted faults into three levels. Figure 5 shows the manually interpreted fault polygons of the high-quality shale in the Longmaxi-Wufeng formation of the study area. In the figure, red fault polygons indicate large-scale faults with extensions greater than 3 km and fault displacement greater than 40 m, with strong seismic reflection strength. They are the main controlling faults in the study area. Blue fault polygons indicate faults with an extension length of hundreds of meters to a few kilometers and fault displacement greater than 10 m. They are secondary-order faults. Green fault polygons indicate faults with an extension length of tens to hundreds of meters and no obvious fault displacement, but small faults with apparently reduced torsion or amplitude in the same seismic events are visible (Table 1). It can be observed that the main fault strikes are NW and NE, and some of them are near EW and near NS.
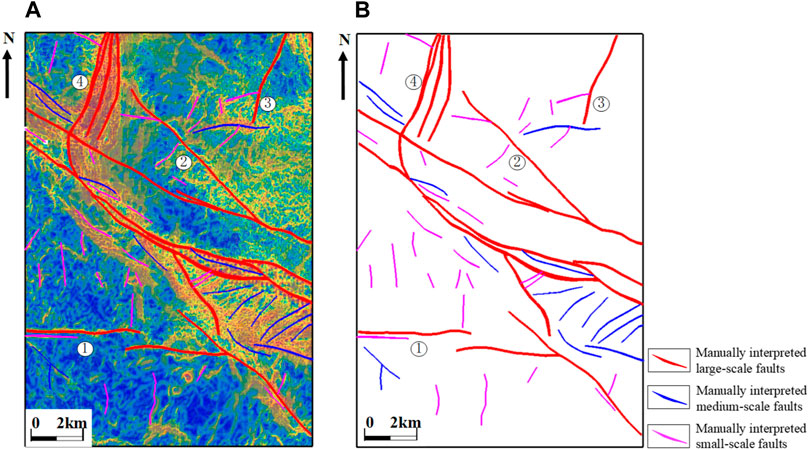
Figure 5. Manual fault polygons along Longmaxi-Wufeng formation. (A) Overlayed map with Fusion map by Max curvature and edge detection attribute. (B) Manual fault polygons.
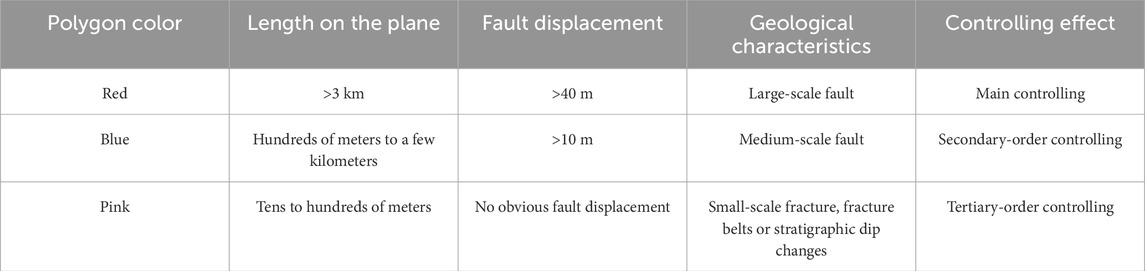
Table 1. Manual multi-scale fault interpretation table.
The ant tracking method used in the study is based on a published paper (Xie et al., 2022), which has been demonstrated to effectively enhance the accuracy of fracture identification. Unlike the traditional ant tracking based on full-frequency seismic volume, the method utilizes frequency-division seismic data. Through experimentation, we have found that dividing the frequency into four or more parts not only increases the workload significantly but also leads to the loss of a considerable amount of effective fracture information due to the excessively narrow frequency bands. Therefore, we believe that dividing the frequency into low, medium, and high components using a step size of 15 Hz aligns with our work experience and avoids both the loss of valuable information and excessive workload. Therefore, the full-frequency seismic volume was divided into low-frequency (0–15 HZ), medium-frequency (15–30 Hz), and high-frequency (30–45 Hz) cubes. Ant tracking calculations were then conducted on the frequency-division data and full-frequency data, respectively. The better ant tracking results were selected through a comparative analysis. Finally, they were fused to obtain the final fracture prediction result. Using the method, more continuous, sharper, and smaller-scale fractures were detected, effectively improving the fracture prediction.
It is important to acknowledge that the detection direction of fractures and faults is crucial, as it can impact the accuracy and reliability of the prediction. Based on existing research and the results of manual fault interpretation, we found that the majority of fractures and faults in this area are highly dipping, exceeding 45°. We also observed that the strike includes northwest, north-northwest, northeast, and near-south-north directions, with a wide range of strike distribution. Therefore, when performing ant tracking, we excluded dip angles between 0°–30° but did not make any additional exclusions for strike direction. The specific direction of fracture detection is presented in Figure 6.
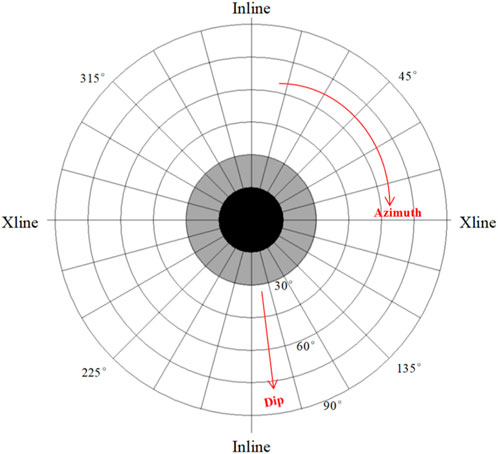
Figure 6. Stereonet of ant tracking for Orientation Filter (Black-gray represents exclusion, and white represents participation in the calculation).
Compared to the ant tracking result obtained from the full-frequency data (Figure 7A), the ant tracking outcomes derived from medium- and high-frequency (Figures 7B, C) demonstrate greater continuity and effectiveness in locating little fractures (as exemplified by the fracture marked by the red arrow). After fusing the ant tracking results from both medium- and high-frequency, a more comprehensive and precise fracture detection was achieved (Figure 7D).
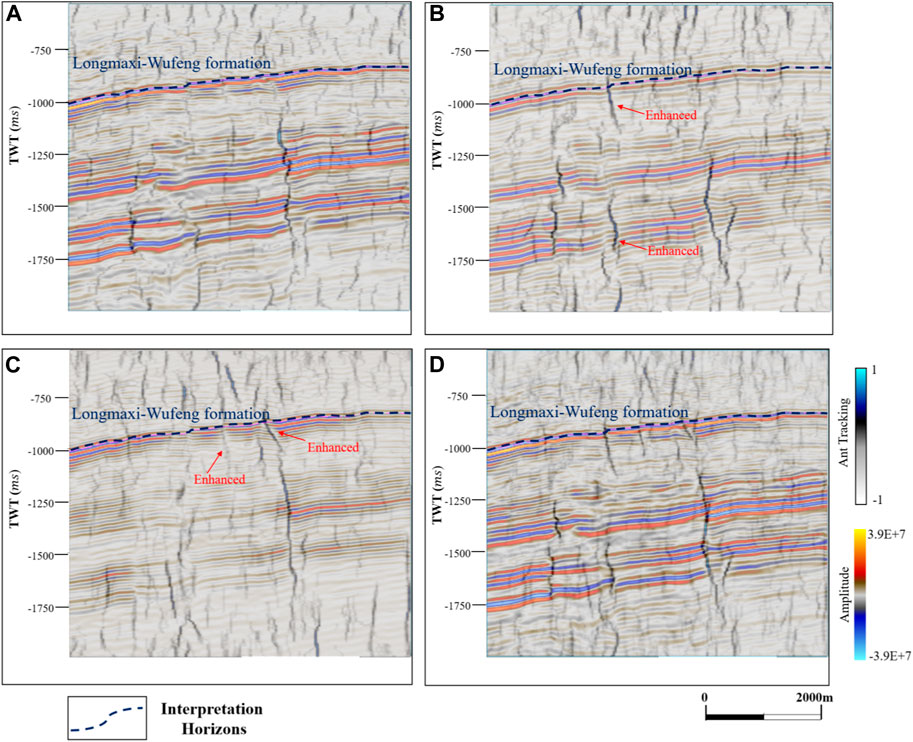
Figure 7. Ant tracking result superimposed on seismic section (modified from Xie et al., 2022). (A) Full frequency. (B) 15–30 Hz. (C) 30–45 Hz (D) fused by 15–30 Hz and 30–45 Hz.
Figure 8B illustrates the attribute distribution of the fused ant tracking along the Longmaxi-Wufeng formation. Compared with to the full-frequency ant tracking in Figure 8A, the implementation of the divided-frequency ant tracking reveals a higher number of fractures. Additionally, certain fractures identified through this method exhibit longer extension lengths, sharper edges and better continuity compared to those detected using the original full-frequency ant tracking. To verify the accuracy of fracture predictions obtained through ant tracking, fracture information from the only well drilled in the area was employed. Analysis of this data reveals that the predicted fracture trend around the H1 well primarily aligns in the NE and NW directions, which is consistent with the fracture orientations observed in the well data (Figure 9). This consistency serves as robust validation of the accuracy and reliability of the ant tracking technique in predicting fracture orientations.
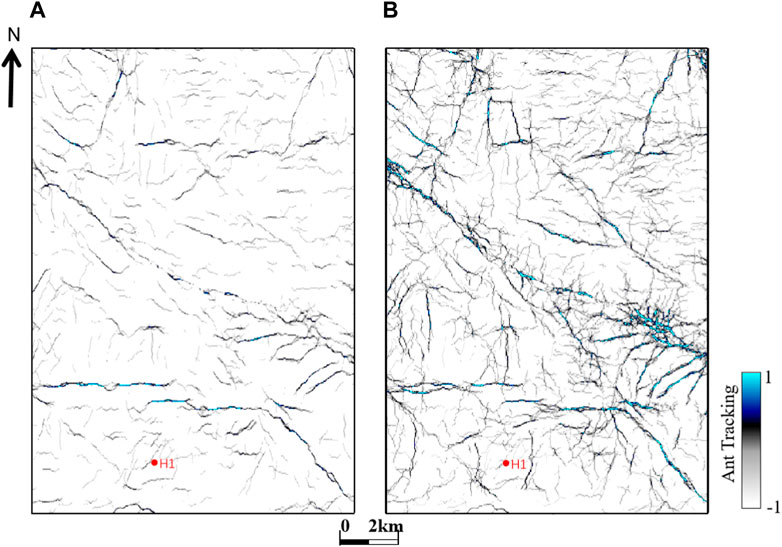
Figure 8. Ant tracking slices along Longmaxi-Wufeng formation. (A) Full frequency. (B) Fused 15–30 Hz and 30–45 Hz.
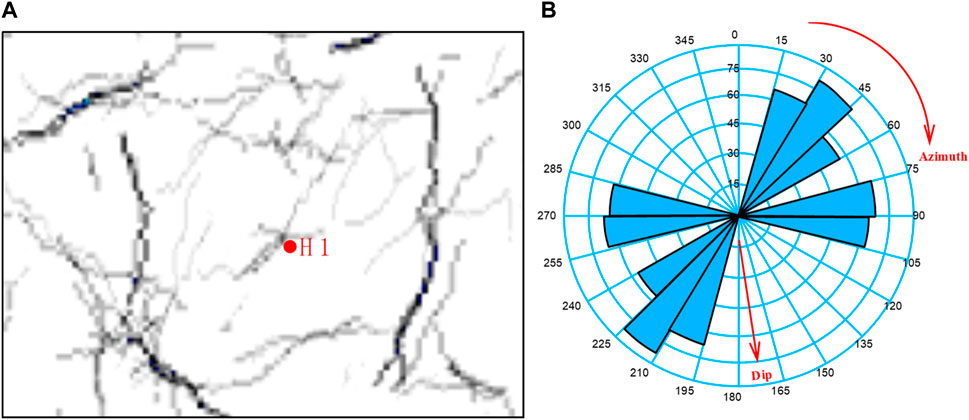
Figure 9. Fracture information of Wufeng formation around H1. (A) Ant tracking. (B) Rose diagram of H1.
To establish a correspondence between the fault/fracture scale and ant tracking attributes’ abnormal value, a comparison between the ant tracking attribute and the manual fault interpretation was conducted. The specific approach involved overlaying the ant tracking attribute with the seismic sections (Figure 10)., as well as overlaying the ant tracking attribute extracted along the Longmaxi-Wufeng formation with the manually interpreted faults for display (Figure 11).
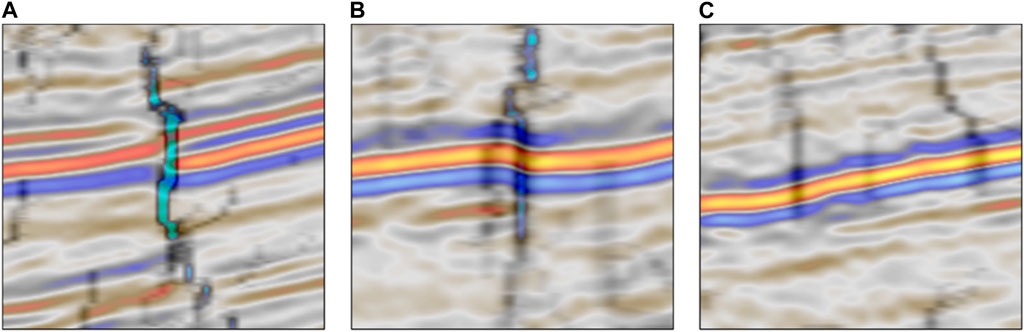
Figure 10. Superimposed display of ant tracking and seismic data. (A) Strong ant tracking: big fault with obvious fault displacement. (B) Medium-strong ant tracking: medium fault/fracture belt with small fault displacement. (C) Weak ant tracking: possible fracture belt or small-scale fracture.
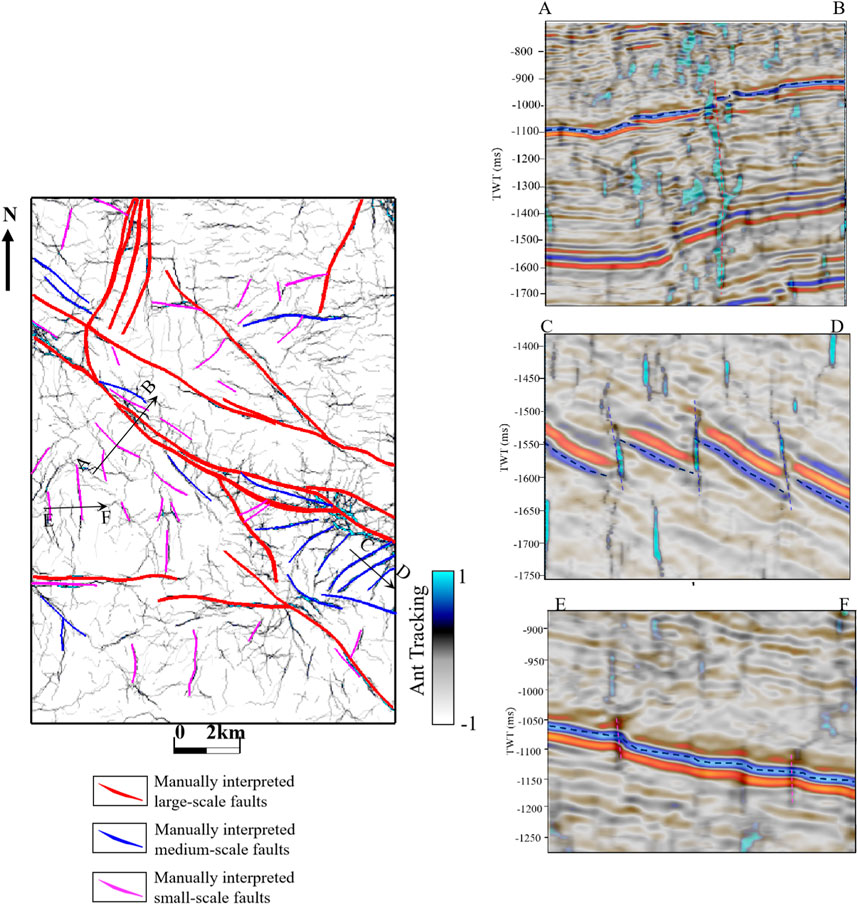
Figure 11. Superimposed map of ant tracking slice and manually interpreted faults along Longmaxi-Wufeng formation The (A,B) seismic section demonstrates large-scale fault (red) with large ant tracking anomaly value, medium-large displacement, and long planar extension. The (C,D) seismic section shows medium-scale faults (blue) with medium-strong ant tracking anomaly value, medium displacement, and moderate planar extensions. The (E,F) seismic section demonstrates small-scale faults (pink) with small ant tracking anomaly value, almost no displacement, and short planar extensions.
It can be seen that, due to the limitation of seismic data resolution, it is challenging to identify individual faults or microfracture of 1–10 m fault displacement on the seismic section. However, there is a distinct impedance interface with good continuity between the Wufeng high-quality shale section and the underlying limestone, there are still changes in reflection energy, abrupt dip, curvature, and instantaneous phase. Therefore, fault or fracture belt with fault displacement below 10 m doesn’t cause the dislocation of seismic events, but are generally weakly distributed in the ant tracking (Figure 10A). For faults with a fault displacement of more than 10 m, they often show relatively strong abnormal values on ant tracking (Figures 10B, C).
Comparing ant tracking anomalies with seismic interpreted faults, we observed that the ant-tracking result shows 3 levels of intensity and continuity. Firstly, strong anomalies with strong continuity generally correspond to manually interpreted large-scale faults (depicted by red line in Figures 10A, 11). Secondly, strong to medium anomalies with strong to medium continuity correspond to manually interpreted medium-scale faults (depicted by blue line in Figures 10B, 11). Thirdly, weak anomalies with weak continuity generally correspond to small fractures, fracture belts or zones of stratigraphic dip changes (depicted by pink line in Figures 10C, 11). The characteristics of the ant tracking anomalies were summarized in Table 2.
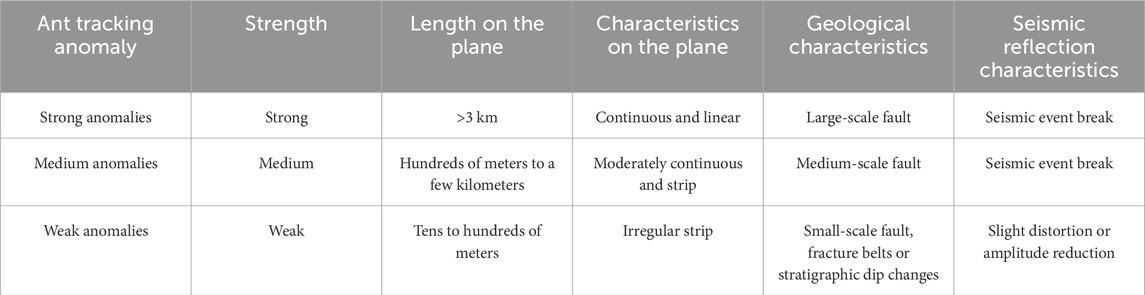
Table 2. The characteristics of the ant tracking anomalies.
The discrete fracture network model establishes fracture slices with varying sizes, orientations and shapes to more accurately represent the actual size and distribution of fractures in a high-resolution, unstructured manner. The focus of discrete fracture network modeling is to build models of different scales of faults, natural fracture belts, small-scale fractures, etc. The required input data include fracture intensity, orientation, dip angle, extension length and height (Zhang et al., 2016; Dong et al., 2018; Liu et al., 2018).
In the previous section, by combining ant tracking and faults interpretation, it was observed that the size of ant tracking abnormal value corresponded to different natural fracture scales (Table 2). In this study, the ant tracking body was taken as the input data and transformed into an attribute body with comparable fracture intensity through a linear transformation. Subsequently, based on the relationship of Table 2, as well as combined with the distribution characteristics of ant tracing value (Figure 12), considering the distribution range of ant tracking, fault distribution patterns, and seismic response magnitude, the ant tracking value was further divided into four groups (Table 3).
Group 1 corresponds to large-to medium-scale faults. Controlled by regional tectonic movement, they can extend for several kilometers. In the seismic sections, one or more seismic events are interrupted, making them easy to judge and interpret manually. They generally have a destructive effect on shale reservoirs and are not conducive to the preservation of shale gas, thus should be avoided as much as possible during well placement.
Group 2 corresponds to the small-scale faults, extending from a few tens to hundreds of meters in the plane. In the seismic sections, the seismic events show a change in occurrence (distortion) or amplitude (weakening). They can be visible but easily overlooked, becoming more evident after ant tracking than the original seismic sections. These small-scale faults including fracture belts have an important influence on shale gas engineering construction. Firstly, their presence affects the stability of the wellbore. When drilling and geological steering are carried out, wellbore collapse or mud losses may occur if shear slip occurs in the small-scale faults or the fracture belts. Secondly, during the process of fracturing reconstruction, small-scale faults or the fracture belts will affect the efficiency of fracturing and the fractures expansion of hydraulic fracturing, leading to casing deformation risk, difficulty in sand addition and other issues.
Group 3 corresponds to fine-scale fault or extension of fracture belts, controlled by faults and small folds, with length about tens meters. They are not visible on seismic data, but can be observed in imaging log data and core data.
Group 4 corresponds to micro-scale fractures with length of a few meters. These features are difficult to manually distinguish manually on seismic data. They can increase the storage space for shale gas and are beneficial for increasing shale gas production. Their spatial distribution is difficult to detect, which can be characterized by stochastic modeling when modelling.
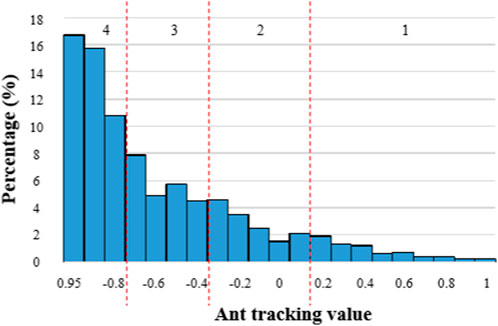
Figure 12. Ant tracking value histogram.
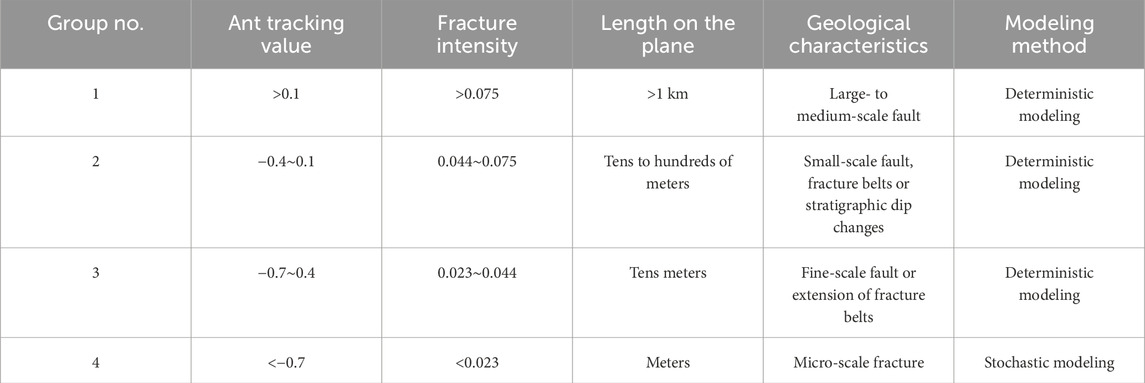
Table 3. The characteristics of the ant tracking anomalies.
Through statistics (Figure 13A), based on the fault orientation derived from seismic attributes, manually interpreted fault orientation and natural fracture orientation observed through ant-tracking attributes (Figure 11), the main orientation of natural fractures in the study area is NW, NE and NS, with a small proportion of EW orientation. The main dip angle ranges between 45–90°, with the majority exceeding 60° (Figure 13B). The measurement of the fracture extension length in the outcrop area reveals that most fractures extend for less than 100 m (Mu et al., 2009). Therefore, in the discrete fracture network, the length of fracture slices was set to range from 0 to 100 m to meet the requirements of the simulation, with an average length of 50 m (Figure 13C) and a ratio of fracture slice length to height of 2:1.
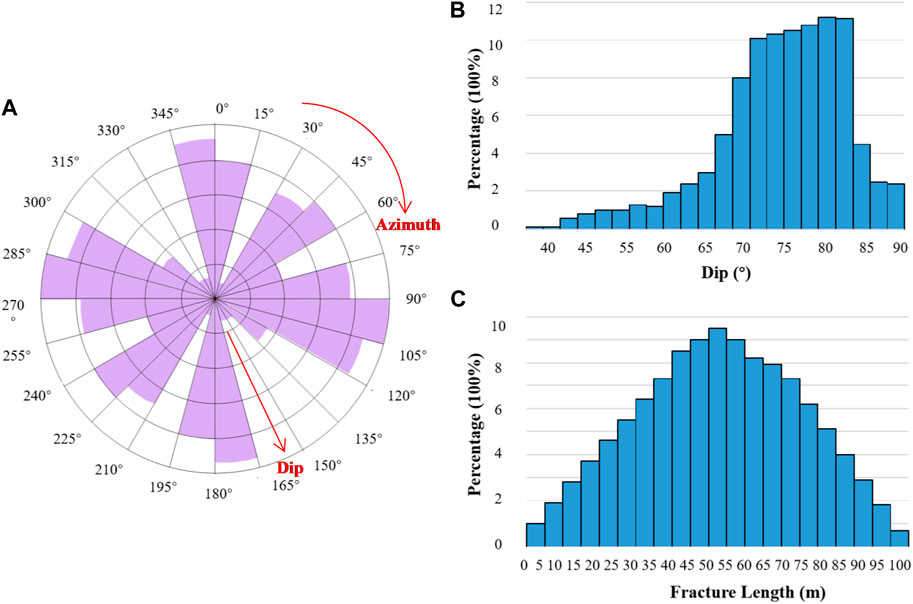
Figure 13. Fracture statistical chart. (A) Dip azimuth stereogram; (B) Dip histogram; (C) Fracture length histogram.
When performing multi-scale fracture modeling, four groups of fracture intensity listed in Table 3 were utilized as spatial constraints. Based on the general experience in the industry (Dong et al., 2018), the shape of the fracture slice was represented by a rectangular shape and the size was described by a normal distribution. Group 1, 2, and 3 were modeled by using deterministic modeling, while the group 4 was modeled by using stochastic modeling. Ultimately, four separate discrete fracture networks were modeled at different scales (Figure 14). Figure 14A represents the fracture model for group1, corresponding to large-to medium-scale faults. Figure 14B corresponds fracture model for group 2, representing small-scale faults or fracture belts. Figure 14C represents fracture model for group 3, corresponding to fine-scale fault or extension of fracture belts. Figure 14D is fracture model for group 4, corresponding to micro-scale fractures. Figure 14E displays the DFN with multi-scale fractures.
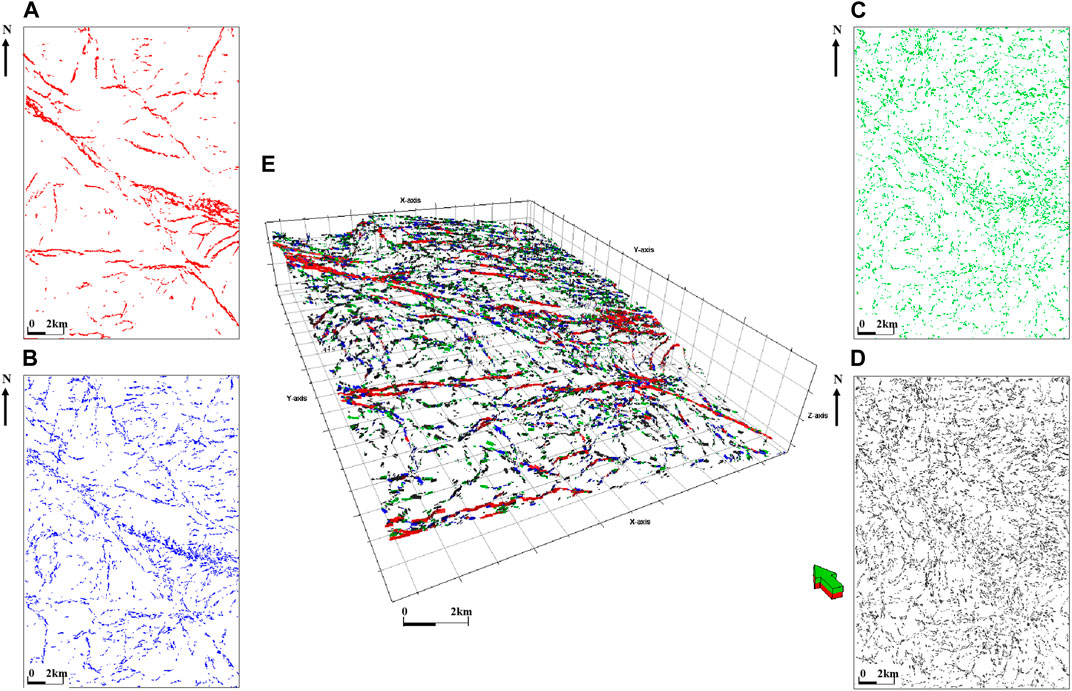
Figure 14. Multi-scale fracture modelling for Longmaxi-Wufeng formation. (A) Fracture model for Group 1. (B) Fracture model for Group 2. (C) Fracture model for Group 3. (D) Fracture model for Group 4. (E) Fracture model of multi-scale fractures for Longmaxi-Wufeng formation.
There hasn’t been a unified multi-scale division standard on multi-scale fracture prediction. The method used in this paper is a combination of manual fault interpretation, seismic multi-attribute extraction and fusion technique, improved ant tracking technique and multi-scale fracture modeling. This approach has established a comprehensive prediction workflow, progressing from large-scale to small-scale analysis, and shifting from qualitative to quantitative assessment. The innovation of this paper lies in the quantitative multi-scale division of fracture using ant tracking value, which is different from other papers and provides a solid data basis for fracture modeling. The significance of refined fault/fracture description in the form of multi-scale is shown in two aspects.
First of all, traditional seismic attributes are used to represent the development of large-scale faults. Combined with manual fault interpretation, we can easily gain a macro understanding of structural development. Subsequently, the ant tracking attribute is effective in refining small-scale fault/fractures and fracture belts. Finally, image logging, core slice, or electron microscopy (if available) is employed to describe micro-scale fractures. Refined fault/fracture description in the form of multi-scale realizes the progressive understanding of fracture from macro to micro.
The establishment of natural fracture models with different scales utilizes mutually independent fracture groups. The mechanical properties of fractures at different scales vary, thus their impacts on drilling and completion engineering are also distinct, which can be applied in independently different scenarios. For instance, due to the large fault displacement of group 1 and 2, horizontal wells should not directly cross them during well location arrangement and construction. Fracture groups 3 and 4 may pose risks to drilling and completion engineering. During the engineering implementation, attention should be paid to determining the risk control plan in advance to avoid wellbore collapse, mud leakage, casing deformation risks, complexities in sand addition, and other problems.
Although each group of fracture models is independent, they form an integral whole and can be used together. The collective model can be utilized for subsequent geomechanical modeling, predicting the stability of natural fractures, studying the impact of natural fractures on hydraulic fracturing, and simulating the relationship between natural fractures and hydraulic fracturing fractures.
The relationship between traditional seismic attributes and ant tracking attributes is closely related. It is mainly shown in the following two aspects.
The conventional workflow can be divided into 3 main activities: 1) Seismic conditioning. Typically, the original full-band seismic data is processed or conditioned using techniques such as structural smoothing, with the fault edge preservation option; 2) Edge detection attribute. Attributes like variance cube, chaos, curvature or others are generated to highlight the discontinuities. 3) Edge enhancement. The ant tracking algorithm utilizes optimized seismic attributes to generate an enhanced ant cube This enhanced cube is then used for further analysis or visualization. The third point shows the input data for ant tracking is from the optimized seismic attributes. When comparing the seismic attributes like variance volume, maximum curvature and edge detection mentioned in the study, it was found that the latter two attributes provide more detailed fault information, they also contain a significant amount of unfiltered noises and pseudo fault information. Therefore, the input data of ant tracking in this study is variance attribute volume (Xie et al., 2022).
From the superimposed map with ant tracking and variance attribute (Figure 15), it was observed that there is a commonality between the abnormal values of variance attribute and ant tracking attribute. Firstly, they can basically coincide. Secondly, where the abnormal value of variance attribute is strong, the value of ant tracking is also strong. Similarly, weak values are synchronized. However, the fractures detected by the ant tracking attribute appear to be more linear and sharper than those detected by the variance attribute, and the intersection relationship between the fractures is clearer. Furthermore, the number of fractures reflected by ant tracking is far greater than that detected by the variance attribute.
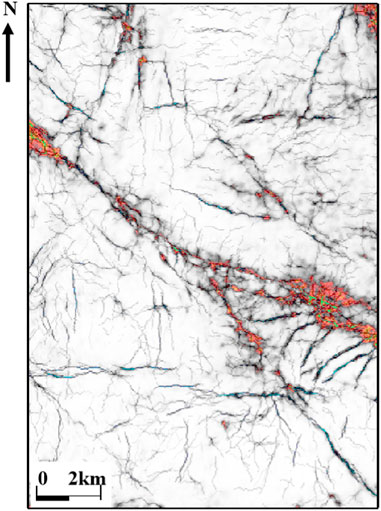
Figure 15. Superimposed map of ant tracking slice and variance attribute along Longmaxi-Wufeng formation.
One of the main limitations is the lack of a clear quantitative standard for scale division. The thresholds of ant tracking value were semi-quantitatively determined by the fracture morphology, length, distribution, and other conditions, which were used to further divide the fracture scales. Howerver, there is no clear quantitative division standard. To address this limitation, future research should focus on exploring clear quantitative standards for scale division.
Another limitation of the ant tracking method is the lack of sufficient well data to calibrate and verify the accuracy. The accuracy of this method requires calibration and verification with more well data, otherwise there is a risk of false detection or misinterpretation of fracture patterns. If there is more well data, it is more conducive to improving the accuracy of fracture predicting.
A third limitation is the reliance on personal experience in completing the entire method. The completion of the entire method relies on the experience of geophysical researchers, which is highly subjective. For example, in the step of edge detection, multiple attributes need to be optimized, which requires researchers to have a good understanding of seismic attributes and fracture morphology.
In this study, the multi-scale fracture description method using seismic attributes was applied to predict and model multi-scale fractures in the study area. Four conclusion are listed below.
(1) Firstly, considering the varying impacts of fractures at different scales on drilling and completion engineering, it is necessary to identify a method to classify fractures at different scales. Therefore, we utilized ant tracking values to classify fractures across multiple scales and subsequently performed multi-scale modeling. Secondly, in order to classify fractures at different scales, we needed to identify a method with high prediction accuracy. Hence, we chose the ant tracking method for fracture prediction. Compared to fracture prediction using variance attribute, curvature, edge detection attribute, and other attributes, this method enhances the prediction accuracy of medium-small scale fractures and detects more fractures. Furthermore, compared to traditional single-group fracture modeling, this method divides fractures into four groups for separate fracture modeling, which is more aligned with engineering needs.
(2) The strike of faults/fractures in the area primarily trends NW, NE and nearly NS, with a small amount of nearly EW trending faults/fractures are also present. Among them, the NW-trending major faults run through the entire study area. With the NW-trending major faults as the boundary, NW and NE trending faults are primarily developed on the eastern side, and nearly EW and nearly NS trending faults are mainly developed on the western side.
(3) This study has established a well-ordered and stepwise multi-scale refined fracture description process. Initially, the traditional seismic attributes were utilized to identify large-scale faults and establish a macro structural understanding. Subsequently, the ant tracking attribute was utilized to track and identify relatively small-scale faults/fractures, rendering faults/fractures more linear and precise. Finally, the ant tracking attribute values were grouped into four categories, and the discrete fracture modeling was carried out by multi-scale.
(4) An improved ant tracking method based on frequency-filtering seismic data was proposed to enhance the accuracy of fracture detection. More continuous, sharper. This method allowed for the detection of more continuous, sharper, and smaller-scale fractures compared to those detected using traditional full-band seismic data.
The original contributions presented in the study are included in the article/Supplementary material, further inquiries can be directed to the corresponding author.
QX: Conceptualization, Data curation, Funding acquisition, Investigation, Methodology, Project administration, Software, Supervision, Writing–original draft, Writing–review and editing. JC: Resources, Visualization, Writing–review and editing. CZ: Project administration, Resources, Writing–review and editing. QL: Formal Analysis, Resources, Supervision, Writing–review and editing. SG: Methodology, Writing–review and editing. JW: Methodology, Writing–review and editing.
The author(s) declare financial support was received for the research, authorship, and/or publication of this article. Supported by Fujian Provincial Natural Science Foundation of China (NO. 2023J05053) and Research Initiation Fund of Fujian University of Technology (No. GY-Z220225).
Authors CZ, QL, SG, and JW were employed by Schlumberger China.
The remaining authors declare that the research was conducted in the absence of any commercial or financial relationships that could be construed as a potential conflict of interest.
All claims expressed in this article are solely those of the authors and do not necessarily represent those of their affiliated organizations, or those of the publisher, the editors and the reviewers. Any product that may be evaluated in this article, or claim that may be made by its manufacturer, is not guaranteed or endorsed by the publisher.
Chen, G. S., Xie, Q. H., Wu, J. F., Zhao, C. D., Xu, E. S., Pan, Y. W., et al. (2022). Comprehensive application of the seismic multi-attribute technique combination in the tectonic interpretation of the Luzhou shale gas block. Geophys. Geochem. Explor. 46 (6), 1349–1358. doi:10.11720/wtyht.2022.1575
Chen, L., Chen, X. H., Zhang, B. M., Zhang, G. T., Li, H., Lv, R., et al. (2020). Reservoir characteristics and brittleness evaluation of Wufeng formation-Longmaxi formation shale in yichang area, western hubei province. Bull. Geol. Sci. Technol. 39 (2), 54–61. doi:10.19509/j.cnki.dzkq.2020.0206
Chen, S. Q., Zeng, L. B., Huang, P., Sun, S. H., Zhang, W. L., and Li, X. Y. (2016). The application study on the multi-scales integrated prediction method to fractured reservoir description. Appl. Geophys. 13 (1), 80–92. doi:10.1007/s11770-016-0531-7
Cheng, Y. (2020). Application of small-scale curvature in small and micro-structure interpretation of coal field. Coal Geol. Explor. 48 (01), 203–207. doi:10.3969/j.issn.1001-1986.2020.01.027
Cherny, S., Esipov, D., Kuranakov, D., Lapin, V., Chirkov, D., and Astrakova, A. (2017). Prediction of fracture initiation zones on the surface of three-dimensional structure using the surface curvature. Eng. Fract. Mech. 172, 196–214. doi:10.1016/j.engfracmech.2016.12.023
Chopra, S., and Marfurt, K. J. (2020). Adopting multispectral dip components for coherence and curvature attribute computations. Lead. Edge 39 (8), 593–596. doi:10.1190/tle39080593.1
Colorni, A., Dorigo, M., and Maniezzo, V. (1992). “Distributed optimization by ant colonies,” in First European conference on artificial life, 134–142.
Cui, G., Li, X. R., Wang, J. J., Yang, Y. Y., Guo, Y. T., and Xiao, X. (2022). Quantitative prediction to fractured reservoir in buried hill based on pre-stack amplitude azimuthal anisotropy. Mar. Geol. Front. 38 (10), 59–68. doi:10.16028/j.1009-2722.2021.331
Dong, S. Q., Zeng, L. B., Xu, C. S., Cao, H., Wang, S., Lu, W., et al. (2018). Some progress in reservoir fracture stochastic modeling research. Oil Geophys. Prospect. 53 (3), 625–641. doi:10.13810/j.cnki.issn.1000-7210.2018.03.023
Fan, C. H., Nie, S., Li, H., Radwan, A. E., Pan, Q., Shi, X., et al. (2024). Quantitative prediction and spatial analysis of structural fractures in deep shale gas reservoirs within complex structural zones: a case study of the Longmaxi Formation in the Luzhou area, southern Sichuan Basin, China. J. Asian Earth Sci. 263, 106025. doi:10.1016/j.jseaes.2024.106025
He, X., Chen, G. Sh., Wu, J. F., Liu, Y., Wu, Sh., Zhang, J., et al. (2022). Deep shale gas exploration and development in the southern sichuan Basin: new progress and challenges. Nat. Gas. Ind. 42 (8), 24–34. doi:10.3787/j.issn.1000-0976.2022.08.003
Hosseini-Fard, E., Roshandel-Kahoo, A., Soleimani-Monfared, M., Khayer, K., and Ahmadi-Fard, A. R. (2022). Automatic seismic image segmentation by introducing a novel strategy in histogram of oriented gradients. J. Petroleum Sci. Eng. 209, 109971. doi:10.1016/j.petrol.2021.109971
Huang, W., Zhou, J., Gao, L. J., Wang, S. L., and Yan, H. T. (2021). The application of frequency division ant tracking based on synchronous extrusion improvement of short time Fourier transform in crack detection. Geophys. Geochem. Explor. 45 (4), 432–439. doi:10.11720/wtyht.2021.1022
Jiang, X. Y., Zhang, Y., Gan, L. D., Song, T., Du, W. h., and Zhou, X. Y. (2020). Seismic techniques for predicting fractures in granite buried hills. Oil Geophys. Prospect. 55 (3), 694–704. doi:10.13810/j.cnki.issn.1000-7210.2020.03.026
Khayer, K., Roshandel Kahoo, A., Soleimani Monfared, M., Tokhmechi, B., and Kavousi, K. (2022). Target-Oriented fusion of attributes in data level for salt dome geobody delineation in seismic data. Nat. Resour. Res. 31 (5), 2461–2481. doi:10.1007/s11053-022-10086-z
Li, F. Y., Lyu, B., Qi, J., Verma, S., and Zhang, B. (2021). Seismic coherence for discontinuity interpretation. Surv. Geophys. 42, 1229–1280. doi:10.1007/s10712-021-09670-4
Li, H. (2023a). Coordinated development of shale gas benefit exploitation and ecological environmental conservation in China: a mini review. Front. Ecol. Evol. 11, 1232395. doi:10.3389/fevo.2023.1232395
Li, H. (2023b). Deciphering the formation period and geological implications of shale tectonic fractures: a mini review and forward-looking perspectives. Front. Energy Res. 11, 1320366. doi:10.3389/fenrg.2023.1320366
Li, Q. C., Guo, L., Sun, Y. C., Zhuang, Y., Song, J. C., and Yang, R. (2017). Seismic attributes fusion and its research in predicting thickness of coal. Prog. Geophys. 32 (5), 2014–2020. doi:10.6038/pg20170521
Li, X. M., Wang, Y. R., Lin, W., Ma, L. H., Liu, D. X., Liu, J. R., et al. (2022). Micro-pore structure and fractal characteristics of deep shale from Wufeng formation to Longmaxi formation in jingmen exploration area, hubei province. Nat. Gas. Geosci. 33 (4), 629–641. doi:10.11764/j.issn.1672-1926.2021.11.011
Liang, Z. (2019). Poststack seismic prediction techniques for fractures of different scales. Geophys. Prospect. Petroleum 58 (5), 766–772. doi:10.3969/j.issn.1000-1441.2019.05.016
Liu, C. Q., Song, J. T., and Xue, M. X. (2022). Application of edge detection technology in sand connectivity research. Prog. Geophys. 37 (2), 0844–0850. doi:10.6038/pg2022EE0330
Liu, X. W., Liu, Y. W., Liu, Z. Y., Liu, J., Huo, Z. Z., and Qian, K. R. (2018). Seismic prediction of natural fractures in series of shale oil reservoirs. Geophys. Prospect. Petroleum 57 (4), 611–617. doi:10.3969/j.issn.1000-1441.2018.04.016
Liu, X. T., Zhou, X. F., Liu, C. Q., and Wu, R. (2019). Accurate boundary recognition research of central volcanic conduit: an example from Bohai A oilfield. Prog. Geophys. 34 (1), 342–346. doi:10.6038/pg2019BB0362
Lyu, W. Y., Zeng, L. B., Chen, S. Q., Lyu, P., Dong, S. Q., Hui, C., et al. (2021). Characterization methods of multi-scale natural fractures in tight and low- permeability sandstone reservoirs. Geol. Rev. 67 (2), 543–556. doi:10.16509/j.georeview.2021.02.020
Ma, Y. X., Li, H. L., Liu, K. Y., Gu, H. M., and Ren, H. (2020). Application of an ant-tracking technique based on spectral decomposition to fault characterization. Geophys. Prospect. Petroleum 59 (2), 258–266. doi:10.3969/j.issn.1000-1441.2020.02.012
Mousavi, J., Radad, M., Soleimani Monfared, M., and Roshandel Kahoo, A. (2022). Fault enhancement in seismic images by introducing a novel strategy integrating attributes and image analysis techniques. Pure Appl. Geophys. 179 (5), 1645–1660. doi:10.1007/s00024-022-03014-y
Mu, L. X., Zhao, G. L., Tian, Z. Y., Yuan, R. E., Xu, A. Z., et al. (2009). Reservoir fracture prediction. Beijing: Petroleum Industry Press, 32–36.
Ojha, M., Shankar, U., and Ghosh, R. (2023). Gas hydrates, subsurface structures and tectonic features of the tuaheni landslide complex in the northern hikurangi margin, New Zealand, revealed by seismic attribute analysis. J. Mar. Sci. Eng. 11 (7), 1359. doi:10.3390/jmse11071359
Qi, J., Li, F. Y., and Marfurt, K. (2017). Multi azimuth coherence. Geophysics 82 (6), 83–89. doi:10.1190/geo2017-0196.1
Shan, S. C., Wu, Y. Z., Fu, Y. K., and Zhou, P. H. (2021). Shear mechanical properties of anchored rock mass under impact load. J. Min. Strata Control Eng. 3 (4), 043034. doi:10.13532/j.jmsce.cn10-1638/td.20211014.001
Shi, X. W., Tong, Y. M., Liu, W. P., Zhao, C. D., Liu, J., Fang, J., et al. (2019). Analysis of seismic scale fracture system of shale reservoir and its petroleum significance: a case study of well Ning 201area of Changning Block, Sichuan Basin. Mar. Orig. Pet. Geol. 24 (4), 87–96. doi:10.3969/j.issn.1672-9854.2019.04.009
Sun, J. C., and Liu, J. M. (2018). Countermeasures to promote the development of China’s shale gas industry. China Min. Mag. 27 (8), 70–73. doi:10.12075/j.issn.1004-4051.2018.08.025
Wang, C., Dong, T., Jiang, S., Zhang, Y. Y., Yang, L. Q., Liang, X., et al. (2022b). Vertical heterogeneity and the main controlling factors of the upper ordovician-lower silurian wufeng-longmaxi shales in the middle Yangtze region. Bull. Geol. Sci. Technol. 41 (3), 108–121. doi:10.19509/j.cnki.dzkq.2021.0053
Wang, C. Q., Wang, M. H., Zhou, J. Y., Wang, S. L., Yang, Z. P., Liu, H., et al. (2022a). Application of multi⁃attribute fusion in quantitative prediction of reservoirs: a case study of Yangshuiwu buried hill in Langgu sag. Geophys. Geochem. Explor. 46 (1), 87–95. doi:10.11720/wtyht.2022.2371
Wang, J., and Wang, X. L. (2021). Seepage characteristic and fracture development of protected seam caused by mining protecting strata. J. Min. Strata Control Eng. 3 (3), 033511. doi:10.13532/j.jmsce.cn10-1638/td.20201215.001
Wang, J., Zhang, J., and Wu, G. (2021). Wide-azimuth Young’s modulus inversion and fracture prediction: an example of H structure in Bozhong sag. Oil Geophys. Prospect. 56 (3), 593–602. doi:10.13810/j.cnki.issn.1000-7210.2021.03.018
Wang, L., Shen, J. S., Zou, R., Lin, X. M., Xu, Z. X., Su, Z. Y., et al. (2021). Evaluation of fracture belts and optimization of borehole tracks in carbonate formations through information fusion of seismic attributes and electric image well logging. J. Jilin Univ. 51 (2), 607–623. doi:10.13278/j.cnki.jjuese.20200007
Wang, L., Wei, J., Huang, P., Di, B. R., and Zhang, F. H. (2018). Seismic prediction method of multiscale fractured reservoir. Appl. Geophys. 15 (2), 240–252. doi:10.1007/s11770-018-0667-8
Wei, H., Wang, Y. J., Zhou, H. L., and Wang, X. (2023). Application of frequency division ant tracking technology Based on Sparse Bayesian in fracture characterization. Comput. Tech. Geophys. Geochem. Explor. 45 (02), 192–201. doi:10.3969/j.issn.1001-1749.2023.02.08
Wen, Y. L. (2020). Research methods of different levels of reservoirs based on seismic data. Earth Sci. 9 (2), 61–64. doi:10.11648/j.earth.20200902.12
Wu, Q., Liang, X., Xian, C. G., and Li, X. (2015). Geoscience-to-production integration ensures effective and efficient south China marine shale gas development. China Pet. Explor. 20 (4), 1–23. doi:10.3969/j.issn.1672-7703.2015.04.001
Xie, Q. H., Jiang, L. W., Zhao, C. D., Wang, Z. D., Tang, X. H., and Luo, Y. F. (2021). Application study of improving the precision of the ant-tracking-based fracture prediction technique. Geophys. Geochem. Explor. 45 (5), 1295–1302. doi:10.11720/wtyht.2021.1208
Xie, Q. H., Zhao, C. D., Rui, Z. F., Guan, S., Zheng, W., and Fan, H. (2022). An improved ant-tracking workflow based on divided-frequency data for fracture detection. J. Geophys. Eng. 19 (5), 1149–1162. doi:10.1093/jge/gxac075
Xu, S. L. (2020). Geological characteristics of Longmaxi formation shale reservoir and “sweet spot layers” optimization in Jingmen area. Unconv. Oil Gas 7 (5), 21–31. doi:10.3969/j.issn.2095-8471.2020.05.005
Xu, Z. Y., Liang, X., Lu, H. L., Zhang, J. H., Shu, H. L., Xu, Y. J., et al. (2019). Structural deformation characteristics and shale gas preservation conditions in the zhaotong national shale gas demonstration area along the southern margin of the sichuan basin. Nat. Gas. Ind. 39 (10), 22–31. doi:10.3787/j.issn.1000-0976.2019.10.003
Yang, G. Q., Liu, Y. L., and Zhang, H. W. (2015). The calculation method of curvature attributes and its effect analysis. Prog. Geophys. 30 (5), 2282–2286. doi:10.1190/segam2015-5853793.1
Yu, Y., Yang, G. G., Lv, Y., Peng, Y., Fang, P. C., Huang, P., et al. (2021). An integrating technology of ant tracking and frequency division and its application to interpretation on low-order fault: examples from Xujiahe tight sandstone gas reservoirs, Zhongtaishan area, Sichuan Basin. Nat. Gas Explor. Dev. 44, 100–106. doi:10.12055/gaskk.issn.1673-3177.2021.04.013
Yue, D. L., Li, W., Du, Y. S., Hu, G. Y., Wang, W. F., Wang, W. R., et al. (2022). Review on optimization and fusion of seismic attributes: for fluvial reservoir characterization. Earth Sci. 47 (11), 3929–3943. doi:10.3799/dqkx.2022.221
Zeng, L., Lyu, W., Zhang, Y., Liu, G., and Dong, S. (2021). The effect of multi-scale faults and fractures on oil enrichment and production in tight sandstone reservoirs: a case study in the southwestern ordos basin, China. Front. Earth Sci. 9 (2), 94. doi:10.3389/feart.2021.664629
Zhang, H. X., Wang, C., Liu, X., Shen, K. Y., Fu, X. J., Wang, X. H., et al. (2018). Image edge detection algorithm and its new development. Comput. Eng. Appl. (in Chinese) 54 (14), 11. doi:10.3778/j.issn.1002-8331.1804-0205
Zhang, J. F., Xu, H., Zhou, Z., Ren, P. F., Guo, J. Z., and Wang, Q. (2019). Geological characteristics of shale gas reservoir in Yichang area, western Hubei. Acta Petrolei Sinica 40 (8), 887–899. doi:10.7623/syxb201908001
Zhang, J. Y., Fan, T. E., Wang, H. F., Zhang, X. W., Du, X., et al. (2021). Application of curvature attributes to fluvial reservoirs discontinuity detection. Geophysical and Geochemical Exploration 45 (2), 450–457. doi:10.11720/wtyht.2021.1079
Zhang, Y. C., Yin, T. J., and Zhou, W. (2016). The fracture modeling in the constraint of ant tracking attribute. Journal of Yangtze University (Natural Science Edition) 13 (14), 16–21. doi:10.3969/j.issn.1673-1409(s).2016.14.004
Zhao, X. Y., You, Y. C., Hu, X. Y., Li, J. R., and Li, Y. (2023). Classified-staged-grouped 3D modeling of multi-scale fractures constrained by genetic mechanisms and main controlling factors: a case study on biohermal carbonate reservoir of the Upper Permian Changxing Fm. in Yuanba area, Sichuan Basin. Oil and Gas Geology. 44 (01), 213–225. doi:10.11743/ogg20230118
Zheng, J. J., Yin, X. Y., and Zhang, G. Z. (2019). Multi-scale analysis technique based on curvelet transform. Oil Geophys. Prospect. 44 (5), 543–547. doi:10.3321/j.issn:1000-7210.2009.05.004
Zhou, W. B., Zhang, Z. Q., Xu, S. J., Wu, Y. X., Zhang, B., and Yang, S. D. (2022). Exploration and development prospects of shale gas resources: a case study of Sichuan Basin 44 (10), 125–132. doi:10.19389/j.cnki.1003-0506.2022.10.020
Zhou, X. Y., Gan, L. D., Yang, H., Wang, H., and Jiang, X. Y. (2020). A joint inversion method using amplitude and velocity anisotropy. Oil Geophysical Prospecting 55 (5), 1084–1091. doi:10.13810/j.cnki.issn.1000-7210.2020.05.016
Keywords: multi-scale, seismic attributes, variance attribute, ant tracking, fracture model
Citation: Xie Q, Chen J, Zhao C, Li Q, Guan S and Wang J (2024) Application of seismic attribute analysis techniques to multi-scale natural fractures description: a case study of the Longmaxi-Wufeng formation in H shale gas block, Yangtze plate, China. Front. Earth Sci. 12:1361706. doi: 10.3389/feart.2024.1361706
Received: 26 December 2023; Accepted: 08 April 2024;
Published: 03 May 2024.
Edited by:
Xintong Dong, Jilin University, ChinaReviewed by:
Hu Li, Southwest Petroleum University, ChinaCopyright © 2024 Xie, Chen, Zhao, Li, Guan and Wang. This is an open-access article distributed under the terms of the Creative Commons Attribution License (CC BY). The use, distribution or reproduction in other forums is permitted, provided the original author(s) and the copyright owner(s) are credited and that the original publication in this journal is cited, in accordance with accepted academic practice. No use, distribution or reproduction is permitted which does not comply with these terms.
*Correspondence: Qinghui Xie, cWluZ2h1aXhpZUBzaW5hLmNvbQ==
Disclaimer: All claims expressed in this article are solely those of the authors and do not necessarily represent those of their affiliated organizations, or those of the publisher, the editors and the reviewers. Any product that may be evaluated in this article or claim that may be made by its manufacturer is not guaranteed or endorsed by the publisher.
Research integrity at Frontiers
Learn more about the work of our research integrity team to safeguard the quality of each article we publish.