 Zhen Li1,2
 Weichao Tian
94% of researchers rate our articles as excellent or good
Learn more about the work of our research integrity team to safeguard the quality of each article we publish.
Find out more
ORIGINAL RESEARCH article
Front. Earth Sci., 15 February 2024
Sec. Geochemistry
Volume 12 - 2024 | https://doi.org/10.3389/feart.2024.1361052
This article is part of the Research TopicUnconventional Resources: Provenance Analysis, Sediment Transport, Reservoir Evaluation, Geo-energyView all 29 articles
The pore structure and its heterogeneity of tight reservoirs are key factors affecting the storage and percolation of crude oil. The pore system of Chang 7 tight sandstone has multi-scale and multi-type characteristics. However, the contribution of different pore types and pore sizes to the physical properties of Chang 7 tight sandstone is still unclear. In this paper, we collected a suite of Chang 7 tight sandstones to investigate the full-scale pore structure and fractal characteristics by casting thin section, field emission scanning electron microscope, two-dimensional multi-scale backscattered scanning electron microscopy, N2 adsorption (NA) and NMR. The pore diameters of Chang 7 tight sandstone are usually distributed between 0.001 and 20 μm. Intercrystalline pores are mainly distuibuted <500 nm. Dissolution pores vary from 100 nm to 100 μm. Residual intergranular pores range from 1 μm to 40 μm. Based on the fractal characteristics, pore system is divided into macropores (mainly >300 nm), mesopores (mainly 7–300 nm), and micropores (mainly <7 nm). Micropores are adsorb-fluid pores that do not contribute to the storage and percolation but contribute significantly to contrasting specific surface area. Mesopores represent bound-fluid pores and only contribute to total porosity but not to permeability. Macropores represent movable-fluid pores, contributing to both porosity and permeability. The content and heterogeneity of macropores control the quality of Chang 7 tight sandstone. When macropore volume is >12×10−3 mL/g, the continuous percolation network consists entirely of macropores, resulting in higher porosity and permeability of the reservoir. Moreover, reservoir physical properties show excellent correlation with macropore heterogeneity. These results demonstrate that the content and heterogeneity of macropores are key indicators indicating the quality of the Chang 7 tight sandstones.
Tight oil, as an important unconventional oil and gas resource, is changing the World Energy Pattern. The U.S. is currently the most successful country in tight oil exploration and development. In 2022, U.S. tight oil production will reach 7.5 million barrels per day (IEA, 2023). Influenced by the successful development of tight oil in the U.S., China has vigorously strengthened the evaluation and exploration of tight oil and achieved important breakthroughs in recent years. In 2019, PetroChina Changqing Oilfield Company discovered more than 1 billion tons of shale oil (or tight oil) reserves in the Chang 7 formation of the Longdong area from the Ordos Basin (Fu et al., 2021). The period of the Chang 7 Member was the maximum lake flooding period, and a set of organic-rich mudstone-shale inter-calated with silt/fine sandstone sedimentary combination was deposited. Tight oil (shale oil) occurring in interlayered silt/fine sandstone is the most realistic exploration and development target in the Chang 7 Member (Fu et al., 2020). The porosity of interlayered silt/fine sandstone is mostly less than 11%, and the permeability is mostly less than 0.3 mD, belong to a typical tight reservoir (Lai et al., 2016; Fu et al., 2021; Wen et al., 2022). Characterizing the full-scale pore structure of Chang 7 tight sandstone and clarifying the relationship between different pore sizes and physical properties are important for understanding reservoir quality and seepage mechanism. However, the pore structure of Chang 7 tight sandstone is characterized by wide pore size distribution, diverse types and strong nonuniformity, which increases the difficulty of comprehensively characterizing its pore structure and heterogeneity. Furthermore, the relationships between different pore sizes and the physical properties of Chang 7 tight sandstone is still unclear.
It is of great significance to study the contribution of different pore sizes and different pore types to the physical properties of tight reservoirs. According to the characteristics of the mercury intrusion curve, Sakhaee-Pour and Bryant (2014) divides the pores into intergranular pores and treelike pores, and stated that recovery has a significant positive correlation with treelike pore content. Xi et al. (2016) considered that the permeability is dominated by larger pore-throats. Xiao et al. (2017a) believed that nanopores contribute to both permeability and porosity, micropores mainly control permeability, and mesopores mainly contribute to porosity. Tian et al. (2020) indicated that fluid mobility is controlled by the content of intergranular pores in low-permebility conglomerate. Therefore, the research results of different scholars are quite different. To understand the contribution of different pore sizes to the physical properties of Chang 7 tight sandstone, we must first classify the pore sizes. Many scholars have confirmed that the pore system of rocks has multi-segment fractal characteristics (Lai and Wang, 2015; Zhang L. et al., 2017; Xiao et al., 2017b; Shao et al., 2017; Xu et al., 2018; Wang et al., 2020; Zheng et al., 2023). Therefore, we can utilize the fractal characteristics of full-scale pore structures for pore classification.
Since different experiments have certain limitations in characterizing the pore structure, researchers have tried to combine multiple experiments to characterize the full-scale pore structure of porous media. The full-scale pore-throat structure of tight sandstones was acquired by integrating the rate-controlled mercury injection (RMI) and high-pressure mercury injection (HPMI) experiments (Xi et al., 2016). Zhang et al. (2018) and Zhang et al. (2020) utilized gas adsorption and HPMI experiments to characterize the full-scale pore structure of shale. Zhang et al. (2017b) and Gao et al. (2019) characterized the full-scale pore structure of tight reservoir by combining N2 adsorption (NA) and HPMI experiments. In addition, NMR is often used in conjunction with other experiments such as mercury intrusion and NA to investigate the full-scale pore structure in tight sandstones (Xiao et al., 2017b; Zhang et al., 2017c; Dong et al., 2019; Tian et al., 2019; Wu et al., 2019). However, different experiments have different pore hypothesis models. NA, HPMI and NMR usually assume that the pores are cylinders, while RMI assumes that the pores are spherical. Meanwhile, the information detected by NA and NMR includes both pores and throats, while HPMI only obtains the size of the throat and the corresponding pore volume. Therefore, it is unreasonable to combine NA and HPMI or to combine HPMI and RMI or to combine HPMI and NMR to obtain the full-scale pore structure.
In this work, casting thin section (CTS), field emission scanning electron microscope (FE-SEM), Two-dimensional multi-scale backscattered scanning electron microscopy (2D-MS-BSEM), NA, NMR and physical property were performed on the Chang 7 tight sandstones to reveal the full-scale pore structure and fractal characteristics. Then the multi-scale pores were classified. Moreover, the contribution of different pore scales to physical properties was investigated.
We selected 11 typical wells for core observations of Chang 7 Member and collected forty-five fine-grained sandstone samples. Cylindrical cores with a diameter of approximately 2.5 cm were drilled parallel to the lamination for all samples. Prior to the experiments, we clean the cores with distilled water to remove the drilling mud. Then the cores were placed in a Soxhlet extractor for 7 days and a mixed solvent of dichloromethane and methanol (9:1 v/v) was used to remove the residual oil in the cores. Finally, a series of experiments were conducted, including physical properties analysis, X-ray diffraction (XRD) analysis, CTS, FE-SEM, NA and NMR experiments.
The helium porosity was measured on a PDP-200 Porosimetry Instrument without a confining pressure. The permeability measurements were performed on a KA-210 permeability instrument under a confining pressure of 200 psi and a gas pressure of 30 psi. The experimental process complies with the Chinese Oil and gas industry standard SY/T 6385-2016.
XRD analysis was performed using the Bruker AXS D8 Discover X-ray diffractometer according to the Chinese Oil and gas industry standard SY/T 5163–2018. The sample is crushed and ground to obtain a powder for mineral content analysis. The mineral content of the whole rock and the relative contents of clay minerals were determined.
Samples were observed using a CIAS-2007 Rock Casting Image Analyzer following the SY/T6103- 2004. Thin sections were impregnated with blue epoxy resin for easy visualization of pores.
Before FE-SEM, the samples were prepared with a length, width and height of 1 cm × 1 cm × 0.5 cm, respectively. An argon ion beam was used to polish the observation surface. Then, SEM tests were performed on a Quanta 450 field emission scanning electron microscope following the GB/T 16594-2008. Moreover, the magnification of view field ranges from 100× to 100000×.
4–10 g powdered samples were subjected to N2 adsorption on an ASAP 2460 physisorption instrument. The relative pressure (P/P0) varies from 0.01 to 0.995. The detail of NA experiments refer to Tian et al. (2019). The pore size distribution (PSD) and specific surface area (SSA) of pore in the range of 1–200 nm can be quantitatively analyzed using the data from adsorption branch based on BJH and BET models.
Transverse relaxation (T2) analyses were carried out on a MesoMR23-060H-1 instrument manufactured by Suzhou Niumag Analytical Instrument Corporation (China). Moreover, two sets of T2 analysis were measured on the tight sandstones: (1) dried state, (2) water-saturated state. The T2 spectra of the dried state are used as the background signal, and the T2 spectra of the water-saturated state are used to analyze the full-scale PSD. The corresponding parameters were set as: Tw, 4000 ms; TE, 0.08 ms; NECH, 10000; NS, 32.
Two-dimensional multi-scale backscattered scanning electron microscopy (2D-MS-BSEM) was carried out using Helios NanoLab 650. The 2D-MS-BSEM has a resolution of 25 nm. Quantitative evaluation of minerals by scanning electron microscopy (Qemscan) was performed on an Qemscan 650F. Qemscan has a resolution of 2 μm. The scanning areas of 2D-MS-BSEM and Qemscan are about 4 mm × 4 mm.
The reservoir quality of Chang 7 sandstone is quite poor, showing the characteristics of tight reservoirs (Zou et al., 2012). Helium porosity of 45 selected samples varies from 1.10% to 11.12% (average of 6.86%). Permeability is in the range of 0.0013–0.1040 mD. There is a weak positive relationship between permeability and porosity, with a correlation coefficient (R2) of 0.45 (Figure 1A; Table 1).
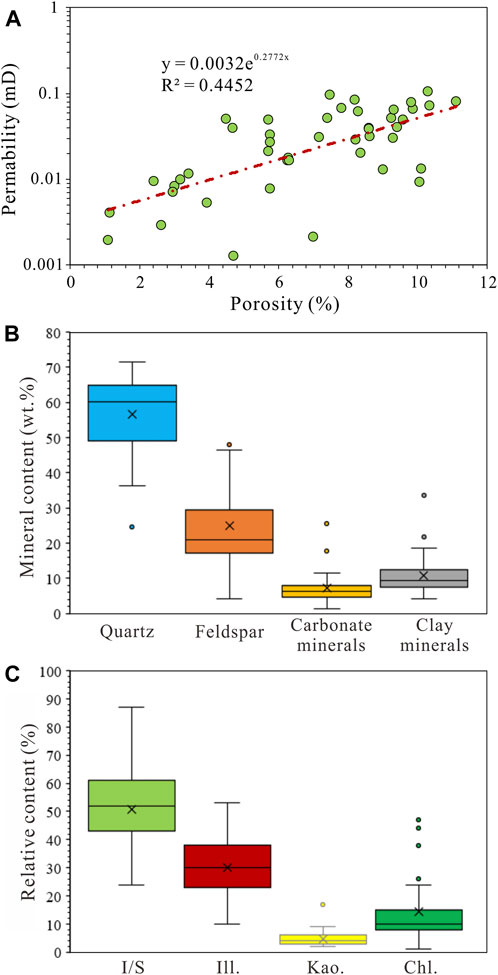
FIGURE 1. (A) the relationship between permeability and porosity, (B) whole-rock results, and (C) the relative contents of clay minerals.
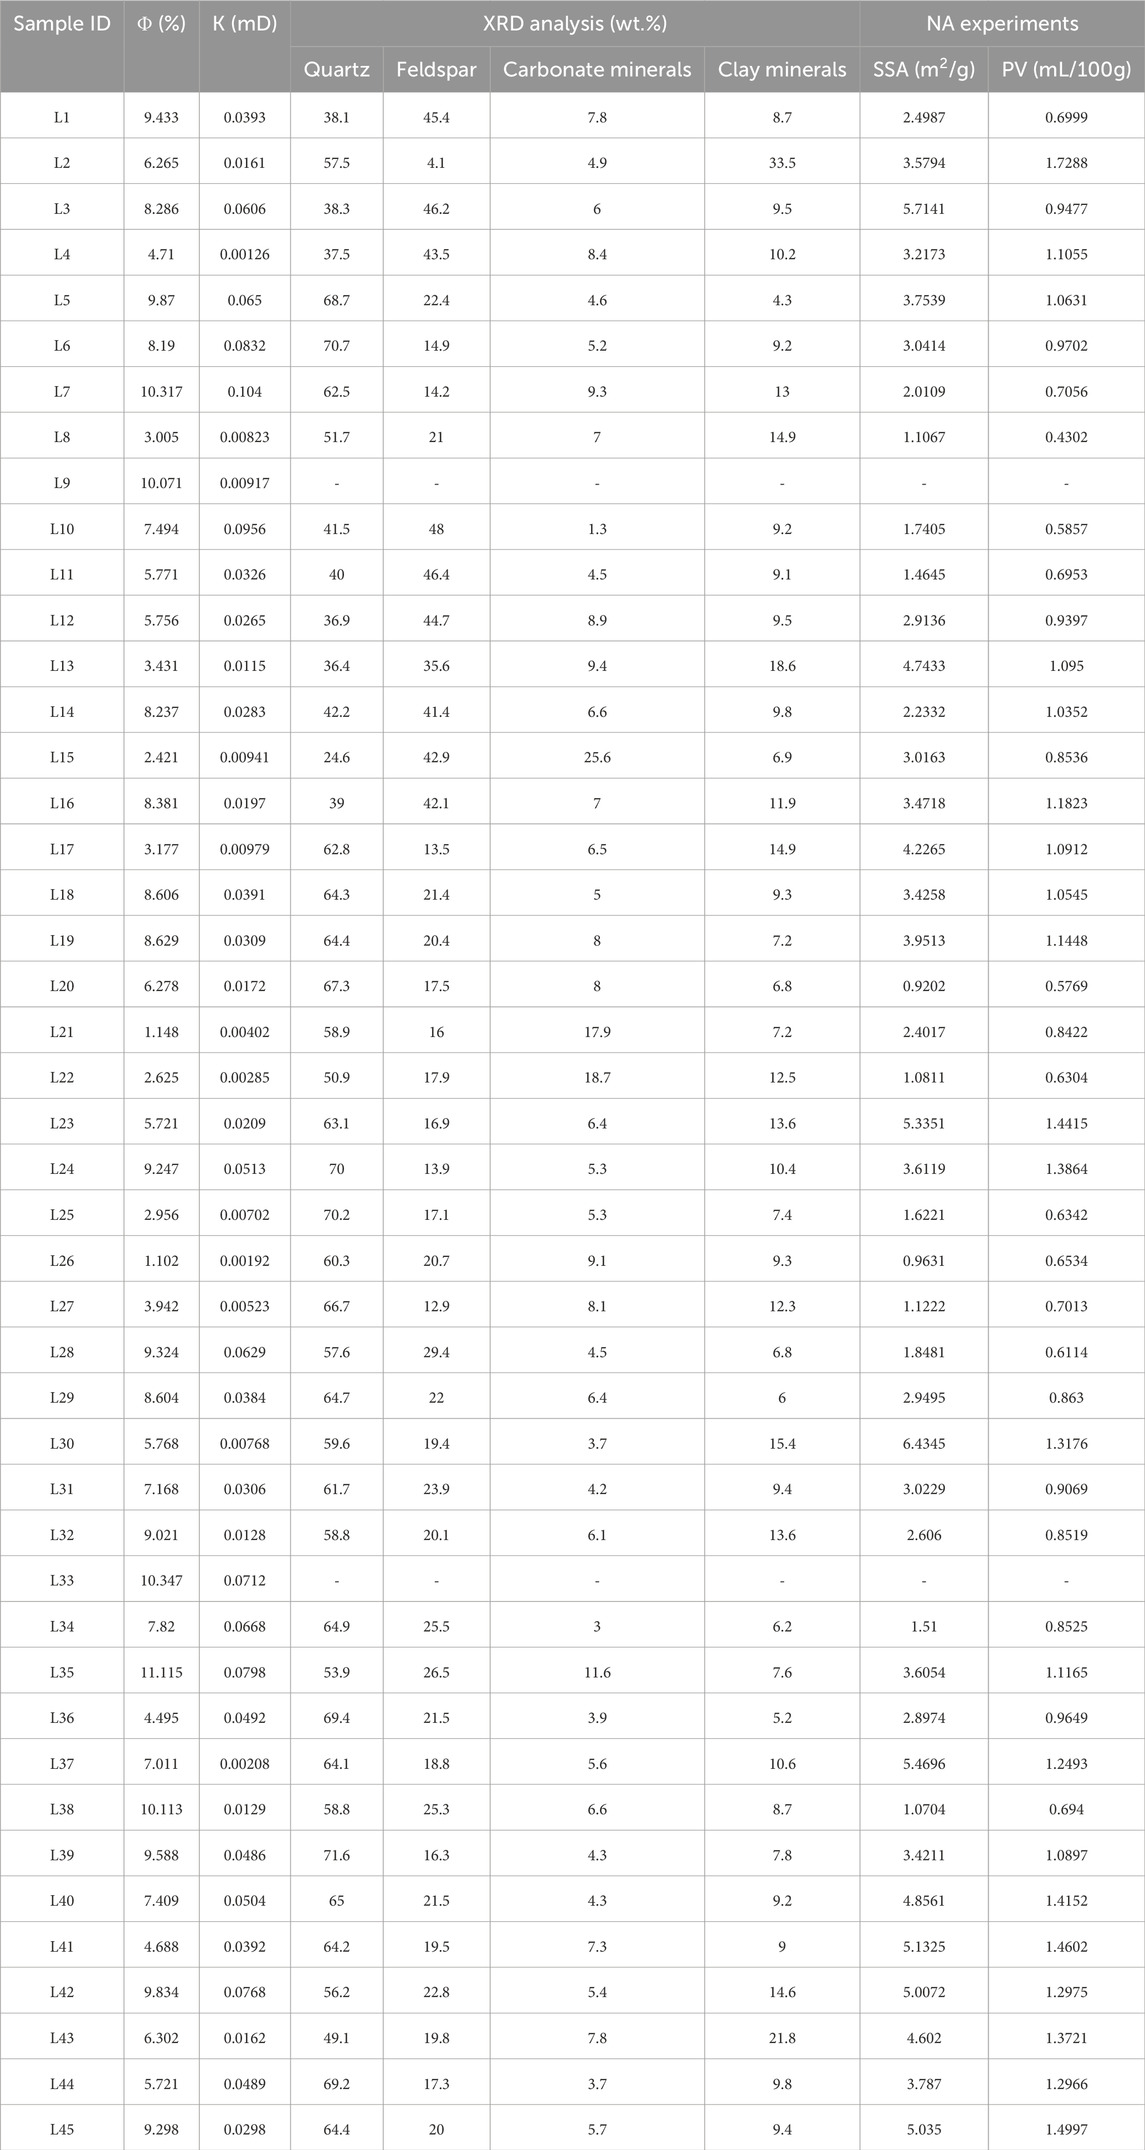
TABLE 1. Porosity, permeability, and mineral compositions of the Chang 7 tight sandstones (Φ-porosity, K-permeability, PV-pore volume).
The XRD analysis showed that Chang 7 tight sandstones are dominated by quartz and feldspar, with the contents of 24.6%–71.6% (average of 56.7%) and 4.1%–48.0% (average of 24.9%), respectively. The carbonate minerals content ranges from 1.3% to 25.6%, with an average of 7.2%, including calcite, dolomite, Fe-dolomite and very small amount of siderite. The clay minerals content varies from 4.3% to 33.5%, with a mean value of 10.7% (Figure 1B; Table 1). Among clay minerals, illite/smecite mixed layer (I/S), illite and chlorite are the dominated compositions, with relative contents of 24.0%–87.0% (mean of 56.8%), 10.0%–53.0% (mean of 30.2%), and 1.0%–47.0% (mean of 14.3%), respectively (Figure 1C; Table 1).
Based on the CTS and SEM images, four types of storage spaces were observed, including residual intergranular pores (RIPs), dissolution pores (DPs), intercrystalline pores (IPs) and microfracture (Figure 2). RIPs only developed in the tight sandstones with better grain sorting and rich in rigid grains. Due to the effects of compaction and cementation, the shape of RIPs becomes extremely irregular. The pore size of RIPs mainly ranges from 1 to 40 μm (Figures 2A, B, E). DPs are the most important storage spaces of Chang 7 tight sandstones. DPs are mainly formed by feldspar dissolution, followed by rock fragments dissolution, while DPs of carbonate are relatively rare (Lai et al., 2016). DPs have a wide PSD, varying from 100 nm to 100 μm (Figures 2A, C, E–G, I, J). Slit-shaped clay IPs are usually observed in Chang 7 tight sandstone, most of which are below 500 nm in diameter (Figures 2C, G, K, L). Microfractures in this work can be classified into two types: structural fractures and diagenetic fractures. Structural fractures generally extend far, and the width is mostly at the micron level. Diagenetic fractures generally have a short extension distance, and the width is mostly at the nano-scale (Figures 2I, J).
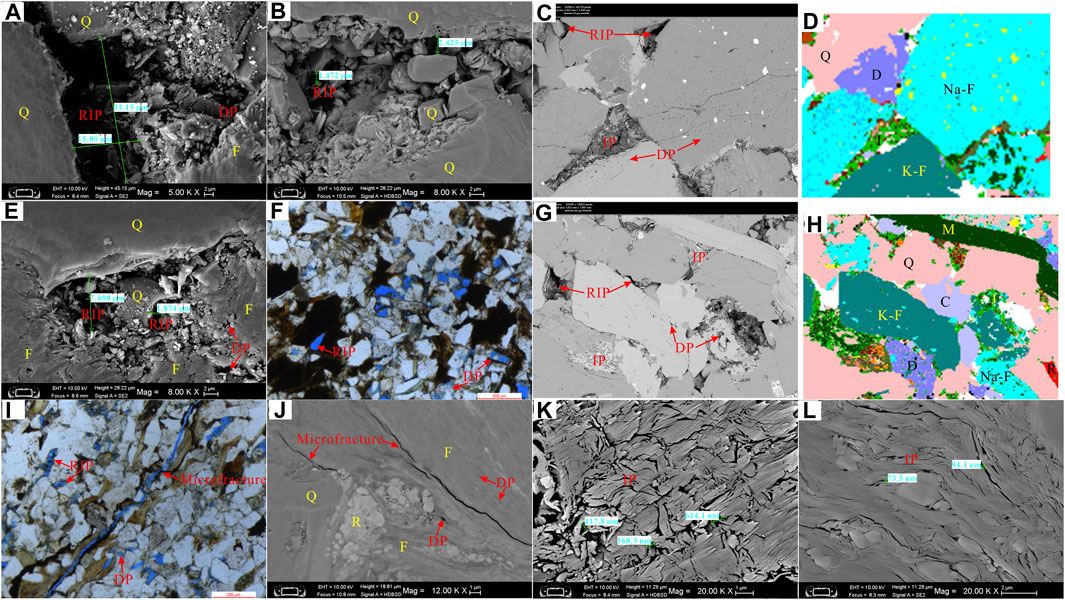
FIGURE 2. The main storage space of Chang 7 tight sandstone in the Longdong area. (A) DPs and RIPs, Sample L33, SEM; (B) RIPs, Sample L10, SEM; (C) RIPs, DPs, and IPs, Sample L5, 2D-MS-BSEM; (D) the same view field as photo (C), QEMSCAN; (E) RIPs and DPs, Sample L34, SEM; (F) RIPs and DPs, Sample L1, Casting thin section; (G) RIPs, DPs, and IPs, Sample L7, 2D-MS-BSEM; (H) the same view field as photo (G), QEMSCAN; (I) RIPs, DPs, and microfracture, Sample L11, Casting thin section; (J) Microfracture and DPs, Sample L42, SEM; (K) IPs, Sample L40, SEM; (L) IPs, Sample L41, SEM. DPs–dissolution pores, RIPs–residual intergranular pores, IPs–intercrystalline pores, Q–quartz, F–feldspar, D–dolomite, C–calcite, I–illite, Na-F–albite, K-F–orthoclase, M–mica.
The field of view area is large enough that the pores extracted from 2D-MS-BSEM are representative. Based on 2D-MS-BSEM, we can obtain the PSD of pores >25 nm. The gray value of pores is larger than that of minerals. Therefore, pores in 2D-MS-BSEM images can be extracted and quantified using ImageJ software. The pore size distribution derived from 2D-MS-BSEM range from 25 nm to 20 μm with a unimodal distribution, and the peak position is around 700 nm (Figure 3).
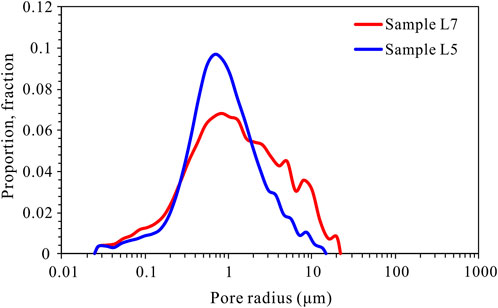
FIGURE 3. The PSD derived from 2D-MS-BSEM.
NA experiment can characterize the pores of 1.5–200 nm. The N2 adsorption/desorption isotherms were shown in Figure 4. When P/P0 > 0.45, there is an obvious hysteresis loop in the adsorption/desorption isotherm. The type of hysteresis loop can reveal the morphology of pores. The hysteresis loops of Chang 7 tight sandstones are dominated by H3 and near-H3 types, accounting for about 86% (Figure 4), indicating that slit-shaped pores are the dominated pore shapes. Under SEM observation, IPs are mainly slit-shaped pores, while DPs and RIPs are mostly ink bottle-shaped pores (Figure 2). These results illustrate that the pores below 200 nm are mainly IPs.
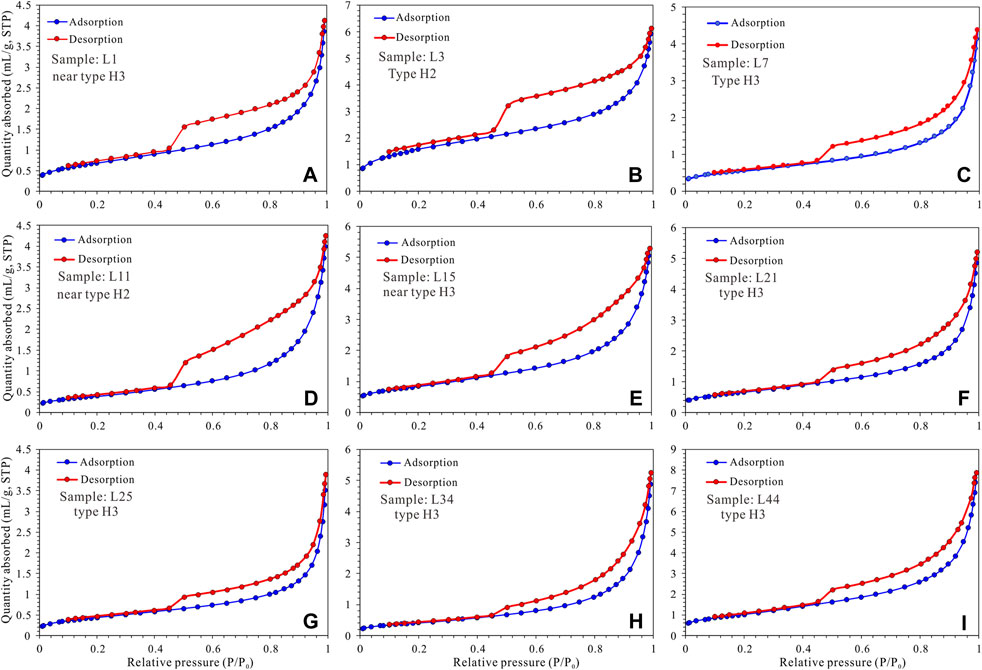
FIGURE 4. The N2 adsorption/desorption isotherms of Chang 7 tight sandstones. (A) is from Sample L1, (B) is from Sample L3, (C) is from Sample L7, (D) is from Sample L11, (E) is from Sample L15, (F) is from Sample L21, (G) is from Sample L25, (H) is from Sample L34, and (I) is from Sample L44.
The SSA calculated by the BET method varies from 0.92 to 6.43 m2/g (average 3.17 m2/g). The average pore size calculated by the BJH method is in the range of 6.44–20.65 nm, with an average of 11.03 nm. Based on BJH model, the pore volume derived from NA data ranges from 0.4302 mL/100g to 1.7288 mL/100g, with a mean of 1.0012 mL/100g (Table 1). The porosity (ΦNA) characterized by N2 adsorption can be determined by the equation: ΦNA = VNA × ρrock ×100%, where, VNA is the pore volume derived from NA experiments, mL/g; ρrock is the rock density, g/mL. ΦNA is in the range of 1.41%–4.18% (average 2.53%), suggesting that the Chang 7 tight sandstone develops a large number of IPs.
The PSDs obtained from the NA experiments are present in Figure 5. The H3 type samples have the same pore size distribution characteristics as the type H2 samples. The pore size distributions have a unimodal distribution, with a peak ranging from 30 to 40 nm.
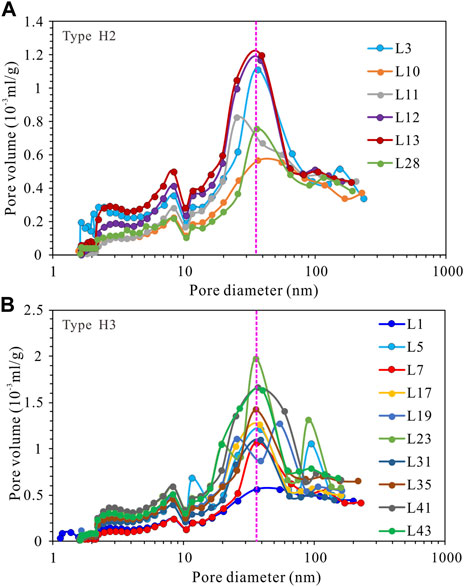
FIGURE 5. The pore size distributions derived from the NA experiments. (A) is from the type H2 samples, (B) is from the type H3 samples.
The NMR T2 spectra under water-saturated state are presented in Figure 6. The T2 spectra of all samples show bimodal shape, with peaks at 0.01–2 ms (P1) and 2–300 ms (P2). According to the amplitude and shape of the T2 spectra, Chang 7 tight sandstone samples can be classified into three types. The T2 spectra of type I samples exhibit a higher P2 peak and a lower P1 peak (Figure 6A), reflecting that their pore system is dominated by larger pores. Taking sample L7 as an example, abundant micron-sized RIPs and DPs were observed under the CTS and SEM images (Figures 6B, C). The T2 spectra of type II samples show unimodal shape (Figure 6D). This phenomenon may be attributed to the close pore size of DPs and IPs, resulting in the merger of P1 and P2 into one peak. This interpretation is supported by microscopic photographs (Figures 6E, F). The T2 spectra of type III samples exhibit a higher P1 peak and a lower P2 peak (Figure 6G), reflecting that their pore system is dominated by smaller pores. In sample L30, we only observed significant amounts of nanoscale IPs while microscale DP or RIP were lacking (Figures 6H, I). Therefore, we can infer that the P2 peak mainly reflects RIPs and DPs, while the P1 peak mainly reflects IPs.
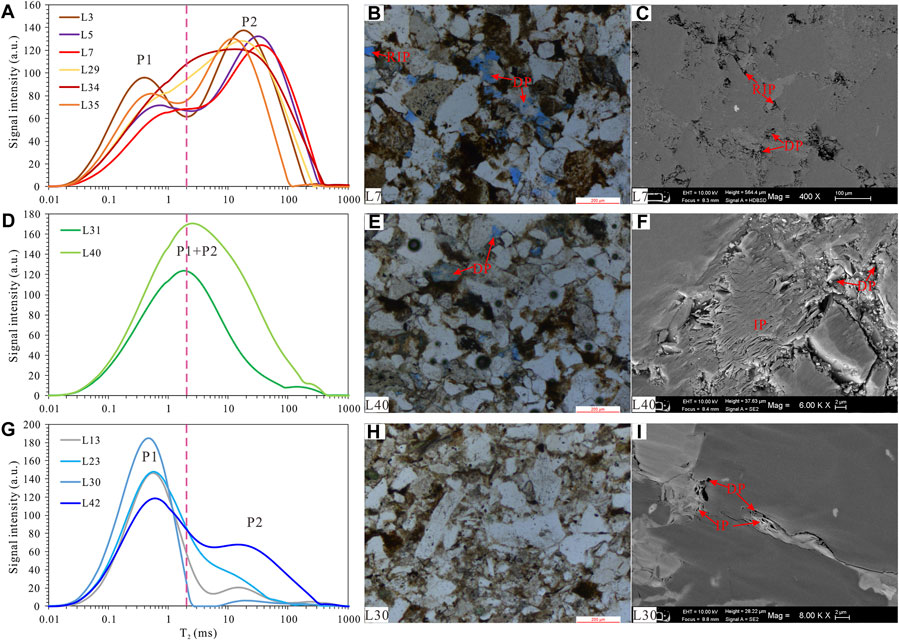
FIGURE 6. Three types of T2 spectra of Chang 7 tight sandstone under water-saturated state and microscopic evidence of typical samples. (A) T2 spectra of type I samples; (B) RIPs and DPs in sample L7, Casting thin section; (C) RIPs and DPs in sample L7, SEM; (D) T2 spectra of type II samples; (E) DPs in sample L40, Casting thin section; (F) DPs and IPs in sample L40, SEM; (G) T2 spectra of type III samples; (H) No pores can be observed in sample L30, Casting thin section; (I) IPs and DPs in sample L30, SEM.
At low TE (0.08 ms), the T2 spectra of tight sandstone saturated with low-viscosity fluid can reflect its full-scale PSD. In the case of uniform magnetic field intensity and short TE, the T2 spectra of tight sandstone saturated with low-viscosity fluid is controlled by the surface relaxation (Kleinberg and Horsfield, 1990; Morriss et al., 1997; Coates et al., 1999). In other words, the larger the T2 value, the larger the corresponding pore diameter. The expression between T2 and pore diameter can be described as:
where
Based on the Eq. 1, another expression between T2 and pore diameter can be depicted as:
where C denotes the conversion coefficient, μm/s.
The relationships between ΦNA and mineral contents are displayed in Figure 7. The ΦNA presents a remarkable positive relationship with clay mineral content, but it shows no obvious correlation with other mineral contents (Figure 7). These relationships demonstrate that the pores revealed by NA experiments are dominated by IPs in clay minerals. Simultaneously, the P1 peak of T2 spectrum mainly reflects IPs. Thus, the PSD obtained from the NA experiment should be comparable in morphology and amplitude to the P1 peak of the T2 spectrum. Therefore, we can calibrate the T2 spectra to the PSDs based on this similarity.
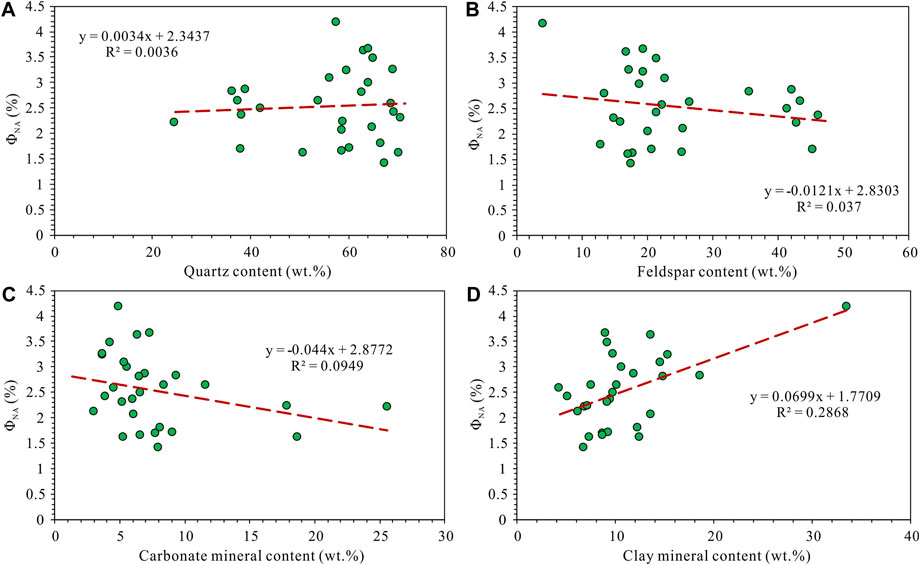
FIGURE 7. The relationships between ΦNA and mineral contents. (A) ΦNA versus quartz content, (B) ΦNA versus feldspar content, (C) ΦNA versus carbonate mineral content, and (D) ΦNA versus clay mineral content.
The calibrated NMR PSD is displayed in Figure 8, ranging from 1 nm to 20 μm. The NMR results show good consistency with the 2D-MS-BSEM results, suggesting that it is feasible to calibrate NMR T2 spectra by using NA data. The calculated C values are in the range of 0.046–0.11 μm/ms (average of 0.069 μm/ms). C values show an obvious positive correlation with the content of iron-containing minerals (i.e., Fe-dolomite, Siderite, pyrite and chlorite) (Figure 9A), which is consistent with the studies of Saidian and Prasad (2015) and Tian et al. (2019). The full-scale PSDs of the selected samples are displayed in Figure 9B. The maximum pore diameter of Chang 7 tight sandstone is about 30 μm, and the minimum pore diameter is about 1 nm.
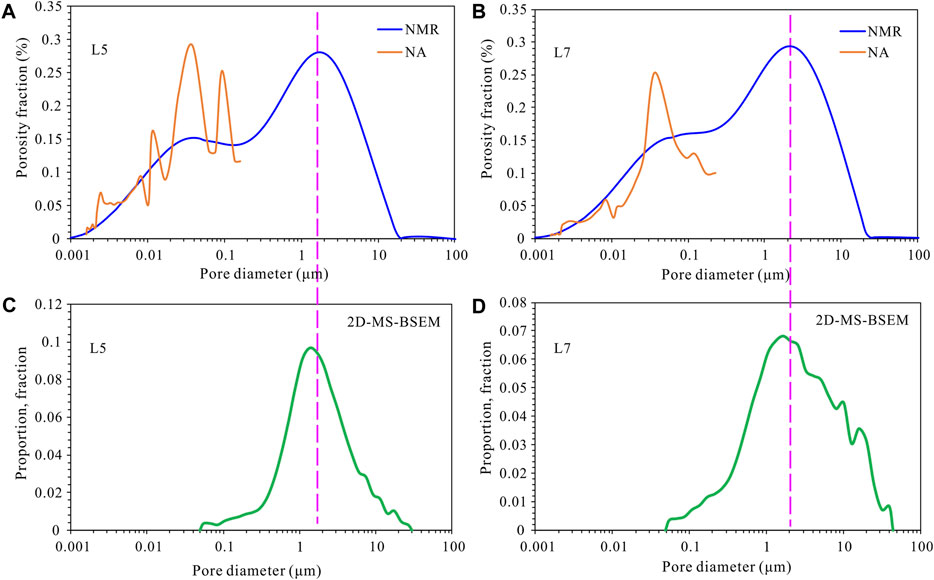
FIGURE 8. Comparison of PSDs by NA, NMR, and 2D-MS-SEM. (A) Comparison of PSDs by NA and NMR from Sample L5, (B) Comparison of PSDs by NA and NMR from Sample L7, (C) PSD by 2D-MS-SEM from Sample L5, and (D) PSD by 2D-MS-SEM from Sample L7.
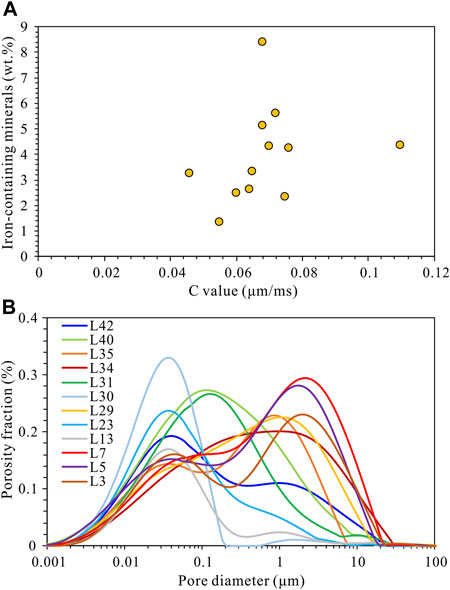
FIGURE 9. (A) Relationship between iron-containing minerals and C values, (B) NMR PSD of the selected samples.
Shao et al. (2017) developed fractal dimension by using NMR data [20]. The corresponding expression is as follows:
where
The relationship between
where dmax is the maximum pore diameter, μm.
Based on the Eq. 4, a scatter plot of
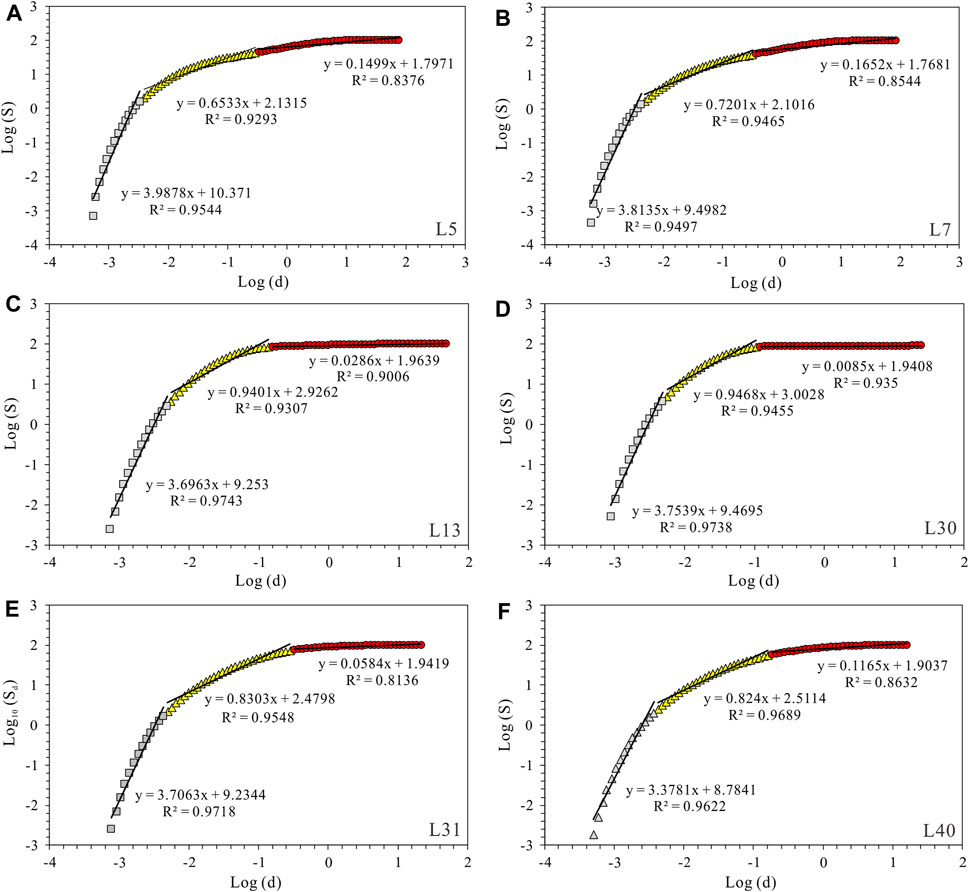
FIGURE 10. Fractal characteristics of full-scale pore structure from NMR data. (A) is from Sample L5, (B) is from Sample L7, (C) is from Sample L13, (D) is from Sample L30, (E) is from Sample L31, and (F) is from Sample L40.
The porosity and proportion of different types of pores were determined based on NMR PSD. Mesopres and macropores are predominant in Chang 7 tight sandstone, and the content of micropores is very small. Porosity of macropores varies from 0.41% to 7.00%, accounting for 7.92%∼84.95%. Porosity of mesopores varies from 1.12% to 5.37%, ac-counting for 13.59%∼87.84%. Porosity of micropores varies from 0.11% to 0.25%, accounting for 1.27%∼4.25% (Figure 11). The content of mesopores displays a distinctly positive relationship with the content of clay minerals (Figure 12A), indicating that mesopores are dominated by clay IPs. The proportion of macropores shows a positive correlation with the contents of quartz and feldspar (Figure 11B), implying that macropores are composed of RIPs and DPs associated with quartz and feldspar. These understandings are consistent with observations under the microscope (Figure 2; Figure 6). Total porosity has a significant positive relationship with the content of macropores, and a significant negative relationship with the proportion of mesopores. (Figures 11B, C), suggesting that an increased content of mesopores compromises total porosity. Clay minerals have two origins: non-authigenic origin and authigenic origin (Rushing et al., 2008; Xiao et al., 2018). Non-authigenic clay exists in the form of argillaceous matrix. A higher content of non-authentic clay minerals will reduce the rock’s ability to resist compaction, resulting in a lower porosity. Authigenic clay exists in the form of cement that block pores and throats, resulting in a reduction in porosity and permeability.
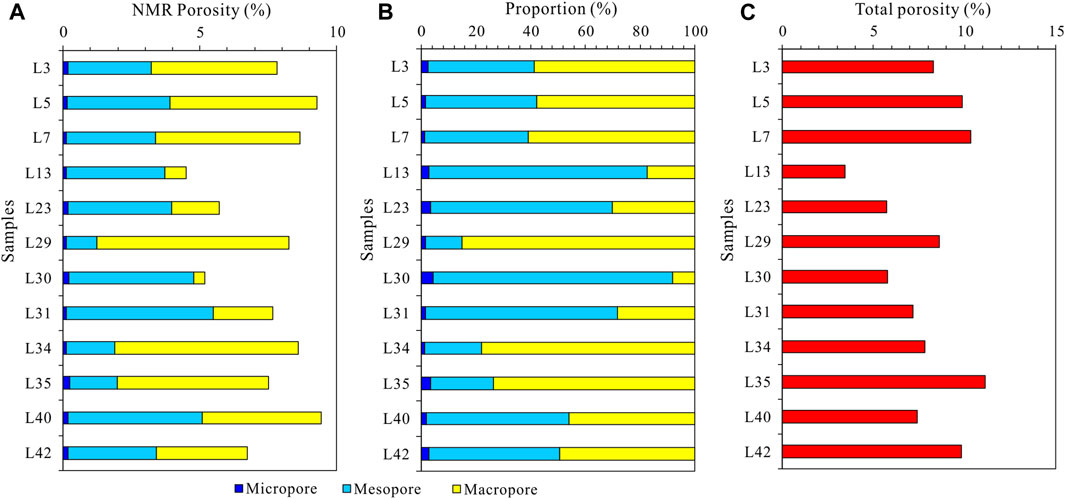
FIGURE 11. (A) NMR Porosity, (B) proportion of different types of pores, and (C) total porosity.
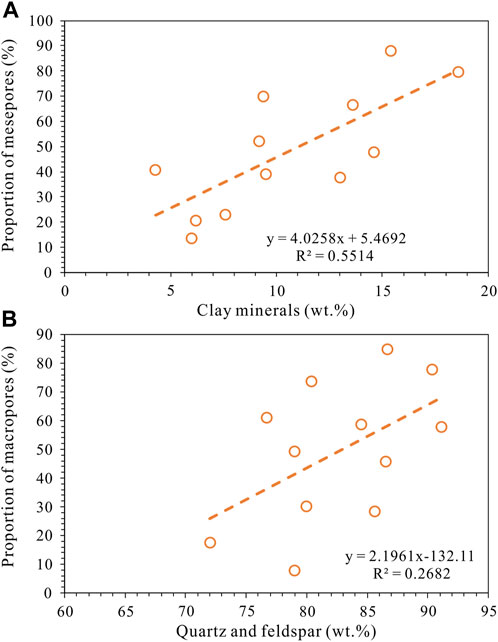
FIGURE 12. (A) Relationship between the proportion of mesopores and the content of clay minerals, and (B) relationship between the proportion of macropores and the content of quartz and feldspar.
Daigle and Johnson (2016) believed that fluid can flow through the porous media only when the continuous percolation network (CPN) reaches a certain volume. The experimental results of Li et al. (2017) showed that pores below 6∼7 nm was completely blocked by water. Meanwhile, the volume and porosity of micropores have no obvious relationship with permeability (Figures 13G, H). Moreover, micropore volume and SSA exhibit an excellent positive correlation (R2=0.5152) (Figure 13I). Thus, micropores are adsorb-fluid pores and do not contribute to the storage and percolation of oil and gas. Mesopore porosity and mesopore volume have no obvious correlation with permeability and SSA, indicating that mesopores only contribute to total porosity but not to permeability (Figures 13D–F). Thus, mesopores represent bound-fluid pores.
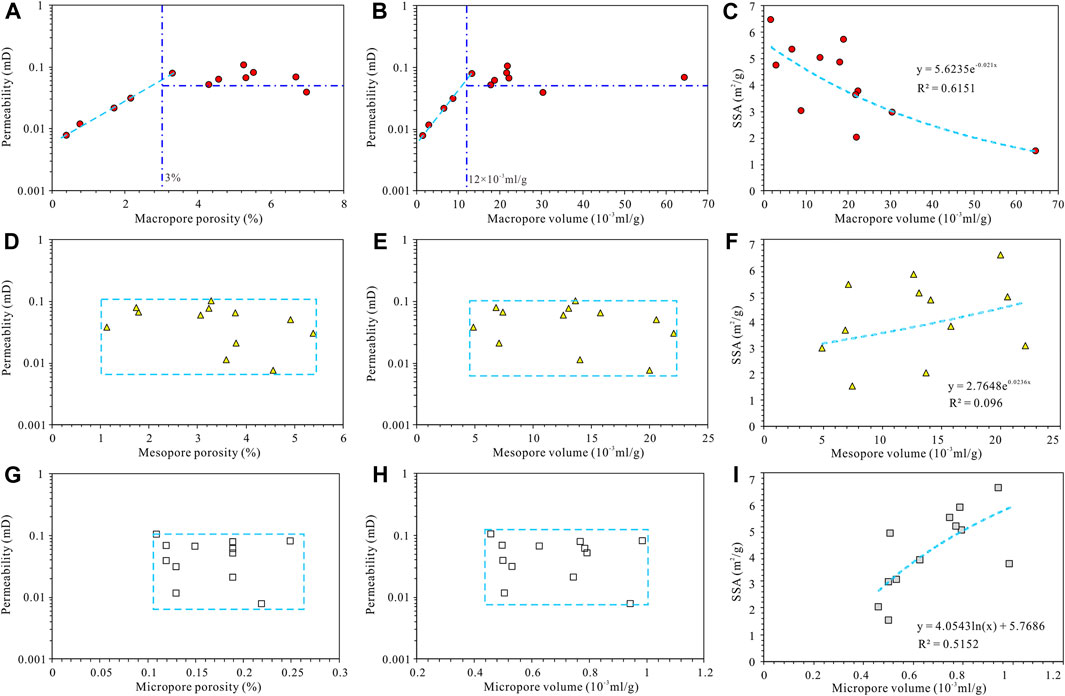
FIGURE 13. Relationships between permeability and the porosity (A, D, G) and volume (B, E, H) of macropores, mesopores and micropores and relationships between specific surface area (SSA) and the volume of macropores (C), mesopores (F) and micropores (I).
The permeability shows a two-stage change relationship with the increase of macropore porosity and volume: 1) when macropore porosity exceeds 3% or macropore volume exceeds 12 × 10−3 mL/g, the permeability is a stable and high value, mostly higher than 0.05 mD. According to the classification and evaluation scheme of Chang 7 reservoir established by Gao et al. (2021), samples with permeability >0.05 mD belong to high quality reservoirs; 2) When the macropore porosity is less than 3% or the macropore volume is less than 12×10−3 mL/g, the permeability shows an obvious upward trend (Figures 13A, B). We believe that when the macropore volume exceeds 12×10−3 mL/g, the CPN is completely composed of macropores. When the macropore volume is less than 12 × 10−3mL/g, the CPN is composed of macropores and mesopores. Mesopores are mainly composed of clay IPs. The higher the proportion of mesopores in the CPN, the tortuosity of the CPN will increase, resulting in lower permeability. In addition, macropore volume and SSA exhibit an excellent negative correlation (R2=0.6151) (Figure 13C). These results confirm that macropores represent movable-fluid pores and contribute to both porosity and permeability.
Both permeability and porosity have a significant negative correlation with D3, with R2 of 0.5416 and 0.5715, respectively (Figures 14A, B), suggesting that the stronger the heterogeneity of macropores, the worse the quality of the sample is. This is due to the strong compaction and cementation effects that increase the heterogeneity of macropores. Permeability and porosity display almost no relationships with D2, with R2 of only 0.1842 and 0.0899 (Figures 14C, D), showing that the strength of mesopore heterogeneity does not affect the quality of the reservoir.
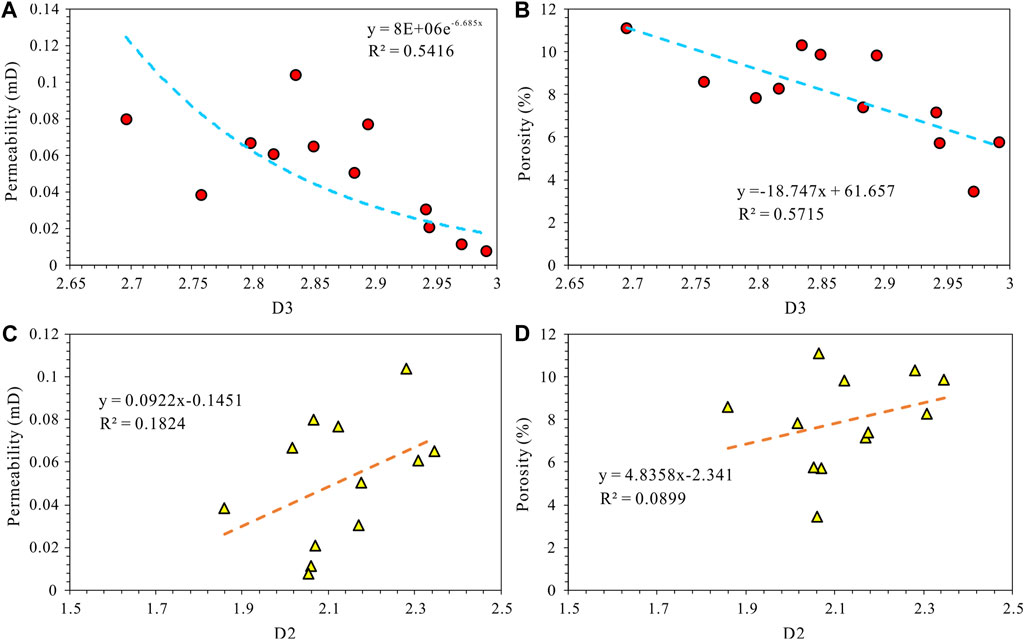
FIGURE 14. Relationship between physical properties and the fractal dimensions of macropores and mesopores. (A) Permeability versus D3, (B) porosity versus D3, (C) permeability versus D2, and (D) porosity versus D2.
The Chang 7 tight sandstones were measured by CTS, FE-SEM, 2D-MS-BSEM, NA, and NMR experiments to quantify the full-scale PSD and fractal characteristics. Furthermore, the relationship between pores of different sizes and physical properties is further discussed. The primary conclusions are as follows.
(1) NA experiments can be used to calibrate NMR T2 spectra to obtain full-scale PSD. According to the fractal inflection point of full-scale PSD, pore system was divided into macropores, mesopores, and micropores. The critical values of mesopores and micropores are between 3.6 and 7.2 nm, while the critical values of mesopores and macropores are in the range of 29.8∼344.3 nm.
(2) Micropores, mesopores and macropores have different contributions to porosity and permeability. Permeability is dominated by macropores, and porosity is contributed by both macropores and mesopores. Micropores only contributed to SSA. In addition, strong heterogeneity in large pores leads to poor reservoir quality.
(3) Macropore content and heterogeneity can be used as good indicators to judge quality of Chang 7 tight sandstone. The macropore volume of 12×10−3 mL/g can be used as the lower limit of high-quality reservoirs. High quartz-feldspar content and low clay mineral content are necessary conditions for the development of macropores.
The original contributions presented in the study are included in the article/supplementary material, further inquiries can be directed to the corresponding author.
ZL: Conceptualization, Project administration, Writing–original draft. YR: Formal Analysis, Writing–original draft. RC: Investigation, Writing–original draft. YZ: Resources, Writing–original draft. XZ: Data curation, Writing–original draft. WT: Conceptualization, Funding acquisition, Methodology, Supervision, Writing–review and editing.
The author(s) declare financial support was received for the research, authorship, and/or publication of this article. This research was financially supported by the National Natural Science Foundation of China (Grant No. 42202187 and 42272160) and key applied science and technology project of China National Petroleum Corporation “Research and testing of Continental Shale Oil Development Optimization Technology” (Grant No. 2023ZZ15YJ03).
Authors ZL, YR, RC, YZ, and XZ were employed by PetroChina Changqing Oilfield Company.
The remaining author declares that the research was conducted in the absence of any commercial or financial relationships that could be construed as a potential conflict of interest.
The authors declare that this study received funding from the key applied science and technology project of China National Petroleum Corporation. The funder had the following involvement in the study: design, collection, analysis, interpretation of data, the writing of this article or the decision to submit it for publication.
All claims expressed in this article are solely those of the authors and do not necessarily represent those of their affiliated organizations, or those of the publisher, the editors and the reviewers. Any product that may be evaluated in this article, or claim that may be made by its manufacturer, is not guaranteed or endorsed by the publisher.
Coates, G. R., Xiao, L., and Prammer, M. G. (1999). NMR logging: principles and applications. Houston, TX, USA: Halliburton Energy Services.
Daigle, H., and Johnson, A. (2016). Combining mercury intrusion and nuclear magnetic resonance measurements using percolation theory. Transp. Porous Med. 111, 669–679. doi:10.1007/s11242-015-0619-1
Dong, H., Sun, J., Zhu, J., Lin, Z., Cui, L., Yan, W., et al. (2019). Quantitative characterization and characteristic analysis of pore structure of shale-gas reservoir in the Sichuan Basin, China. Interpretation 7 (4), 23–32. doi:10.1190/INT-2018-0169.1
Fu, J., Li, S., Niu, X., Deng, X., and Zhou, X. (2020). Geological characteristics and exploration practice of the self-sourced reservoir in Chang 7 member of triassic yanchang formation Ordos Basin NW China. Petrol. explor. Dev. 47 (5), 1–14. doi:10.11698/PED.2020.05.03
Fu, J., Liu, X., Li, S., Guo, Q., Zhou, X., and Yang, W. (2021). Discovery and resource potential of shale oil of Chang 7 member, triassic yanchang formation, Ordos Basin. China Pet. explor. 26, 1–11. doi:10.3969/j.issn.1672-7703.2021.05.001
Gao, H., Zhou, X., Wen, Z., Guo, W., Tian, W., Li, S., et al. (2022). Classification and evaluation of shale oil reservoirs of the Chang 71-2 Sub-Member in the Longdong area. Energies 15 (15), 5364. doi:10.3390/en15155364
Gao, Z., Yang, X., Hu, C., Wei, L., Jiang, Z., Yang, S., et al. (2019). Characterizing the pore structure of low permeability eocene liushagang formation reservoir rocks from beibuwan basin in northern south China sea. Mar. Petrol. Geol. 99, 107–121. doi:10.1016/j.marpetgeo.2018.10.005
Kleinberg, R. L., and Horsfield, M. A. (1990). Transverse relaxation processes in porous sedimentary rock. J. Magn. Reson. 88 (1), 9–19. doi:10.1016/0022-2364(90)90104-H
Lai, J., and Wang, G. (2015). Fractal analysis of tight gas sandstones using high-pressure mercury intrusion techniques. J. Nat. Gas. Sci. Eng. 24, 185–196. doi:10.1016/j.jngse.2015.03.027
Lai, J., Wang, G., Ran, Y., Zhou, Z., and Cui, Y. (2016). Impact of diagenesis on the reservoir quality of tight oil sandstones: the case of Upper Triassic Yanchang Formation Chang 7 oil layers in Ordos Basin, China. J. Pet. Sci. Eng. 145, 54–65. doi:10.1016/j.petrol.2016.03.009
Li, J., Li, X., Wu, K., Feng, D., Zhang, T., and Zhang, Y. (2017). Thickness and stability of water film confined inside nanoslits and nanocapillaries of shale and clay. Int. J. Coal Geol. 179, 253–268. doi:10.1016/j.coal.2017.06.008
Morriss, C., Rossini, D., Straley, C., Tutunjian, P., and Vinegar, H. (1997). Core analysis by low-field NMR. Log. Anal. 38 (2), 84–93.
Rushing, J. A., Newsham, K. E., and Blasingame, T. A. (2008). “Rock typing—keys to understanding productivity in tight gas sands,” in SPE Unconventional Resources Conference/Gas Technology Symposium, Keystone, Colorado, USA, February, 2008.
Saidian, M., and Prasad, M. (2015). Effect of mineralogy on nuclear magnetic resonance surface relaxivity: a case study of Middle Bakken and Three Forks formations. Fuel 161, 197–206. doi:10.1016/j.fuel.2015.08.014
Sakhaee-Pour, A., and Bryant, S. L. (2014). Effect of pore structure on the producibility of tight-gas sandstones. Am. Assoc. Petrol. Geol. Bull. 98 (4), 663–694. doi:10.1306/08011312078
Shao, X., Pang, X., Li, H., and Zhang, X. (2017). Fractal analysis of pore network in tight gas sandstones using NMR method: a case study from the Ordos Basin, China. Energy fuels., 31 (10), 10358–10368. doi:10.1021/acs.energyfuels.7b01007
Tian, W., Lu, S., Huang, W., Wang, S., Gao, Y., Wang, W., et al. (2019). Study on the full-range pore size distribution and the movable oil distribution in glutenite. Energy fuels., 33 (8), 7028–7042. doi:10.1021/acs.energyfuels.9b00999
Tian, W., Lu, S., Huang, W., Wang, W., Li, J., Gao, Y., et al. (2020). Quantifying the control of pore types on fluid mobility in low-permeability conglomerates by integrating various experiments. Fuel 275, 117835. doi:10.1016/j.fuel.2020.117835
Tian, W., Lu, S., Li, J., Wang, W., Li, J., and Wen, Z. (2022). Insights into the pore structure and pore development pattern of subaqueous volcanic rocks in the Santanghu Basin, western China. Mar. Petrol. Geol. 135, 105387. doi:10.1016/j.marpetgeo.2021.105387
Wang, X., Hou, J., Li, S., Dou, L., Song, S., Kang, Q., et al. (2020). Insight into the nanoscale pore structure of organic-rich shales in the Bakken Formation, USA. J. Pet. Sci. Eng. 191, 107182. doi:10.1016/j.petrol.2020.107182
Wen, Z., Luo, Y., Liu, J., Zhao, C., Li, S., Tian, W., et al. (2022). Pore structure characteristics and genetic mechanism of Triassic Chang 7 shale oil reservoir in Longdong area. Lithol. Reserv. 34 (6), 47–59. doi:10.12108/yxyqc.20220604
Wu, Y., Tahmasebi, P., Lin, C., Zahid, M. A., Dong, C., Golab, A. N., et al. (2019). A comprehensive study on geometric, topological and fractal characterizations of pore systems in low-permeability reservoirs based on SEM, MICP, NMR, and X-ray CT experiments. Mar. Petrol. Geol. 103, 12–28. doi:10.1016/j.marpetgeo.2019.02.003
Xi, K., Cao, Y., Haile, B. G., Zhu, R., Jahren, J., Bjørlykke, K., et al. (2016). How does the pore-throat size control the reservoir quality and oiliness of tight sandstones? The case of the Lower Cretaceous Quantou Formation in the southern Songliao Basin, China. Mar. Pet. Geol. 76, 1–15. doi:10.1016/j.marpetgeo.2016.05.001
Xiao, D., Jiang, S., Thul, D., Huang, W., Lu, Z., and Lu, S. (2017a). Combining rate-controlled porosimetry and NMR to probe full-range pore throat structures and their evolution features in tight sands: a case study in the Songliao Basin, China. Mar. Petrol. Geol. 83, 111–123. doi:10.1016/j.marpetgeo.2017.03.003
Xiao, D., Jiang, S., Thul, D., Lu, S., Zhang, L., and Li, B. (2018). Impacts of clay on pore structure, storage and percolation of tight sand-stones from the Songliao Basin, China: implications for genetic classification of tight sandstone reservoirs. Fuel 211, 390–404. doi:10.1016/j.fuel.2017.09.084
Xiao, D., Lu, S., Yang, J., Zhang, L., and Li, B. (2017b). Classifying multiscale pores and investigating their relationship with porosity and permeability in tight sandstone gas reservoirs. Energy fuels., 31 (9), 9188–9200. doi:10.1021/acs.energyfuels.7b01487
Xu, Q., Ma, Y., Liu, B., Song, X., Li, L., Xu, J., et al. (2018). Fractal characteristics of lacustrine tight carbonate na-noscale reservoirs. Energy fuels., 32 (1), 107–118. doi:10.1021/acs.energyfuels.7b02625
Zhang, J., Li, X., Xie, Z., Li, J., Zhang, X., Sun, K., et al. (2018). Characterization of microscopic pore types and structures in ma-rine shale: examples from the upper permian dalong formation, northern sichuan basin, south China. J. Nat. Gas. Sci. Eng. 59, 326–342. doi:10.1016/j.jngse.2018.09.012
Zhang, J., Tang, Y., He, D., Sun, P., and Zou, X. (2020). Full-scale nanopore system and fractal characteristics of clay-rich lacustrine shale combining FE-SEM, nano-CT, gas adsorption and mercury intrusion porosimetry. Appl. Clay Sci. 196, 105758. doi:10.1016/j.clay.2020.105758
Zhang, L., Lu, S., Xiao, D., and Gu, M. (2017a). Characterization of full pore size distribution and its significance to macroscopic phys-ical parameters in tight glutenites. J. Nat. Gas. Sci. Eng. 38, 434–449. doi:10.1016/j.jngse.2016.12.026
Zhang, P., Lu, S., Li, J., Xue, H., Li, W., and Zhang, P. (2017b). Characterization of shale pore system: a case study of Paleogene Xin'gouzui Formation in the Jianghan basin, China. Mar. Petrol. Geol. 79, 321–334. doi:10.1016/j.marpetgeo.2016.10.014
Zhang, P., Lu, S., Li, J., Zhang, J., Xue, H., and Chen, C. (2017c). Comparisons of SEM, low-field NMR, and mercury intrusion capillary pressure in characterization of the pore size distribution of lacustrine shale: a case study on the Dongying Depression, Bo-hai Bay Basin, China. Energy fuels., 31 (9), 9232–9239. doi:10.1021/acs.energyfuels.7b01625
Zheng, J., Tian, W., Gao, Y., Wen, Z., Fan, Y., Gao, H., et al. (2023). Multi-scale fractal characteristics of the pore system in low-permeability conglomerates from the junggar basin. Processes 11 (9), 2667. doi:10.3390/pr11092667
Keywords: full-scale pore structure, fractal characteristics, physical properties, NMR, Chang 7 tight sandstone
Citation: Li Z, Ren Y, Chang R, Zhang Y, Zhang X and Tian W (2024) Clarifying the contribution of multiscale pores to physical properties of Chang 7 tight sandstones: insight from full-scale pore structure and fractal characteristics. Front. Earth Sci. 12:1361052. doi: 10.3389/feart.2024.1361052
Received: 24 December 2023; Accepted: 26 January 2024;
Published: 15 February 2024.
Edited by:
Wenguang Wang, Northeast Petroleum University, ChinaReviewed by:
Yiming Yan, China University of Petroleum (East China), ChinaCopyright © 2024 Li, Ren, Chang, Zhang, Zhang and Tian. This is an open-access article distributed under the terms of the Creative Commons Attribution License (CC BY). The use, distribution or reproduction in other forums is permitted, provided the original author(s) and the copyright owner(s) are credited and that the original publication in this journal is cited, in accordance with accepted academic practice. No use, distribution or reproduction is permitted which does not comply with these terms.
*Correspondence: Weichao Tian, NTIwMDQ0QHlhbmd0emV1LmVkdS5jbg==
Disclaimer: All claims expressed in this article are solely those of the authors and do not necessarily represent those of their affiliated organizations, or those of the publisher, the editors and the reviewers. Any product that may be evaluated in this article or claim that may be made by its manufacturer is not guaranteed or endorsed by the publisher.
Research integrity at Frontiers
Learn more about the work of our research integrity team to safeguard the quality of each article we publish.