
94% of researchers rate our articles as excellent or good
Learn more about the work of our research integrity team to safeguard the quality of each article we publish.
Find out more
ORIGINAL RESEARCH article
Front. Earth Sci., 26 February 2024
Sec. Atmospheric Science
Volume 12 - 2024 | https://doi.org/10.3389/feart.2024.1358155
This article is part of the Research TopicAtmosphere – Cryosphere Interaction in the Arctic, at High Latitudes and Mountains with Focus on Transport, Deposition and Effects of Dust, Black Carbon, and other Aerosols - Volume IIView all 4 articles
 Jonas Svensson1*
 Leena Leppänen2,3
 Henna-Reetta Hannula1
 Anna Kontu2Yi-cheng Shen4
 Outi Meinander1
 Pavla Dagsson-Waldhauserová5,6Arunas Mesceriakovas7Enna Heikkinen1Meri Ruppel1Olli Sippula7Johan Ström8Eija Asmi1
 Aki Virkkula1
The absorption of shortwave irradiance in snow depends on the physical properties of snow (e.g., snow grain size and shape, liquid water content, etc.) and light-absorbing particles (LAP). Originating from natural and anthropogenic sources, LAP has been reported to accelerate snowmelt significantly in different regions globally. Yet, our process-level understanding of LAP after deposition onto snow remains rather limited. Here we investigate the impacts of artificial deposition of different LAP onto snow surfaces in an outdoor environment of northern Finland. Following LAP dry deposition into a custom-made tent standing on top of the snowpack, the albedo was followed along with the properties of snow in snow pit measurements throughout the spring season. The results showed that the albedo decay at the end of the season for the different spots were linked to the initial amount and type of LAP that were deposited onto the snowpack. Measured snow temperature profiles from LAP doped snow versus natural reference snow illustrated that the LAP affected snow had higher temperatures in the subsurface snow layers. Collected snow samples analyzed for size distribution of soot particles revealed no apparent agglomeration of soot particles during thaw-freezing events taking place during the experiment. Despite the relatively large perturbation of the experimentally deposited LAP, their impact on the season length was only up to 3 days. Additional experiments are, nevertheless, needed to better constrain the effects of LAP on snow albedo, melt rate, and other associated processes.
Incomplete combustion of carbonaceous fuels emits gases and particulate matter into the atmosphere. Black carbon (BC) particles have the strongest light absorption per unit mass for any particle released by burning processes (Bond et al., 2013). Any light-absorbing particles (LAP), which BC is part of, have the potential to extensively influence the net radiative forcing, particularly once the particles have deposited onto a bright surface such as snow. Decreasing the reflectivity of snow, LAP contributes to earlier and enhanced snowmelt, affecting meltwater runoff (e.g., Hansen and Nazarenko, 2004; Flanner et al., 2007; Painter et al., 2007). Other LAP in snow includes mineral dust (MD), light-absorbing organic matter, i.e., brown carbon (BrC), and microbes (including algae and pollen). Once LAP are at or near a snow surface, they directly lower the snow albedo (Warren and Wiscombe, 1980), also known as the direct effect. The presence of LAP in the snow also triggers accelerated snow metamorphism, leading to further decreases in albedo (which is referred to as the indirect effect) (Painter et al., 2007). The indirect effect is in addition to snow’s natural propensity to metamorphism with time in ambient conditions, regardless of the presence of LAP or not. This tendency in the snow is manifested in a typical decrease in snowpack albedo throughout the snow season. In addition to LAP, another important variable affecting albedo is snow grain size (and shape) (Warren and Wiscombe, 1980). The grain size is typically quantified in terms of its optical effective radius (re), which can be written as the specific surface area (SSA) according to,
where ρice is the density of pure ice (917 kg m-3).
Field observations coupled with numerical simulations have shown that the indirect effect can account for 20% of the total radiative LAP forcing in the snowpack of southwestern Colorado, United States (Skiles and Painter, 2019). Similarly, the seasonal snowpack at Col de Porte (1325 m altitude, French Alps), had the indirect effect responsible for 15% of the net LAP forcing for one snow season (Tuzet et al., 2017). Meanwhile, on the contrary, another site in the French Alps (located ∼60 km southeast of Col De Porte) at a higher altitude (2058 m) reported that the indirect effect was insignificant for the two seasonal snow years studied (Tuzet et al., 2020). These differences indicate a complexity that can occur in natural conditions, and Tuzet et al. (2020) suggested that the indirect impact of LAP is very dependent on the meteorological conditions during and after LAP deposition. For example, if LAP deposition occurs on snow when the grain size is already large, the potential for the indirect effect to be efficient is rather small. In terms of shortening the snow cover duration, however, it was proposed that the total LAP effect can account for about 10 days in the French Alps (Tuzet et al., 2020), while in the southwestern Colorado, United States, it may be up 51 days (Skiles and Painter, 2019).
Despite LAP recognition as an important agent in the snow energy balance, as exemplified in the modelling work of He and Flanner (2020), and numerous field measurements to date (e.g., Skiles et al., 2018 and references therein), there is still a scarcity of experimental studies investigating the different processes associated with LAP deposition in snow. Partly halted by the inherent difficulties in conducting experiments of this nature, it has, nevertheless, been shown in a controlled laboratory setting that snow grains of difference sizes doped with BC, has a greater albedo reduction for the larger snow grain sizes (Hadley and Kirchstetter, 2012). Other experiments include the work of Beres et al. (2018); Beres et al. (2020), which primarily focused on depositing BrC onto snow surfaces via smoldering combustion of peat samples. The impacts of BrC were studied on a relatively short time scale following the deposition procedure, however. Likewise, Schneider et al. (2019a), performed experiments over brief time scales, with a daily duration. Both BC and MD were spread with a salt-shaker onto snow surfaces, and while the authors did not observe a LAP effect on snow metamorphism during a day with cloudy conditions, there was, however, a decrease in SSA (note that SSA decreases when grain size increases) during sunny circumstances (Schneider et al., 2019b). Thus, while the above-mentioned studies have increased our understanding of LAP in snow, it is evident that there remains a great need to further experimentally study LAP deposition onto snow. This is particularly essential on longer temporal scales, where possible snow microstructure changes induced by the LAP deposition can be monitored, as well as observations of possible changes that the deposited particulates might undergo in the snow.
Here, in the fourth Finnish Meteorological Institute-led soot-on-snow experiment conducted in 2018 (hereafter referred to as SoS 2018), we study processes associated with artificial LAP deposition onto natural snow. The work builds upon our previous experimental work—where LAP (and most soot) was artificially dry deposited onto snow surfaces in natural outdoor conditions in different snow environments of Finland. (Meinander et al., 2014; Peltoniemi et al., 2015; Svensson et al., 2016). Note that we here refer to soot as carbonaceous particles formed during incomplete combustion and use it synonymously to BC for simplicity in this manuscript. In contrast to the earlier experiment (SoS 2013), the LAP deposition in SoS2018 took place earlier in the snow season at the same site in Sodankylä, northern Finland. This allotted a longer monitoring period with the LAP in the snow prior to the onset of snowmelt. In total, SoS2018 spanned the transition from a cold snowpack to a warming ripening snowpack until intensive melting and subsequent melt-out. In addition to depositing the LAP earlier in the snow season, the focuses in SoS2018 were to deposit both lower LAP amounts and size constrained aerosol (with a size distribution peak in the lower submicron range) onto the snow surfaces. The properties of snow following LAP deposition were thereafter observed in snow pit measurements throughout the experiment.
Our main scientific goal is to investigate how perturbed snow surfaces with various levels of LAP are affected and quantify the impact the different perturbations have on the melt-out-date (MOD) in outdoor conditions affected additionally by natural LAP deposition. Other experimental specific goals are to i) study the temporal variation of albedo at the different LAP deposition sites, ii) detect variations in snow microphysical properties (i.e., grain size, snow density, temperature), and iii) investigate temporal variations in BC particles’ size distribution in the snow.
The experiment was conducted at the Sodankylä airfield (67°23′N, 26°36′E) northern Finland, previously used in SoS 2013. The airfield is not operational anymore with any commercial scheduled flights, and the experimental area was strategically placed in an off-sectioned part of the airfield. This way the local contamination was kept to a minimum, while the experiment area obviously received some natural LAP deposition. Prior to SoS2018, the ground of the experimental area was homogenized with sand and gravel to create uniform surface conditions. This is of importance for snow albedo, since at lower snow depths the ground influences the snow albedo. The different types of LAP used in the experiment were soot (the same batch acquired by the chimney cleaning company as used in SoS2013), Icelandic silt (glaciogenic origin) and volcanic sand with volcanic ash from old volcanic eruptions from Iceland, which were also used in SoS2013—all of which are further described in Peltoniemi et al. (2015) and Svensson et al. (2016). The deposition of LAP onto snow surfaces took place with a custom-built deposition system. This consisted of a blowing device connected to a large deposition chamber which was resting on top of the snowpack during deposition (see Supplementary Figures S1A, B of the measurement campaign set-up). The system was originally constructed for SoS2013, but a few amendments were made for SoS2018. The connection between the blower and the deposition chamber was fitted with a stainless-steel tubing (25 mm outer diameter) with a y-shaped bend. This generated a particle-size separation step through inertial separation, prior to leading the LAP into the deposition chamber with the tubing. The purpose of this new tubing was to remove super-micron particles prior to the deposition chamber. Initial tests appeared promising, however, post experimental laboratory tests indicated a broad transfer function allowing a fraction of large particles to enter the deposition tent despite the fitting (see airborne size distribution of soot particles in Svensson et al., 2019; Figure 2).
Each of the deposition spots were roughly 4 m in diameter (area of ∼12.6 m2). The amount of LAP inserted to the blowing system was weighed prior to deposition (Table 1), and two identical spots with the same starting weight for the LAP were created. One spot was designated purely for undisturbed pyranometer measurements only (termed with “A”), while the other was intended for the subsequent snow pit observations (denoted as “B”). For example, in cases of spots 1A and 1B, 1A was first made with the known pre-weighted soot being fed to the blowing system. The experimental chamber was thereafter moved by a mobile crane to an adjacent location and the deposition procedure with the same amount of the identical material was repeated for spot 1B (see Supplementary Figure S1C with schematic map of experimental set-up). The same dry deposition procedure was utilized for the remaining spots (nine LAP spots), with different LAP amounts or types (Table 1). In between each spot and LAP material, the blower was run without any material added to it for some time (order of minutes), to clean out the system.
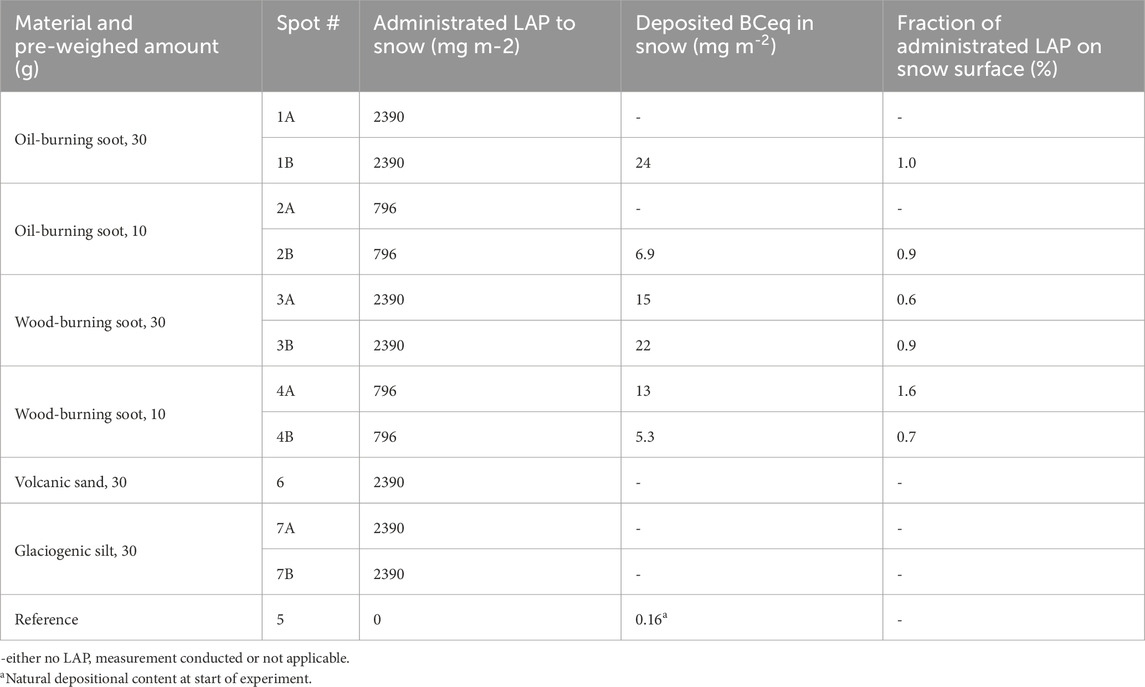
TABLE 1. LAP material used for different spots.
The deposition was characterized by taking snow samples of the surface layer (5 cm depth layer) shortly after deposition. These snow samples were filtered and analyzed using the Sunset OCEC instrument and the EUSAAR_2 thermal protocol for elemental carbon (EC; a thermal-optical proxy for BC), utilizing previous methods as in Svensson et al. (2016). The BC equivalent mixing ratios derived from the EC analysis were converted to deposition by multiplying the analyzed mass of EC with the snow sampling depth and observed snow density. These deposition amounts were compared to the pre-weighed (administrated) LAP quantities (which was based on the deposition area and weight of LAP). From this comparison, it is evident that only a few percent of the administrated material were deposited onto the snow surface, while the remaining parts were either trapped in the separation step or lost in other parts of the deposition system. The relatively small variation in the efficiency factor of material that end up at the snow surface, however, gives confidence in that the deposition procedure is reproducible, which is important since “A” spots were intended to be undisturbed for the albedo measurements, while the “B” spots were used for the snow pit measurements. The LAP material and amounts are summarized in Table 1. One area was undisturbed and used as the reference albedo spot (Spot 5), while another spot (Spot 6) was intended for the volcanic sand particles, but due to the great size and density of those particles, most of the particles did not pass through the inertial separator and hence did not deposit onto the snow.
The deposition of LAP took place on March 22 and 24 2018, when cold temperatures were prevailing in Sodankylä. The average temperatures were around −10°C (with −20°C as minimum temperature and −3°C as the daily maximum) recorded at the closest automatic weather station (AWS), located at the FMI Sodankylä-Tähtelä observatory 3.6 km south of the SoS2018 site. All ancillary AWS data reported in this study are taken from there. Additional snow albedo and snow depth data are taken from the bog site, which is an additional undistributed peatland that is also part of the observatory, for comparison with our results. Before the deposition phase of the experiment, snow was removed in corridors with a truck from the experimental area to create easy access to the different spots (Figure S1b-c). After completion of the deposition, snow was backfilled into the corridors to generate similar local surface conditions and minimize disturbance of uneven snow in the experimental area during melting. Similarly, in the snow pit observations, snow was removed by hand, after which the pits were backfilled once measurements were completed for that corresponding day.
One snow pit was excavated in the reference snow 1 day before LAP deposition to establish the pre-existing natural conditions in the snowpack. Following LAP deposition at the end of March, snow pit measurements were carried out until the end of April with varying frequency depending on the availability of expert personnel. Due to time demand of completing a full snow pit profile, complete snow pits were only sampled periodically, while the top 20 cm of the snowpack was prioritized when making snow pit observations. These top layers were prioritized as we expected the largest LAP effects to occur in those layers.
The procedure began by defining the horizontal layers of the snowpack manually with a brush and marking them with toothpicks. According to visual appearance of the layers, grain type, grain size, hardness, and wetness were determined following the international standard classification of Fierz et al. (2009). The temperature of the air above the snow (∼10 cm) was recorded, followed by a 5 cm increment temperature profile of the snowpack (with HI98501 Checktemp with accuracy of ±0.2°C). Snow density was measured every 5 cm, with a density cutter and a field scale. After recording the weight of the density snow sample, it was transferred to a sampling bag for storage until melting and filtering of the particulates. For grain size, measurements of SSA (relation to grain size defined in introduction) were conducted in 3–5 cm intervals with the IceCube instrument (Gallet et al., 2009; and further explained in Leppänen et al., 2015). In brief, the instrument utilizes the hemispheric scattered light from a sample of snow using a 1310 nm light source to estimate the SSA and re.
Pyranometers (manufacturers Kipp & Zonen B.V.; with spectral range 285–2800 nm) measuring the upwelling broadband shortwave irradiance were situated over each LAP spot in a metal rack (which was installed in place before the snow season began). In addition, one pyranometer was placed facing upwards to measure the downwelling irradiance (at spot 1A). The albedo of each spot was subsequently taken as the ratio of the upwelling to the downwelling irradiance. It should be noted that the pyranometers were started only on March 26, and thus, the albedo time series does not contain the first couple of days after the LAP had been deposited. For additional information on the viewing angle and influence of the surrounding snow on the albedo, see Svensson et al. (2016). To mitigate systematic differences between the sensors, the observed irradiances were harmonized to the reference signal. This adjustment is described in supplement Section 2. The original data frequency of one reading per minute was averaged over 1 h or 1 day depending on the analysis conducted.
Selected snow samples’ particulates from spot 1B were analyzed with a Scanning electron microscope (SEM, SIGMA-HD|VP Carl Zeiss NTS, Cambridge, United Kingdom), equipped with two energy dispersive X-ray spectroscopy (EDS, Thermo 60 mm2 EDS SDD-detectors, ThermoFisher, Waltham, United States), used for elemental mapping. From the elemental mapping, soot aggregates were identified, and the soot particles were imaged with SEM directly from the aluminum foils on which they had been collected. The images were then analyzed with ImageJ software (Rasband, W.S., ImageJ, U S. National Institutes of Health, Bethesda, Maryland, United States). Each sample is based on between 102 and 254 counted agglomerates for the size distribution data. As the soot agglomerates were non spherical structures, the diameters were obtained by outlining the silhouette of each particle, and the enclosed area was used to calculate a diameter of an equivalent area circle (see example images of the particles in Supplementary Figures S2A–D).
Figures 1A–C presents a temporal variability of albedo (a), snow depth (b), temperature, precipitation amount and type (c) during the campaign. In addition to the airfield measurements, the Tähtelä-Sodankylä observatory bog site albedo and snow depth are also presented. This is to illustrate another natural undisturbed snow site for albedo, and a continuous daily snow depth record, in contrast to the snow depth measurements at the airfield which were only conducted in conjunction with the snow pit observations.
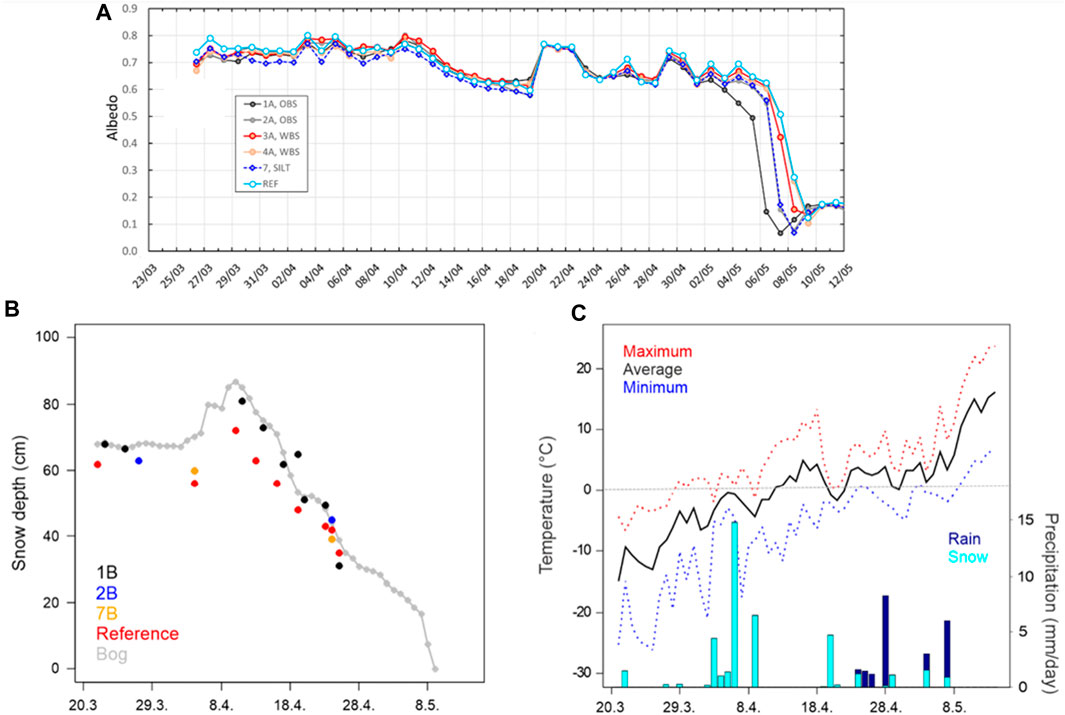
FIGURE 1. Temporal overview of experimental spots’ albedo at solar noon (A), snow depth (B), and temperature and precipitation (C), grey dashed line indicates 0°C.
The overall pattern in albedo is closely linked with temperature variations and precipitation events. Generally, snow depth increases were observed after snowfall events, followed by a subsequent increase in albedo. The albedo increases that are especially prevalent in the earlier parts of the experiment are attributable to clean natural and smaller grained snow being added to the snowpack. At the same time, when new snow (on the order of centimeters) is added to the snowpack, it has the potential to cover the snow layer where the LAP was originally deposited. This may elevate the albedo of the LAP spots to the range of the reference snow albedo, which has also been observed in previous experiments (Svensson et al., 2016).
During about the first third of the campaign the albedos remain relatively stable and around 0.75. The maximum snow depth was observed on April 10, along with comparably high recorded albedo (Figure 1B). The period from April 10 until April 19 was characterized by no precipitation while temperatures steadily increased (e.g., see maximum temperatures reaching 10°C at different times during that time interval, Figure 1C), and subsequent decrease in snow depth. Simultaneously, a general albedo decrease for all spots was observed, since the higher temperatures accelerated snow metamorphism (i.e., snow grain growth) and snowmelt, as also previously observed (Svensson et al., 2016). The albedo thereafter oscillates significantly due to interchangeably precipitation and melt periods. As notes, during most of the campaign until the end of April the albedos at the different spots present similar values. However, at the beginning of May the evolution of the different albedos begin to deviate, and spot 1A is the first spot to reach melt-out.
In comparison to the SoS site albedo patterns, the observatory bog site’s albedo decrease trend mostly closely matched the trend of spot 1A (Figure 1A). More specifically, the bog site albedo was ahead of the LAP spots in initiating the drastic albedo decrease that occurred at the end of the snow season for all spots. On May 6, the albedo had reached 0.27 for the bog site and the MOD had not been reached at that stage yet. For this site, however, the drastic decrease in albedo is because water accumulates during snowmelt at the site and does not have significant runoff. It is therefore the formation of a meltwater pond in late spring that drives the drastic albedo decrease. The fact that the bog site’s albedo decrease matched spot 1A may seem contradictory, at first, considering that the bog site’s albedo did not contain any artificial LAP deposition, but the water accumulation explains this similar pattern.
The difference in MOD for the different spots is plotted as a function of the original deposited LAP amount in Figure 2A. The MOD for each spot is determined by using an albedo minimum at the very end of the season (typically around 0.1, and more on determining this in Section 3.4). These numerical results are outlined in Table 2. For the spots presented in Figure 2A, it is evident that there is statistically significant correlation between the MOD and the original LAP amount (red line). Note that the blue line (in Figure 2A) is only for the two oil-based data points, and thus, is only illustrated in the graph to highlight the expected difference between the LAP on the MOD. Presented in Figure 2B is also the effect on absorbed energy from the different LAP spots. Based on the integrated absorbed energy differences between the LAP spots and reference snow reflectance, the ΔE was determined to similarly be statistically significantly correlated with the original LAP deposition amount (Figure 2B; see details of these calculations in supplement section 4). Two additional data points are also presented in Figure 2B, which are based on modelling that takes into account the measured size distributions of the soot particles (section 3.3). These modelling assumptions and calculations are presented in supplement Section 4. Noteworthy is that these two modelled points are within the same order of magnitude as the observed LAP spots.
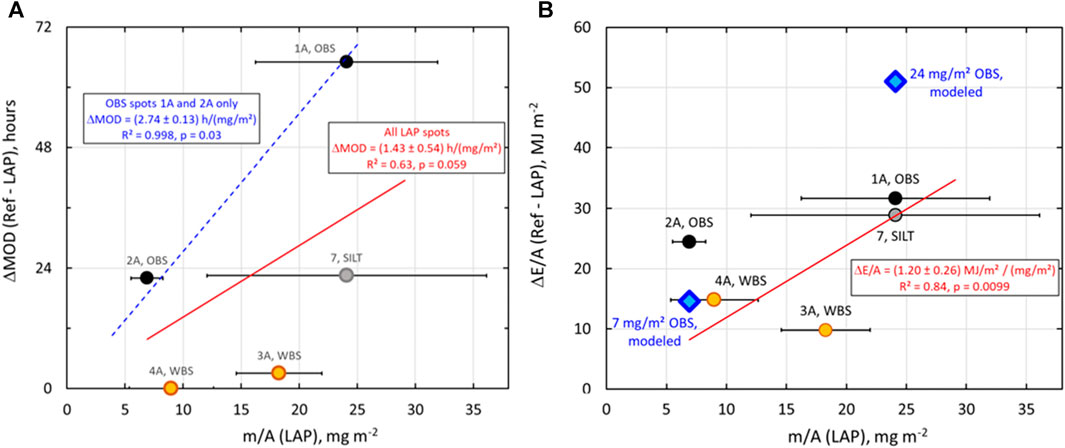
FIGURE 2. Difference in melt-out-date (MOD) as a function of the original areal surface deposition of the LAP spots (A), where the red line displays the correlation (forced through origo) for all LAP spots, while the blue line is the same but only for the two oil-based soot spots. (B) is the integrated absorbed energy differences as a function of the original areal surface deposition of LAP, with the red line highlighting the correlation for all spots.
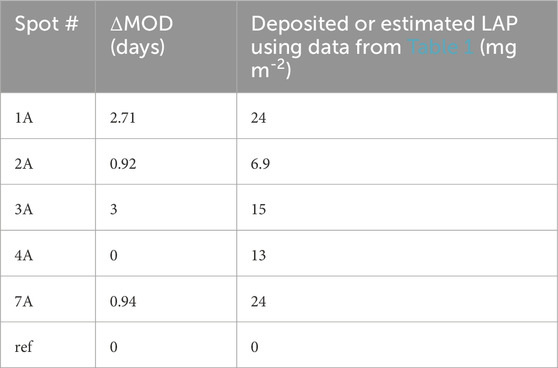
TABLE 2. MOD for the different spots.
The grain size of snow crystals observed during the experiment exhibited a typical seasonal pattern, with a gradual increase in size with time. More specifically, within the snowpack, the grain size was usually smaller at the top, with a gradual increase towards the bottom. However, no systematic difference in grain size between reference snow and doped spots could be detected in the snow pits. Rather, our observations of the snow grain size had similar seasonal growth pattern, independent if the snow had been perturbed or not (Figure S5a-b). This even included the LAP layer in the snow, as well as the snow layer that was placed directly above or below this layer.
Similarly, the snow density had an overall increasing pattern due to snow metamorphism and compaction during the experiment period. New snowfall events interrupted this general pattern, decreasing the density for the uppermost surface layers intermittently during the experiment. Spots that were contaminated with LAP did not show any deviations from the reference snow in our snow pit measurements with respect to the density (Figure S6a-b). In previous experiments, however, our observations led to a hypothesis that elevated LAP amounts lower the density of snow during melting conditions (Meinander et al., 2014). This counterintuitive process for snow densification, which has also been reported in natural snow environments with elevated dust deposition events (Skiles and Painter, 2016), remains to be demonstrated with new observations.
The temperature profiles of the snow, however, displayed a systematic difference between LAP spots and the reference snow. Illustrated in Figure 3A, the temperature profile of the reference snow and the silt spot 7B snow may appear rather similar (especially on April 4 measurements). Note that the silt doped spot is constrained by measurements of only the top 20 cm of the snowpack, while the reference snow had the full profile sampled. The divergence between the temperature profiles is more easily seen in Figure 3B, where ΔT denotes the temperature difference between the reference snow and silt affected snow. On April 4 (visible in black lines) the difference was 0.25°C for the subsurface samples, while in the subsequent observations on April 10 (red lines) a greater difference between the reference snow and the silt snow was observed. The greatest difference was a 1.1°C higher temperature for the silt-laden snow at a depth of 10 cm. The snow pits at the two spots were separated in time, which led to a change in air temperature in between this sampling. However, note that the temperature recording taken above the snow surface, on both displayed occasions, had higher temperatures for the reference snow than the LAP affected snow. This is shown by the negative ΔT for the first points in the top of Figure 3B.
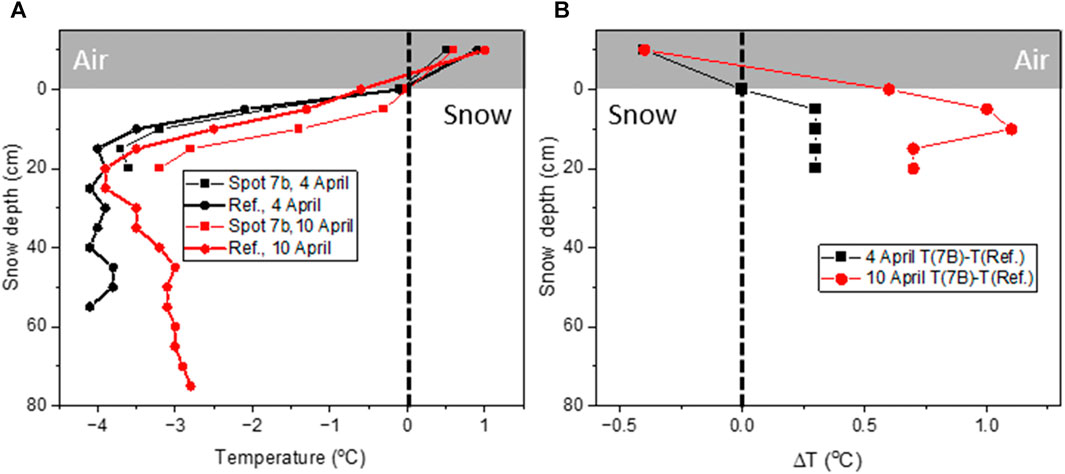
FIGURE 3. Temperature profile from snow pits in the reference and silt snow measured on April 4 and 10 (A) and temperature difference between those profiles (B).
Overall, spot 7B consistently had higher temperatures in the subsurface layers during the times of these observations, and we believe this is attributable to the addition of LAP in the snowpack and the additional energy absorption taking place in the LAP-contaminated snow. Prior to these specific dates of observations (April 4 and 10), we did not observe any differences in the snow temperature profiles between the different spots. This could be due to the fact that the snow had not had enough time to ‘warm’ up from the LAP depositions, and that the solar irradiance was not strong enough yet in the end of March in Sodankylä. Also, snow pit measurements were not conducted between March 27 and April 4, and so therefore it is difficult to precisely pinpoint when there was a difference in the temperature profile between LAP affected snow and the reference snow. The snow observations conducted later in April did not display a distinguishable difference. On April 16 the snowpack of all sampled spots had essentially reached an isothermal state, and significant melting of the snowpack had been ongoing for some days (most certainly in the top layers). Based on climatology, the middle of April usually corresponds to the timing of this melt-onset date in Sodankylä (see e.g., Ström et al., 2023).
The size distribution of BC particles in snow has been reported to be wider, containing larger particles than compared to atmospheric size distributions (Schwarz et al., 2013). Since the size distribution is of great importance for the light absorption occurring in the snowpack, it has been suggested that the presence of the larger sized BC particles may lead to overestimates of the BC forcing in snow of up to 40% (e.g., He et al., 2018). However, other additional measurement studies, utilizing similar detection methods, have not detected the occurrence of larger sized BC particles in their size distributions (e.g., Schnaiter et al., 2019b; Mori et al., 2019; Khan et al., 2020). Inherent difficulties of measuring particles of such vast size ranges persist, and additional research is needed. The size distributions observed with the SEM analysis during SoS2018 temporally for spot 1B samples are presented in Figure 4.
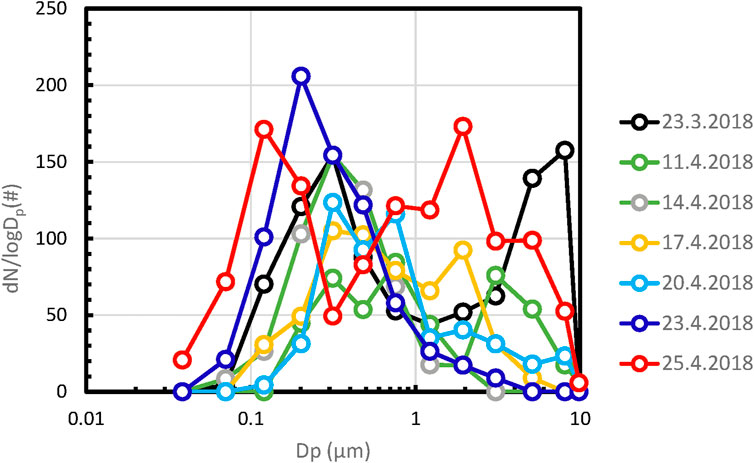
FIGURE 4. Particle number size distribution calculated for the SEM images for soot particles sampled from Spot 1B over the course of the experiment.
In general, there is a tendency of the presence of two modes, one below and one above 1 µm area equivalent diameter. However, there is no obvious systematic trend over the duration of the campaign and each observed distribution is more or less unique. Noteworthy, the two earliest distributions from 23 March and 11 April present clear super micron modes, which could be indicative of large particles already present from the doping of the spot. The last distribution from 25 April, also presents a super micron mode. It is tempting to see this as a possible result of agglomeration, but the distribution only 2 days earlier from 23 April shows no such trace. There are two main drawbacks with the used size distribution measurement technique. Firstly, the statistical uncertainty is very high due to the relatively few particles counted. Secondly, the field of view is limited and a few large particles that may control the mass of LAP in the snow may end up outside the counting domain used here. The latter is corroborated by images from the snow pits that clearly show visible dark specs on the snow surface (Supplementary Figure S7).
The results presented in the sections above point to relatively small changes in snow microphysical properties, albedo and MOD given the relatively large deposition of LAP. Between the reference spot and the most perturbed spot 1A (24 mg m-2), variation in daily average albedo suggests only a few days difference in MOD. This deposition can be compared to the estimated seasonal deposition occurring naturally. If one assumes a mixing ratio in falling snow of 20 ng BC per g snow water equivalent (SWE) (Meinander et al., 2020; Ström et al., 2023), and a seasonal precipitation of 133 mm SWE (Ström et al., 2023), the wet deposition is equal to 0.26 mg m-2. Hence, the perturbation generated by LAP for spot 1A is equivalent to almost 100 seasons of deposition occurring at one time. This is assuming that during the snow season wet deposition is assumed to be significantly greater than dry deposition.
It is evident that the impact on MOD from the perturbations are mitigated by the precipitation occurring especially in early April, which covers the spots with a couple of decimeters of unperturbed snow. Moreover, there was an event during March 21–22, which was right after the LAP deposition for spot 1A (recall that the pyranometer observations started a few days after the LAP perturbation). An additional process that possibly contributed to the similar albedo across all spots is the initial sinking of LAP into the snow that has been observed to occur rather soon after deposition. As also observed in previous experiments (Peltoniemi et al., 2015), during sunshine, the particles sank into the snow within minutes of deposition. This process may effectively have buried the LAP relatively deeper into the snow in combination with the snow fall.
Towards the end of the season the perturbed snow surfaces eventually resurface and the difference in LAP loading between the spots became increasingly important for the absorption of solar energy. The question is if the observed changes in albedo, due to the different LAP perturbations, are consistent with the different MOD? In other words, it remains to be determined whether the different MOD can be explained by the differences in absorbed SW irradiance. Here we further explore this. Important to note is that in Section 3.1 we approached it by integrating the energy difference until the reference snow is melted out. In other words, a large part of the ΔE is the difference between the energy absorbed by the snow-free surface and the reference, due to the difference in MOD. Here we attempt at determining the amount of energy that would be required to end the season for all sites after the first LAP spot has reached MOD. To explore this, hourly averaged irradiance measurements are used (instead of minute values in Section 3.1) to compare the amount of SW energy that is absorbed by each spot between the start of the measurements and the end of the season. Integration of absorbed SW irradiance starts on 26 March 2018. However, to precisely determine the end of the season is not so trivial. After the snow season is clearly over, the different sites converge to a surface albedo of approximately 0.2 (which was used as threshold for the daily averages). But all sites appear to first pass through characteristic minimum, which is about 0.1, before this converging towards a post season albedo takes place (see Supplementary Figure S8 for the detailed evolution of the end of season albedo). It is likely that when the albedo is decreasing past 0.2 towards this minimum, the surface conditions are different from those when the albedo reaches 0.2 again after the minimum. On the decreasing side there is likely a mixture of remnants from the snow and moist soil, whereas on the increasing side all snow is gone, and the soil is drying up. The hour when this minimum is reached and used this time as the end of the season. It should be noted that due to the similar pattern of the albedo evolution at the different sites, a different albedo criterion for the end of the season will mainly shift all the time-stamps in one or the other direction. A shorter season results in smaller estimates in absorbed SW energy and vice versa.
The results from the energy comparison are presented in Figure 5. The first site to melt out at hour 15 on 06 May 2018 is spot 1A spot (most contaminated), which the other sites will be compared to. When the first site melts out, the integrated absorbed SW energy is equal to 173.5 MJ (integrated from the start of the measurements to the end of the season). If the different sites are sharing the same accumulated precipitation and general environment, one would anticipate that the same amount of energy would be required to end the season for all sites (assuming that absorbed SW energy is the controlling factor). By finding the hour closest to 173.5 MJ, the anticipated end time can be determined for the other spots. This ranges from about 15 h later for spot 7A and spot 2A, to about 40 h later for the four other sites (unfilled arrows in Figure 5). However, we note that this is about 1 day earlier than when the season actually ends at the different sites, where the differences between anticipated end time and actual end of season ranges between 18 and 27 h (blue arrows in Figure 5). The extra energy absorbed during these extended seasons range between 11.4 and 18.3 MJ. A possible explanation for this extra day of the season at these spots compared to the anticipated melt-out is a precipitation event that occurs after the season had already ended at spot 1A. The event result in enhanced albedos at all sites. It is even evident for spot 1A, but the enhanced albedo only lasts for an hour or two. The weather station reports a precipitation of 6 mm SWE, which is a mixture of snow and rain. This precipitation amount is compared to the estimated snow melt using the simple relation in Eq. 2 (adapted from Ström et al., 2023 their equation 5),
where ΔSD is the change in snow depth expressed in mm (SWE) and ΔE is the integrated absorbed SW irradiance in expressed in kJ m-2.
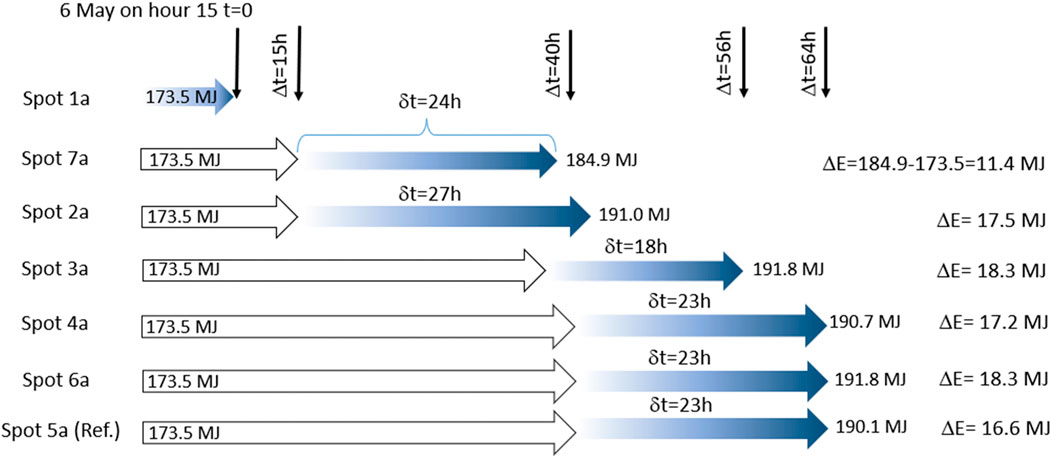
FIGURE 5. The end of the blue arrows indicates the estimated end of the snow season for the different spots based on the characteristic minimum dip in albedo. The unfilled arrows represent the anticipated end of the snow season based on the same integrated absorbed SW irradiance as for spot 1A. The vertical arrows indicate the elapsed time, Δt, from t=0 (6 May at hour 15). The notation δt, indicates the time difference between the anticipated and the estimated end of the season. The notation ΔE, indicates the additional absorbed SW irradiance over the prolonged season during the time δt.
By inserting the extra energy absorbed between the anticipated and actual end of the season for the different sites, ΔE, an equivalent snow melt is calculated from Eq. 2. For five of the sites this ranges between 5 and 5.5 mm and for spot 7A it is less, 3.4 mm SWE.
Based on the results in Table 3 the difference (δt), between the anticipated MOD (assuming same amount of energy required to remove equal amount of snow) and the actual end of the season, is consistent with the last precipitation event that occurred after spot 1A had reached the end of the season. The spots that received this extra precipitation required approximately 1 day to accumulate enough energy to remove extra precipitation equivalent to the reported 6 mm SWE.
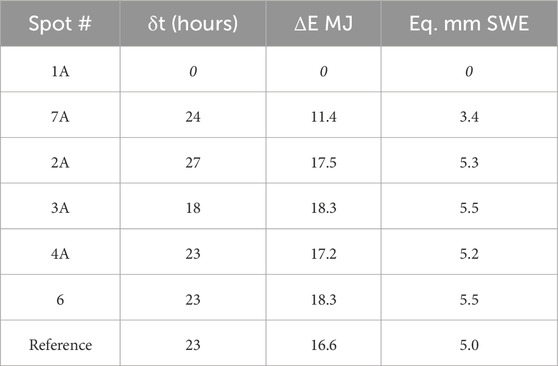
TABLE 3. Summary of times between anticipated and estimated end of the seasons, δt, in relation to spot 1A. The difference in absorbed SW irradiance over the time δt, is denoted ΔE. The equivalent snow melts in SWE based on ΔE are estimated using Eq. 1 (Ström et al., 2023, their Equation 5).
The main objective of the study was to investigate the role of perturbed snow surfaces with various levels of LAP and quantify the impact different perturbations have on the MOD. The deposition of LAP onto the snow surfaces was shown to be reproducible, with pre-weighed amounts of LAP being able to produce nearly identical spots (one used for undisturbed reflectance measurements while the other one was used for destructive snow pit measurements). The results showed that the albedo decay at the end of the season for the different spots were linked to the initial amount and type of LAP that were deposited onto the snowpack.
When considering the details in the evolution of the final stages of the season, which suggests that the differences in MOD between the spots based on daily averages are likely 1 day less than originally estimated due to a late precipitation event. Nevertheless, Figure 2 delivers a main conclusion by showing that a single perturbation event in the end of March corresponding to almost 100 seasons of natural deposition, shifts the MOD by single days only. Shortly after the deposition, the spots were covered by natural snow, which clearly caped the perturbation from interacting significantly with the snowpack. Besides a slight temperature enhancement at the most perturbed site, no systematic differences in BC size distribution, snow grain size, or snow density could be detected.
If the same perturbation had been conducted about 2 weeks later, after the peak in snow depth ca 10 April, it is likely that the impact from the same perturbation would have been greater. This is simply because the perturbed surfaces had been exposed more to the SW irradiance and therefore absorbed more energy. With the current set up it took until the beginning of May for the perturbation to resurface and start to play a role. By that time the season was close to finished in any case. Hence, we conclude that both the amount and timing of the perturbation is important for the net result on MOD and that a large perturbation occurring early in the season may have little effect on the length of the season. Nonetheless, the difference in MOD by a few days for the different LAP spot type and amount of LAP inserted to the blowing system is observed. This seemingly predictable melt-out pattern for the different LAP spots, in terms of amount and LAP type, and followed lastly by the reference snow has to our knowledge not been reported previously. This is consistent with the notion that the darkest albedo has the shortest snow season. Additional experiments are, nonetheless, needed to better constrain the effects of LAP on snow albedo, melt rate, and other associated processes.
All data is available in the Finnish Meteorological Institute open access data base METIS.
JSv: Conceptualization, Data curation, Formal analysis, Funding acquisition, Investigation, Methodology, Writing–original draft, Writing–review and editing. LL: Investigation, Methodology, Writing–review and editing. H-RH: Investigation, Methodology, Writing–review and editing. AK: Investigation, Methodology, Writing–review and editing. Y-cS: Investigation, Methodology, Writing–review and editing. OM: Investigation, Methodology, Writing–review and editing. PD-W: Resources, Writing–review and editing. AM: Investigation, Methodology, Writing–review and editing. EH: Investigation, Methodology, Writing–review and editing. MR: Writing–review and editing. OS: Supervision, Writing–review and editing. JSt: Formal analysis, Writing–review and editing. EA: Funding acquisition, Writing–review and editing. AV: Conceptualization, Formal analysis, Funding acquisition, Investigation, Methodology, Supervision, Writing–review and editing.
The author(s) declare financial support was received for the research, authorship, and/or publication of this article. This work has been supported by the Academy of Finland consortium: “Novel Assessment of Black Carbon in the Eurasian Arctic: From Historical Concentrations and Sources to Future Climate Impacts” (NABCEA project no. 296302), and “Black and Brown Carbon in the Atmosphere and the Cryosphere” (BBrCAC project no. 341271), and the Academy of Finland Flagship (grant no. 337552). This work was also partly funded by Orkurannsóknasjóður (National Power Agency of Iceland). MR is supported by the Academy of Finland research fellow (grant no. 355871).
Pyry and Anita Virkkula are thanked for their various contributions throughout the experiment. Henri Honkanen is acknowledged for his work with the snow pits during the campaign. The municipality of Sodankylä is also acknowledged for their support throughout the experiment. JnS acknowledges the Otto Malm foundation. JhS is part of the Bolin Centre for Climate Research.
The authors declare that the research was conducted in the absence of any commercial or financial relationships that could be construed as a potential conflict of interest.
The author(s) declared that they were an editorial board member of Frontiers, at the time of submission. This had no impact on the peer review process and the final decision.
All claims expressed in this article are solely those of the authors and do not necessarily represent those of their affiliated organizations, or those of the publisher, the editors and the reviewers. Any product that may be evaluated in this article, or claim that may be made by its manufacturer, is not guaranteed or endorsed by the publisher.
The Supplementary Material for this article can be found online at: https://www.frontiersin.org/articles/10.3389/feart.2024.1358155/full#supplementary-material
Beres, N. D., and Moosmüller, H. (2018). Apparatus for dry deposition of aerosols on snow. Atmos. Meas. Tech. 11, 6803–6813. doi:10.5194/amt-11-6803-2018
Beres, N. D., Sengupta, D., Samburova, V., Khlystov, A. Y., and Moosmüller, H. (2020). Deposition of brown carbon onto snow: changes in snow optical and radiative properties. Atmos. Chem. Phys. 20, 6095–6114. doi:10.5194/acp-20-6095-2020
Bond, T. C., Doherty, S. J., Fahey, D. W., Forster, P. M., Berntsen, T., DeAngelo, B. J., et al. (2013). Bounding the role of black carbon in the climate system: a scientific assessment. J. Geophys. Res. Atmos. 118, 5380–5552. doi:10.1002/jgrd.50171
Fierz, C., Armstrong, R., Durand, Y., Etchevers, P., Greene, E., Mc- Clung, D., et al. (2009). The international classification for seasonal snow on the ground, international hydrological programme (IHP) of the united nations educational, scientific and cultural organization (UNESCO). Paris, France: Scientific and Cultural Organization.
Flanner, M. G., Zender, C. S., Randerson, J. T., and Rasch, P. J. (2007). Present-day climate forcing and response from black carbon in snow. J. Geophys. Res. 112, D11202. doi:10.1029/2006JD008003
Gallet, J.-C., Domine, F., Zender, C. S., and Picard, G. (2009). Measurement of the specific surface area of snow using infrared reflectance in an integrating sphere at 1310 and 1550 nm. Cryosphere 3, 167–182. doi:10.5194/tc-3-167-2009
Hadley, O. L., and Kirchstetter, T. W. (2012). Black-carbon reduction of snow albedo. Nat. Clim. Change 2, 437–440. doi:10.1038/nclimate1433
Hansen, J., and Nazarenko, L. (2004). Soot climate forcing via snow and ice albedos. Proc. Natl. Acad. Sci. U.S.A. 101 (2), 423–428. doi:10.1073/pnas.2237157100
He, C., and Flanner, M. (2020). “Snow albedo and radiative transfer: theory, modeling, and parameterization,” in Springer series in light scattering: volume 5: radiative transfer, remote sensing, and light scattering Editor A. Kokhanovsky (Cham: Springer Inter-national Publishing). doi:10.1007/978-3-030-38696-2_3
He, C., Liou, K.-N., and Takano, Y. (2018). Resolving size distribution of black carbon internally mixed with snow: impact on snow optical properties and albedo. Geophys. Res. Lett. 45, 2697–2705. doi:10.1002/2018GL077062
Khan, A. L., Rittger, K., Xian, P., Katich, J., Armstrong, R., Kayastha, R., et al. (2020). Biofuel burning influences refractory black carbon Concentrations in seasonal snow at lower elevations of the dudh koshi river basin of Nepal. Front. Earth Sci. 8, 371. doi:10.3389/feart.2020.00371
Leppänen, L., Kontu, A., Vehviläinen, J., Lemmetyinen, J., and Pulliainen, J. (2015). Comparison of traditional and optical grain-size field measurements with SNOWPACK simulations in a taiga snowpack. J. Glaciol. 61, 151–162. doi:10.3189/2015JoG14J026
Meinander, O., Kontu, A., Kouznetsov, R., and Sofiev, M. (2020). Snow samples combined with long-range transport modeling to reveal the origin and temporal variability of black carbon in seasonal snow in Sodankylä (67°N). Front. Earth Sci. 8. doi:10.3389/feart.2020.00153
Meinander, O., Kontu, A., Virkkula, A., Arola, A., Backman, L., Dagsson-Waldhauserová, P., et al. (2014). Brief communication: light-absorbing impurities can reduce the density of melting snow. Cryosphere 8, 991–995. doi:10.5194/tc-8-991-2014
Mori, T., Goto-Azuma, K., Kondo, Y., Ogawa-Tsukagawa, Y., Miura, K., Hirabayashi, M., et al. (2019). Black carbon and inorganic aerosols in Arctic snowpack. J. Geophys. Res. Atmos. 124, 13325–13356. doi:10.1029/2019JD030623
Painter, T. H., Barrett, A. P., Landry, C. C., Neff, J. C., Cassidy, M. P., Lawrence, C. R., et al. (2007). Impact of disturbed desert soils on duration of mountain snow cover. Geophys. Res. Lett. 34, L12502. doi:10.1029/2007GL030284
Peltoniemi, J. I., Gritsevich, M., Hakala, T., Dagsson-Waldhauserová, P., Arnalds, Ó., Anttila, K., et al. (2015). Soot on Snow experiment: bidirectional reflectance factor measurements of contaminated snow. Cryosphere 9, 2323–2337. doi:10.5194/tc-9-2323-2015
Schnaiter, M., Linke, C., Ibrahim, I., Kiselev, A., Waitz, F., Leisner, T., et al. (2019a). Specifying the light-absorbing properties of aerosol particles in fresh snow samples, collected at the Environmental Research Station Schneefernerhaus (UFS), Zugspitze. Atmos. Chem. Phys. 19, 10829–10844. doi:10.5194/acp-19-10829-2019
Schneider, A., Flanner, M., De Roo, R., and Adolph, A. (2019b). Monitoring of snow surface near-infrared bidirectional reflectance factors with added light-absorbing particles. Cryosphere 13, 1753–1766. doi:10.5194/tc-13-1753-2019
Schwarz, J. P., Gao, R. S., Perring, A. E., Spackman, J. R., and Fahey, D. W. (2013). Black carbon aerosol size in snow. Sci. Rep. 3, 1356. doi:10.1038/srep01356
Skiles, S. M., Flanner, M., Cook, J. M., Dumont, M., and Painter, T. H. (2018). Radiative forcing by light-absorbing particles in snow. Nat. Clim. Change 8, 964–971. doi:10.1038/s41558-018-0296-5
Skiles, S. M., and Painter, T. (2016). Daily evolution in dust and black carbon content, snow grain size, and snow albedo during snowmelt, Rocky Mountains, Colorado. J. Glaciol. 63, 118–132. doi:10.1017/jog.2016.125
Skiles, S. M., and Painter, T. H. (2019). Toward understanding direct absorption and grain size feedbacks by dust radiative forcing in snow with coupled snow physical and radiative transfer modeling. Water Resour. Res. 55, 7362–7378. doi:10.1029/2018WR024573
Ström, J., Svensson, J., Moosmüller, H., Meinander, O., Virkkula, A., Hyvärinen, A., et al. (2023). Snow cover duration in northern Finland and the influence of key variables through a conceptual framework based on observed variations in snow depth. Sci. Total Environ. 903, 166333. doi:10.1016/j.scitotenv.2023.166333
Svensson, J., Ström, J., and Virkkula, A. (2019). Multiple-scattering correction factor of quartz filters and the effect of filtering particles mixed in water: implications for analyses of light absorption in snow samples. Atmos. Meas. Tech. 12, 5913–5925. doi:10.5194/amt-12-5913-2019
Svensson, J., Virkkula, A., Meinander, O., Kivekäs, N., Hannula, H.-R., Järvinen, O., et al. (2016). Soot-doped natural snow and its albedo—results from field experiments. Boreal Env. Res. 21, 481–503.
Tuzet, F., Dumont, M., Lafaysse, M., Picard, G., Arnaud, L., Voisin, D., et al. (2017). A multilayer physically based snowpack model simulating direct and indirect radiative impacts of light-absorbing impurities in snow. Cryosphere 11, 2633–2653. doi:10.5194/tc11-2633-2017
Tuzet, F., Dumont, M., Picard, G., Lamare, M., Voisin, D., Nabat, P., et al. (2020). Quantification of the radiative impact of light-absorbing particles during two contrasted snow seasons at Col du Lautaret (2058 m a.s.l., French Alps). Cryosphere 14, 4553–4579. doi:10.5194/tc-14-4553-2020
Keywords: snow properties, snow albedo, light-absorbing particles, northern Finland, experiments
Citation: Svensson J, Leppänen L, Hannula H-R, Kontu A, Shen Y-c, Meinander O, Dagsson-Waldhauserová P, Mesceriakovas A, Heikkinen E, Ruppel M, Sippula O, Ström J, Asmi E and Virkkula A (2024) Soot-on-snow experiment: artificial deposition of light-absorbing particles onto snow surfaces in 2018. Front. Earth Sci. 12:1358155. doi: 10.3389/feart.2024.1358155
Received: 19 December 2023; Accepted: 12 February 2024;
Published: 26 February 2024.
Edited by:
Avelino Florentino Arellano, University of Arizona, United StatesReviewed by:
Jean-Baptiste Renard, UMR7328 Laboratoire de physique et chimie de l’environnement et de l’Espace (LPC2E), FranceCopyright © 2024 Svensson, Leppänen, Hannula, Kontu, Shen, Meinander, Dagsson-Waldhauserová, Mesceriakovas, Heikkinen, Ruppel, Sippula, Ström, Asmi and Virkkula. This is an open-access article distributed under the terms of the Creative Commons Attribution License (CC BY). The use, distribution or reproduction in other forums is permitted, provided the original author(s) and the copyright owner(s) are credited and that the original publication in this journal is cited, in accordance with accepted academic practice. No use, distribution or reproduction is permitted which does not comply with these terms.
*Correspondence: Jonas Svensson, am9uYXMuc3ZlbnNzb25AZm1pLmZp
Disclaimer: All claims expressed in this article are solely those of the authors and do not necessarily represent those of their affiliated organizations, or those of the publisher, the editors and the reviewers. Any product that may be evaluated in this article or claim that may be made by its manufacturer is not guaranteed or endorsed by the publisher.
Research integrity at Frontiers
Learn more about the work of our research integrity team to safeguard the quality of each article we publish.