 Oliver Meseguer-Ruiz
 Roberto Serrano-Notivoli
 Ignacio Núñez-Hidalgo
 Pablo Sarricolea
94% of researchers rate our articles as excellent or good
Learn more about the work of our research integrity team to safeguard the quality of each article we publish.
Find out more
BRIEF RESEARCH REPORT article
Front. Earth Sci., 12 June 2024
Sec. Hydrosphere
Volume 12 - 2024 | https://doi.org/10.3389/feart.2024.1355443
Droughts are one of the main challenges affecting humanity in a global change context. Due to its spatial configuration, Chile experiences droughts of different severities, from arid to humid climates, ranging from sea level to elevations above 6,000 m above sea level (a.s.l.), but it is still unknown how this phenomenon behaves in distribution, duration and intensity. The goal of this study is to identify how droughts have affected the different climate regions of the country between 1979 and 2019. The Standardized Precipitation Evapotranspiration Index (SPEI), calculated for March and September, at the end of the humid season in the north and center-south of the country, respectively, and calculated at 3-, 6-, 9-, 12- and 24-month, allowed to determine the trends of the drought severity in a 5 × 5 km grid between 1979 and 2019. We found that negative and significant trends, indicating dry conditions, appear mainly in the Andes above 2,000 m a.s.l., where the main water reservoirs are located, affecting all climate types, except Mediterranean ones between 33°S and 38°S. The SPEI indicates general trends towards drier conditions across various elevations and climate types, with more pronounced negative trends in the north and central regions and some positive trends in the south. These trends suggest a significant impact on water availability, and highlight the need for focused policy initiatives to combat drought effects and manage water resources effectively. These findings are of main interest to Chile, one of the world’s leading producers of lithium and copper, with both industries requiring substantial amounts of water for extraction and processing, demanding high water availability in a drier territory.
Droughts have been the cause of hundreds of thousands of victims in the recent past and are expected to be one of the main climate change-induced challenges in the coming decades (IPCC, 2021). These phenomena are expected to significantly increase in intensity, duration, frequency, and spatial coverage by the second half of the 21st century (Brito et al., 2018; Spinoni et al., 2018; Xu et al., 2019; Ault, 2020; Chen et al., 2021), leading to an increase in the proportion of the world’s population affected by these events (Spinoni et al., 2021), and to the impact of such events on economic activities such as food production (Lesk et al., 2016; Immerzeel et al., 2020). Droughts are classified into four types: meteorological, hydrological, agricultural, and socioeconomic, as outlined by Heim Jr (2002) and Mukherjee et al. (2018). Meteorological drought refers to a prolonged period of below-average precipitation, meanwhile agricultural drought affects soil moisture and crop yields, hydrological drought involves reduced water levels in water bodies, and socioeconomic drought impacts the availability and demand of economic goods and social wellbeing. Over the past several decades, research on drought has focused on three main areas. The initial area of study concerns demonstrating how drought indices, which indicate water scarcity and its accumulating impacts, vary (Oguntunde et al., 2017). Globally, it has been identified that, in warmer climates, meteorological and hydrological drought conditions, such as their duration and intensity, are expected to relieve due to higher rainfall, except in Western North America, South America, the Mediterranean, Southern Africa, East Asia, and Australia (Wu et al., 2022). However, as drought evolves from meteorological to hydrological phases, the severity of conditions is likely to increase across most areas. The progression of drought will initially see conditions worsen significantly in most of the world’s regions, but they may subsequently ease as temperatures continue to rise. This suggests that actions to mitigate global warming could help reduce the worsening of drought conditions during their development (Wu et al., 2022). Concerning the spatial distribution of dry areas, such as Southern Europe, Northeast Brazil, Australia, and the Northwest United States, they act as focal points for drought occurrences to nearby areas. Droughts experience coordination within their respective regions but also establish connections with other areas across continents, and sometimes even between hemispheres (Mondal et al., 2023). The connection between these drought centers is similar to the ‘rich-club phenomenon’ found in Network Theory, where the ‘wealthy’ nodes (in this case, the drought centers) are closely linked, forming a network. This suggests the potential for simultaneous, widespread droughts affecting several continents at once (Mondal et al., 2023). Over the past 120 years, meteorological droughts have not displayed significant global changes. However, there appears to be a rising trend in the severity of agricultural and ecological droughts, which is likely due to an increase in the intensity of atmospheric evaporative demand (Vicente-Serrano et al., 2022). In numerous regions worldwide, droughts are currently a prominent natural disaster, particularly given the prevailing climate conditions. Nevertheless, it is acknowledged that the potential for damage is expected to rise in the future due to climate change. This is anticipated to result from the impact of global warming on the frequency of extreme events.
The scale of expenses incurred by droughts, coupled with their regional nature, justifies investing in early warning systems to promptly respond and mitigate their societal impact. In the context of agriculture, it is crucial to consider that severe water shortages result not only from precipitation falling below a specific threshold but also from the intensity of water demand (evapotranspiration) and the moisture available in soils during the growing season. The availability of soil moisture stands out as the most critical factor for meeting plant water requirements. Insufficient water in the root zone can lead to yield reductions and even complete crop failure. Given the regional nature of droughts, their occurrence and intensity exhibit spatial correlations, leading to swift communication of agricultural drought impacts to the regional economy.
Various indices are available for the examination of droughts incorporating climatic variables. Among these, the Standardized Precipitation Evaporation Index (SPEI) stands out as a suitable method to investigate spatially differentiated droughts. The SPEI (Vicente-Serrano et al., 2010; Beguería et al., 2014) considers evapotranspiration data in its formulation and contemplates climatic water balance at different timescales. It involves incorporating temperature as a crucial factor in calculating potential evapotranspiration. The SPEI has been used in different regions of the world, including Asia (Yao et al., 2018; Fu et al., 2019), North America (Asong et al., 2018; Peña-Gallardo et al., 2019), South America (Meza, 2013), and Europe (Tomas-Burguera et al., 2020; Jaagus et al., 2022). Examining the behavior and trends of SPEI is highly intriguing, as they closely align with the surface water balance. This balance encompasses factors such as precipitation and evapotranspiration, with the latter being significantly influenced by temperature.
In this work, we aim to identify the areas of continental Chile presenting significant SPEI changes the significant changes in droughts in continental Chile and their distribution depending on elevation ranges and climate types for the months of March and September for the 1979–2019 period. Analyzing drought anomalies and trends is particularly relevant because they closely correspond to the surface water balance. This balance incorporates elements like precipitation and evapotranspiration, with the latter being notably influenced by temperature. This brief research report aims to depict the spatial and temporal behavior of drought in continental Chile and how it varies depending on elevation ranges and climate types.
Continental Chile contains a large variety of climate types (Sarricolea et al., 2017) (Figure 1). The north of Chile is characterized by arid climates (18ºS to 29ºS), and is one of the driest regions in the world (Meseguer-Ruiz et al., 2020). The central region (30ºS to 42ºS), which contain over 70% of the country’s population, has been in a permanent water deficit since 2010, the so-called megadrought (Garreaud et al., 2017; Garreaud et al., 2020), which has caused reductions in the water levels of different catchments (Alvarez-Garreton et al., 2021), creating adverse effects for landscapes, ecosystems, and human activities (Muñoz et al., 2020; Barría et al., 2021), and has been identified as the most intense in the region since the 16th century. This dry trend has been detected in the central region since the mid-20th century (González-Reyes, 2016), and it is expected to continue, as regional climate projections consistently predict a reduction in mean annual precipitation (by up to 40% relative to current values) for the second half of the 21st century under high emissions scenarios (Bozkurt et al., 2018). Southern Chile (43ºS-56ºS) has the largest reservoirs of fresh water in South America (Reynhout et al., 2019), and severe drought episodes in recent years have compromised human activities in the region, although not with the intensity and duration of the present megadrought (McNamara et al., 2021). The factors behind drought in these regions and the potential spatial variations in their effects remain unknown to us. Such knowledge is especially important because of the extreme inter-annual variability of precipitation and the increase of these events over time (Montecinos and Aceituno, 2003; Montecinos et al., 2011; Garreaud et al., 2020).
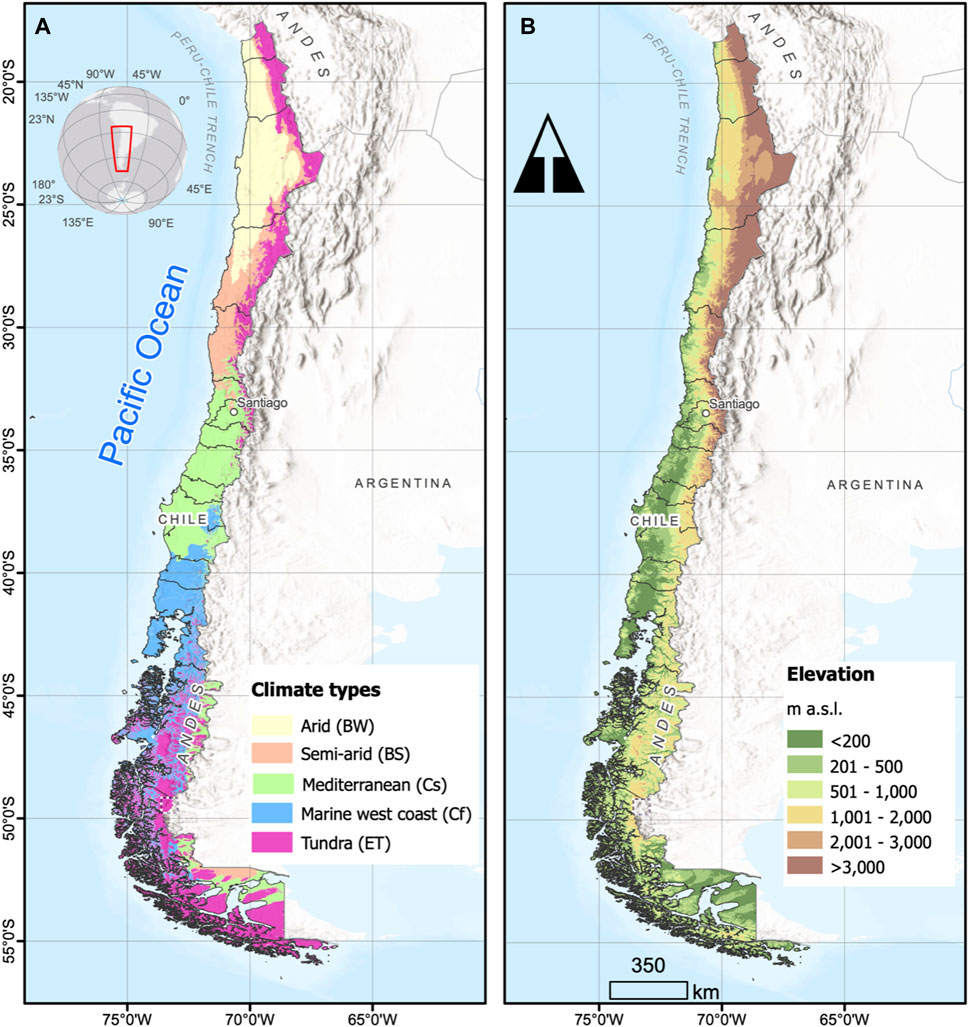
Figure 1. The main climate types (A) and elevation ranges (B) in Chile.
A significant number of Chilean climates exhibit either permanent or quasi-permanent dry conditions, including arid and semi-arid climates, whereas others experience a dry season lasting only a few months. The presence of the Andes Mountain Range with a north-south development allows orographic precipitation, supplying a substantial proportion of the water used in the country (Immerzeel et al., 2020).
The computation of SPEI relies on the long-term records of precipitation and potential evapotranspiration for a specific location and extended period. The calculation method involves transforming one frequency distribution (such as gamma) into another (normal or Gaussian). The initial step in SPEI calculation is the careful selection of a suitable probability distribution (e.g., gamma distribution, incomplete beta distribution, or Pearson III distribution) that accurately fits the long-term precipitation time series, followed by fitting the data to that distribution. These values are then converted into a standard normal distribution with a mean of zero and a variance of one. This standardization facilitates the analysis for the employed time scales.
The SPEI (Vicente-Serrano et al., 2010) considers evapotranspiration data in its formulation and contemplates the climatic water balance at different timescales, which is a great indicator of drought concerning temperature changes, suitable for monitoring the phenomenon in the context of global warming. As the SPEI assigns a single numeric value to the water balance calculated through precipitation and theoretical evapotranspiration, it can be compared across regions with markedly different climates, such as happens in continental Chile. On the other hand, the requirement for a serially complete dataset for both temperature and precipitation may limit its use due to insufficient data being available. Being a monthly index, rapidly developing drought situations may not be identified quickly.
To obtain data for the SPEI products, we used a 5-km resolution gridded monthly temperature and precipitation data from the CR2MET dataset (Boisier et al., 2016) for continental Chile between 1979 and 2019. The dataset corresponds to a statistically downscaled ERA-Interim reanalysis, capturing local moisture and land surface temperature variations through the MODIS sensor. The SPEI utilizes the monthly variance between precipitation and potential evapotranspiration. This constitutes a basic climatic water balance, calculated across various time scales to derive the SPEI. Monthly evapotranspiration was calculated using the Thornthwaite approach (Thornthwaite, 1948). We used all the provided data (1979–2019) as base period for the calculation of the index. Following the original definition of the SPEI, we used a Log-logistic distribution and a fitting method based on unbiased Probability Weighted Moments. We set the kernel as unshifted rectangular, meaning that all the data of the previous n time steps are given equal weight. We calculated each pixel 3-, 6-, 9-, 12-, and 24-month SPEI values in March and September for each of the 59,577 pixels. These months encompass the beginning of the dry and wet seasons in central and southern Chile and the end of the wet and dry seasons in northern Chile, respectively, and are crucial to determine the behavior of precipitation during the different lengths and, therefore, the different intensities of drought in these critical months (Meseguer-Ruiz et al., 2024). The SPEI for n months considers precipitation and temperature values for the current month and the preceding n-1 months.
We calculated the trends of SPEI for each pixel in March and September following the non-parametric Mann-Kendall test (MK) (Mann, 1945; Kendall, 1962), differentiating between positive and significant (PS), positive and non-significant, negative and significant (NS), and negative and non-significant trends. The significant trends magnitudes were calculated following the Sen’s slope method (Sen, 1968). We employed the 95% confidence level to address data variability.
All these trends were then classified according to the third-order climate types of the Köppen-Geiger classification (Arid = BWh and BWk, Semi-arid = BSk, Mediterranean = Csb and Csc, Marine west coast = Cfb and Cfc, and Tundra = ET and ETw) (i.e [19]) and different elevation ranges (0–200 m a.s.l., 201–500 m a.s.l., 501–1,000 m a.s.l., 1,001–2,000 m a.s.l., 2,001–3,000 m a.s.l., and >3,000 m a.s.l.) (Figure 1).
The SPEI shows general dry trends in mostly every region in the world (Liu et al., 2021; Akter et al., 2023; Serkendiz et al., 2024). In Chile, the SPEI behavior shows a general trend through drier conditions in a great part of the study area, affecting a wide range of elevations and every climate type, as it was previously stated for some points by Meza (2013).
The March SPEI 3, 6 and 9 show negative (drier) trends in the north of the study area, ranging between −0.02 and −0.06 (Figure 2) per year. The March SPEI 12 and 24 also exhibit negative trends in central Chile, being more intense for SPEI 24, which also shows positive (wetter) trends in the south. The September SPEI also shows negative trends in the north for 3 to 24, with intense trends to drought in the center of the study area. The September SPEI 6 and 24 also show positive trends in the south.
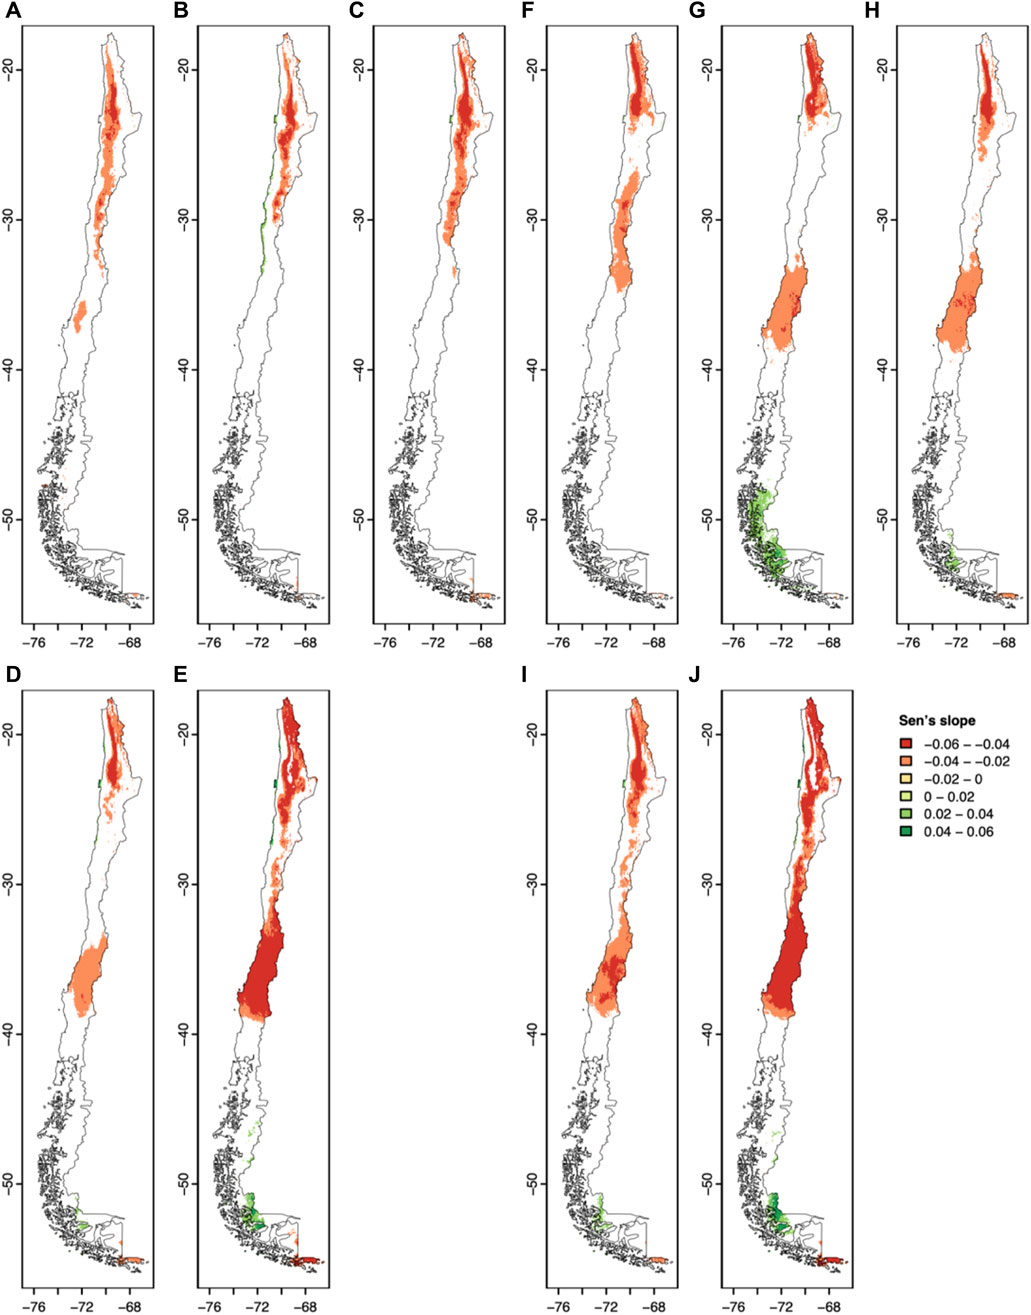
Figure 2. Sen’s slope trends for March SPEI (A) 3, (B) 6, (C) 9, (D) 12, and (E) 24, and September SPEI (F) 3, (G) 6, (H) 9, (I) 12, and (J) 24, per year.
The considered elevation ranges are significantly represented in the study area (Figure 3A). The March SPEI 3 does not show any PS trend but displayed NS trends above 1,001 m a.s.l., 41.3% between 1,001 and 2,000 m a.s.l., 46.5% between 2,001 and 3,000 m a.s.l., and 12.7% above 3,000 m a.s.l. SPEI 6, 9, and 12 show scarce PS trends beneath 1,000 m a.s.l., and SPEI 24 exhibits slightly higher percentages concerning the previous SPEI (5.5% between 0 and 200, 6.8% between 201 and 500, and 4.2% between 501 and 1,000 m a.s.l.). The only PS trend above 1,000 m a.s.l. is reached in SPEI 24 (1.0% between 1,001 and 2,000 m a.s.l.). As for SPEI 3, the SPEI 6, 9, 12, and 24 show substantial percentages for negative trends above 1,000 m a.s.l., especially for the range between 2,001 and 3,000 m a.s.l. (SPEI 24 reaches 87.9%). SPEI 24 also exhibits the highest percentages in PS (5.5%, 6.8%, and 4.2% for ranges 0–200, 201–500, and 501–1,000 m a.s.l. respectively) and NS (30.3%, 24.0%, and 18.5% for the same ranges) trends below 1,000 m a.s.l. NS trends prevail in all ranges, especially above 1,001 m a.s.l., while PS appears below 1,000 m a.s.l., when the March SPEI timescale increases.
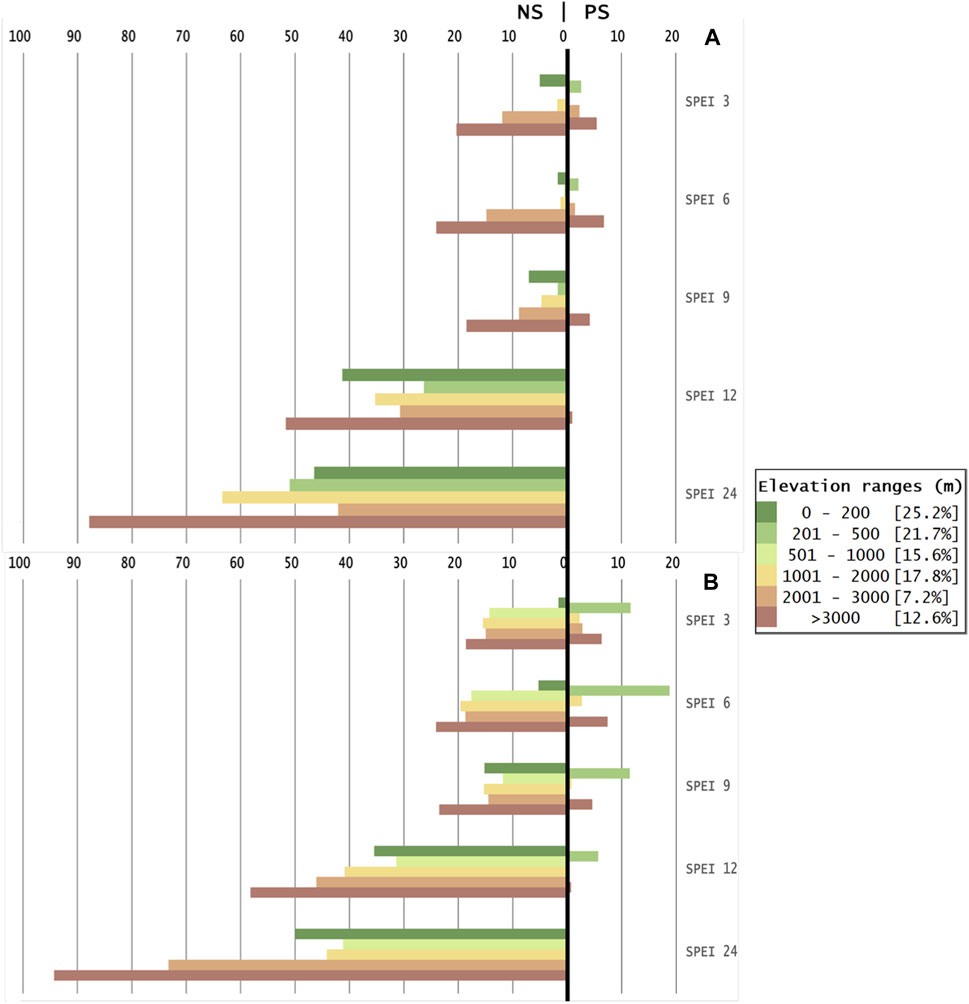
Figure 3. Percentage of negative (NS) and positive (PS) significant trends for the 3-, 6-, 9-, 12- and 24- March (A) and September (B) SPEI per elevation ranges.
The September SPEI 3 by elevation displays PS trends only in the 201–500, 501–1,000, and above 3,000 m a.s.l. elevation ranges (Figure 3B). The highest NS trends are found above 1,000 m a.s.l, especially between 2,001 and 3,000 m a.s.l. (50.0%). SPEI 6 shows PS trends mainly below 1,000 m a.s.l. (13.6% between 0 and 200, 18.8% between 201 and 500, and 11.5% between 501 and 1,000 m a.s.l.). Furthermore, the highest NS trends are found above 1,001 m a.s.l.: 31.4% between 1,001 and 2,000, 41.2% between 2,001 and 3,000, and 32.0% above 3,000 m a.s.l. The SPEI 9 only exhibits PS trends below 1,000 m a.s.l., mainly below 500 m a.s.l.: 2.3% between 0 and 200, and 2.7% below 201 and 500 m a.s.l. The NS trends are more important above 1,001 m a.s.l.: 40.9% between 1,001 and 2,000 m a.s.l., 44.2% between 2,001 and 3,000 m a.s.l. SPEI 12 shows very similar PS trends to SPEI 9 and NS trends, which show a higher ratio above 3,000 m a.s.l. (39.2%). The SPEI 24 exhibits PS trends below 1,000 m a.s.l., but with higher values than SPEI 6 and 9. All the elevation ranges display NS trends, especially the 2,001–3,000 m a.s.l. range (94.3%). As for the case of the March SPEI, the September SPEI shows NS trends in all elevation ranges, especially above 1,001 m a.s.l. The percentages are higher when the SPEI timescale increases, while the same happens with PS.
All the climate types are well represented, except for Hot Desert climate (BWh), which only covers 1% of the territory (Figure 4A). The March SPEI 3 only shows PS in Arid (BWh, 0.3%) and Semi-arid climates (BSk, 0.1%) but exhibits NS trends in all the climate types, especially in Arid (BWh, 64.6% and BWk, 58.3%), Semi-arid (BSk, 28.1%) and Mediterranean (Csb, 13.8%) climates. SPEI 6 shows PS trends in Arid (BWh, 6% and BWk, 1.0%), Semi-arid (BSk, 6.6%) and Mediterranean (Csb, 1.5%) climate types, while NS trends are found in Arid (BWh, 43.7% and BWk, 47.4%), Semi-arid (BSk, 21%) and Tundra (ET, 15.0%) climate types. SPEI 9 shows PS trends in Arid (BWh, 3.8% and BWk, 0.6%) and NS trends in all climate types except marine west coast (Cfb and Cfc). The climates with the most changes correspond to Arid (BWk, 57.7% and BWh, 48.9%), Semi-arid (BSk, 35.4%) and Tundra (ETw, 32.0%). SPEI12 exhibits PS trends in six climate types, with Arid (BWh, 7.3%) and Mediterranean (Csc, 3.6%) climate types showing the highest change ratio. NS trends are observed in all climate types, but the main changes are reached in Arid (BWh, 46.5% and BWk, 34.9%), Mediterranean (Csb, 52.1% and Csc, 23.6%) and Tundra climates (ETw, 44.2%). SPEI 24 shows PS trends in all climate types except Tundra (ETw) climates. The most remarkable changes are found in Arid (BWh, 10.1%) and Mediterranean (Csc, 13.9%) climates. NS trends are found in all climate types, the highest values happen in Arid (BWh, 44.9% and BWk, 60.5%), Mediterranean (Csb, 91.1%) and Tundra (ETw, 72.8%) climates.
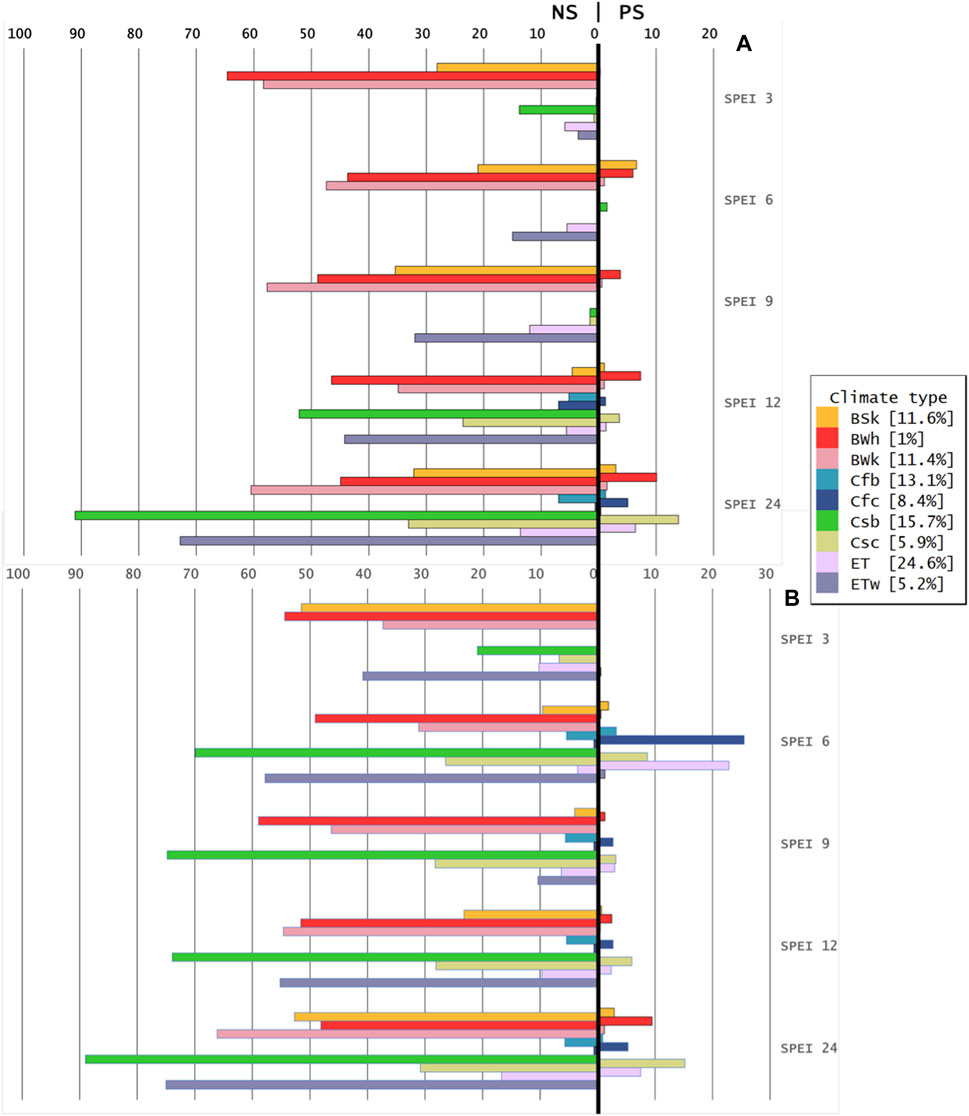
Figure 4. The percentage of negative (NS) and positive (PS) significant trends for the 3-, 6-, 9-, 12-, and 24- March (A) and September (B) SPEI per climate type.
As for elevation ranges, NS trends are higher than PS, especially for Arid and Semi-arid climates. NS trends appear more in Mediterranean (Cs and Cf) and Tundra (ET) climates when the SPEI timescale increases.
The September SPEI 3 exhibits minimal PS trends in Arid (BWk, 0.1%) and Tundra (ET, 0.2% and ETw, 0.6%) climate types but shows NS trends in seven climate types, being those with higher changes in the Arid (BWh, 54.4 and BWk, 37.3%), Semi-arid (BSk, 51.5%) and Tundra (ETw, 40.8%) climates (Figure 4B). SPEI 6 shows both PS and NS trends in all climates. The most changing types in PS trends are Marine west coast (Cfc, 25.5%) and Tundra (ET, 22.8%) climate types, while NS climate types are Arid (BWh, 49.1% and BWk, 31.1%), Mediterranean (Csb, 69.9%) and Tundra (ETw, 57.8%). SPEI 9 shows PS trends in six climate types, the most changing are the Mediterranean (Csc, 3.2%), the marine west coast (Cfc, 2.7%) and the Tundra (ET, 3.0%) climates. NS trends are found in all climate types, especially in Arid (BWh, 58.9% and BWk, 46.3%) and Mediterranean (Csb, 74.8%) climate types. SPEI 12 exhibits changes in the same climate types as SPEI 9, mainly in Arid (BWh, 2.5%), Mediterranean (Csc, 6.0%) and marine west coast (Cfc, 2.7%) climate types for PS trends, and Arid (BWh, 51.6% and BWk, 54.6%), Mediterranean (Csb, 73.9%) and Tundra (ETw, 55.2%) climate types for NS trends. Finally, SPEI 24 shows significant positive and negative trends in almost all climate types. PS is higher in Mediterranean (Csc, 15.2%) and Tundra (ET, 7.5%) climate types, and NS correspond to Arid (BWk, 66.1%), Semi-arid (BSk, 52.7%), Mediterranean (Csb, 89.0%) and Tundra (ETw, 75.5%). The September SPEI shows higher NS than PS for all climate types and SPEI timescales, except for Mediterranean (Csb and Csc) climates.
The major part of the detected significant trends shows a change to drier climates, mainly in the north and center of the country, with also few areas with trends to wetter climates in the south (Garreaud et al., 2017; Garreaud et al., 2020). Concerning climate types, we found that all types tend to become drier, including those that were already considered arid (arid and semi-arid climates). The warming trends mainly explain this, and for Mediterranean (Cs types), Marine west coast (Cf types), and Tundra (ET and ETw) climate types (Meseguer-Ruiz et al., 2018), also coinciding with altitudinal ranges above 1,001 m a.s.l. More droughts are explained by the combined effects of the increase in temperatures and the decrease in precipitations (Garreaud, 2018; Fuentealba et al., 2021). The September SPEI considers the drought severity at the end of the wet season in Central and Southern Chile and at the end of the dry season in the north. Results are similar to those detected for the different March SPEI but show more negative trends in central Chile for SPEI 6 to 24. These results agree with the advance of the arid climate southward for the central zone of Chile (Alvarez-Garreton et al., 2021). The latter is coherent with the findings regarding the detected decrease in precipitation availability, especially in winter, over the last two decades. Positive and significant trends in the south, mainly for SPEI 6, could be linked to more wet winters around 50°S in the last few years.
The SPEI shows major trends to drier climates in all climate types and elevation ranges. The higher intensities of the drying trends are found in the north and central regions. The SPEI identifies these trends in both March and September. For the March SPEI3, the prevailing trend noted lies predominantly within the Atacama Desert, characterized by its arid structural conditions. These arid conditions correspond to the conclusion of the wet season in the northern region (December to March), marked by scanty rainfall and insignificantly changing patterns observed across numerous meteorological stations (Meseguer-Ruiz et al., 2020). The discernible rise in temperatures significantly contributes to this NS SPEI trend, as escalating temperatures disrupt the regularity of annual precipitation, resulting in a pronounced scarcity of rainfall, particularly in elevated terrains (Meseguer-Ruiz et al., 2018). Similar aridity-related explanations elucidate NS trends detected in northern regions across other temporal scales (Meza, 2013). The negative SPEI trends observed in central Chile during March and September align with the megadrought episodes identified in prior studies (Garreaud et al., 2017; Garreaud et al., 2020). This megadrought signal manifests through a consistent reduction in precipitation (Fuentealba et al., 2021). Given the notable consistencies among various trends, it is anticipated that warming temperatures play a negligible role in influencing drought severity. The positive and significant trends identified along the coastal fringe of the north during the early 21st century’s first decade may be attributed to the negative phase of the PDO, potentially explained by cooler temperatures (Guan et al., 2017; Medhaug et al., 2017).
Trends towards drier conditions at higher elevations compromise water availability in a country where trade in water for the extractive industry at these altitudes is key to the economy. It may also condition the ability to supply the region’s towns subject to industrial and mining water demands. The detected trends can help policymakers to focus on local and delimited initiatives against drought effects. Water scarcity or availability should be considered as a key point in the elaboration of national and regional politics of territorial planning and industrial or agricultural activities development. It may be interesting to determine if these drier trends are induced by rising temperatures or by precipitation decline. Also, as climate modes impact in these two variables, they may affect especially in drought intensities, it would be crucial to explore their spatial correlations with the SPEI index.
In conclusion, the SPEI analysis reveals an overarching shift toward drier conditions throughout Chile, affecting multiple elevations and climates, with the most significant drying trends observed in the northern and central areas, and occasional wetter trends in the southern parts. This drying trend underscores the pressing need for strategic policies aimed at drought mitigation and sustainable water management to address the growing challenges of water scarcity. Moreover, the identification of spatially differentiated trends of droughts reflects the need to undertake local analysis of this phenomenon, particularly in areas with a high variety of climate types.
The raw data supporting the conclusion of this article will be made available by the authors, without undue reservation.
OM-R: Conceptualization, Formal Analysis, Funding acquisition, Investigation, Methodology, Supervision, Writing–original draft, Writing–review and editing. RS-N: Conceptualization, Formal Analysis, Supervision, Writing–review and editing. IN-H: Data curation, Formal Analysis, Methodology, Writing–review and editing. PS: Formal Analysis, Supervision, Validation, Writing–review and editing.
The author(s) declare that financial support was received for the research, authorship, and/or publication of this article. This research was funded by the ANID FONDECYT Project 1200681 and ANID FSEQ210021. RS-N is supported by grant RYC 2021-034330-I funded by MCIN/AEI/10.13039/501100011033 and by “European Union Next-Generation EU/PRTR.” IN-H is supported by the National Agency for Research and Development (ANID)/Scholarship Program/CONICYT-PFCHA/Doctorado Nacional/2020-21201096. PS is supported by the ANID FONDAP 1523A0002 project.
The authors want to thank the ANID FONDECYT Project 1200681, the ANID FSEQ210021 project, and the ANID-MILENIO-NCS2022_009 project.
The authors declare that the research was conducted in the absence of any commercial or financial relationships that could be construed as a potential conflict of interest.
All claims expressed in this article are solely those of the authors and do not necessarily represent those of their affiliated organizations, or those of the publisher, the editors and the reviewers. Any product that may be evaluated in this article, or claim that may be made by its manufacturer, is not guaranteed or endorsed by the publisher.
Akter, M. L., Rahman, Md.N., Azim, S. A., Rony, Md.R. H., Sohel, Md.S., and Abdo, H. G. (2023). Estimation of drought trends and comparison between SPI and SPEI with prediction using machine learning models in rangpur, Bangladesh. Geol. Ecol. Landscapes, 1–15. doi:10.1080/24749508.2023.2254003
Alvarez-Garreton, C., Boisier, J. P., Garreaud, R., Seibert, J., and Vis, M. (2021). Progressive water deficits during multiyear droughts in basins with long hydrological memory in Chile. Hydrol. Earth Syst. Sc. 25, 429–446. doi:10.5194/hess-25-429-2021
Asong, Z. E., Wheater, H. S., Bonsal, B., Razavi, S., and Kurkute, S. (2018). Historical drought patterns over Canada and their teleconnec-tions with large-scale climate signals. Hydrol. Earth Syst. Sci. 22, 3105–3124. doi:10.5194/hess-22-3105-2018
Ault, T. R. (2020). On the essentials of drought in a changing climate. Science 368, 256–260. doi:10.1126/science.aaz5492
Barría, P., Chadwick, C., Ocampo-Melgar, A., Galleguillos, M., Garreaud, R., Díaz-Vasconcellos, R., et al. (2021). Water management or megadrought: what caused the Chilean Aculeo Lake drying? Reg. Environ. Change 21, 19. doi:10.1007/s10113-021-01750-w
Beguería, S., Vicente-Serrano, S. M., Reig, F., and Latorre, B. (2014). Standardized precipitation evapotranspiration index (SPEI) revisit-ed: parameter fitting, evapotranspiration models, tools, datasets and drought monitoring. Int. J. Climatol. 34, 3001–3023. doi:10.1002/joc.3887
Boisier, J. P., Rondanelli, R., Garreaud, R. D., and Muñoz, F. (2016). Anthropogenic and natural contributions to the Southeast Pacific pre-cipitation decline and recent megadrought in Central Chile. Geophys. Res. Let. 43, 413–421. doi:10.1002/2015GL067265
Bozkurt, D., Rojas, M., Boisier, J. P., and Valdivieso, J. (2018). Projected hydroclimate changes over Andean basins in Central Chile from downscaled CMIP5 models under the low and high emission scenarios. Clim. Change 150, 131–147. doi:10.1007/s10584-018-2246-7
Brito, S. S. B., Cunha, A. P. M. A., Cunningham, C. C., Alvalá, R. C., Marengo, J. A., and Carvalho, M. A. (2018). Frequency, duration and severity of drought in the Semiarid Northeast Brazil region. Int. J. Climatol. 38, 517–529. doi:10.1002/joc.5225
Chen, L., Wang, G., Miao, L., Gnyawali, K. R., Li, S., Amankwah, S. O. Y., et al. (2021). Future drought in CMIP6 projections and the socioeconomic impacts in China. Int. J. Climatol. 41, 4151–4170. doi:10.1002/joc.7064
Fu, J., Niu, J., Kang, S., Adeloye, A. J., and Du, T. (2019). Crop production in the Hexi Corridor challenged by future climate change. J. Hydrol. 579, 124197. doi:10.1016/j.jhydrol.2019.124197
Fuentealba, M., Bahamóndez, C., Sarricolea, P., Meseguer-Ruiz, O., and Latorre, C. (2021). The 2010–2020 'megadrought' drives reduction in lake surface area in the Andes of central Chile (32º - 36ºS). J. Hydrol. Reg. Stud. 38, 100952. doi:10.1016/j.ejrh.2021.100952
Garreaud, R. D. (2018). Record-breaking climate anomalies lead to severe drought and environmental disruption in western Patagonia in 2016. Clim. Res. 74, 217–229. doi:10.3354/cr01505
Garreaud, R. D., Alvarez-Garreton, C., Barichivich, J., Boisier, J. P., Christie, D., Galleguillos, M., et al. (2017). The 2010–2015 megadrought in central Chile: impacts on regional hydroclimate and vegetation. Hydrol. Earth Syst. Sci. 21, 6307–6327. doi:10.5194/hess-21-6307-2017
Garreaud, R. D., Boisier, J. P., Rondanelli, R., Montecinos, A., Sepúlveda, H. H., and Veloso-Aguila, D. (2020). The Central Chile Mega Drought (2010–2018): a climate dynamics perspective. Int. J. Climatol. 40, 421–439. doi:10.1002/joc.6219
González-Reyes, Á. (2016). Ocurrencia de eventos de sequías en la ciudad de Santiago de Chile desde mediados del siglo XIX. Rv. Geogr. Norte Gd. 64, 21–32. doi:10.4067/S0718-34022016000200003
Guan, X., Huang, J., and Guo, R. (2017). Changes in aridity in response to the global warming hiatus. J. Meteorol. Res. 31, 117–125. doi:10.1007/s13351-017-6038-1
Heim, R. R. (2002). A review of twentieth-century drought indices used in the United States. B Am. Meteorol. Soc. 83 (8), 1149–1166. doi:10.1175/1520-0477-83.8.1149
Immerzeel, W. W., Lutz, A. F., Andrade, M., Bahl, A., Biemans, H., Bolch, T., et al. (2020). Importance and vulnerability of the world’s water towers. Nature 577, 364–369. doi:10.1038/s41586-019-1822-y
IPCC (2021). Climate change 2021: the physical science basis. Contribution of working group I to the sixth assessment report of the intergovernmental panel on climate change. Cambridge: Cambridge University Press.
Jaagus, J., Aasa, A., Aniskevich, S., Boincean, B., Bojariu, R., Briede, A., et al. (2022). Long-term changes in drought indices in eastern and central Europe. Int. J. Climatol. 42, 225–249. doi:10.1002/joc.7241
Lesk, C., Rowhani, P., and Ramankutty, N. (2016). Influence of extreme weather disasters on global crop production. Nature 529, 84–87. doi:10.1038/nature16467
Liu, C., Yang, C., Yang, Q., and Wang, J. (2021). Spatiotemporal drought analysis by the standardized precipitation index (SPI) and standardized precipitation evapotranspiration index (SPEI) in Sichuan Province, China. Sci. Rep. 11, 1280. doi:10.1038/s41598-020-80527-3
Mann, H. B. (1945). Nonparametric tests against trend. Econometrica 13, 245–259. doi:10.2307/1907187
McNamara, I., Nauditt, A., Zambrano-Bigiarini, M., Ribbe, L., and Hann, H. (2021). Modelling water resources for planning irrigation development in drought-prone southern Chile. Int. J. .Water Resour. D. 37, 793–818. doi:10.1080/07900627.2020.1768828
Medhaug, I., Stolpe, M., Fischer, E., and Knutti, R. (2017). Reconciling controversies about the global warming hiatus. Nature 545, 41–47. doi:10.1038/nature22315
Meseguer-Ruiz, O., Cortesi, N., Guijarro, J. A., and Sarricolea, P. (2020). Weather regimes linked to daily precipitation anomalies in Northern Chile. Atmos. Res. 236, 104802. doi:10.1016/j.atmosres.2019.104802
Meseguer-Ruiz, O., Ponce-Philimon, P. I., Quispe-Jofré, A. S., Guijarro, J. A., and Sarricolea, P. (2018). Spatial behaviour of daily observed extreme temperatures in Northern Chile (1966-2015): data quality, warming trends, and its orographic and latitudinal effects. Stoch. Env. Res. Risk A 32, 3503–3523. doi:10.1007/s00477-018-1557-6
Meseguer-Ruiz, O., Serrano-Notivoli, R., Aránguiz-Acuña, A., Fuentealba, M., Nuñez-Hidalgo, I., Sarricolea, P., et al. (2024). Comparing SPI and SPEI to detect different precipitation and temperature regimes in Chile throughout the last four decades. Atmos. Res. 297, 107085. doi:10.1016/j.atmosres.2023.107085
Meza, F. J. (2013). Recent trends and ENSO influence on droughts in Northern Chile: an application of the standardized Precipitation Evapotranspiration Index. Weather Clim. Extrem. 1, 51–58. doi:10.1016/j.wace.2013.07.002
Mondal, S., Mishra, A. K., Leung, R., and Cook, B. (2023). Global droughts connected by linkages between drought hubs. Nat. Commun. 14, 144. doi:10.1038/s41467-022-35531-8
Montecinos, A., and Aceituno, P. (2003). Seasonality of the ENSO-related rainfall variability in Central Chile and associated circula-tion anomalies. J. Clim. 16, 281–296. doi:10.1175/1520-0442(2003)016<0281:SOTERR>2.0.CO,2
Montecinos, A., Kurgansky, M. V., Muñoz, C., and Takahashi, K. (2011). Non-ENSO interannual rainfall variability in central Chile dur-ing austral winter. Theor. Appl. Climatol. 106, 557–568. doi:10.1007/s00704-011-0457-1
Mukherjee, S., Mishra, A., and Trenberth, K. E. (2018). Climate change and drought: a perspective on drought indices. Curr. Clim. Change Rep. 4 (2), 145–163. doi:10.1007/s40641-018-0098-x
Muñoz, A. A., Klock-Barría, K., Alvarez-Garreton, C., Aguilera-Betti, I., González-Reyes, Á., Lastra, J. A., et al. (2020). Water crisis in Petorca Basin, Chile: the combined effects of a mega-drought and water management. Water 12, 648. doi:10.3390/w12030648
Oguntunde, P. G., Abiodun, B. J., and Lischeid, G. (2017). Impacts of climate change on hydro-meteorological drought over the volta basin, west Africa. Glob. Planet Change 155, 121–132. doi:10.1016/j.gloplacha.2017.07.003
Peña-Gallardo, M., Vicente-Serrano, S. M., Hannaford, J., Lorenzo-Lacruz, J., Svoboda, M., Domínguez-Castro, F., et al. (2019). Complex influences of meteorological drought time-scales on hydrological droughts in natural basins of the contiguous Unites States. J. Hydrol. 568, 611–625. doi:10.1016/j.jhydrol.2018.11.026
Reynhout, S. A., Sagredo, E. A., Kaplan, M. R., Aravena, J. C., Martini, M. A., Moreno, P. I., et al. (2019). Holocene glacier fluctuations in Patagonia are modulated by summer insolation intensity and paced by Southern Annular Mode-like variability. Quat. Sci. Rev. 220, 178–187. doi:10.1016/j.quascirev.2019.05.029
Sarricolea, P., Herrera-Ossandon, M. J., and Meseguer-Ruiz, O. (2017). Climatic regionalisation of continental Chile. J. Maps 13, 66–73. doi:10.1080/17445647.2016.1259592
Sen, P. K. (1968). Estimates of the regression coefficient based on kendall's tau. J. Am. Stat. Assoc. 63, 1379–1389. doi:10.2307/2285891
Serkendiz, H., Tatli, H., Kılıç, A., Çetin, M., and Sungur, A. (2024). Analysis of drought intensity, frequency and trends using the SPEI in Turkey. Theor. Appl. Climatol. 155, 2997–3012. doi:10.1007/s00704-023-04772-y
Spinoni, J., Barbosa, P., Bucchignani, E., Cassano, J., Cavazos, T., Cescatti, A., et al. (2021). Global exposure of population and land-use to meteorological droughts under different warming levels and SSPs: a CORDEX-based study. Int. J. Climatol. 41, 6825–6853. doi:10.1002/joc.7302
Spinoni, J., Vogt, J. V., Naumann, G., Barbosa, P., and Dosio, A. (2018). Will drought events become more frequent and severe in Europe? Int. J. Climatol. 38, 1718–1736. doi:10.1002/joc.5291
Thornthwaite, C. W. (1948). An approach toward a rational classification of climate. Geogr. Rev. 38 (1), 55–94. doi:10.2307/210739
Tomas-Burguera, M., Vicente-Serrano, S. M., Peña-Angulo, D., Domínguez-Castro, F., Noguera, I., and El and Kenawy, A. (2020). Global characterization of the varying responses of the standardized precipitation evapotranspiration index to atmospheric evaporative demand. J. Geophys. Res-Atmos. 125, e2020JD033017. doi:10.1029/2020JD033017
Vicente-Serrano, S. M., Beguería, S., and López-Moreno, J. I. (2010). A multiscalar drought index sensitive to global warming: the standardized precipitation evapotranspiration index. J. Clim. 23, 1696–1718. doi:10.1175/2009JCLI2909.1
Vicente-Serrano, S. V., Peña-Angulo, D., Beguería, S., Domínguez-Castro, F., Tomás-Burguera, M., Noguera, I., et al. (2022). Global drought trends and future projections. Philos. T R. Soc. A 380, 20210285. doi:10.1098/rsta.2021.0285
Wu, G., Chen, J., Shi, X., Kim, J. S., Xia, J., and Zhang, L. (2022). Impacts of global climate warming on meteorological and hydrological droughts and their propagations. Earths Future 10, e2021EF002542. doi:10.1029/2021EF002542
Xu, L., Chen, N., and Zhang, X. (2019). Global drought trends under 1.5 and 2 °C warming. Int. J. Climatol. 39, 2375–2385. doi:10.1002/joc.5958
Keywords: Chile, climate types, drought, elevation ranges, SPEI
Citation: Meseguer-Ruiz O, Serrano-Notivoli R, Núñez-Hidalgo I and Sarricolea P (2024) General dry trends according to the standardized precipitation evapotranspiration index in mainland Chile. Front. Earth Sci. 12:1355443. doi: 10.3389/feart.2024.1355443
Received: 13 December 2023; Accepted: 22 May 2024;
Published: 12 June 2024.
Edited by:
Daniele Ganora, Polytechnic University of Turin, ItalyReviewed by:
Zerouali Bilel, University of Chlef, AlgeriaCopyright © 2024 Meseguer-Ruiz, Serrano-Notivoli, Nuñez-Hidalgo and Sarricolea. This is an open-access article distributed under the terms of the Creative Commons Attribution License (CC BY). The use, distribution or reproduction in other forums is permitted, provided the original author(s) and the copyright owner(s) are credited and that the original publication in this journal is cited, in accordance with accepted academic practice. No use, distribution or reproduction is permitted which does not comply with these terms.
*Correspondence: Oliver Meseguer-Ruiz, b21lc2VndWVyQGFjYWRlbWljb3MudXRhLmNs
Disclaimer: All claims expressed in this article are solely those of the authors and do not necessarily represent those of their affiliated organizations, or those of the publisher, the editors and the reviewers. Any product that may be evaluated in this article or claim that may be made by its manufacturer is not guaranteed or endorsed by the publisher.
Research integrity at Frontiers
Learn more about the work of our research integrity team to safeguard the quality of each article we publish.