 Kerri L. Minatre
 Monica M. Arienzo
 Hans Moosmüller
 S. Yoshi Maezumi
- 1Division of Hydrologic Sciences, Desert Research Institute, Reno, NV, United States
- 2Ecology, Evolution and Conservation Biology Program, University of Nevada, Reno, NV, United States
- 3Division of Atmospheric Sciences, Desert Research Institute, Reno, NV, United States
- 4Department of Archaeology, Max Planck Institute of Geoanthropology, Jena, Germany
The duration and maximum combustion temperature of vegetation fires are important fire properties with implications for ecology, hydrology, hazard potential, and many other processes. Directly measuring maximum combustion temperature during vegetation fires is difficult. However, chemical transformations associated with temperature are reflected in the chemical properties of charcoals (a by-product of fire). Therefore, charcoal could be used indirectly to determine the maximum combustion temperature of vegetation fires with application to palaeoecological charcoal records. To evaluate the reliability of charcoal chemistry as an indicator of maximum combustion temperature, we studied the chemical properties of charcoal formed through two laboratory methods at measured temperatures. Using a muffle furnace, we generated charcoal from the woody material of ten different tree and shrub species at seven distinct peak temperatures (from 200°C to 800°C in 100°C increments). Additionally, we simulated more natural combustion conditions by burning woody material and leaves of four tree species in a combustion facility instrumented with thermocouples, including thermocouples inside and outside of tree branches. Charcoal samples generated in these controlled settings were analyzed using Fourier Transform Infrared (FTIR) spectroscopy to characterize their chemical properties. The Modern Analogue Technique (MAT) was employed on FTIR spectra of muffle furnace charcoal to assess the accuracy of inferring maximum pyrolysis temperature. The MAT model temperature matching accuracy improved from 46% for all analogues to 81% when including ±100°C. Furthermore, we used MAT to compare charcoal created in the combustion facility with muffle furnace charcoal. Our findings indicate that the spectra of charcoals generated in a combustion facility can be accurately matched with muffle furnace-created charcoals of similar temperatures using MAT, and the accuracy improved when comparing the maximum pyrolysis temperature from muffle furnace charcoal with the maximum inner temperature of the combustion facility charcoal. This suggests that charcoal produced in a muffle furnace may be representative of the inner maximum temperatures for vegetation fire-produced charcoals.
1 Introduction
Fire, a fundamental ecological disturbance, has significantly affected terrestrial ecosystems for millennia (Dietze et al., 2019). However, the increasing incidence and magnitude of vegetation fires-also referred to as wildfires, wildland fires, landscape fires, among others (Bowman et al., 2020)- in western North America due to climate change (Schoennagel et al., 2017) underscore the need for additional study of fire’s ecological role. Post-fire ecological effects include impacts on vegetation, organic matter, and hydrology (Keeley, 2009; Agbeshie et al., 2022). In addition, changes in fire regimes resulting from historical fire suppression have increased fuel availability and altered fire timing, seasonality, and frequency (Bowman et al., 2011). To comprehensively study ecosystem resilience, biodiversity, and ecosystem functioning, fire ecologists must investigate the long-term interactions between fire, climate, and vegetation at various spatial and temporal scales (Turner et al., 2019). This historical perspective informs modern forest management practices (Whitlock et al., 2010).
Fire regimes encompass various elements such as intensity, frequency, and seasonality, providing a framework for understanding fire dynamics within ecosystems (Gill, 1975). This definition has evolved to include additional factors such as the type of fire (ground or crown), fuel consumption, fire spread, and fire severity, which measure the impacts on local vegetation (Bowman et al., 2009; Conedera et al., 2009). Fire intensity refers to the energy released from the physical combustion of organic matter but also comprises other fire metrics such as temperature, residence time, and radiant energy (Keeley, 2009). However, accurately measuring fire intensity poses challenges, as it involves determining the temperature of soil surfaces during smoldering combustion and the duration of heating (Keeley, 2009). As a result, fire intensity is often inferred through correlated indicators such as soil burn severity or fire severity. To directly measure fire intensity, it is necessary to characterize changes in chemical properties of fuels caused by combustion temperature and duration of heating (Constantine et al., 2021).
Charcoal is a highly persistent and widespread component formed during fires through the pyrolysis and incomplete combustion of organic materials (Scott and Damblon, 2010). During the formation of charcoal, organic material undergoes chemical changes from pyrolysis and oxidative heating (Constantine et al., 2021). Charcoal is valuable for understanding historic fire activity (Whitlock et al., 2010). By counting charcoal particles in dated sediment cores obtained from lakes, soils, and wetlands, researchers can reconstruct historical fire frequency and area burned at local to regional scales (Whitlock and Larsen, 2001; Higuera et al., 2010; Marlon et al., 2016; Cadd et al., 2020). However, these data do not capture additional fire attributes such as temperature and intensity (Vachula and Richter, 2018).
Various methods have been used to examine chemical properties of soil organic matter from laboratory pyrolysis and modern vegetation fire (e.g., thermal analysis; Cuña Suárez et al., 2010; Mastrolonardo et al., 2014; Merino et al., 2018). To supplement traditional paleofire reconstruction methods, absorption spectroscopy has been used to examine modern charcoal’s physical and chemical properties for comparison to fossil charcoal (Gosling et al., 2019; Maezumi et al., 2021). Absorption spectroscopy shows the potential to identify chemical effects of combustion and heating on charcoal, enabling a more comprehensive assessment of vegetation fire temperature and intensity (Costa et al., 2018; Gosling et al., 2019; Constantine et al., 2021; Maezumi et al., 2021; Theurer et al., 2021). Fourier Transform Infrared spectroscopy (FTIR) is one such method that uses absorption in the mid-infrared region (wavenumbers 4000 to 400 cm−1) to characterize the molecular structure and functional groups of charcoals (Labbe et al., 2006; Gosling et al., 2019; Constantine et al., 2021; Maezumi et al., 2021; Gosling and McMichael, 2023). Charcoal formation during fire results from thermal degradation of cellulose, hemicellulose, and lignin molecules due to pyrolysis and oxidative heating (Scott and Damblon, 2010). Progressive heating of these organic compounds in charcoals results in the loss of hydrogen and oxygen, contributing to structural reorganization into condensed and highly stable polyaromatics (Pyle et al., 2015). The resulting molecular and structural changes can be characterized by measuring changes in IR absorption (Evans, 1991; Pandey and Theagarajan, 1997; De la Rosa et al., 2019).
Recent studies using FTIR have demonstrated the potential for estimating maximum pyrolysis temperature and identifying the plant material type (woody vs. non-woody) of unknown charcoal particles using charcoal produced in a muffle furnace at various temperatures as a “reference” dataset (Gosling et al., 2019; Maezumi et al., 2021). Additionally, attenuated total reflectance FTIR (ATR-FTIR) has been employed to predict charring intensity (CI) from muffle furnace charcoals (Constantine et al., 2021). CI reflects the thermal history (i.e., time and temperature) during charcoal production and may explain chemical changes in charcoal (Pyle et al., 2015). While these studies show promise, there is debate in the literature about how representative muffle furnace-produced charcoals are of charcoals from vegetation fires, which experience variable and transient fire and environmental conditions (Cohen-Ofri et al., 2006; Belcher and Hudspith, 2016). This is because combustion typically involves pyrolysis, flaming combustion, and smoldering combustion (oxidation), with muffle furnace charcoals replicating only pyrolysis (Belcher and Hudspith, 2016). As a result of significant preheating and the absence of smoldering combustion, muffle furnace charcoal exhibits higher optical reflectance compared to charcoal from vegetation fires at the same peak heat intensity (kWm−2) (Belcher and Hudspith, 2016) and therefore, the molecular structure may also be different. This was further tested by Theurer et al. (2022) by generating charcoal using a laboratory tube furnace with pyrolysis under a constant nitrogen flow and comparing it to charcoals obtained from a prescribed heathland fire. They found inconsistencies based on thermocouple-measured temperatures of heathland charcoal compared to microstructure changes of tube furnace charcoal at the same pyrolysis temperature (Theurer et al., 2022). The microstructure of charcoals may result from a combination of combustion behaviors and not solely from the formation temperature, emphasizing the need to further assess differences between muffle furnace (or other laboratory-produced) charcoal and charcoals produced from vegetation fires (Belcher and Hudspith, 2016; Theurer et al., 2022).
Our study aims to evaluate the application of FTIR spectroscopy to infer fire temperature information from charcoals produced in a laboratory muffle furnace at controlled temperatures. Additionally, we seek to expand this research to include vegetation species predominant in the western United States, because previous work has focused on species dominant in South America (Gosling et al., 2019) and South Africa (Maezumi et al., 2021). Given the region’s increasing incidence of larger and more frequent fires (Chen et al., 2021), additional information on current and historical fires (e.g., fire temperature and consumed vegetation types) is crucial for effective management. Furthermore, we explore the potential to use charcoal spectral results to identify the specific vegetation species, as opposed to the general identification of broader vegetation categories (i.e., coniferous and deciduous). Lastly, we investigate how FTIR spectral results from charcoal produced in a controlled laboratory muffle furnace compare to charcoal produced in a combustion facility that closely simulates vegetation fires.
2 Materials and methods
2.1 Site and sample selection
The species selected for the muffle furnace charcoal reference dataset represents a subset of species found in the Sierra Nevada Temperate Conifer Forests ecoregion (Figure 1). The approach outlined below is similar to prior work by Constantine et al. (2021), Gosling et al. (2019), and Maezumi et al. (2021). Vegetation (fuel) samples were collected from Castle Lake, California. Ten total species were sampled that include an equal mix of coniferous trees and shrubs: Abies concolor (ABCO), Calocedrus decurrens (CADE), Pinus contorta (PICO), Pinus monticola (PIMO), Pinus ponderosa (PIPO), and deciduous tree and shrub species: Acer glabrum (ACGL), Alnus rubra (ALRU), Arctostaphylos (ARCT), Quercus kelloggii (QUKE), and Quercus vaccinifolia (QUVA). Small branches were cut and collected, along with cones and leaves for each species. These samples were labeled, placed in paper bags, transported from the field, and dried at room temperature for several weeks before burning.
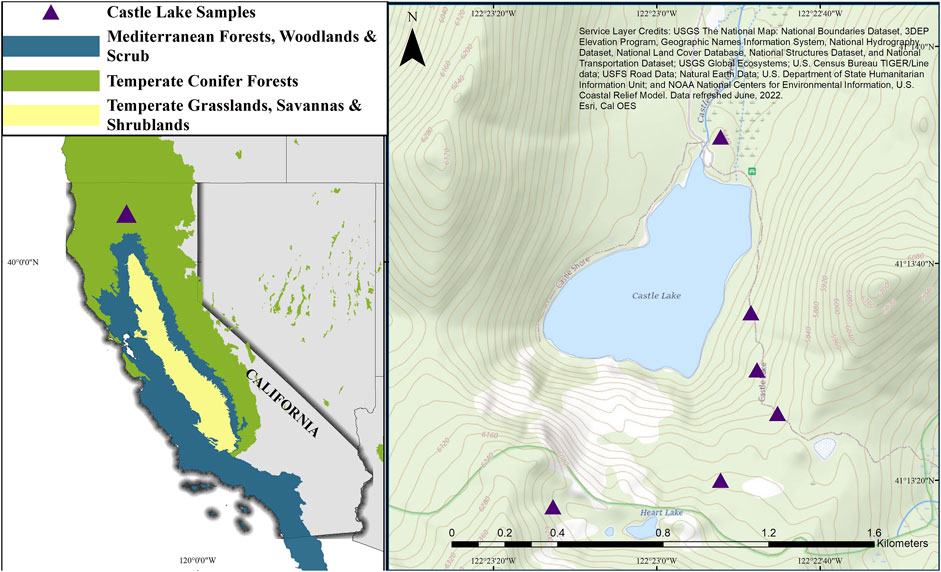
FIGURE 1. Map of sample locations (indicated by purple triangles) for vegetation used in the muffle furnace and combustion facility experiments, with an inset map showing the location of Castle Lake within California. Ecoregions are denoted by inset map colors, with the sample locations characterized by Temperate Conifer Forests (Dinerstein et al., 2017).
2.2 Production of charcoal in the muffle furnace
To prepare samples for the muffle furnace, dried vegetation was divided into woody and leafy components. Woody branches were cut into uniform discs of 1 cm length and ∼5 cm diameter. Woody discs were then wrapped in heavy-duty aluminum foil, placed into ceramic crucibles, and surrounded by sand sieved to <150 µm in diameter. The uncovered crucibles were placed in a muffle furnace preheated to the desired temperature, 200°C–800°C in 100°C increments. Each crucible was monitored with a K-type wire thermocouple (Onset Corp, Pocasset, Massachusetts, United States). Once the sand in the crucible reached the desired temperature (i.e., after 15–25 min), the crucible was removed from the furnace and allowed to cool to room temperature. This resulted in the creation of 70 samples (ten vegetation types and seven temperature treatments for each vegetation type).
2.3 Production of charcoal in the combustion facility
Creating charcoals in the combustion facility allowed us to produce charcoal in an environment more representative of natural conditions for comparison to the muffle furnace charcoals. Of the ten vegetation types from the muffle furnace study, three were studied in a combustion facility for comparison. Two coniferous (ABCO, PIPO) and one deciduous species (QUKE) from the muffle furnace experiment were chosen, with the inclusion of an additional deciduous species, Populus tremuloides (POTR). For each vegetation type, holes were drilled into each end of three larger branches (>1.5 cm diameter, ∼15 cm in length) to an approximate depth of 5 cm, and a K-type beaded wire thermocouple (Onset Corp, Pocasset, Massachusetts, United States) was inserted into the hole. A total of six thermocouples were placed inside the drilled branches, while the remaining six thermocouples were placed directly outside the branches. This resulted in six inside-outside thermocouple pairs and 12 thermocouples per burn event connected to HOBO 4-Channel Thermocouple Data Loggers (Onset Corp, Pocasset, Massachusetts, United States). This thermocouple arrangement enabled a comparison of inside and outside branch temperatures.
Separate burn events for each of the four species were conducted in the Desert Research Institute (DRI) combustion facility [as described by Tian et al. (2015)]. Within the aluminum chamber [1.8 m (L) × 1.8 m (W) × 2.2 m (H), and a wall thickness of 3 mm to withstand high temperatures], ∼100 g of fuel was placed (one species for each burn) onto the circular, ceramic burn platform (diameter of 45 cm). The combustion facility ventilation fan was set to the same speed for all burns to obtain comparable air flow conditions (∼6100 LPM). Instrumented branches were placed on top of smaller diameter fuel samples consisting of woody material and leaves spread evenly over the ceramic burn platform (Supplementary Figure S1). The vegetation was ignited at multiple locations using a butane lighter. When the vegetation was no longer actively flaming and had started to smolder, the resulting charcoal sample for each thermocouple pair was collected, wrapped in aluminum foil, and labeled with the unique thermocouple identifier. This allowed the resulting charcoal sample to be later associated with each thermocouple to determine the maximum combustion temperature and duration of burn for each sample.
In summary, four burns for each of the four species were conducted, resulting in 16 individual burn events. Each burn event was instrumented with six thermocouple pairs to yield a total of 96 charcoal samples. However, not every thermocouple resulted in a usable sample. This resulted in 64 usable samples as 32 samples turned to ash before they could be collected. These usable charcoal samples were unevenly distributed between the four species as follows: ABCO n = 12, POTR n = 12, PIPO n = 20, and QUKE n = 20.
2.4 FTIR characterization of charcoal
Using methodology refined by Gosling et al. (2019) and Maezumi et al. (2021), FTIR spectroscopy was used to characterize the chemical composition of the charcoal samples from the muffle furnace and the combustion facility. In preparation for FTIR analysis, each homogenized charcoal sample was pulverized using a spice grinder and sieved to <53 µm diameter. A subset of each <53 µm charcoal sample was evenly distributed on zinc selenium slides (13 mm diameter × 2 mm thickness; Pike Technologies, Madison, WI) and analyzed on a Nicolet iN10 MX FTIR microscope (Thermo Nicolet Analytical Instruments, Madison, WI) using a liquid nitrogen cooled mercury cadmium telluride (MCT) detector. Each sample was scanned 128 times at 2 cm−1 spectral resolution in transmission mode with an aperture size of 150 µm between 950 and 3,500 cm−1 wavenumbers. A background spectrum was automatically collected every 60 min. The Beer-Norton filter and the “auto baseline” function were applied to raw spectra to reduce noise using OMNIC spectra analysis software package (Thermo Nicolet Analytical Instruments, Madison, WI). Thirty spectra were collected per sample, for a total of 2,100 spectra for the muffle furnace (seven temperatures and ten species, n = 70 samples; Figure 2) and 1920 spectra for combustion facility samples (ABCO n = 12, POTR n = 12, PIPO n = 20, QUKE n = 20, for a total of n = 64 charcoal samples). For comparison to charcoal samples, unburned material from three species (ABCO, PIPO, QUKE) was pulverized using a spice grinder, sieved to <53 µm diameter, and analyzed with FTIR using the same methods outlined above. Thirty spectra were collected per sample and averaged.
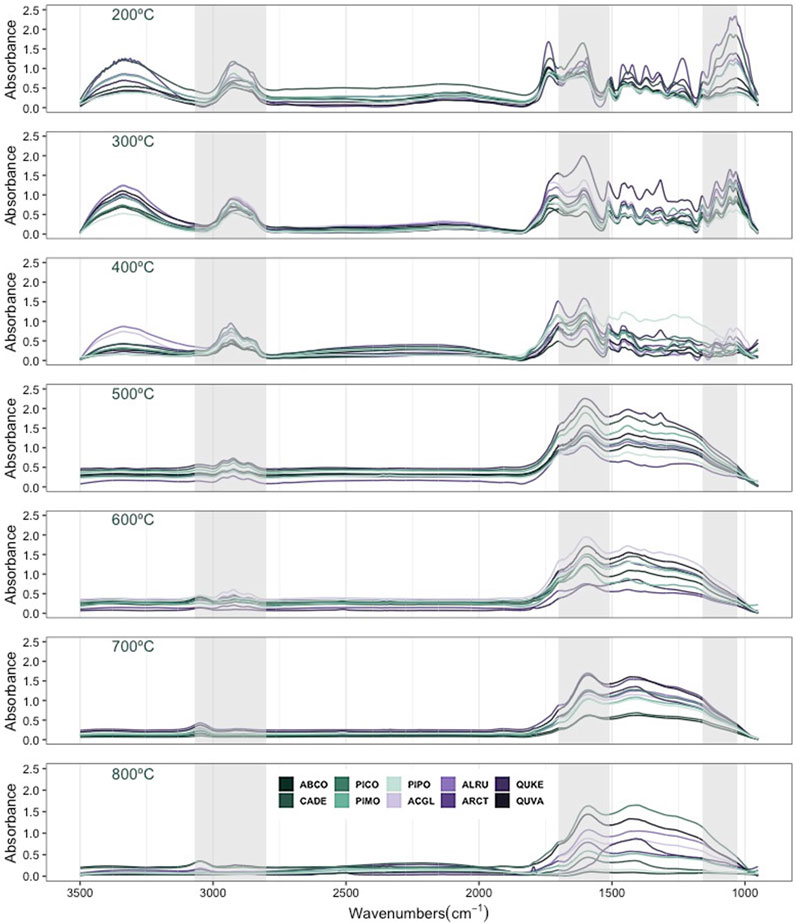
FIGURE 2. Thirty Fourier Transform Infrared (FTIR) spectroscopy absorbance spectra were averaged for each species of vegetation and seven temperature treatments (200°C–800°C in 100°C increments, n = 70). Samples are color-coded by vegetation group; green spectra represent coniferous species, while purple spectra represent deciduous species. Gray bands represent wavenumber areas of interest related to heat-induced changes in cellulose and lignin: 3,068–2,800 cm−1, 1700–1,510 cm−1, and 1,160–1,030 cm−1.
2.5 Statistical analysis of FTIR charcoal spectra
The Modern Analogue Technique (MAT) is a statistical classification technique that uses the k-Nearest Neighbors statistical method adapted to paleoecological datasets (k-NN; Chevalier et al., 2020; Maezumi et al., 2021) and has been previously used to measure the degree of similarity (i.e., degree of analogy) between known modern multivariate datasets with an unknown fossil assemblage (Simpson, 2007). For example, this approach has been applied to fossil pollen in preserved sediments (Bjune et al., 2010). By using a modern “training” (or “reference”) pollen dataset with associated modern climatic variables, the sediment fossil assemblages that are most similar (or analogous) to the modern pollen are then used to classify similar and dissimilar past climate variables, with the assumption that the relationship between pollen types and the environment has not changed through time (Bjune et al., 2010). Fossil assemblages that are similar to the modern training set, based on a dissimilarity threshold (i.e., Euclidean distance), are considered analogue matches (Bjune et al., 2010). If a sample could not be confidently matched to the reference spectra, it was referred to as a non-analogue (Nascimento et al., 2023). Maezumi et al. (2021) applied the MAT approach to categorize muffle furnace-produced charcoal spectra and showed that MAT can classify temperature and species categories. In our study, we extend MAT to compare similarity between muffle furnace charcoal produced at controlled temperatures and charcoal produced in a combustion facility. Please see Maezumi et al. (2021) for additional details on the MAT approach.
To use MAT to identify pyrolysis temperature and species from the muffle furnace charcoal, for each charcoal sample (n = 70), the spectral data (n = 2,100) were divided into ten folds of equal size (n = 210). Using a 10-fold cross-validation, nine folds were assigned as a training dataset (n = 1890), while the 10th fold was assigned as the testing dataset (n = 210). Similarity between training and testing datasets was measured using the Euclidean distance to assign analogues from the reference database to the testing dataset. A 2.5% dissimilarity threshold was used to identify analogues for each sample [multiple analogues or non-analogues (NA) for each charcoal sample can be identified]. This allowed the training set to distinguish related spectral features in the testing dataset to identify temperature. The resulting analogues for each sample were then grouped by the known temperature or species of the training data. An estimated temperature for all identified analogues for each sample was assigned based on all identified analogues for each charcoal sample; the analogue group with the lowest mean Euclidean distance was the reconstructed maximum temperature or species after Maezumi et al. (2021). The MAT model was run until each fold was used as the testing dataset, and the results for each iteration were combined. The accuracy of the MAT model was expressed as the fraction of analogues for each charcoal sample that was correct for species, temperature, and temperature within ±100°C. This is similar to the approach used by Maezumi et al. (2021) for their muffle furnace charcoal data.
The muffle furnace spectral data (n = 2,100) were used as a training dataset to reconstruct temperature for charcoal produced in the combustion facility by comparing spectra (n = 1,920). Analogues for each combustion facility spectra were calculated using Euclidean distance with a specified cutoff value (2.5% similarity value), beyond which samples were not considered analogous. The resulting analogues for each combustion facility sample were grouped by the analogues’ known temperature or species. Using all identified analogues for each combustion facility sample, the analogue group with the lowest mean Euclidean distance was the reconstructed maximum temperature or species.
MAT reconstructions were performed using “analogue” (V0.17-6, Simpson, 2007), and spectra visualizations were accomplished using the “chemospec” (V6.1.4, Hanson, 2023) and “ggplot2” (V3.4.0, Wickham, 2009) packages for R (R Core Team, 2022).
3 Results
3.1 Muffle furnace charcoal FTIR spectra
Thirty spectra were collected per muffle furnace charcoal sample. The muffle furnace spectra were averaged for each species (n = 10) and temperature (n = 7), and the results showed visible differences between temperatures, including heat-induced changes in cellulose and lignin occurring in wavenumber bands of 3,068–2,800 cm−1, 1700–1,510 cm−1, and 1,160–1,030 cm−1 (Figure 2). At lower temperatures of 200°C to 400°C, spectra are characterized by pronounced peaks from wavenumbers 3,000–2,800 cm−1 (C-H stretch), 1,700–1,600 cm−1 (aromatic carbonyl/carboxyl (COOH), C=O bonding), 1,600–1,510 (aromatic C=C stretching), and 1,160–1,030 cm−1 (aliphatic ether C–O– and alcohol C–O stretching) (Guo and Bustin, 1998; Ascough et al., 2020). As temperature increases above 400°C, peaks at wavenumbers less than 1,750 cm−1 decrease in amplitude, and peaks in the 3,000–2,800 cm−1 range also decrease (Figure 2). The spectra of the unburned materials (Supplementary Figure S2) are similar to the 200°C charcoal samples.
3.2 Analogue matching of muffle furnace material
The total number of temperature analogues identified across 10-fold cross-validated model iterations on 2,100 spectra varied from 16,364 to 55,622 (Figure 3A). The greatest amount of all identified analogues was found for samples burned at maximum pyrolysis temperatures of 700 °C, and the lowest amount of analogues occurred for samples burned at 200°C (Figure 3A). Temperature categories of 300°C and 200°C had the greatest number of correct matches, at 65% (12,568 identified analogues) and 54% (8,858), respectively. Additional correct matches were 50% for 400°C (14,376), 38% for 500°C (16,306), 34% for 600°C (18,284), 46% for 700°C (25,362), and 38% for 800°C (16,928) (Figures 3A, B). Overall, for measured temperatures greater than 500°C, a decrease in reconstructed temperatures matching the measured temperature was observed. Including reconstructed temperatures ±100°C of the measured temperature improved matching results. For all identified analogues, correct matches ranged from 69% to 98% (Table 1). For example, at 500°C, correct matches increased from 38% to 81% of the results when considering 500°C ± 100°C (Figure 3B; Table 1). There were very few non-analogue (NA) matches observed, with abundances of NA matches calculated as <1% for all identified analogues.
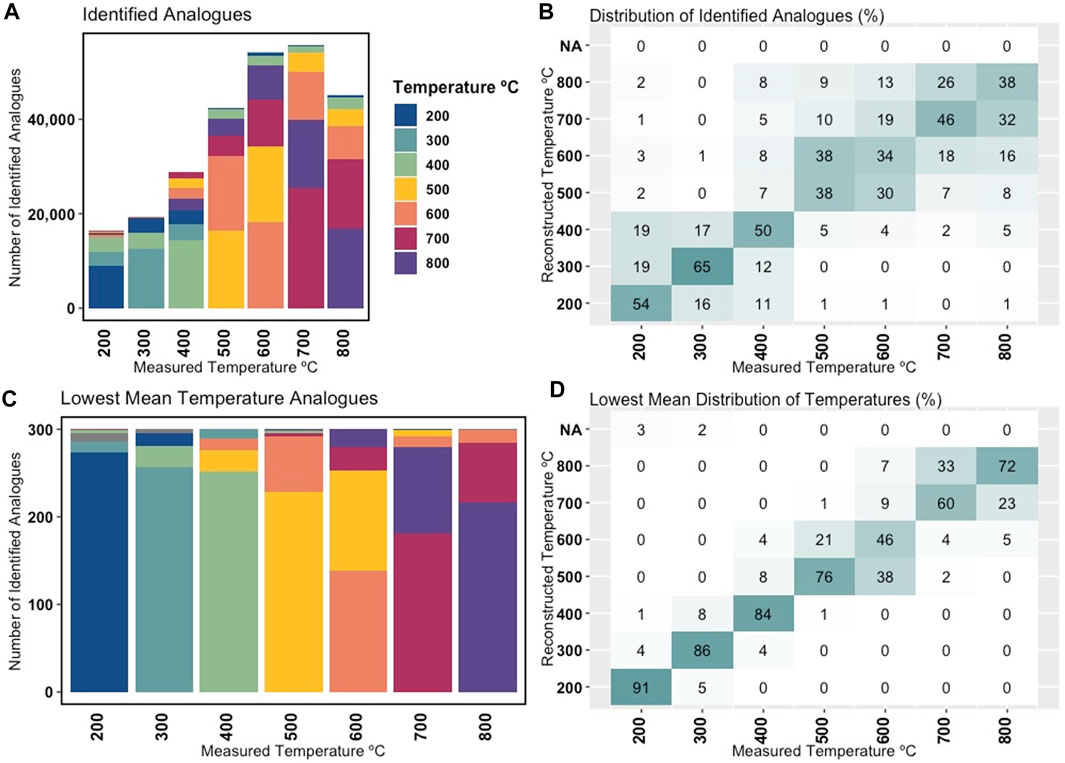
FIGURE 3. Results of Modern Analogue Technique matching for characterization of combustion temperature. (A) Number of total temperature analogues matched with 10-fold cross-validation. (B) Confusion matrix showing the percentage of total temperature analogues matched with 10-fold cross-validation. (C) Lowest mean Euclidean distance of all matched temperature analogues within a 2.5% similarity threshold. (D) Confusion matrix showing the percentage of the lowest mean Euclidean distance of all matched temperature analogues within a 2.5% similarity threshold.
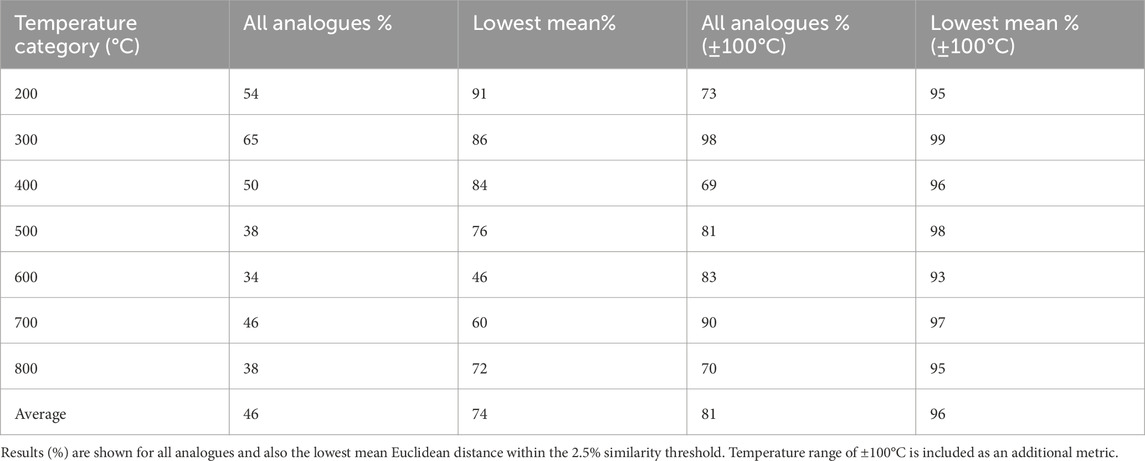
TABLE 1. Correctly identified modern analogue technique (MAT) analogues by temperature category.
For the lowest mean Euclidean model, results ranged from 46% of the reconstructed temperatures correctly matching the measured temperature at 600°C to 91% correctly matching at 200°C (Figures 3C, D; Table 1). Including reconstructed temperatures ±100°C of the measured temperature improved the lowest mean Euclidean correct matches. For example, correct matches increasing from 46% and 60% to 93% and 97%, respectively, for the 600°C and 700°C temperature category was observed when considering reconstructed temperatures ±100°C of the measured temperature (Figure 3D; Table 1). Non-analogue matches were only found in the 200°C temperature category (3%) and the 300°C category (2%) (Figure 3D). No other categories had non-analogue matches.
The number of species analogues identified across 10-fold cross-validated model iterations on 2,100 spectra varied from 18,342 to 31,351 (Figure 4). The most identified analogues were found for the coniferous species PICO, and the least amount of analogues occurred for QUKE, a deciduous species (Figure 4A). ABCO, ALRU, and QUVA had the greatest number of correct species matches, at 21% (5,674), 19% (5,408), and 19% (5,496), respectively. Additional correct matches were 14% for CADE (3,402), 15% for PICO (4,700), 15% for PIMO (3,656), 16% for PIPO (4,646), 14% for ACGL (3,938), 15% for ARCT (3,278), and 14% for QUKE (2,618) (Figures 4A, B).
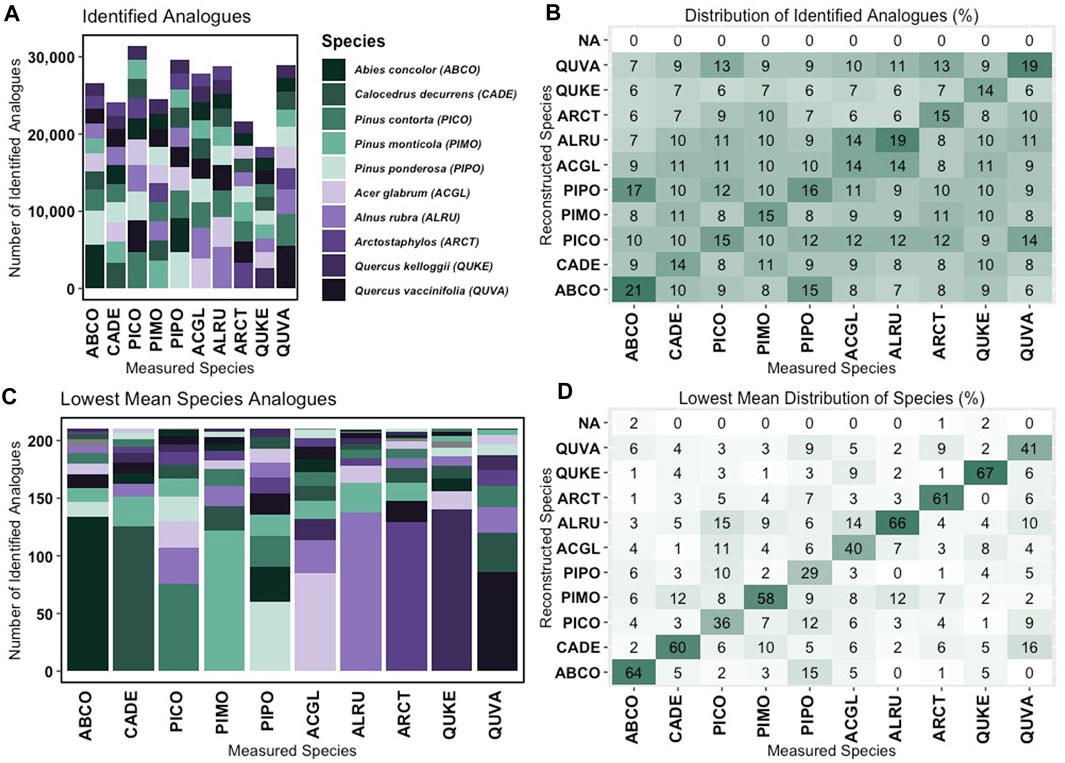
FIGURE 4. Results of Modern Analogue Technique (MAT) matching for characterization of vegetation species. (A) Number of total species analogues matched with 10-fold cross-validation. (B) Confusion matrix showing the percentage of total species analogues matched with 10-fold cross-validation. (C) Lowest mean Euclidean distance of all matched species analogues within a 2.5% similarity threshold. (D) Confusion matrix showing the percentage of the lowest mean Euclidean distance of all matched species analogues within a 2.5% similarity threshold.
For the lowest mean Euclidean model, species results ranged from 29% to 67% correctly matching (Figures 4C, D). The percentage of non-analogue matches was dependent on the species category, with non-analogues observed in QUKE (2%), ABCO (2%), and ARCT (1%), the other species categories had no non-analogue matches (Figure 4D).
3.3 Analogue matching of combustion facility material
Measured maximum temperatures for the combustion facility charcoal ranged from 77°C to 1,059°C. However, samples with temperatures below 144°C and above 863°C were removed during analysis for comparison to muffle furnace charcoal (Supplementary Figures S3–S9). The lowest mean Euclidean reconstructed temperature for the combustion facility spectra (Supplementary Figure S10) was compared to maximum temperatures of all locations (inside, average of inside and outside, and outside) recorded by thermocouples co-located with the samples. Analogue matching results of combustion facility charcoal often were to multiple temperature categories with no perfect (i.e., 100%) match to one temperature category. For example, an individual sample’s spectra will match 49% for 500°C and 48% for 600°C. Analogue results of reconstructed temperatures are shown by the reconstructed temperature with the greatest matching percentage (Figure 5). Using the example above, we chose 500°C as the reconstructed temperature for the sample.
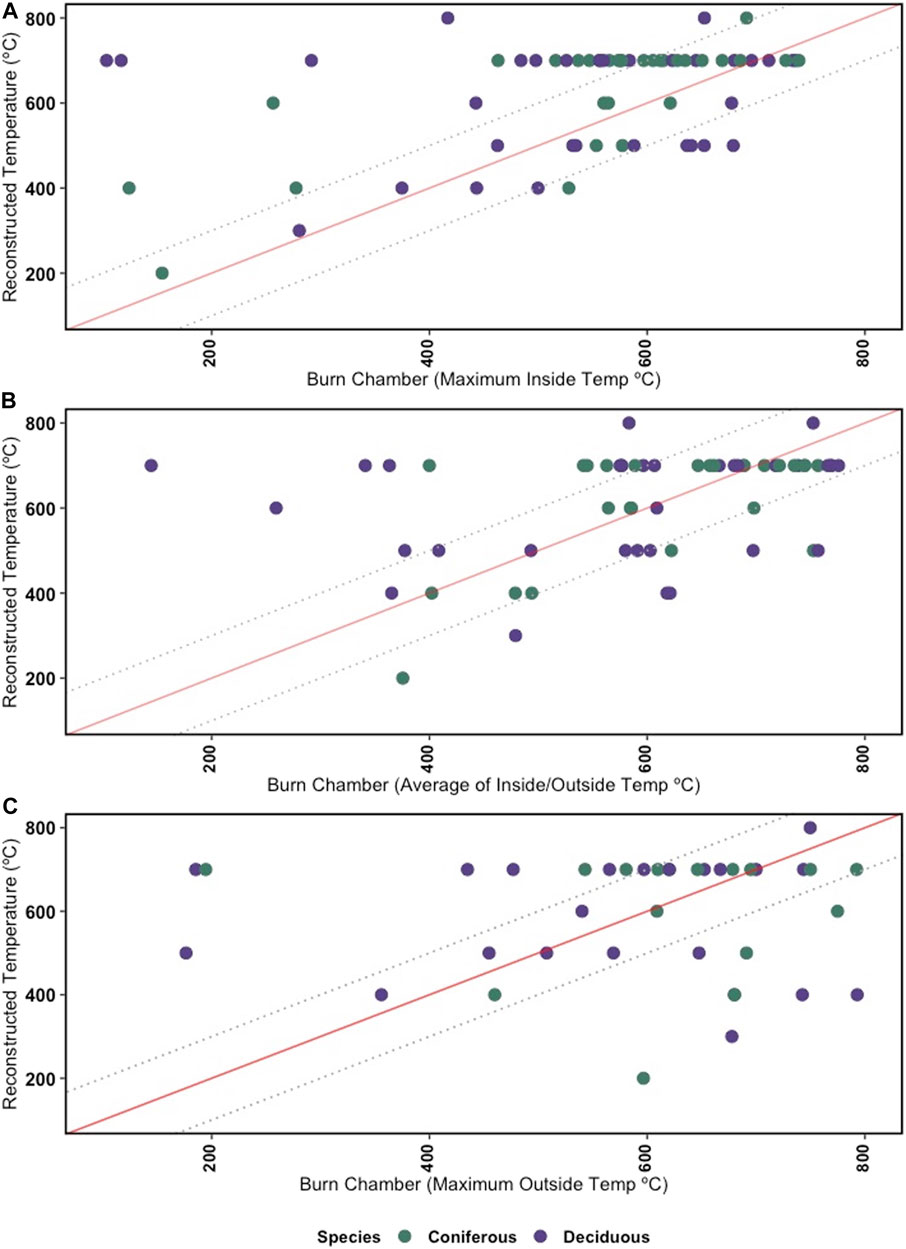
FIGURE 5. The lowest mean Euclidean reconstructed temperature for the combustion facility spectra was compared to maximum temperatures recorded by thermocouples co-located with the samples. The solid red line denotes the “line of equality” and dotted grey lines include ±100°C. Points are color-coded by vegetation group; green points represent coniferous species, while purple represents deciduous species. (A) Comparison of model reconstructed temperature and thermocouple temperature placed inside the sample. (B) Comparison of model reconstructed temperature and the average of the measured inside/outside thermocouple temperature. (C) Comparison of mean model reconstructed temperature and thermocouple temperature placed outside the sample.
Basic statistical measures, including variance and averages, were used to assess the deviation between measured temperatures and reconstructed maximum temperatures. For ease of assessment, we categorized the measured maximum temperatures into three categories low- (200°C–400°C), medium- (500°C–600°C), and high-temperature (700°C–800°C) (Table 2). We employed the formula (Measured Temperature - Reconstructed Temperature)/(Reconstructed Temperature × 100) to calculate the percentage offset for each sample. The variance is calculated by taking the mean squared difference between each data point and the center of the distribution.
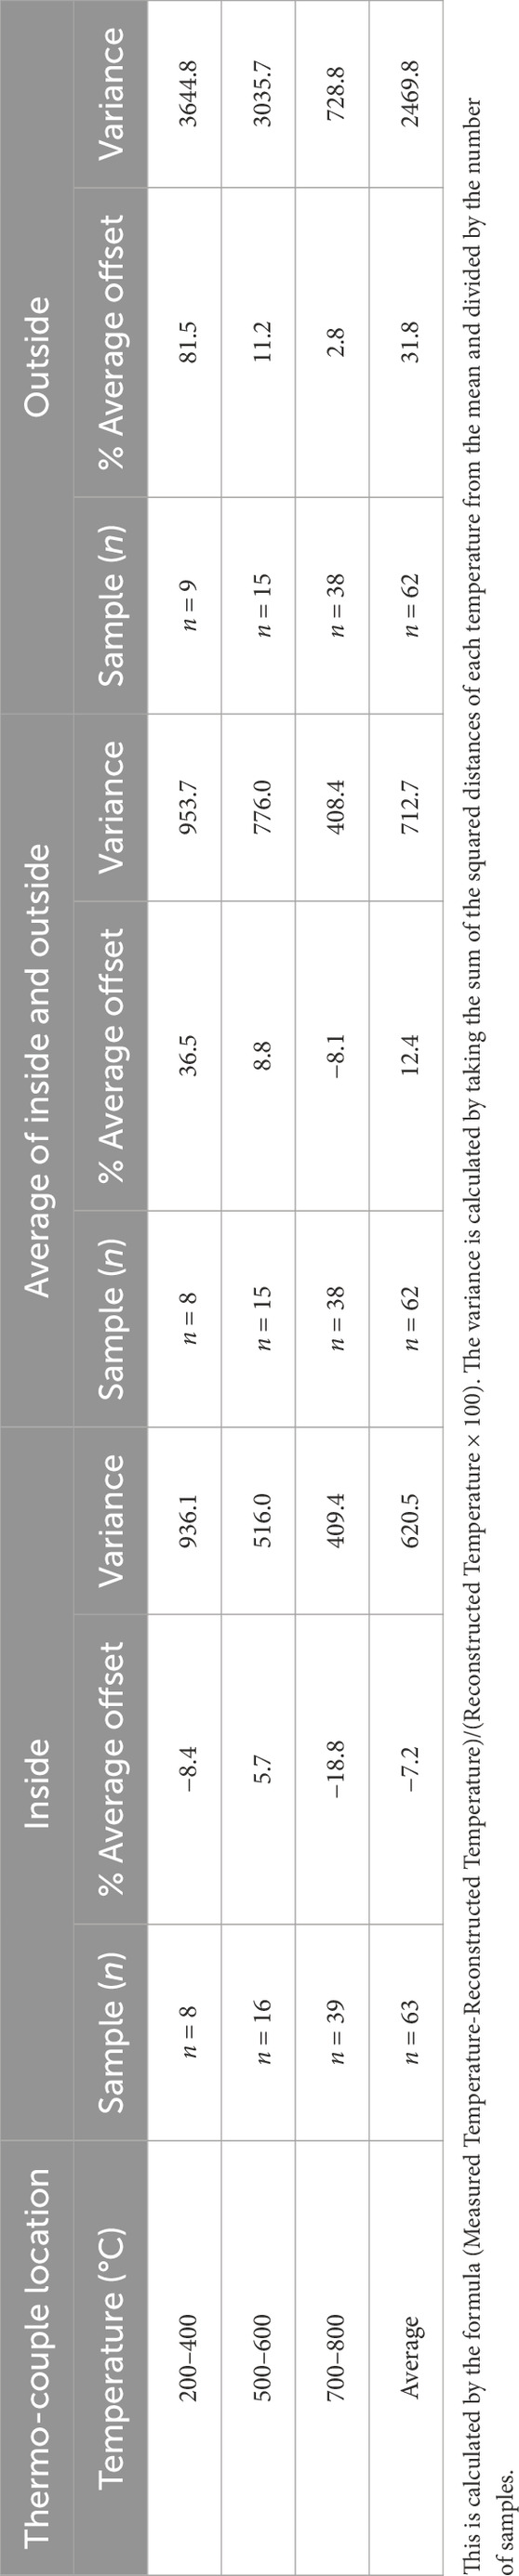
TABLE 2. Table of the burn chamber combustion sample measured temperatures and how far the measured temperature deviates from the reconstructed temperature, as shown in Figure 5.
In the combustion facility, the majority of the charcoal sample maximum measured temperatures were between 700°C–800°C, followed by the medium temperature (500°C–600°C) category, with the lowest number of samples’ maximum measured temperatures in the range of 200°C–400°C. Total sample numbers varied based on thermocouple placement inside or outside the sample (refer to Table 2 for details).
When comparing the measured maximum temperature to the reconstructed temperature for the 200°C–400°C and 700°C–800°C categories, the inside measured maximum temperatures were lower than the reconstructed maximum temperatures, resulting in offsets of −8.4% and −18.8%, and variance of 936.1 and 409.4, respectively (Table 2). In the 500°C–600°C category, the inside measured maximum temperatures were slightly higher than the reconstructed temperatures, with an offset of 5.7% and a variance of 516.0. The average offset for all inside temperature categories was −7.2%, and the average variance was the lowest for thermocouple locations at 620.5. When comparing the thermocouple measurements from the outside of samples to the reconstructed temperature, the measured temperatures were higher than the reconstructed temperatures for all three temperature categories (Table 2). The offsets were 81.5%, 11.2%, and 2.8%, and variances were 3644.8, 3035.6, and 728.8, respectively, with an average offset of 31.8% and the largest average variance of 2469.7. Lastly, the average of the maximum thermocouple temperatures from inside/outside the samples was calculated and compared to the reconstructed temperature. For the 200°C–400°C and 500°C–600°C categories, the measured temperatures were higher than the reconstructed temperatures, resulting in offsets of 36.5% and 8.8% and variances of 953.7 and 776.0, respectively. However, in the 700°C–800°C category, the trend reversed, with a calculated offset of −8.1% and a variance of 408.4. The average offset across all temperature categories for the average of the maximum inside and outside thermocouple temperatures was 12.4% and an average variance of 712.7 (Table 2).
4 Discussion
Previous research indicates that charcoal formation is influenced by properties of the fuel in combination with fire metrics such as temperature, intensity, and residence time (Guo and Bustin, 1998; Belcher and Hudspith, 2016; Roos and Scott, 2018; Gosling et al., 2019; Ascough et al., 2020; Constantine et al., 2021; Maezumi et al., 2021). However, the most accurate methods to measure the interactions between fire metrics, such as temperature and charcoal chemistry, are still debated (Cohen-Ofri et al., 2006; Belcher and Hudspith, 2016). Here, we have successfully shown the application of FTIR spectroscopy to infer fire temperature information from charcoals created in a muffle furnace, as well as a combustion facility.
We expand on previous similar work that studied species dominant in South America (Gosling et al., 2019) and South Africa (Maezumi et al., 2021) by comparing charcoal produced in a laboratory muffle furnace and combustion facility for species dominant in the western United States. Prior work has shown that higher temperatures during charcoal production lead to the development of polyaromatic structures due to changes in chemical bonds and loss of acidic and carboxylic functional groups (Zhao et al., 2017). Our use of FTIR to track chemical changes in our muffle furnace charcoal reveals minimal differentiation when comparing the unburned spectra to the spectra of charcoal created at 200°C. This is most likely a result of baking (not carbonization) at this low temperature. As fuels are exposed to higher pyrolysis temperatures, the peaks between 3,068 and 2,800 cm−1 related to aliphatic carbon decrease. Simultaneously, the bands associated with hemicellulose and lignin between 1,700 and 1,510 cm−1 broaden, indicating an increase in aromaticity in high-temperature charcoal formed at maximum pyrolysis temperatures between 500°C and 800°C (Bustin and Guo, 1999; Rutherford et al., 2008; Figure 2). Specific components of lignin have been shown to yield slightly different spectra as a result of temperature changes and moisture content (Yong and Matsumura, 2013), and these variables, in conjunction with the overlap of lignin bands seen in IR spectroscopy, can make specific peak assignments difficult (Bock and Gierlinger, 2019). Nevertheless, previous FTIR studies suggest that peaks corresponding to oxygenated functional groups of cellulose (C-O-C and alcohol groups) at 1,160–1,030 cm−1 become less distinct with increasing pyrolysis temperature (Guo and Bustin, 1998; Cohen-Ofri et al., 2006; Gosling et al., 2019). The 1,160–1,030 cm−1 wavenumbers indicate functional groups assigned to cellulose, hemicellulose, and lignins (Figure 2; Supplementary Table S1) (Guo and Bustin, 1998; Bustin and Guo, 1999; Ascough et al., 2020).
Various statistical classification methods (e.g., Gosling et al., 2019; Maezumi et al., 2021) have shown that FTIR spectra can impart chemical information from charcoal. Gosling et al. (2019) showed that it is possible to use spectra in combination with model-based clustering to identify chemical changes in heated fuels and infer pyrolysis temperatures from muffle furnace-produced charcoal. Maezumi et al. (2021) refined this approach using MAT, which relies on a statistical threshold for similarity in characterizing spectra. With the MAT technique, we found that muffle furnace charcoal with a lower maximum pyrolysis temperature had a higher accuracy in matching the temperature maxima than higher-temperature charcoal (Figure 3). This higher accuracy in matching is likely attributed to the differentiation in spectral peaks below 1800 cm-1 that start to flatten when temperatures exceed 400°C (Figure 2). As pyrolysis temperature increases, the classification yields less agreement, and chemical information may be insufficient for accurate matching. This contrasts with the study by Maezumi et al. (2021), which found that accuracy of analogue matching was the lowest for temperatures below 400°C but increased as charcoal is dominated by condensed polyaromatics around 500°C–600°C, and again declined with the loss of chemical information above 700°C. This disparity may be the result of the different fuel types studied.
Using the lowest mean Euclidean distance of all identified analogues, or the temperature groups that are closest in distance, has been found by other studies to maximize accuracy when assessing k-NN model results (Maezumi et al., 2021). Broadening the temperature classes to include ±100°C increased confidence in charcoal matching to an average match of 81% for all identified analogues (Figure 3B) and 96% matching for the lowest mean analogues (Figure 3D). This is consistent with Maezumi et al. (2021), who showed an average match of 86% for all identified analogues and 91% matching for the lowest mean analogues. Our study further supports the reproducibility of reconstructing maximum temperature using spectra results for muffle furnace charcoal combusted under measured temperature conditions.
While our study successfully infers temperature from muffle furnace-produced charcoal spectra, identifying vegetation species or even broader vegetation groups remains challenging. Previous research (Gosling et al., 2019; Maezumi et al., 2021) encountered similar difficulties in accurately classifying species based on FTIR spectra. This challenge arises from various factors, including differences in chemical composition (e.g., lignin content), density, moisture content, and permeability among plant species (Bartlett et al., 2018).
In our study, we included an equal number of species from two distinct vegetation groups: coniferous and deciduous. These groups encompass “hard” and “soft” woods with different amounts of lignin content (Evans, 1991). While FTIR can potentially differentiate peak disparities in lignins and variations in hemicellulose by specific wavenumbers for unburned wood (Pandey, 1999), our analysis revealed that spectra differentiation between the two groups was not distinct (Figure 2). However, the findings by Maezumi et al. (2021) suggest that the accuracy of the model improves when classifying charcoal based on broader growth habit groups (e.g., trees/shrubs vs. reeds/grasses). In our study, samples were predominantly woody vegetation (trees/shrubs), and therefore, we did not further explore this observation by Maezumi et al. (2021). For species-level identification, it may be more reliable to focus on significantly different plant species with disparate lignin and cellulose contents. In practical applications, while FTIR may not be the ideal tool for pinpointing individual species, it may be valuable for classifying charcoal into more general vegetation categories.
Using thermocouples allows for measuring the maximum temperature and the duration of burn time fuels experienced during combustion. Related research by Constantine et al. (2021), based on previous research by Hudspith et al. (2014) and De la Rosa and Scott (2018), used ATR-FTIR to measure chemical changes in furnace-produced charcoal to create a CI (temperature and heating duration) calibration using partial least squares regression. Unknown samples were compared to the CI calibration, but in Constantine et al. (2021), this method was limited to charcoal formation temperatures below 700°C due to the model’s inability to distinguish the spectra of higher-temperature charcoal. Similarly, Theurer et al. (2022) used Raman spectroscopy to investigate the CI of heathland charcoal created during a prescribed fire. They noted contrasting calculated and measured CI results and attributed the agreement that Constantine et al. (2021) found between observed and expected CI to the consistency of thermal application in laboratory furnaces. These studies concur that measuring charcoal chemistry is complicated and may be influenced by combustion behavior and energy rather than being solely determined by maximum temperature. Given the variations in heating time for our muffle furnace charcoals, we have prioritized maximum temperature rather than CI for comparison with combustion facility charcoal.
By employing the combustion facility, we were able to produce charcoal in an environment more representative of natural conditions. Flame temperatures within the combustion facility often exceeded 1,000°C, albeit briefly, consistent with temperatures observed during forest crown fires (Rodriguez y Silva et al., 2017). Replicating pyrolysis temperatures over 800°C, characteristic of vegetation fires or prescribed fires, proves challenging in a muffle furnace, with most of the sample turning to ash during the long time it took for the muffle furnace to reach such temperatures. The combustion facility can create charcoals that are representative of vegetation fire charcoal with fluctuating and variable heating intensity and duration, allowing further exploration of the relationship between combustion temperature and CI. Additionally, the facility allows for the manipulation of various factors that influence combustion, such as fuel moisture content and pre-heating of fuels. It also allows for simulating meteorological conditions that cannot be manipulated in a muffle furnace, including oxygen availability and fluctuating airflow. Such manipulations allow a better understanding of the relationships between vegetation fire, charcoal chemistry, and temperature.
Using a combustion facility to create charcoal is advantageous as it can help us to better understand charcoal formation. We observed greater variance in the reconstructed temperatures for the combustion facility samples with maximum temperatures <400°C. The variance observed in combustion facility charcoal may reflect moisture movement or species-related moisture content in the samples. Moisture tends to migrate to the center of the sample, thus delaying heating (Bartlett et al., 2018), while the outer layers experience initial flaming combustion. Measured temperatures inside and outside the samples may eventually reach equilibrium as combustion continues, which could be reflected in the decreasing variance as temperatures increase. We also observed the lowest average fractional offset for inside maximum temperatures. These observations support that charcoals produced in a muffle furnace are more reflective of the inner maximum temperatures for vegetation fire-produced charcoals. Therefore, charcoals created in a muffle furnace are different from vegetation fire-produced charcoal and future research is needed to better understand the relationship between muffle furnace-produced charcoal and those produced in a combustion facility.
5 Limitations
There are certain limitations of this study. Spectra of unburned material were not rigorously examined (only three species were tested), as the main focus of this study was changes in charcoal chemistry with increasing heat application. We also found that when interpreting FTIR spectra, moisture content, combined with the overlap of lignin bands, can make specific peak assignments difficult. Similarly, we found that the chemical information from FTIR may be insufficient for accurate MAT matching as pyrolysis and combustion temperatures increase, and for identifying vegetation species or even broader vegetation groups. Future work should focus on addressing the above limitations by additional comparisons of FTIR spectra for unburned materials, as well as expanding the number of species and temperatures used in the combustion chamber experiments. More comprehensive research should also be conducted to resolve how moisture and temperature changes impact overlapping peak assignments for cellulose and lignin. We recognize that the correlation between total energy release (CI) and maximum temperature of combustion chamber charcoal remains unclear, presenting an avenue for further research.
6 Conclusion
This study showed the reliability of charcoal chemistry as an indicator of maximum combustion temperature of charcoals formed through the muffle furnace and the combustion chamber. Producing and analyzing charcoal from vegetation specific to the ecosystem of interest may enhance the applicability of FTIR in determining the maximum pyrolysis temperature of unknown charcoals present in vegetation fires or lake sediments. Creating charcoal from different vegetation species, growth habits, and temperatures is recommended. Additionally, sharing charcoal reference libraries by making charcoal spectra publicly availably can enhance the applicability of the FTIR methodology. Analyzing charcoal from an environment more representative of natural conditions (e.g., combustion facility or instrumenting vegetation fires) would allow these datasets to be used as training (or reference) database for comparison to unknown charcoals. Such efforts contribute to enhancing the application of the FTIR methodology to paleo and modern fire studies.
Data availability statement
The datasets presented in this study can be found in online repositories. The names of the repository/repositories and accession number(s) can be found below: Dryad doi: 10.5061/dryad.cnp5hqcbj.
Author contributions
KM: Data curation, Formal Analysis, Methodology, Visualization, Writing–original draft. MA: Conceptualization, Supervision, Writing–review and editing. HM: Resources, Writing–review and editing. SM: Conceptualization, Writing–review and editing.
Funding
The authors declare financial support was received for the research, authorship, and/or publication of this article. MA and KM would like to acknowledge support by the National Aeronautics and Space Administration under Grant No. NNX15AIO2H, National Science Foundation award 2018848, and the U.S. Army Engineer Research and Development Center (ERDC) and the U.S. Army Corp of Engineers (USACE) under Grant Number W912HZ192001 via the Civil Works Post-Wildfire-Urban Flood Demonstrative Program (UFDP). SM would like to thank the Max Planck Society for funding. HM’s work was supported in part by the National Science Foundation under Grant No. OIA- 2148788.
Acknowledgments
MA and KM gratefully acknowledge laboratory assistance from Robin Smuda and Angelique DePauw. We also thank Corinne Henneberg, Markus Berli, and Rose Shillito for their assistance in editing the manuscript. We also would like to thank the two reviewers for their comments which improved the manuscript.
Conflict of interest
The authors declare that the research was conducted in the absence of any commercial or financial relationships that could be construed as a potential conflict of interest.
Publisher’s note
All claims expressed in this article are solely those of the authors and do not necessarily represent those of their affiliated organizations, or those of the publisher, the editors and the reviewers. Any product that may be evaluated in this article, or claim that may be made by its manufacturer, is not guaranteed or endorsed by the publisher.
Supplementary material
The Supplementary Material for this article can be found online at: https://www.frontiersin.org/articles/10.3389/feart.2024.1354080/full#supplementary-material
References
Agbeshie, A. A., Abugre, S., Atta-Darkwa, T., and Awuah, R. (2022). A review of the effects of forest fire on soil properties. J. For. Res. 33, 1419–1441. doi:10.1007/s11676-022-01475-4
Ascough, P. L., Brock, F., Collinson, M. E., Painter, J. D., Lane, D. W., and Bird, M. I. (2020). Chemical characteristics of macroscopic pyrogenic carbon following millennial-scale environmental exposure. Front. Environ. Sci. 7, 203. doi:10.3389/fenvs.2019.00203
Bartlett, A. I., Hadden, R. M., and Bisby, L. A. (2018). A review of factors affecting the burning behaviour of wood for application to tall timber construction. Fire Technol. 55 (1), 1–49. doi:10.1007/s10694-018-0787-y
Belcher, C. M., and Hudspith, V. A. (2016). The formation of charcoal reflectance and its potential use in post-fire assessments. Int. J. Wildland Fire 25 (7), 775–779. doi:10.1071/wf15185
Bjune, A. E., Birks, H. J. B., Peglar, S. M., and Odland, A. (2010). Developing a modern pollen-climate calibration data set for Norway. Boreas 39 (4), 674–688. doi:10.1111/j.1502-3885.2010.00158.x
Bock, P., and Gierlinger, N. (2019). Infrared and Raman spectra of lignin substructures: coniferyl alcohol, abietin, and coniferyl aldehyde. J. Raman Spectrosc. 50 (6), 778–792. doi:10.1002/jrs.5588
Bowman, D. M., Balch, J. K., Artaxo, P., Bond, W. J., Carlson, J. M., Cochrane, M. A., et al. (2009). Fire in the Earth system. Science 324 (5926), 481–484. doi:10.1126/science.1163886
Bowman, D. M., Balch, J. K., Artaxo, P., Bond, W. J., Cochrane, M. A., D'Antonio, C. M., et al. (2011). The human dimension of fire regimes on Earth. J. Biogeogr. 38 (12), 2223–2236. doi:10.1111/j.1365-2699.2011.02595.x
Bowman, D. M. J. S., Kolden, C. A., Abatzoglou, J. T., Johnston, F. H., van der Werf, G. R., and Flannigan, M. (2020). Vegetation fires in the anthropocene. Nat. Rev. Earth Environ. 1 (10), 500–515. doi:10.1038/s43017-020-0085-3
Bustin, R. M., and Guo, Y. (1999). Abrupt changes (jumps) in reflectance values and chemical compositions of artificial charcoals and inertinite in coals. Int. J. Coal Geol. 38, 237–260. doi:10.1016/S0166-5162(98)00025-1
Cadd, H. R., Tyler, J., Tibby, J., Baldock, J., Hawke, B., Barr, C., et al. (2020). The potential for rapid determination of charcoal from wetland sediments using infrared spectroscopy. Palaeogeogr. Palaeoclimatol. Palaeoecol. 542, 109562. doi:10.1016/j.palaeo.2019.109562
Chen, B., Jin, Y. F., Scaduto, E., Moritz, M. A., Goulden, M. L., and Randerson, J. T. (2021). Climate, fuel, and land use shaped the spatial pattern of wildfire in California’s Sierra Nevada. J. Geophys. Res. Biogeosci. 126 (2), e2020JG005786. doi:10.1029/2020jg005786
Chevalier, M., Davis, B. A. S., Heiri, O., Seppä, H., Chase, B. M., Gajewski, K., et al. (2020). Pollen-based climate reconstruction techniques for late Quaternary studies. Earth Sci. Rev. 210, 103384. doi:10.1016/j.earscirev.2020.103384
Cohen-Ofri, I., Weiner, L., Boaretto, E., Mintz, G., and Weiner, S. (2006). Modern and fossil charcoal: aspects of structure and diagenesis. J. Archaeol. Sci. 33 (3), 428–439. doi:10.1016/j.jas.2005.08.008
Conedera, M., Tinner, W., Neff, C., Meurer, M., Dickens, A. F., and Krebs, P. (2009). Reconstructing past fire regimes: methods, applications, and relevance to fire management and conservation. Quat. Sci. Rev. 28 (5), 555–576. doi:10.1016/j.quascirev.2008.11.005
Constantine, M. t., Mooney, S., Hibbert, B., Marjo, C., Bird, M., Cohen, T., et al. (2021). Using charcoal, ATR FTIR and chemometrics to model the intensity of pyrolysis: exploratory steps towards characterising fire events. Sci. Total Environ. 783, 147052. doi:10.1016/j.scitotenv.2021.147052
Costa, L. R., Trugilho, P. F., and Hein, P. R. G. (2018). Evaluation and classification of eucalypt charcoal quality by near infrared spectroscopy. Biomass Bioenergy 112, 85–92. doi:10.1016/j.biombioe.2018.02.017
Cuña Suárez, A., Tancredi, N., Pinheiro, P. C. C., and Yoshida, M. I. (2010). Thermal analysis of the combustion of charcoals from Eucalyptus dunnii obtained at different pyrolysis temperatures. J. Therm. Anal. Calorim. 100 (3), 1051–1054. doi:10.1007/s10973-010-0746-4
De la Rosa, J. M., Jimenez-Gonzalez, M. A., Jimenez-Morillo, N. T., Knicker, H., and Almendros, G. (2019). Quantitative forecasting black (pyrogenic) carbon in soils by chemometric analysis of infrared spectra. J. Environ. Manage 251, 109567. doi:10.1016/j.jenvman.2019.109567
Dietze, E., Brykala, D., Schreuder, L. T., Jazdzewski, K., Blarquez, O., Brauer, A., et al. (2019). Human-induced fire regime shifts during 19th century industrialization: a robust fire regime reconstruction using northern Polish lake sediments. PLoS One 14 (9), e0222011. doi:10.1371/journal.pone.0222011
Dinerstein, E., Olson, D., Joshi, A., Vynne, C., Burgess, N. D., Wikramanayake, E., et al. (2017). An ecoregion-based approach to protecting half the terrestrial realm. BioScience 67 (6), 534–545. doi:10.1093/biosci/bix014
Evans, P. A. (1991). Differentiating “hard” from “soft” woods using Fourier transform infrared and Fourier transform spectroscopy. Spectrochim. Acta A Mol. Biomol. Spectrosc. 47 (9), 1441–1447. doi:10.1016/0584-8539(91)80235-B
Gill, A. M. (1975). Fire and the Australian flora: a review. Aust. For. 38 (1), 4–25. doi:10.1080/00049158.1975.10675618
Gosling, W. D., Cornelissen, H. L., and McMichael, C. N. H. (2019). Reconstructing past fire temperatures from ancient charcoal material. Palaeogeogr. Palaeoclimatol. Palaeoecol. 520, 128–137. doi:10.1016/j.palaeo.2019.01.029
Gosling, W. D., and McMichael, C. N. H. (2023) The use of micro infrared spectroscopy in reconstructing past ecological and environmental change. Reference module in Earth systems and environmental Sciences Germany, (ed. by R. Bradshaw) Elsevier. doi:10.1016/B978-0-323-99931-1.00087-8
Guo, Y., and Bustin, R. M. (1998). FTIR spectroscopy and reflectance of modern charcoals and fungal decayed woods: implications for studies of inertinite in coals. Int. J. Coal Geol. 37, 29–53. doi:10.1016/s0166-5162(98)00019-6
Higuera, P. E., Gavin, D. G., Bartlein, P. J., and Hallett, D. J. (2010). Peak detection in sediment–charcoal records: impacts of alternative data analysis methods on fire-history interpretations. Int. J. Wildland Fire 19, 996–1014. doi:10.1071/WF09134
Hudspith, V. A., Belcher, C. M., and Yearsley, J. M. (2014). Charring temperatures are driven by the fuel types burned in a peatland wildfire. Front. Plant Sci. 5, 714. doi:10.3389/fpls.2014.00714
Keeley, J. E. (2009). Fire intensity, fire severity and burn severity: a brief review and suggested usage. Int. J. Wildland Fire 18, 116–126. doi:10.1071/WF07049
Labbe, N., Harper, D., Rials, T., and Elder, T. (2006). Chemical structure of wood charcoal by infrared spectroscopy and multivariate analysis. J. Agric. Food Chem. 54, 3492–3497. doi:10.1021/jf053062n
Maezumi, S. Y., Gosling, W. D., Kirschner, J., Chevalier, M., Cornelissen, H. L., Heinecke, T., et al. (2021). A modern analogue matching approach to characterize fire temperatures and plant species from charcoal. Palaeogeogr. Palaeoclimatol. Palaeoecol. 578, 110580. doi:10.1016/j.palaeo.2021.110580
Marlon, J. R., Kelly, R., Daniau, A.-L., Vannière, B., Power, M. J., Bartlein, P., et al. (2016). Reconstructions of biomass burning from sediment-charcoal records to improve data–model comparisons. Biogeosciences 13 (11), 3225–3244. doi:10.5194/bg-13-3225-2016
Mastrolonardo, G., Francioso, O., Di Foggia, M., Bonora, S., Rumpel, C., and Certini, G. (2014). Application of thermal and spectroscopic techniques to assess fire-induced changes to soil organic matter in a Mediterranean forest. J. Geochem. Explor. 143, 174–182. doi:10.1016/j.gexplo.2014.04.010
Merino, A., Fonturbel, M. T., Fernandez, C., Chavez-Vergara, B., Garcia-Oliva, F., and Vega, J. A. (2018). Inferring changes in soil organic matter in post-wildfire soil burn severity levels in a temperate climate. Sci. Total Environ. 627, 622–632. doi:10.1016/j.scitotenv.2018.01.189
Nascimento, M. d.N., McMichael, C. N. H., Kleijwegta, Z., Åkesson, C., Gredal, C., Maezumi, S. Y., et al. (2023). Fire in the clouds: how changing land use shaped an Andean biodiversity hotspot. Quat. Sci. Rev. 317, 108278. doi:10.1016/j.quascirev.2023.108278
Pandey, K. K. (1999). A study of chemical structure of soft and hardwood and wood polymers by FTIR spectroscopy. J. Appl. Polym. Sci. 71 (12), 1969–1975. doi:10.1002/(sici)1097-4628(19990321)71:12<1969::aid-app6>3.0.co;2-d
Pandey, K. K., and Theagarajan, K. S. (1997). Analysis of wood surfaces and ground wood by diffuse reflectance (DRIFT) and photoacoustic (PAS) Fourier transform infrared spectroscopic techniques. Holz als Roh- Werkst. 55 (6), 383–390. doi:10.1007/s001070050251
Pyle, L. A., Hockaday, W. C., Boutton, T., Zygourakis, K., Kinney, T. J., and Masiello, C. A. (2015). Chemical and isotopic thresholds in charring: implications for the interpretation of charcoal mass and isotopic data. Environ. Sci. Technol. 49 (24), 14057–14064. doi:10.1021/acs.est.5b03087
Roos, C. I., and Scott, A. C. (2018). A comparison of charcoal reflectance between crown and surface fire contexts in dry south-west USA forests. Int. J. Wildland Fire 27 (6), 396. doi:10.1071/wf17139
Rutherford, D. W., Wershaw, R. L., and Reeves, J. B. (2008). Development of acid functional groups and lactones during the thermal degradation of wood and wood components: U.S. Geol. Surv. Sci. Investig. Rep. 5013, 43p.
Schoennagel, T., Balch, J. K., Brenkert-Smith, H., Dennison, P. E., Harvey, B. J., Krawchuk, M. A., et al. (2017). Adapt to more wildfire in western North American forests as climate changes. Proc. Natl. Acad. Sci. U. S. A. 114 (18), 4582–4590. doi:10.1073/pnas.1617464114
Scott, A. C., and Damblon, F. (2010). Charcoal: taphonomy and significance in geology, botany and archaeology. Palaeogeogr. Palaeoclimatol. Palaeoecol. 291 (1-2), 1–10. doi:10.1016/j.palaeo.2010.03.044
Silva, F. R. y., Guijarro, M., Madrigal, J., Jiménez, E., Molina, J. R., Hernando, C., et al. (2017). Assessment of crown fire initiation and spread models in Mediterranean conifer forests by using data from field and laboratory experiments. For. Syst. 26 (2), e02S. doi:10.5424/fs/2017262-10652
Simpson, G. L. (2007). Analogue methods in palaeoecology: using the analogue package. J. Stat. Softw. 22 (2), 1–29. doi:10.18637/jss.v022.i02
Theurer, T., Muirhead, D. K., Jolley, D., and Mauquoy, D. (2021). The applicability of Raman spectroscopy in the assessment of palaeowildfire intensity. Palaeogeogr. Palaeoclimatol. Palaeoecol. 570, 110363. doi:10.1016/j.palaeo.2021.110363
Theurer, T., Naszarkowski, N., Muirhead, D. K., Jolley, D., and Mauquoy, D. (2022). Assessing modern calluna heathland fire temperatures using Raman spectroscopy: implications for past regimes and geothermometry. Front. Earth Sci. 10, 827933. doi:10.3389/feart.2022.827933
Tian, J., Chow, J. C., Cao, J., Han, Y., Ni, H., Chen, L. W. A., et al. (2015). A biomass combustion chamber: design, evaluation, and a case study of wheat straw combustion emission tests. Aerosol Air Qual Res 15 (5), 2104–2114. doi:10.4209/aaqr.2015.03.0167
Turner, M. G., Braziunas, K. H., Hansen, W. D., and Harvey, B. J. (2019). Short-interval severe fire erodes the resilience of subalpine lodgepole pine forests. Proc. Natl. Acad. Sci. U. S. A. 116 (23), 11319–11328. doi:10.1073/pnas.1902841116
Vachula, R. S., and Richter, N. (2018). Informing sedimentary charcoal-based fire reconstructions with a kinematic transport model. Holocene 28 (1), 173–178. doi:10.1177/0959683617715624
Whitlock, C., Higuera, P. E., McWethy, D. B., and Briles, C. E. (2010). Paleoecological perspectives on fire ecology: revisiting the fire-regime concept∼!2009-09-02∼!2009-11-09∼!2010-03-05∼!. Open J. Ecol. 3, 6–23. doi:10.2174/1874213001003020006
Whitlock, C., and Larsen, C. (2001). “Charcoal as a fire proxy,” in Tracking environmental change using lake sediments: terrestrial, algal, and siliceous indicators. Editors J. P. Smol, H. J. B. Birks, W. M. Last, R. S. Bradley, and K. Alverson (Dordrecht: Springer Netherlands), 75–97.
Yong, T.L.-K., and Matsumura, Y. (2013). Kinetic analysis of lignin hydrothermal conversion in sub- and supercritical water. Ind. Eng. Chem. Res. 52 (16), 5626–5639. doi:10.1021/ie400600x
Keywords: charcoal, combustion facility, fourier transform infrared spectroscopy (FTIR), pyrolysis temperature, vegetation fire
Citation: Minatre KL, Arienzo MM, Moosmüller H and Maezumi SY (2024) Charcoal analysis for temperature reconstruction with infrared spectroscopy. Front. Earth Sci. 12:1354080. doi: 10.3389/feart.2024.1354080
Received: 11 December 2023; Accepted: 02 February 2024;
Published: 16 February 2024.
Edited by:
Patrick G Hatcher, Old Dominion University, United StatesReviewed by:
José María De La Rosa, Spanish National Research Council (CSIC), SpainConstantin Nechita, National Institute for Research and Development in Forestry Marin Dracea (INCDS), Romania
Copyright © 2024 Minatre, Arienzo, Moosmüller and Maezumi. This is an open-access article distributed under the terms of the Creative Commons Attribution License (CC BY). The use, distribution or reproduction in other forums is permitted, provided the original author(s) and the copyright owner(s) are credited and that the original publication in this journal is cited, in accordance with accepted academic practice. No use, distribution or reproduction is permitted which does not comply with these terms.
*Correspondence: Kerri L. Minatre, a2VycmkubWluYXRyZUBkcmkuZWR1