
94% of researchers rate our articles as excellent or good
Learn more about the work of our research integrity team to safeguard the quality of each article we publish.
Find out more
ORIGINAL RESEARCH article
Front. Earth Sci., 25 March 2024
Sec. Geohazards and Georisks
Volume 12 - 2024 | https://doi.org/10.3389/feart.2024.1348653
This article is part of the Research TopicRisk Assessment, Stability Monitoring, and Safe Design for Deep Rock EngineeringView all 20 articles
 Zepeng Han1,2
 Linming Dou1,2*Siyuan Gong1,2
 Jinrong Cao1,2Shuai Chen1,2,3Bing Hu4Yongyuan Li4Kezhi Zeng5
Mining-induced far-field mine tremors, which often cause strong ground tremors, are receiving more attention due to their increasing occurrence. Investigating the rock burst risk of roadway caused by those tremors is crucial to ensure production safety. In this study, Variational Mode Decomposition was used to investigate the wave characteristics of strong mine tremors. The propagation and attenuation of these tremors were explored using the dynamic analysis of Flac3d. The amplification factor was introduced to assess the impact of these tremors on roadways. Plastic zone volume increment and Brittle Shear Ratio (BSR) are used to assess the roadway failure and the rock burst potential caused by these tremors, respectively. The main findings are as follows: 1) Compared with the main frequency of near-field mine tremor waveform, the far-field mine tremors waveform are mainly low frequency below 5 Hz; 2) In the simulation, peak vibration velocities of P-wave and S-wave follow a power-law decay as the propagation distance increases, with P-wave attenuating faster than S-wave; 3) Under similar conditions, P-wave induce higher vibration velocities than S-wave, but S-wave generally exhibit a greater amplification factor than P-wave; 4) When the direction of dynamic load is consistent with the direction of maximum principal stress, the rock burst potential of roadway is higher, which explains the phenomenon that the rock burst potential of roadway under S-wave loading is higher than that under P-wave.
Strong mine tremors reported worldwide are becoming an increasing threat to safe mining operations as mines extend to the deeper subsurface (Małkowski and Niedbalski, 2020). The essence of tremor is the fracture initiation, propagation, and reactivation of rock, usually triggered by the redistribution of regional stress due to mineral extraction in large scale. It has been well-documented that these rock failure processes are associated with the release of detectable seismic wave. Through the deep analysis of seismic wave, especially the method of focal mechanism inversion, the relevant information on source rupture can be retrieved and the failure mode of the source can be revealed (Cesca and Grigoli, 2015). In recent years, a majority of coal mines have extended their operations to depths exceeding 600 m in the East, North, and Northeast of China (Qiao et al., 2014). Due to the high static stress of deep mining roadway, strong mine tremors could easily trigger roadway’s dynamic failure. The occurrence of strong mine tremors and their induced dynamic disasters is a recurrent issue that significantly hazards the safety of underground miners, nearby residents, and the efficiency of mining operations. On 9 June 2019, a mine tremor with a magnitude of 2.3 struck the Longjiapu coal mine, resulting in 9 fatalities and 10 injuries. This tragic incident underscored the risks associated with strong mine tremors.
In underground mining, strong mine tremors can be divided into coal pillar failure (Mendecki et al., 2019), mining-induced structural and fault activation (Islam and Shinjo, 2009), and the brokening of the overlying hard roof (Jiang et al., 2019). Researchers have undertaken comprehensive investigations the mechanisms, focal mechanisms, predictive measures, and preventative strategies of these strong mine tremors (Sen et al., 2013; He et al., 2017; Wang, 2023). Nevertheless, in recent years in China, a type of strong mine tremors induced by coal mining has attracted strong attention: the mine tremors caused by the collapse of the hard, extremely thick roof in the high above of the coal seam. Because these strong mine tremors’ vertical position is approximately 100 m or even farther from the coal seam, they are referred to as “far-field strong mine tremors”. These tremors, given their proximity to the surface, frequently result in significant vibration on the ground, instigating widespread concern. Currently, coal mines with a high frequency of such far-field strong mine tremors include Hongqinghe (Zhang et al., 2021), Jinjitan, Shilawusu (Yang et al., 2023), Dongtan, Nantun (Guo et al., 2022; Liang et al., 2022), Baodian (Cao et al., 2015; He et al., 2022). Notably, Dongtan, Nantun, and Baodian all fall within the Yanzhou coalfield, positioned near one another, and share similar mining conditions characterized by the presence of substantial, maroon thick sandstone layers above the coal seam, often referred to as the “red layer”. According to statistics, the cumulative count of strong mining tremors caused by coal mining under the “red layer” has reached more than 600 times. The mine tremors caused by coal mining under this special roof structure have attracted some Chinese scholars to study this phenomenon. Wang et al. (Wang et al., 2022) found that the mechanism of strong mine tremors in Dongtan Coal mine is mainly the structural instability of mine tremors which is dominated by tensile failure. However, Wu et al. (Wu et al., 2023a) conducted a comprehensive study of the focal mechanisms for 27 strong mine tremors in Dongtan Coal Mine, revealing that the predominant mechanism was attributed to pure shear failure. Zou et al. (Zou et al., 2022) contend that the position of the strong mine tremors in Dongtan Coal Mine is situated within the “red layer,” and they propose that the severity of these mine tremors can be effectively mitigated through the implementation of deep hole blasting. Moreover, Wu et al. (Wu et al., 2023b) conducted simulations using LS-DYNA and UDEC 7.0 to model the pre-splitting of rock and the migration of overburden during deep-hole blasting at the working face. Their research reveals the mechanism of deep hole blasting in the face to achieve roof pre-cracking and pressure relief. Jiao et al. (Jiao et al., 2021) discovered that strong mine tremors result from the collaborative failure of multiple strata, as deduced from waveform analysis. They also propose using the rate of surface subsidence as a predictive indicator for the occurrence of strong mine tremors.
Current research predominantly centers on predicting strong mine tremors, assessing preventive and control strategies, and exploring focal mechanisms. The practice shows that this type of mine tremor rarely causes rock burst directly, and generally only has strong seisesthesia. Therefore, it is necessary to study the degree of roadway rock burst risk induced by this type of mine tremors. Dynamic analysis in Flac3d serves as a valuable tool for investigating dynamic stress induced by tremors in coal mining, and many studies have employed this approach to simulate mine tremors (Itasca Consulting Group, 2023). Liu et al. (Liu et al., 2019) discovered that the resonant frequency of the roadway in Zhuji Coal Mine is 35Hz, and the intensity of the mine tremors wave reaches its peak at this specific frequency. Kong et al. (Kong et al., 2019) conducted a study on the deformation and rock burst potential of roadways under various combinations of dynamic and static stress. Wang et al. (Wang et al., 2022) and Cao et al. (Cao et al., 2023) delved into the mechanisms of rock burst occurring in steeply inclined coal seams under the influence of dynamic and static stress combinations. Zhu et al. (Zhu et al., 2021) illustrated the evolution process in displacement, stress, and velocity along the fault plane induced by dynamic stress. This study takes the Dongtan Coal mine, where far-field strong mine tremors often occur, as the engineering background. Using Variational Mode Decomposition (VMD) decomposition and time-frequency analysis, the typical characteristics of far-field strong mine earthquakes are obtained. A numerical model based on Mohr-Coulomb and strain softening failure criterion is established, and the damping coefficient of the model is strictly calibrated. Meticulously analyzes the influence of different frequencies and dynamic load types (P-wave and S-wave) on the plastic failure and rock burst potential of the roadway. The propagation law of dynamic load in complex multilayer media and the amplification effect of roadway surface are analyzed. The study’s findings offer valuable insights into the attenuation of dynamic loads, enhancing our understanding of far-field strong mine tremors.
Dongtan Coal Mine is located in Yanzhou, Shandong, China, and attracted widespread attention due to frequent strong mine tremors (Figure 1A). In the course of mining operations in the Dongtan No. 6 mining area, a multitude of tremors were detectable by the earthquake monitoring network. These tremors resulted in the shaking of residential structures in proximity to the mine, thereby engendering significant social repercussions. The current main coal seam is 3upper with a buried depth of about 680 m. The thickness of 3upper coal seam is in the range of 4.12–6.79 m, with an average value of 5.41 m. The coal seam is nearly horizontal and the geological structure is relatively simple. The maximum horizontal principal stress is 24.96∼27.12 MPa at the direction of SE 148.93°∼150.00°. The maximum horizontal principal stress is 2.15∼3.29 times the minimum horizontal principal stress and 1.44∼1.72 times the vertical stress.
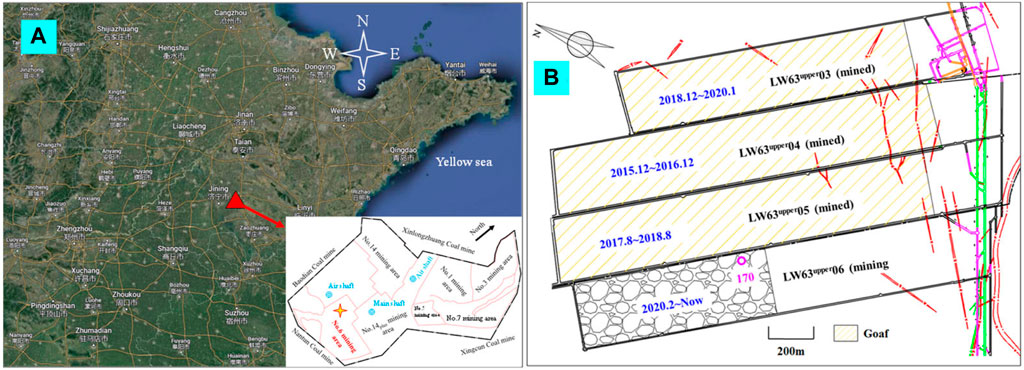
Figure 1. The location of Dongtan coal mine and the division of working faces in No.6 mining area (Zou et al., 2022). (A) The location of Dongtan coal mine, (B) The division of working faces in No.6 mining area.
Dongtan coal mine is divided into 7 mining areas, and the No.6 mining area is located in the south of the coal mine. Longwall (LW) fully mechanized mining technology is adopted. Four working faces have been exploited with the mining sequence of LW63upper04 ⇒ LW63upper05 ⇒ LW63upper03 ⇒ LW63upper06 (Figure 1B). The former three are finished and turned into goaves. As of October 2022, the LW63upper06 has been advanced to 879 m (the panel length is 1,500 m). The lithology of the roof and floor of the 3upper coal are mainly sandstone with high strength, and their main mechanical parameters have been measured in the laboratory (see Supplementary Table S1).
A 16-channel microseismic (MS) monitoring system, developed by the Institute of Innovative Technologies EMAG, Poland, has been installed to determine the location and energy of mine tremors. DLM microseismic sensors with an operating frequency of 0.1–200 Hz are included in this system. MS signals are transmitted via electric transmission lines to the surface. Eight sensors (4#, 5#, 6#, 14#, 15#, 17#, 28#, 29#) are installed in different positions of underground roadways in the No. 6 mining area and two sensors (16#, 29#) are installed on the ground to form a joint stereoscopic MS monitoring network (Figure 2A), which improves the positioning accuracy of the microseismic monitoring system in the vertical direction. The sampling frequency range of these sensors is 500 Hz. The No. 6 mining area of Dongtan Coal Mine experienced a substantial number of strong mine tremors during previous coal mining. These tremors prompted considerable social anxiety and drew significant government attention. Specifically, 15 mine tremors, with magnitudes exceeding 1.5, were recorded on LW63upper03, while LW63upper04 and LW63upper05 reported 39 and 56 such tremors, respectively. Compared with other working faces, mine tremor on working face LW63upper06 is more severe. Since the start of mining in February 2020, there have been more than 34 large energy mine tremors with a magnitude of more than 2.0 (Figure 2C). It can be seen from Figure 2B that strong mine tremors mainly occur in the roof rock layer, especially near the lower boundary of the “red layer”.
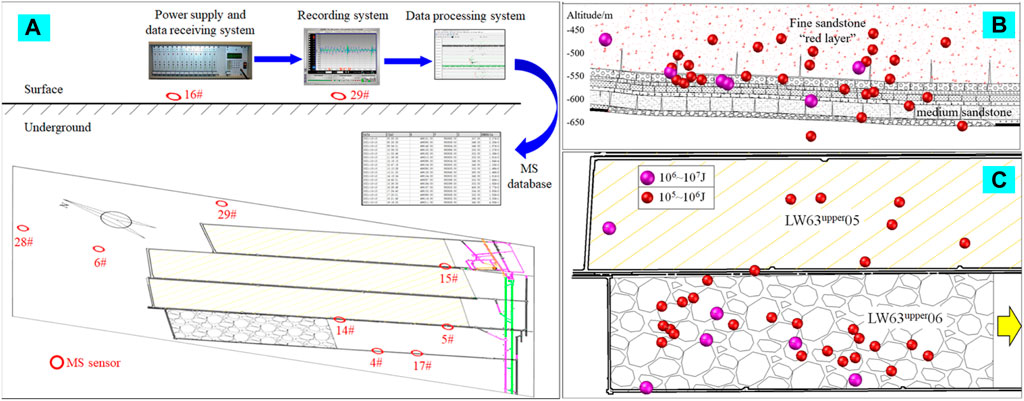
Figure 2. Joint underground-surface MS monitoring network and Strong mine tremors during mining of LW63upper06: (A) Joint underground-surface MS monitoring network in the study area, (B) mine tremors profile locations, (C) mine tremors plane locations.
In Dongtan Coal Mine, there have been numerous strong mine tremors, but they rarely lead to roadway rock bursts. This phenomenon might be closely linked to the vibration characteristics of these tremors and the distance between their source and the roadways. Figure 3 presents waveform diagrams of two distinct types of strong mine tremors. Wave 1, originating from the red layer located 180 m away from the coal seam, is classified as a far-field wave. Wave 2, originates from the central sandstone layer just 30 m from the coal seam. Both waves are recorded by the 14# microseismic sensor. Both mine tremors display approximately 2 s of intense fluctuations, followed by a phase of minor amplitude variations. This temporal pattern sets them apart from natural earthquakes, which typically last for over 10 s. Notably, Wave 2 has a higher dominant frequency than Wave 1. Additionally, the maximum amplitude of Wave 2 seems to exceed the detection range of the microseismic sensor. Zhou et al. (Zhou et al., 2016) used numerical simulations to show that medium properties cause frequency attenuation in blast waves over distance. Similarly, the stark contrast between the two waveforms might result from either frequency and amplitude attenuation during propagation or significant differences in tremor sources, making a clear explanation challenging. It is worth noting that what we analyze here is the frequency and vibration speed when the vibration propagates from the source to the roadway.
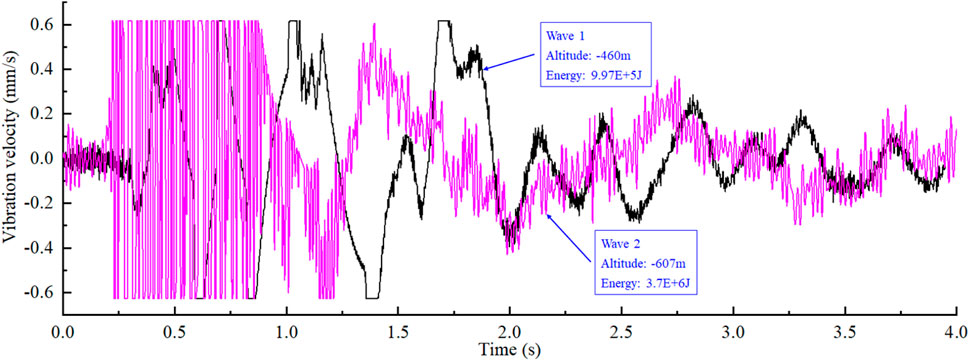
Figure 3. Two typical mine tremors waveforms: (A) Wave 1 is a far-field strong mine tremor, (B) Wave 2 is a near-field strong mine tremor.
Ambient noise and instrument-related interference can complicate the recorded waveforms. Variational Mode Decomposition (VMD), a non-recursive signal processing method developed in 2014 was utilized to address this (Dragomiretskiy and Zosso, 2013; Liu et al., 2016; Liu et al., 2023). VMD is renowned for its effective noise reduction capabilities and its ability to mitigate the issue of frequency aliasing commonly seen in empirical mode decomposition (EMD). Figure 4 shows the result of two typical waveform’s VMD and Hilbert spectrum. The main frequency of wave 1 is in the range of 0–5 Hz, and the duration is longer than 2 s (Figure 4B). The components of wave 2 are quite complex, with frequencies ranging from 0 to 80 Hz, but the components in the range of 20–80 Hz last for about 1 s and disappear, and the components below 10 Hz last for more than 3 s (Figure 4D). The analysis above indicates that the high-frequency component of the waveform decays much faster than the low-frequency component.
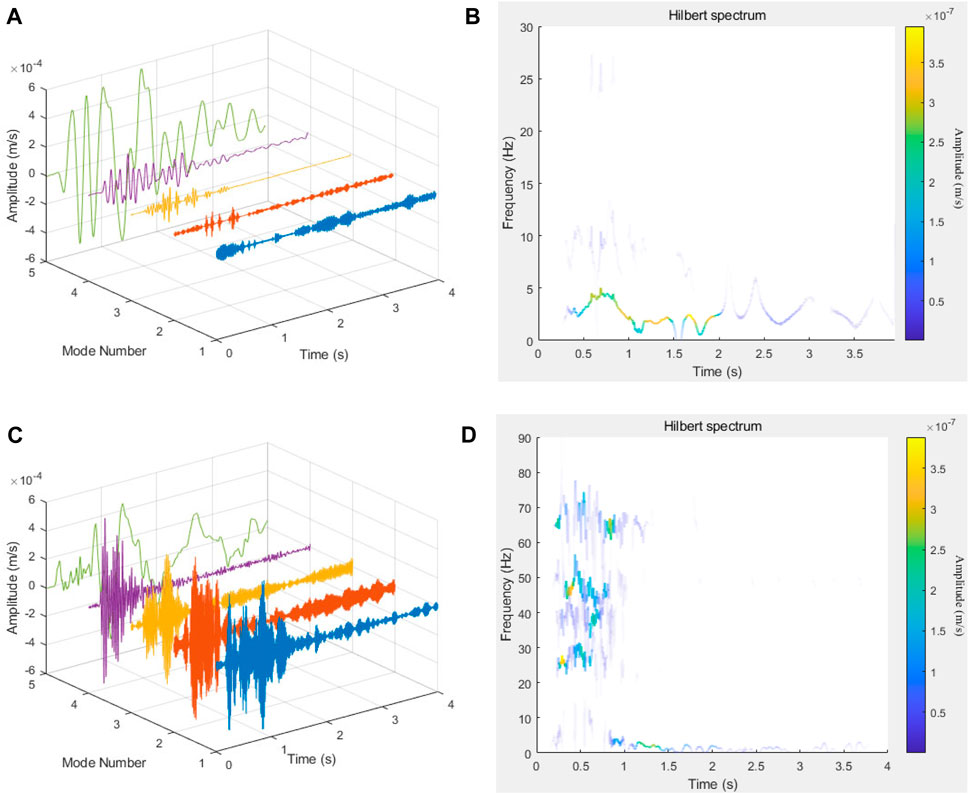
Figure 4. Spectrum characteristics of typical mine tremors. (A) VMD result of wave 1, (B) Hilbert spectrum of wave 1, (C) VMD result of wave 2, (D) Hilbert spectrum of wave 2.
To analyze the effect of vibration on the roadway after it is generated from the tremor source, a numerical model of fine calibration is established for analysis. According to the actual measured borehole histogram in study area, a global model was established after proper simplification of the rock strata (Figure 5A). The model size was 150 m ×30 m × 164 m (length × width × height). The number of zones in numerical modeling is 355,000, the size of the rock strata grid is less than 2 m, and the size of the coal seam grid is about 0.5 m. The four sides and the bottom of the model were constrained by velocity. The average burial depth of LW63upper06 is 680 m, so vertical stress of 17.2 MPa was applied to the top of the model. Horizontal stress is applied by the real ground stress test results detailed in section 2.1. The Strain-softening model was used to simulate the coal seam, and the Mohr–Coulomb model was used to simulate other rock strata.
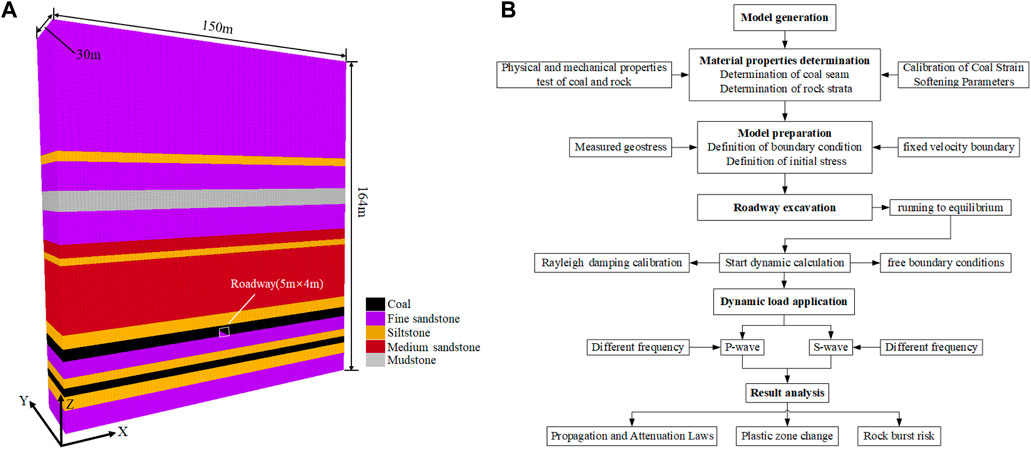
Figure 5. Numerical computational model and flowchart of numerical modeling: (A) Numerical simulation model, (B) Simulation flow chart.
The simulation process, detailed in Figure 5B, began with the assignment of initial parameters and equilibrium calculations. Subsequently, the roadway was excavated, and the model was recalculated to reach equilibrium. Finally, the dynamic calculation model was opened, various dynamic loads were applied, and the study examined the propagation and attenuation patterns of these dynamic loads and their rockburst potential on the roadway.
The physical and mechanical parameters of the rock mass were determined through laboratory tests conducted on test specimens, combined with a parameter conversion method previously proposed. To establish this relationship, data from 44 different sources were collected to compare experimental mechanical parameters with simulated ones, resulting in a linear conversion relationship as follows (Mohammad et al., 1997):
Where,
Dongtan Coal Mine extensively measured the mechanical parameters of coal and rock (see Supplementary Table S1). Utilizing the conversion relationships outlined in formulas (1), (2), and (3), the mechanical parameters for the model’s rock strata were determined (shown in Supplementary Table S2). The coal seam employs a strain-softening constitutive model, with its mechanical parameters calibrated through numerous iterations.
In Dongtan Coal Mine, the roof and floor primarily consist of high-rigidity sandstone, while the coal seam is notably weaker. Therefore, the impact of the coal body’s strain-softening characteristics on roadway stability must be taken into account. A Fish program was used to calibrate the strain-softening parameters of coal (Supplementary Figure S1). The simulation model matches the dimensions of the laboratory coal sample, with a diameter and height of 50 mm and 100 mm, respectively (Figure 6A). During the simulation, parameters such as elastic modulus, cohesion, and softening coefficient are adjusted until the simulated stress-strain curve closely aligns with the experimental stress-strain curve (Figure 6B). The validated strain softening parameters for the coal are presented in Supplementary Table S3.
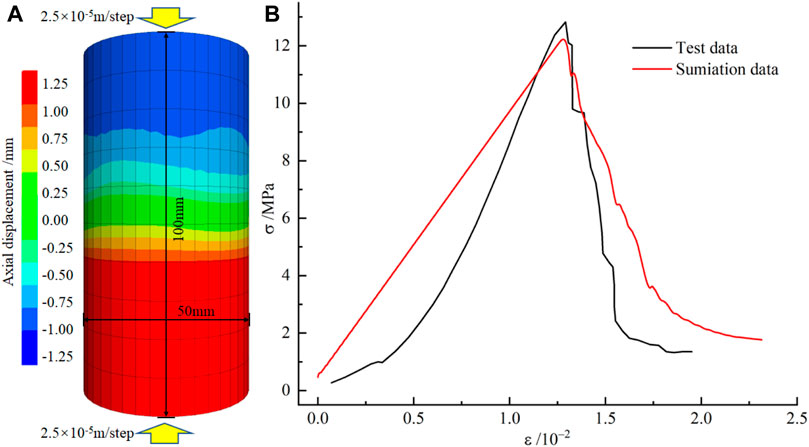
Figure 6. Calibration of mechanical parameters for coal samples: (A) Specimen loading method, (B) Simulated stress-strain curve and laboratory stress-strain curve.
Attenuation during stress wave propagation can be simulated in Flac3d numerical simulation by applying rayleigh damping, local damping, or hysteretic damping. In the dynamic calculation process of this paper, rayleigh damping is used. The Rayleigh damping equation can be expressed as a matrix:
Where,
According to the FLAC3D manual, the damping coefficient and center frequency must be determined for Rayleigh damping. For geological materials, the
As depicted in Figure 7, a total of 12 monitoring points were strategically positioned within the meticulously calibrated numerical model to meticulously capture and assess alterations in vibration velocity induced by dynamic loading. This arrangement comprises nine monitoring points distributed along the path from the source to the roadway’s apex, with an additional three points situated at the roadway’s base. In alignment with field conditions, the dynamic load source is applied to the primary key layer, known as the “red layer.” The figure also delineates the P-wave’s propagation pattern, encompassing a 10 m×10 m spatial extent, with its initial vibration directed forward along the z-axis.
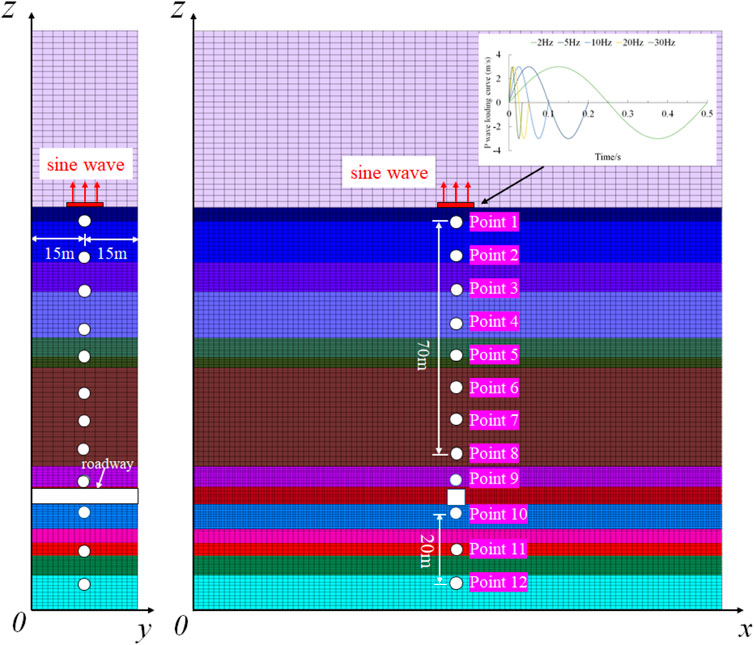
Figure 7. Placement of monitoring points in the numerical model.
When using Flac3d to simulate vibration waves, many researchers assume that the waveform is a sine wave, and this practice is also adopted in this paper (He et al., 2020; Mukhamedyarova et al., 2023). Sinusoidal wave at frequencies ranging from 2 Hz to 100 Hz, each with an amplitude of 3 m/s, were applied to the model. The application area of the P-wave is depicted in Figure 7. Figure 8 illustrates the propagation of the P-wave when excited at the source, forming an ellipsoidal pattern with the source as the epicenter. Notably, the figure reveals that the leading edge of the wavefront in the Z-axis direction precedes that in the X-axis direction. This observation indicates that the P-wave, traveling in the direction of excitation, exhibits a significantly higher velocity. At equivalent propagation distances, the P-wave velocity in the excitation direction far surpasses that in other orientations. Furthermore, it can be inferred that the S-wave generated due to P-wave excitation in the Z-direction experiences relatively slower propagation as they move along the X-direction.

Figure 8. P-wave propagation velocity cloud in the Z-direction: (A) P-wave propagating outward from the source; (B) P-wave arrival at the roadway.
Figure 9 displays a regression model we’ve developed to elucidate the attenuation patterns of peak vibration velocity at various monitoring points under the influence of dynamic loads at different frequencies. The data clearly follows a power-law decay as vibration propagates over distance, which is consistent with the results of other scholars (Krylov, 2014). Upon analysis, we’ve observed that the attenuation coefficient decreases within the 2 Hz–30 Hz frequency range, but subsequently increases within the 30 Hz–90 Hz frequency range. Additionally, a notable phenomenon emerges as vibrations travel from P9 to P10: they experience varying levels of amplification due to the roadway’s surface effect, followed by a significant drop in vibration velocity due to diffraction as they pass through the roadway.
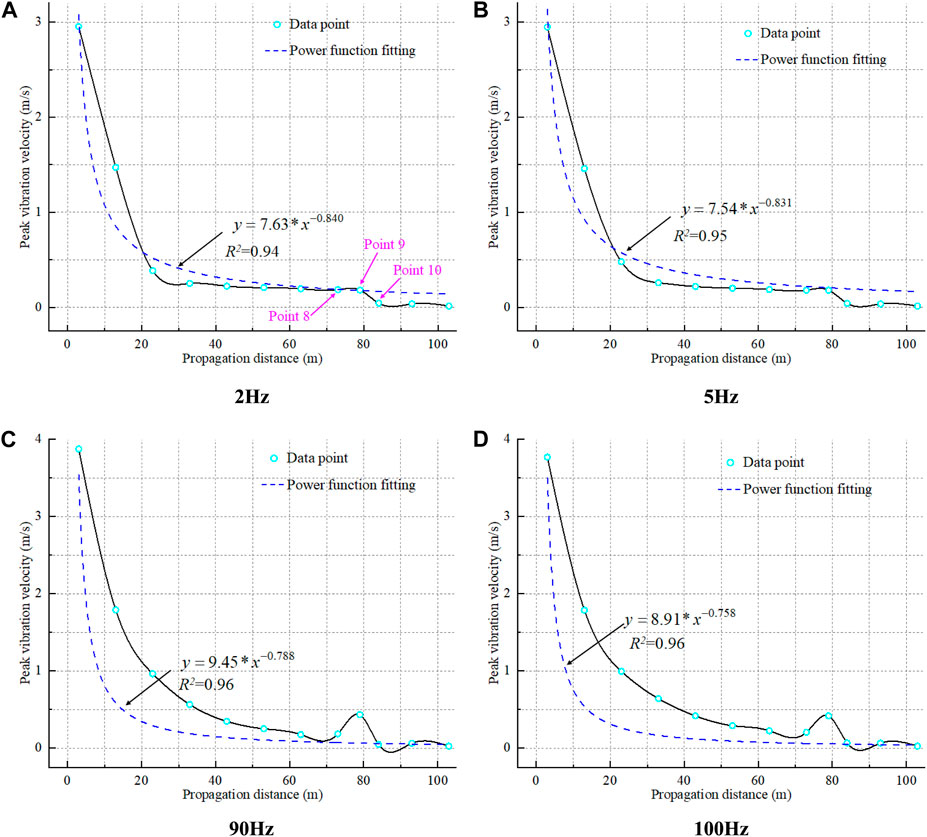
Figure 9. P-wave attenuation patterns at varying frequencies: (A) Attenuation law of P-wave with 2 Hz, (B) Attenuation law of P-wave with 5 Hz, (C) Attenuation law of P-wave with 90 Hz, (D) Attenuation law of P-wave with 100 Hz.
The P9-to-P8 ratio was used as an amplification factor to quantify the amplifying effect of roadway surface on vibration velocity. Figure 10 displays peak vibration velocity and the amplification coefficient at P9 across different frequencies, revealing a strong correlation between these parameters. In the 2 Hz–20 Hz frequency range, both parameters gradually increase with frequency. Notably, between 30 Hz and 50 Hz, they experience rapid growth, but from 60 Hz to 100 Hz, this growth tapers off. At 70 Hz, P9 reaches its maximum vibration velocity at 0.436 m/s, and at 90 Hz, the amplification coefficient peaks at 2.34. These findings underscore the dynamic relationship between frequency and P9’s response characteristics.
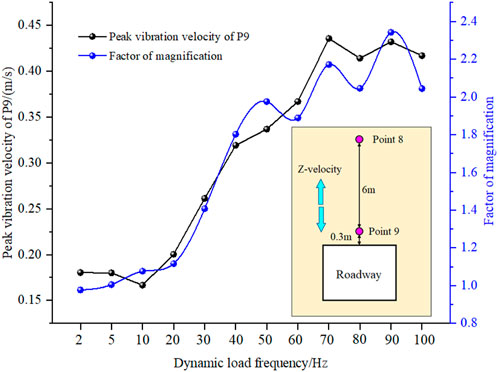
Figure 10. Effect of P-wave at different frequencies on roadway.
Similar to our research method with P-wave, the propagation of S-wave at various frequencies within coal and rock formations was systematically simulated. The key difference between S-wave and P-wave lies in their unique propagation characteristics. S-wave exhibit a perpendicular propagation direction relative to their vibrational motion, whereas P-wave propagate parallel to their vibration. We maintained consistent application positions and areas for S-wave as with P-wave, as outlined in Figure 11. Notably, in Figure 11A, the substantial variations in material properties of the propagation medium result in divergent propagation intensities for S-wave along the positive and negative z-axes when the source is at the interface. This phenomenon primarily arises from wave reflections induced by disparities in the physical properties of the multilayered rock formations. Similar to the phenomenon when P waves are applied, when S-wave are applied, vibrational velocity propagates outward in an elliptical pattern. In this scenario, the propagation velocity differs along the Z-axis compared to the X-axis. As depicted in Figure 11B, when S-wave are excited along the X-axis, they generate shear forces within the coal-rock mass along the z-axis, which is perpendicular to the direction of S-wave vibration. On either side of this pathway, vibrational velocity direction is opposite. Consequently, vibrational velocity in the Z-direction is notably smaller than in the X-direction. Hence, our primary focus in this study centers on vibrational velocity in the X-direction.
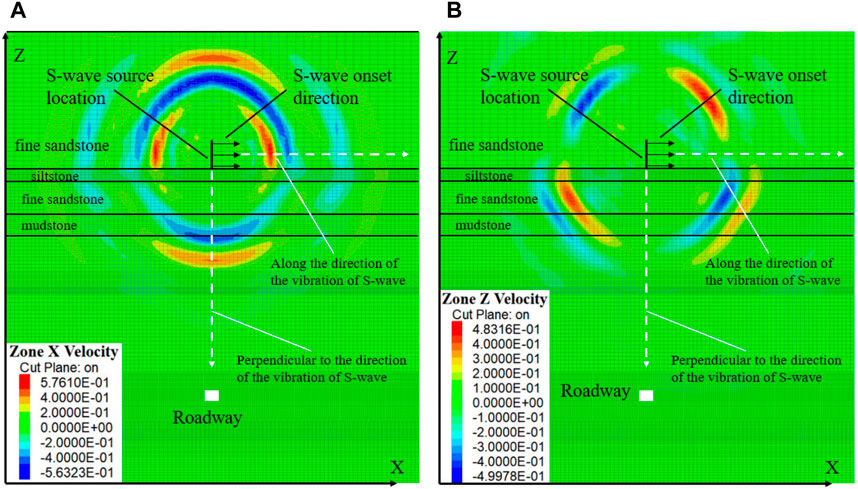
Figure 11. S-wave velocity propagation patterns in the X-Direction and Z-direction: (A) S-wave velocity propagation in the X-Direction; (B) S-wave velocity propagation in the Z-direction.
The power function is used to fit the attenuation rules of S waves of different frequencies when propagating in the numerical model (see Supplementary Figure S3). The plot reveals an increase in the attenuation coefficient as the frequency escalates from 2 Hz to 20 Hz, and a subsequent decrease as the frequency extends from 30 Hz to 100 Hz. This pattern is in contrast to the P-wave attenuation coefficient. Furthermore, when S-wave propagates towards P9, there is a noticeable increase in peak vibration velocity and a corresponding decrease when they reach P10. Similarly, we defined the amplification factor as the ratio of peak vibration velocity at P9 to P8. Figure 12 depicts the amplification coefficient and peak vibration velocity at P9 in response to S-wave of different frequencies. It is evident from the figure that, except for an abnormal peak at 30 Hz, both the amplification coefficient and P9’s peak vibration velocity generally increase with higher frequencies. At a 100 Hz S-wave frequency, P9 registers a peak vibration velocity of 0.398 m/s, with an amplification coefficient as high as 4.69.
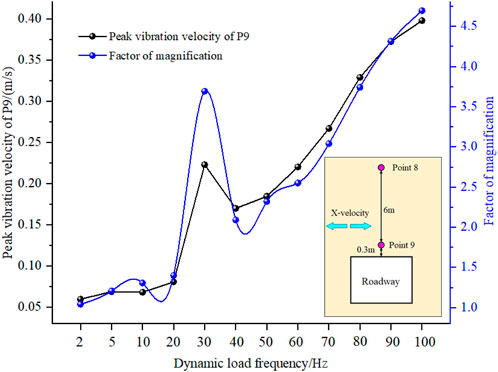
Figure 12. Effect of S-wave at different frequencies on roadway.
In the Mohr-Coulomb constitutive, the plastic zone represents material failure, providing insight into the extent of material damage. This section delves into the influence of dynamic loads on the roadway by examining the plastic zone under different dynamic loading conditions.
Figure 13 shows the plastic zone distribution around the source and the roadway after subjecting them to P-wave of different frequencies. The slices are taken along the middle of the model’s Y-axis. The figure demonstrates significant plastic failure at the source under dynamic loading, with an asymmetric distribution on either side of the dynamic source plane due to variations in rock material properties along the z-axis. The central source area experiences a combination of tensile and shear failures, while the surrounding regions predominantly undergo shear failure. Around the roadway, tensile failure is localized to a specific area on the roadway surface, with the primary failure mode being shear. Interestingly, as P-wave frequency increases, the extent of failure at the source region tends to decrease. Different P-wave frequencies lead to distinct patterns of failure at the source. For P-wave frequencies of 2, 5, and 10 Hz, the failure region at the source appears continuous. However, for frequencies above 10 Hz, the failure region near the source exhibits a more fragmented distribution. This reflects the complex mechanism of dynamic loading on coal and rock materials, with varying P-wave frequencies having notably different effects on the same material.
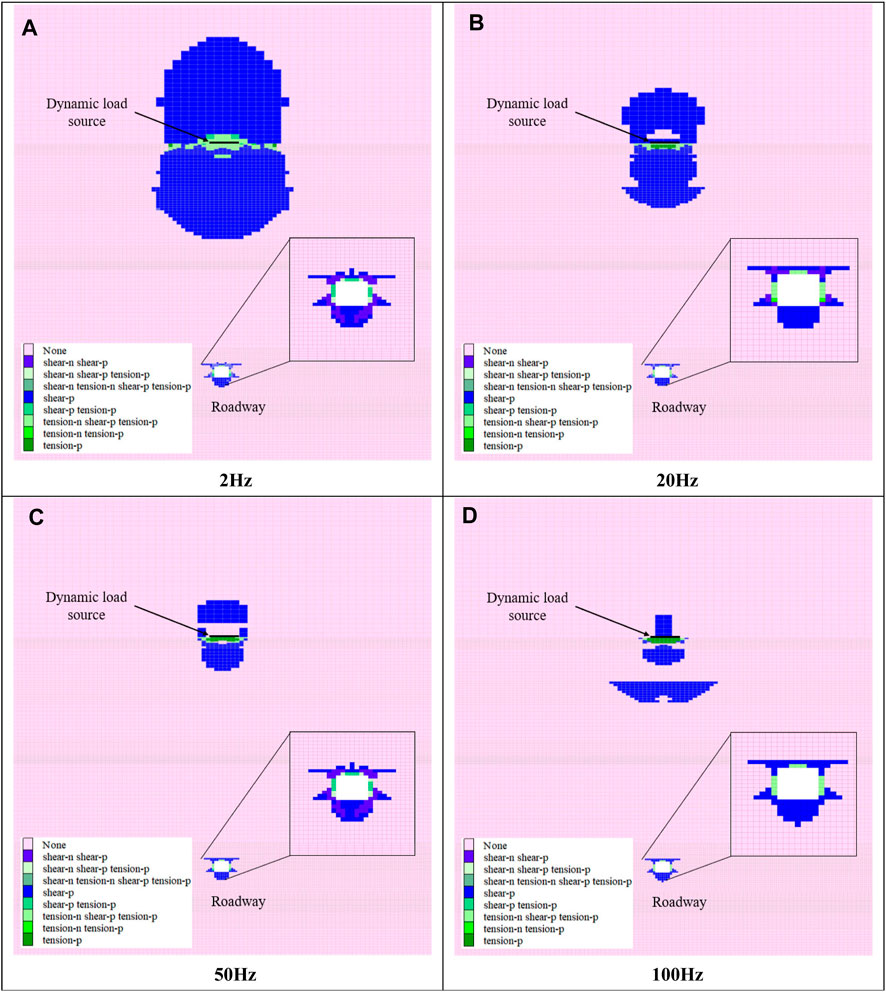
Figure 13. Plastic failure caused by P-wave: (A) Plastic zone caused by P-wave with 2 Hz, (B) Plastic zone caused by P-wave with 20 Hz, (C) Plastic zone caused by P-wave with 50 Hz, (D) Plastic zone caused by P-wave with 100 Hz.
To thoroughly examine the impact of P-wave dynamic loading at different frequencies on the plastic zones within coal and rock materials, we’ve created a custom Fish program to quantify the volume and characteristics of these plastic zones, illustrated in Figure 14. It is important to note that the Fish program may not precisely identify this complex pattern when a mixed failure pattern involving both tensile and shear failure occurs. Additionally, please be aware that the plastic zone near the roadway is calculated as the increase in plastic zone size following dynamic loading, as some plastic zones emerge within the roadway after excavation. As shown in the figure, the Vpb initially decreases rapidly and then stabilizes as the frequency of P-wave dynamic loading increases. On the other hand, the Vpc displays fluctuations, peaking at 100 Hz and reaching its minimum at 30 Hz. Notably, the Vpb significantly outweighs the Vpc, typically by a factor of 50–600. In the proximity of the roadway, Fish statistics consistently indicate shear failure. Specifically, at frequencies of 2, 5, 10, and 20 Hz, the Vpa remains relatively stable with minor fluctuations. However, when exposed to dynamic loading frequencies of 30 and 40 Hz, the Vpa rapidly increases and gradually rises with higher frequencies. The maximum Vpa occurs at 100 Hz. Interestingly, at a P-wave frequency of 60 Hz, the Vpa is smaller than it was before dynamic loading. This result may be attributed to the dynamic load causing a reduction in the difference between the maximum and minimum principal stresses around the roadway. As a consequence, the initial plastic zone may diminish or disappear.
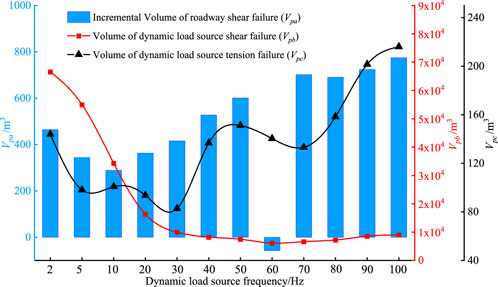
Figure 14. P-wave-induced plastic failure.
The plastic zone distribution in the vicinity of the source and around the roadway under the influence of S-wave at different frequencies was shown in Supplementary Figure S4. Shear failure remains the dominant mode of failure, with the volume of the plastic zone decreasing as the S-wave frequency increases. At 30 Hz, a shear failure band extending along the X-axis is observed, covering the entire model. Similar to the effect of P-wave, when the S-wave frequency exceeds 10 Hz, the plastic zone at the source becomes discontinuous, indicating a reduced damage effect of high-frequency S-wave on the source.
Similarly, we utilized the Fish program to compute the volume of the plastic zone induced by the influence of S-wave at various frequencies, as depicted in Figure 15. The data highlights a gradual decrease in Vsb as S-wave frequency increases, aligning with what we observed with P-wave in Figure 14. However, at 30 Hz, there’s an exception where the Vsb significantly increases, corresponding to the shear bands seen in Supplementary Figure S4. Importantly, the Fish program’s calculations suggest minimal, if any, tensile failure at the source, indicating that shear failure predominantly characterizes the influence of S-wave. The Vsa values in the figure reveal that the extent of roadway shear failure under dynamic loading initially decreases, then increases, and eventually shows slight fluctuations as the S-wave frequency rises. Interestingly, at 60 Hz, there’s a notable dip in Vsa compared to other frequencies. The analysis above demonstrates the intricate and multifaceted impact of dynamic loading on the plastic zone of roadways.
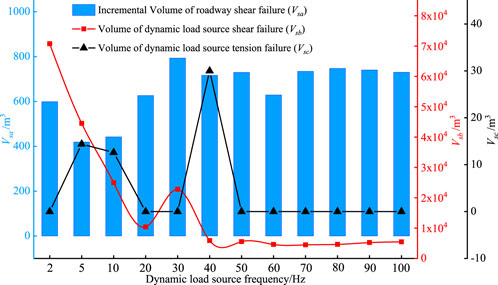
Figure 15. Plastic zone volume caused by S-wave.
Brittle shear ratio (BSR) is usually used to evaluate the rockburst potential in coal and rock mass, which is expressed as (Vennes and Mitri, 2017):
where
Based on the measured UCS of coal and rock (see Supplementary Table S1), combined with the
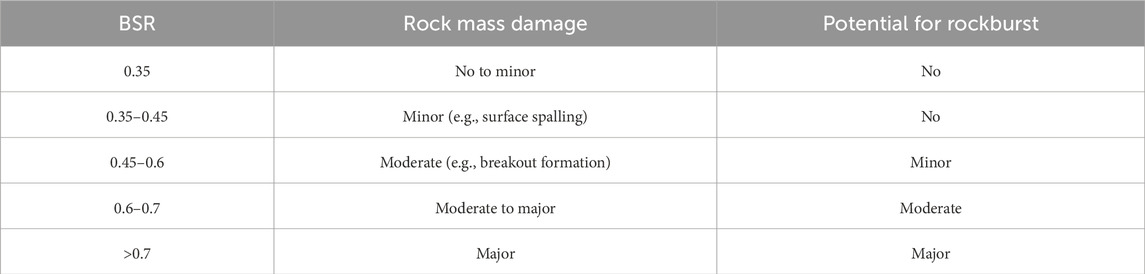
Table 1. Criteria of BSR for rock mass damage and potential of rockburst evaluation.
Figure 16 displays the BSR cloud after roadway excavation and exposure to P-wave at different frequencies. When examining the distribution of the plastic zone and the BSR cloud in Figure 16A, we observe that the peak areas of the BSR cloud correspond to the pattern of plastic zone distribution, notably in the four corners of the roadway. However, the BSR values for the top and bottom plates are consistently below 0.4, indicating a minimal rockburst potential. The lower rockburst potential in the floor is due to its high uniaxial compressive strength, while the top coal experiences reduced risk due to vertical unloading after excavation, leading to a significant decrease in maximum and minimum principal stress difference. The figure demonstrates that P-wave at varying frequencies have a limited impact on the BSR distribution, but different frequencies result in varying degrees of rockburst potential, as reflected in the maximum BSR values.
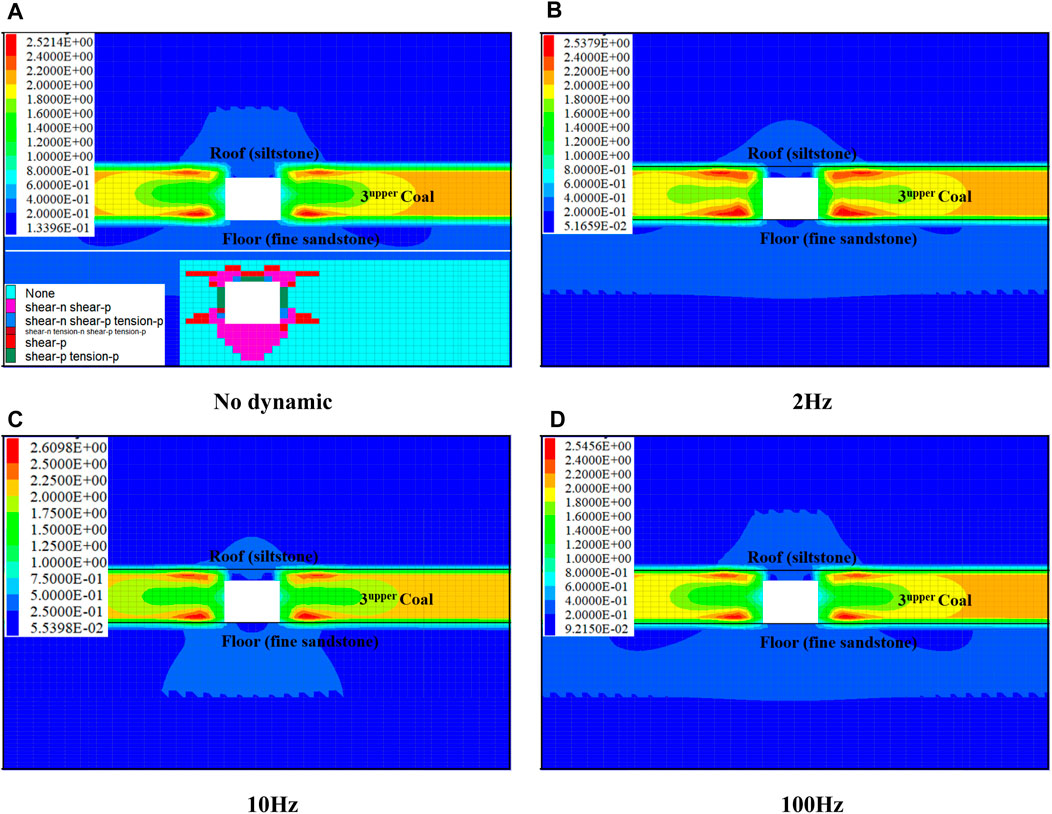
Figure 16. BSR cloud: Roadway excavation vs Different P-wave loadings: (A) Plastic zone distribution and BSR cloud of the roadway before dynamic load, (B) BSR cloud of the roadway after P-wave with frequency 2 Hz, (C) BSR cloud of the roadway after P-wave with frequency 10 Hz, (D) BSR cloud of the roadway after P-wave with frequency 100 Hz.
Figure 17 shows the BSR maxima at different P-wave frequencies. For P-wave frequencies of 5 Hz, 10 Hz, and 20 Hz, the BSR peaks are significantly higher compared to other frequencies. At a dynamic load frequency of 10Hz, the BSR peak reaches 2.61, reflecting a 0.09 increase from the roadway excavation condition. Based on the analysis above, it is clear that the rock burst potential resulting from P-wave in the frequency range of 5 Hz–20 Hz is significantly higher than that induced by P-wave of other frequencies.
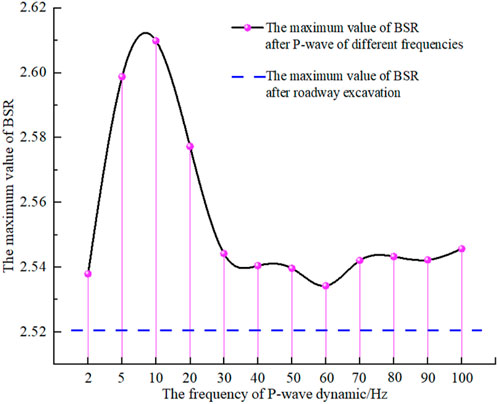
Figure 17. Maximum BSR with varying P-wave frequencies.
The BSR cloud is presented after the application of S-wave at different frequencies (see Supplementary Figure S5). The observation suggests that the distribution of BSR following S-wave action closely resembles that after P-wave action. However, a notable distinction lies in the fact that the peak value of BSR is significantly higher following S-wave action compared to P-wave action.
Figure 18 presents the maximum BSR values resulting from the application of S-wave at various frequencies. The chart reveals that BSR peaks are notably higher at S-wave frequencies of 2 Hz, 5 Hz, and 10 Hz compared to other frequencies. At 60 Hz, the peak BSR value reaches 2.67, representing a 0.15 increase from the pre-dynamic load condition. The figure also shows that as S-wave frequencies increase, the peak BSR value experiences an initial sharp decrease, followed by relatively stable minor fluctuations. This pronounced decline in peak values is observed at S-wave frequencies of 2 Hz, 5 Hz, and 10 Hz. Interestingly, the BSR peak reaches its highest value at 60 Hz, indicating a significant impact on roadway rockburst potential at this frequency.
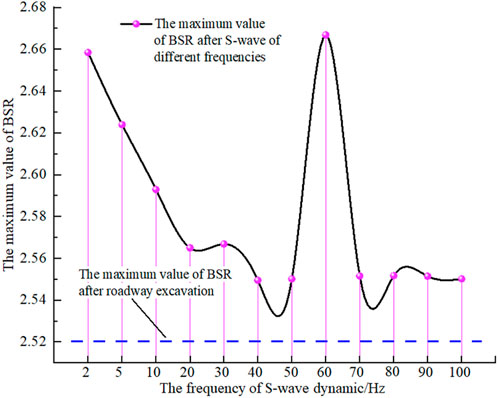
Figure 18. Maximum BSR with varying S-wave frequencies.
Figure 19 provides a comprehensive synthesis of previous section findings, allowing for a comparative analysis of P-wave and S-wave propagation characteristics. As shown in Figure 19A, the attenuation coefficient of P-wave initially decreases, with subsequent minor fluctuations, as the dynamic load frequency increases. The maximum attenuation coefficient values are observed at dynamic load frequencies of 2 Hz and 5 Hz. Conversely, S-wave attenuation coefficients show an initial increase followed by a decrease, stabilizing at higher frequencies, with peak values at 10 Hz and 20 Hz. Notably, S-wave attenuation coefficients are consistently lower than those of P-wave. This conclusion is consistent with that obtained by Torres using seismic observation data in the northern Gulf of California and Mexico (Bischoff et al., 2010).
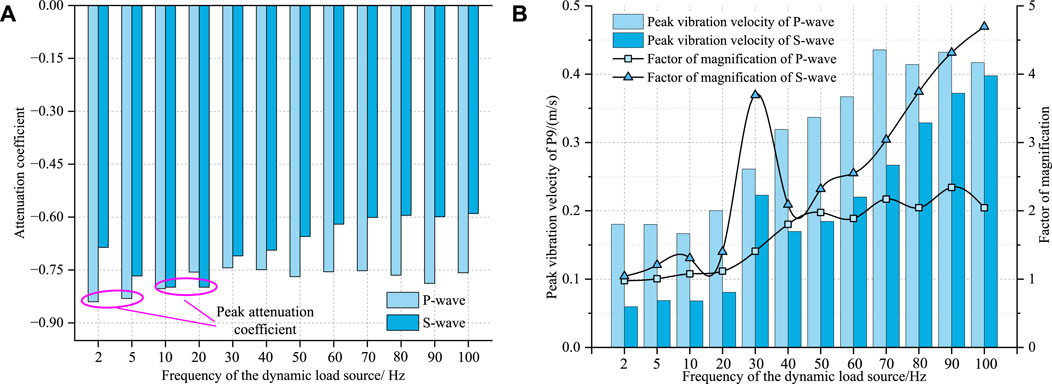
Figure 19. Propagation characteristics of P and S-wave at varying frequencies: (A) Attenuation coefficients of P and S-wave; (B) roadway peak vibration velocity and amplification coefficient from P and S-wave.
As shown in Figure 19B, with the increase of frequency the peak vibration velocity induced by P-wave experiences initial minor fluctuations, followed by a rapid increase, and ultimately stabilizes at a high level. Conversely, the pattern for peak vibration velocity caused by S-wave is simpler, showing a consistent increase with rising frequency. However, there is a distinctive spike in peak vibration velocity at 30 Hz. This may be due to the resonance of the roadway caused by the S-wave at 30 Hz, resulting in severe plastic failure of the roadway. This is consistent with the results of Liu et al., who discovered that the resonant frequency of the roadway in Zhuji Coal Mine is 35 Hz (Liu et al., 2019). The trend for the amplification coefficient, both for P-wave and S-wave, closely follows that of the peak vibration velocity. Notably, beyond a frequency of 50 Hz, the amplification coefficient for S-wave significantly surpasses that of P-wave, highlighting a growing disparity between them with increasing frequency. This is consistent with the law of the plastic zone volume in Figure 21 below, where the total plastic zone volume caused by the S-wave is higher than that of the P-wave.
The 30 Hz S-wave exhibits distinct characteristics that merit further analysis, as illustrated in Figure 19B. Figure 20A clearly shows that the 30 Hz S-wave induces a higher vibration velocity at the P9 compared to other frequencies. Additionally, we have delineated the apparent fluctuation segment of each velocity curve, indicated by the light yellow area in Figure 20A. This region is determined based on vibration velocities higher than 10% of the peak vibration velocity. Notably, the extent of the pale yellow region reveals that the duration of the S-wave gradually decreases as the frequency increases, consistent with the general principle that higher frequencies decay more rapidly. However, the 30 Hz frequency exhibits an anomaly, with a significantly shorter duration compared to 40 Hz and 50 Hz. To gain further insights, Fast Fourier Transform (FFT) was conducted to analysis of the waveform within the yellow region, yielding Figure 20B. The dominant frequency of the vibration velocity at the P9 generally increases with the input frequency of the S-wave, except 30 Hz. At 30 Hz, there are four distinct peak frequencies, indicating a highly complex waveform composition compared to other frequencies. This complexity can be attributed to the fact that, as shown in Figure 15, the 30 Hz S-wave led to a substantial expansion of the roadway’s plastic zone. In essence, when the 30 Hz S-wave propagates through the roadway, it induces the most severe plastic failure, resulting in a complex waveform composition.
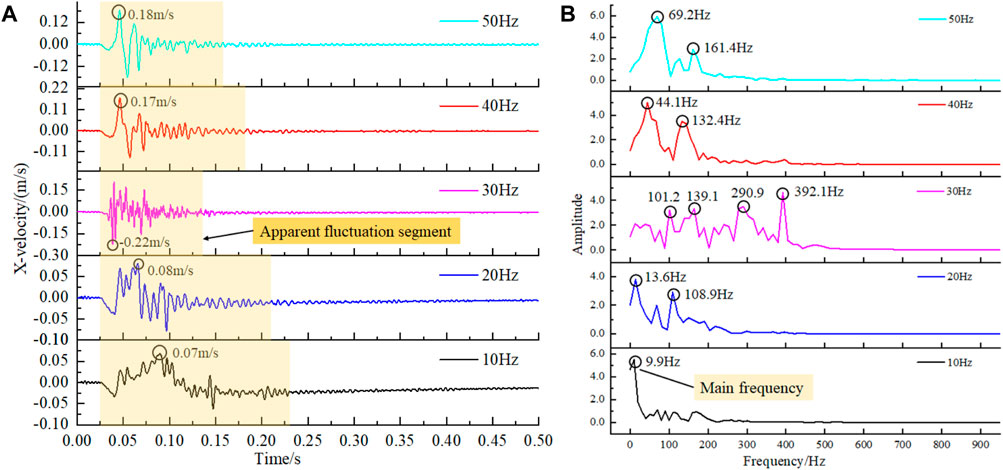
Figure 20. P9 vibration velocity fluctuation curves and FFT analysis for S-wave of different frequencies: (A) Velocity time history curve of P9 measuring point under the action of S-waves of different frequencies, (B) FFT results of the velocity time history curve of each measuring point.
Figure 14 reveals an anomaly in Vpa when the roadway is exposed to P-wave activity at 60 Hz. To uncover the underlying cause of this peculiarity, we conducted a comprehensive analysis, which included detailed statistics of the plastic zones on both sides of the roadway, as well as those on the roof and floor. As depicted in Figure 21, we applied the Fish to compute the plastic zone volumes on both sides of the roadway, as well as those on the roof and floor. In Figure 21A, both Vpm and Vpn are negative at 60 Hz, and Vpm is negative at 2, 5, and 10 Hz. These negative values suggest a reduction in the plastic zone size after dynamic loading, which is quite perplexing. This phenomenon can be attributed to the stress adjustment in the zone due to dynamic loading, so that the stress conditions that would have allowed the zone to undergo plastic failure no longer exist. In addition to these anomalies, Vpm gradually increases with the increase in P-wave load frequency, while the increase in Vpn is less pronounced. Figure 21B indicates that Vsm peaks after the impact of the 30 Hz S-wave. However, when the S-wave frequency is 60 Hz, Vsm is significantly lower than at other frequencies, and Vsn is also smaller compared to other frequencies. The increase in the plastic zone induced by P-wave activity is notably less compared to that caused by S-wave activity. This discrepancy arises from the alignment of the X-axis direction of the maximum principal stress in the numerical model with the primary action direction of S-wave. In other words, S-wave enhances the maximum principal stress, while P-wave enhances the minimum principal stress. Consequently, the impact of these two waveforms on the plastic zone is distinct.
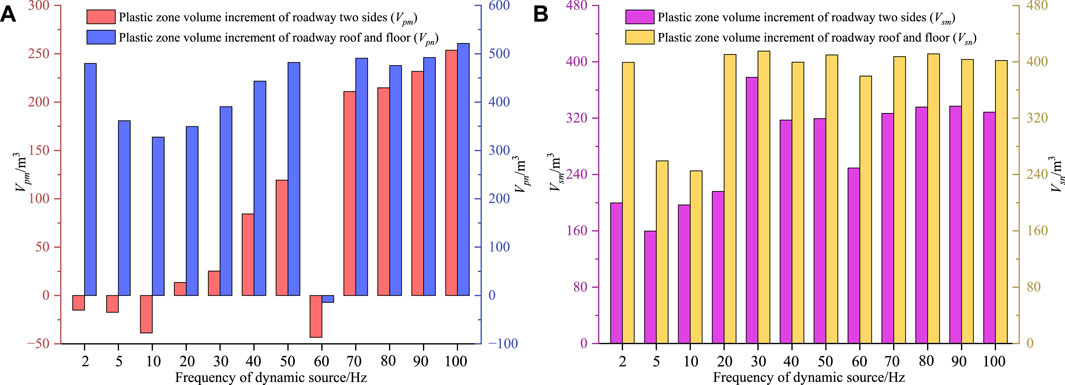
Figure 21. Plastic zone volume change due to dynamic loads: (A) Varying frequencies of P-wave; (B) varying frequencies of S-wave.
The abnormal plastic zone of the roadway induced by the 60 Hz P-wave prompted a spectrum analysis of the time-velocity curve at the P9 measurement point. This analysis is presented in Figure 22, following the same data selection principles as before. The analysis of Figure 22A reveals that the significant fluctuation time of the waveform lacks a clear pattern. The peak vibration speed at P9 tends to increase with the rising frequency, except at 70 Hz, where it decreases. In Figure 22B, the main frequency components of the waveforms at 60 Hz and 80 Hz display a distinct single peak, while those of other waveforms are more intricate, often featuring double or triple peaks. The complexity of the main frequency in the waveforms is attributed to the damage of the surrounding rock when the waveform reaches P9, leading to the generation of additional wave. Figure 14 shows that Vpa at 60 Hz and 80 Hz is notably lower compared to the surrounding frequencies, suggesting a potential correlation. It seems that when the plastic failure around the roadway becomes more severe, the detected waveform’s main frequency also becomes more intricate.
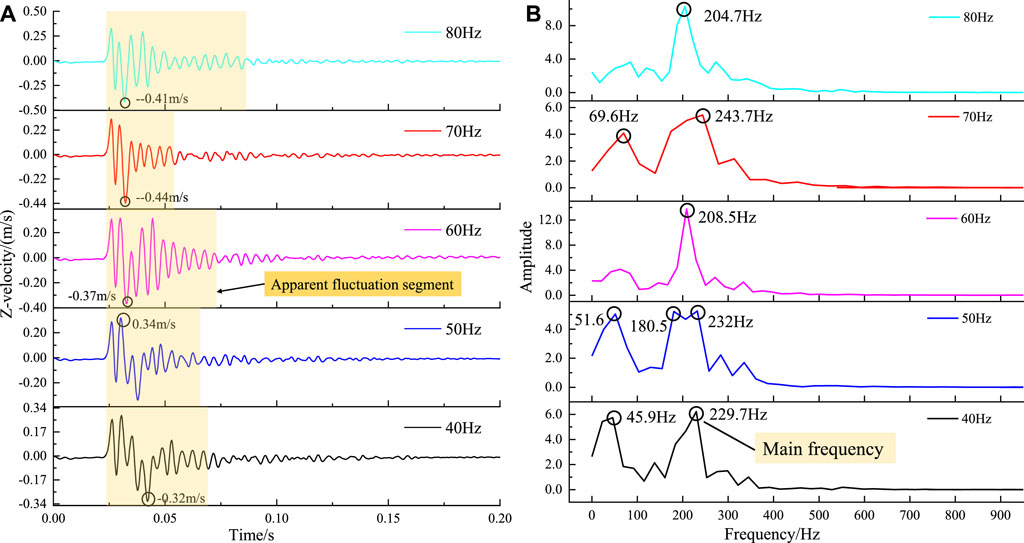
Figure 22. P9 vibration velocity responses to P-wave: (A) P9 velocity curves for different P-wave frequencies; (B) FFT analysis of velocity curves.
Figure 23 illustrates the maximum BSR of the roadway when subjected to S-wave and P-wave of varying frequencies. The figure demonstrates a noticeable increase in roadway rockburst potential due to dynamic loading, compared to the roadway excavation. Except for the frequencies of 10 Hz and 20Hz, the BSR induced by S-wave at other frequencies surpasses that caused by P-wave of the same frequency. This discrepancy is attributed to the primary loading direction of S-wave aligning with the maximum principal stress direction. The increase in rockburst potential associated with P-wave is relatively minor, except for frequencies of 5 Hz, 10 Hz, and 20 Hz. Interestingly, the BSR due to S-wave generally decreases with increasing frequency, except for an anomaly at 60 Hz where the BSR reaches its peak, significantly exceeding that at other adjacent frequencies. Drawing insights from Figure 21A, it becomes evident that the plastic zones induced in both the roof and floor reach their minimum extent when subjected to P-wave frequencies of 5 Hz, 10 Hz, and 20 Hz. This observation underscores a noteworthy discrepancy between the findings derived from the analysis of plastic zones and those from the BSR index. This incongruity can be attributed to that when the surrounding rock undergoes plastic deformation, its stress levels tend to decrease. Similarly, as indicated by Figure 21B, when the frequency of S-wave is 60 Hz, the increment in the plastic zones observed in the sidewalls and the top and bottom plates of the roadway is significantly less compared to the surrounding frequencies. This suggests that the 60 Hz S-wave dynamic load induces plastic deformation in a more confined region. It explains why this frequency yields the highest rockburst potential. This leads us to a plausible conclusion: the 60 Hz S-wave dynamic load elevates the maximum principal stress but does not quite reach the threshold for plastic failure in the material, resulting in a higher calculated BSR value.
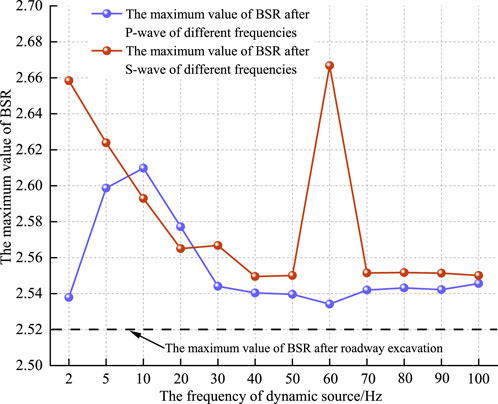
Figure 23. Rock burst Potential of Roadway under Varying P-wave and S-wave Frequencies.
Based on the engineering background of the Dongtan Coal mine, this study compared wave characteristics between near-field and far-field strong mine tremors. Additionally, investigates the propagation and attenuation characteristics of P-wave and S-wave at various frequencies, assessing their impact on the plastic failure and the rock burst risk of roadways. The main conclusions are as follows:
(1) Wave analysis reveals that compared with near-field strong mine tremors, far-field tremors are dominated by low-frequency components below 5 Hz, which may caused by the rapid attenuation of high-frequency components along with propagation.
(2) As the frequency increases, the P-wave amplification coefficient initially stabilizes but then sharply rises, with fluctuations at higher frequencies. S-wave generally amplifies with frequency, except for an unusual spike at 30 Hz, related to the serious plastic failure of the roadway caused by dynamic load resonating with the roadway.
(3) After P-wave and S-wave loading, shear failure is dominant at the tremor source. The proportion of source shear failure after S-wave loading is higher than that after P-wave, and the roadway plastic zone caused by S-wave loading is larger than that caused by P-wave.
(4) The rock burst potential increases significantly after P-wave and S-wave loading, and the rock burst potential after the S-wave loading is higher than that of P-wave.
In recent years, the frequency of far-field strong mine earthquakes has been on the rise, making the study of their impact on roadways a crucial research area. Due to the challenges in conducting accurate field or theoretical research on this issue, numerical simulation methods have become indispensable. The conclusions drawn in this study are based on the modeling of the actual engineering background conditions of Dongtan Coal Mine. It can be predicted that the simulated dynamic load propagation law and its influence on the roadway may be quite different under different conditions due to the differences in the strata structure, the properties of coal and rock mass, and the actual stress state of the roadway. Therefore, it is an effective and reliable means to establish an accurate numerical model for specific engineering research. At present, sensors for vibration velocity monitoring in engineering are arranged in the form of points, so a small amount of data collected by sensors makes it difficult to range the real situation of the site. If large-scale vibration velocity monitoring can be realized in the future, field data-based research will flourish.
The original contributions presented in the study are included in the article/Supplementary Material, further inquiries can be directed to the corresponding author.
ZH: Conceptualization, Investigation, Methodology, Writing–original draft. LD: Funding acquisition, Methodology, Writing–review and editing. SG: Funding acquisition, Writing–review and editing. JC: Formal Analysis, Writing–original draft. SC: Methodology, Writing–original draft. BH: Resources, Validation, Writing–review and editing. YL: Resources, Writing–review and editing. KZ: Resources, Writing–review and editing.
The author(s) declare that financial support was received for the research, authorship, and/or publication of this article. This research was funded by the National Natural Science Foundation of China, grant number 51934007 and 52227901. This research was funded by the National Key R&D Program of China, grant number 2022YFC3004603. This research was funded by the Natural Science Foundation of Jiangsu Province Basic Research Program, grant number BK20231499.
Authors BH and YL were employed by Huaneng Coal Technology Research Co., Ltd.
The remaining authors declare that the research was conducted in the absence of any commercial or financial relationships that could be construed as a potential conflict of interest.
All claims expressed in this article are solely those of the authors and do not necessarily represent those of their affiliated organizations, or those of the publisher, the editors and the reviewers. Any product that may be evaluated in this article, or claim that may be made by its manufacturer, is not guaranteed or endorsed by the publisher.
The Supplementary Material for this article can be found online at: https://www.frontiersin.org/articles/10.3389/feart.2024.1348653/full#supplementary-material
Bischoff, M., Cete, A., Fritschen, R., and Meier, T. (2010). Coal mining induced seismicity in the Ruhr area, Germany. Pure Appl. Geophys. 167, 63–75. doi:10.1007/s00024-009-0001-8
Cao, A., Dou, L., Cai, W., Gong, S., Liu, S., and Jing, G. (2015). Case study of seismic hazard assessment in underground coal mining using passive tomography. Int. J. Rock Mech. Min. Sci. 78, 1–9. doi:10.1016/j.ijrmms.2015.05.001
Cao, J., Dou, L., He, J., Xie, J., Han, Z., and Wang, S. (2023). Mechanism of the coal bursts in the working face during mining of steeply inclined and extra thick coal seam. Geomatics, Nat. Hazards Risk 14, 2206511. doi:10.1080/19475705.2023.2206511
Castro, L., Bewick, R., and Carter, T. (2012). An overview of numerical modelling applied to deep mining. Innovative Numer. Model. geomechanics, 393–414.
Cesca, S., and Grigoli, F. (2015). Full waveform seismological advances for microseismic monitoring. Adv. Geophys. 56, 169–228. doi:10.1016/bs.agph.2014.12.002
Dragomiretskiy, K., and Zosso, D. (2013). Variational mode decomposition. IEEE Trans. signal Process. 62, 531–544. doi:10.1109/tsp.2013.2288675
Guo, Y., Lu, C., He, Z., and Song, J. (2022). Numerical and field investigations of tremors induced by thick-hard strata fracture. Appl. Sci. 12, 11151. doi:10.3390/app122111151
He, J., Dou, L., Gong, S., Li, J., and Ma, Z. (2017). Rock burst assessment and prediction by dynamic and static stress analysis based on micro-seismic monitoring. Int. J. Rock Mech. Min. Sci. 93, 46–53. doi:10.1016/j.ijrmms.2017.01.005
He, S., Chen, T., Vennes, I., He, X., Song, D., Chen, J., et al. (2020). Dynamic modelling of seismic wave propagation due to a remote seismic source: a case study. Rock Mech. Rock Eng. 53, 5177–5201. doi:10.1007/s00603-020-02217-w
He, Z.-L., Lu, C.-P., Zhang, X.-F., Guo, Y., Meng, Z.-H., and Xia, L. (2022). Numerical and field investigations of rockburst mechanisms triggered by thick-hard roof fracturing. Rock Mech. Rock Eng. 55, 6863–6886. doi:10.1007/s00603-022-03002-7
Islam, M. R., and Shinjo, R. (2009). Mining-induced fault reactivation associated with the main conveyor belt roadway and safety of the Barapukuria Coal Mine in Bangladesh: constraints from BEM simulations. Int. J. Coal Geol. 79, 115–130. doi:10.1016/j.coal.2009.06.007
Itasca Consulting Group (2023). FLAC 3D version 9, user’s guide. Availabe online: https://docs.itascacg.com/itasca900/common/docproject/source/manual/program_guide/models/theory/plasticmodel.html?node1206 (accessed on June 30, 2023).
Jiang, L., Wu, Q., Wu, Q., Wang, P., Xue, Y., Kong, P., et al. (2019). Fracture failure analysis of hard and thick key layer and its dynamic response characteristics. Eng. Fail. Anal. 98, 118–130. doi:10.1016/j.engfailanal.2019.01.008
Jiao, Y. Y., Wu, K. B., Zou, J. P., Zheng, F., Zhang, X. F., Wang, C., et al. (2021). On the strong earthquakes induced by deep coal mining under thick strata-a case study. Geomech. Geophys Geo 7, 97–11. ARTN 9710. doi:10.1007/s40948-021-00301-1
Kong, P., Jiang, L., Jiang, J., Wu, Y., Chen, L., and Ning, J. (2019). Numerical analysis of roadway rock-burst hazard under superposed dynamic and static loads. Energies 12, 3761. doi:10.3390/en12193761
Krylov, V. (2014). Acoustic black holes: recent developments in the theory and applications. IEEE Trans. Ultrason. Ferroelectr. Freq. Control 61, 1296–1306. doi:10.1109/TUFFC.2014.3036
Liang, Y., Cheng, Y., Han, Z., Yan, C., Zhang, X., Wang, C., et al. (2022). Study on movement law of high-position thick and hard roof and mine earthquake control by ground fracturing technology. Geofluids, 2022. doi:10.1155/2022/5872889
Liu, G., Karakus, M., and Mu, Z. (2019). Propagation and attenuation characteristics of rockburst-induced shock waves in coal-rock medium. Arabian J. Geosciences 12, 113–114. doi:10.1007/s12517-019-4277-4
Liu, W., Cao, S., and Chen, Y. (2016). Applications of variational mode decomposition in seismic time-frequency analysis. Geophysics 81, V365–V378. doi:10.1190/geo2015-0489.1
Liu, W., Liu, Y., Li, S., and Chen, Y. (2023). A review of variational mode decomposition in seismic data analysis. Surv. Geophys. 44, 323–355. doi:10.1007/s10712-022-09742-z
Małkowski, P., and Niedbalski, Z. (2020). A comprehensive geomechanical method for the assessment of rockburst hazards in underground mining. Int. J. Min. Sci. Technol. 30, 345–355. doi:10.1016/j.ijmst.2020.04.009
Mendecki, M. J., Wojtecki, Ł., and Zuberek, W. M. (2019). Case studies of seismic energy release ahead of underground coal mining before strong tremors. Pure Appl. Geophys. 176, 3487–3508. doi:10.1007/s00024-019-02144-0
Mohammad, N., Reddish, D., and Stace, L. (1997). The relation between in situ and laboratory rock properties used in numerical modelling. Int. J. Rock Mech. Min. Sci. 34, 289–297. doi:10.1016/s0148-9062(96)00060-5
Mukhamedyarova, Z., Suzuki Morales, K., Suorineni, F., and Madenova, Y. (2023). “Numerical modeling of seismic wave propagation in mimicked underground mine models,” in Proceedings of ARMA US Rock Mechanics/Geomechanics Symposium, Atlanta, Georgia, 25-28 June, 2023.
Qiao, W., Li, W., and Zhang, X. (2014). Characteristic of water chemistry and hydrodynamics of deep karst and its influence on deep coal mining: a case study in Dongtan Coal Mine, Shandong, China. Arabian J. Geosciences 7, 1261–1275. doi:10.1007/s12517-013-0899-0
Sen, A. T., Cesca, S., Bischoff, M., Meier, T., and Dahm, T. (2013). Automated full moment tensor inversion of coal mining-induced seismicity. Geophys. J. Int. 195, 1267–1281. doi:10.1093/gji/ggt300
Vennes, I., and Mitri, H. (2017). Geomechanical effects of stress shadow created by large-scale destress blasting. J. Rock Mech. Geotechnical Eng. 9, 1085–1093. doi:10.1016/j.jrmge.2017.09.004
Wang, C., Wang, M., Gong, S. Y., Zou, J. P., and Wu, K. B. (2022a). Study on evolution law and the mechanical mechanism of strong mine tremors in a deep coal mine. Adv. Civ. Eng. 2022, 1–10. doi:10.1155/2022/1066833
Wang, S. (2023). Longwall mining-induced fracture characterisation based on seismic monitoring. Australia: UNSW Sydney.
Wang, S., Cao, A., Wang, Z., Cao, J., Liu, Y., Xue, C., et al. (2022b). Study on mechanism of rock burst in horizontal section mining of a steeply inclined extra-thick coal seam. Lithosphere 2022, 7058797. doi:10.2113/2022/7058797
Wu, K., Zou, J., Jiao, Y.-Y., He, S., and Wang, G. (2023b). Insight and effectiveness of working-face deep-hole blasting for prevention of strong seismicity induced by deep coal mining. Rock Mech. Rock Eng. 56, 8693–8709. doi:10.1007/s00603-023-03516-8
Wu, K., Zou, J., Jiao, Y.-Y., Zhang, X., and Wang, C. (2023a). Focal mechanism of strong ground seismicity induced by deep coal mining. Rock Mech. Rock Eng. 56, 779–795. doi:10.1007/s00603-022-03079-0
Yang, Y., Cao, A., Liu, Y., Bai, X., Yan, Z., Wang, S., et al. (2023). Understanding the mechanism of strong mining tremors near the goaf area of longwall mining: a case study. Appl. Sci. 13, 5364. doi:10.3390/app13095364
Zhang, W., Li, C., Huo, T., Qu, X., and Xin, C. (2021). Vibration events in underground heading face and useful index for rock burst monitoring. Measurement 180, 109501. doi:10.1016/j.measurement.2021.109501
Zhou, J., Lu, W., Yan, P., Chen, M., and Wang, G. (2016). Frequency-dependent attenuation of blasting vibration waves. Rock Mech. Rock Eng. 49, 4061–4072. doi:10.1007/s00603-016-1046-5
Zhu, G., Jiang, Q., Wu, Y., Dou, L., Lin, Z., and Liu, H. (2021). Numerical inversion of dynamic behavior of fault slip instability induced by stress waves. J. Min. Safe Eng. 38, 370–379. doi:10.13545/j.cnki.jmse.2020.0059
Keywords: far-field strong mine tremors, waveform decomposition, dynamic analysis, rock burst potential, plastic failure
Citation: Han Z, Dou L, Gong S, Cao J, Chen S, Hu B, Li Y and Zeng K (2024) Propagation and impacts on roadway of mining-induced far-field strong tremors: insights from numerical simulations. Front. Earth Sci. 12:1348653. doi: 10.3389/feart.2024.1348653
Received: 03 December 2023; Accepted: 04 March 2024;
Published: 25 March 2024.
Edited by:
Bin Gong, Brunel University London, United KingdomReviewed by:
Guangan Zhu, Xi’an University of Science and Technology, ChinaCopyright © 2024 Han, Dou, Gong, Cao, Chen, Hu, Li and Zeng. This is an open-access article distributed under the terms of the Creative Commons Attribution License (CC BY). The use, distribution or reproduction in other forums is permitted, provided the original author(s) and the copyright owner(s) are credited and that the original publication in this journal is cited, in accordance with accepted academic practice. No use, distribution or reproduction is permitted which does not comply with these terms.
*Correspondence: Linming Dou, bG1kb3VAMTI2LmNvbQ==
Disclaimer: All claims expressed in this article are solely those of the authors and do not necessarily represent those of their affiliated organizations, or those of the publisher, the editors and the reviewers. Any product that may be evaluated in this article or claim that may be made by its manufacturer is not guaranteed or endorsed by the publisher.
Research integrity at Frontiers
Learn more about the work of our research integrity team to safeguard the quality of each article we publish.