 Bing Zhao1
 Yang-Bing Shao
94% of researchers rate our articles as excellent or good
Learn more about the work of our research integrity team to safeguard the quality of each article we publish.
Find out more
ORIGINAL RESEARCH article
Front. Earth Sci., 08 April 2024
Sec. Geohazards and Georisks
Volume 12 - 2024 | https://doi.org/10.3389/feart.2024.1346536
The status of surrounding rocks dramatically influences the safety of construction workers, so the quality assessment of surrounding rocks has great significance. The uniaxial saturated compressive strength of rock (X1), the quality index of surrounding rock (X2), the frictional coefficient of the structural surface (X3), the joint spacing (X4), the state of groundwater(X5), and the integrity coefficient (X6) are selected as the initial evaluation index. Then, the game theory combination weighting-normal cloud model is introduced. Second, the certainty degree matrix of each index is established, and the weight coefficients of assessment indexes are determined based on the game theory combination weighting method. Finally, the quality level of surrounding rocks is judged. Compared with the traditional methods, the proposed model solves the fuzziness and randomness of different indexes, improves the reliability of the assessment process, and enhances the predictive accuracy of assessment results. In addition, it can provide a solution scheme for the evaluation indicators, which are difficult to quantify, and reduce the influence of human factors. The results obtained from the suggested model are consistent with the current specification. Its accuracy approaches 100%, and the method is feasible for the quality level assessment of surrounding rocks, providing a new technique and approach to assessing the risk level of surrounding rocks.
With the development of the economy in China, more extensive infrastructure is being constructed more quickly (Chen et al., 2022). Many large-scale underground projects are used in water conservancy, hydropower, transportation, mining, and other projects (Zhou et al., 2012). At the same time, the stability of underground engineering due to the excavation of a large amount of rock and soil has become a critical problem faced by engineers (Chen and Zhou, 2019). An underground tunnel is often in a complex geological environment. Where the geological conditions and stability of surrounding rock vary, the evaluation of surrounding rock quality is essential to understanding the engineering characteristics (Zhou et al., 2015a). An accurate assessment of the surrounding rock is significant in ensuring a reasonable survey design and smooth construction on site.
Researchers and scholars have performed many investigations on methods of assessing surrounding rocks in recent years (Gu et al., 2021). TAN et al. (2022) established the fuzzy assessment model based on the hierarchy analytic method to predict four indexes of rock mass in each section of the tunnel. WANG and CAO (2013) used a matter-element extension evaluation model and concluded that uniaxial compressive strength and groundwater seepage volume have the most significant effect on the stability of surrounding rocks by WANG and CAO (2013) using the matter-element extension evaluation model. WEI et al. (2016) introduced a cloud model that transforms qualitative concepts and quantitative data to determine the quality method of the rock mass. Qiu (2008) established a quality assessment model of surrounding rocks in the tunnel by using the result of reduction as the input samples of an artificial neural network. In addition, QIN et al. (2016) classified the various factors that affected the stability of the surrounding rock of a deep mine roadway and established the three types of hazard impact factor model using the fuzzy comprehensive evaluation method in combination with the three types of hazard classification method. The ideal point method is applied to calculate the proximity of the surrounding rock by HUANG et al. (2014), and the weight of the corresponding index in the evaluation system is determined using the entropy weight theory.
The above methods have prompted the substantial development of the assessment theory of surrounding rock quality. However, it still has some shortcomings (Gu and Wu, 2016). For example, the evaluation of surrounding rock quality is a nonlinear and complex problem (Gu et al., 2022a). In addition, the fuzziness and randomness of surrounding rock quality evaluation are neglected, and the relative importance of the evaluation index and the calculation of weight distribution must be optimized (Gu et al., 2022b).
The game theory combination weighting-normal cloud model is introduced to overcome the shortcomings of the above methods and to assess the quality level of the surrounding rock in the Pingzitou Tunnel. First, the game theory combination weighting method is introduced to determine the weights of the assessment index. Relative to traditional subjective or objective weighting methods, combination weighting theory not only considers the subjective factors of expert assessments but also involves some objective assessments. This has improved the accuracy of assessment prediction. When the game theory is combined with the combination weighting theory, the contradiction between subjective and objective weights can be dealt with effectively, the advantages of subjective and objective weights are integrated, the agreement and compromise in the conflict of both are searched, and the difference between subjective and objective weights is reduced. Finally, the deviation between the basic weight and the ideal weight is minimized. Therefore, the uncertainty of the evaluation results is lowered (Chen and Zhou, 2024). Third, a new assessment model is formed when the normal cloud model is introduced. It has many virtues, such as the preciseness of algorithms and operability in practice. Compared to traditional cloud theory (Alison et al., 2022), the suggested method needs no significant amount of data, and its operation is easy. In addition, it can provide a solution scheme for the evaluation indicators, which are difficult to quantify, and reduces the influence of human factors (Li and Wu, 2023; Zhou et al., 2015b). The method dramatically improves the traditional cloud model (Zhou et al., 2016).
The paper is organized as follows: in Section 2, the engineering overview is introduced. In Section 3, theory and methodology based on the game theory combination weighting-normal cloud model are presented. In Section 4, the assessment model of the surrounding rock quality is established, and the assessment results of the proposed model are compared. Conclusions are drawn in Section 5.
The Pingzitou Tunnel is located in the Daping village, Pingzi town, Guizhou province, and plotted in Figure 1. The railway tunnel goes under the tunnel’s entrance; the export end is parallel to the railway. In all, the pile number of the left tunnel entrance is Zk2 + 880, the pile number of the tunnel exit is Zk4 + 972; the elevation of the tunnel bottom is 1,473.36–1,686.11 m, the total length is 2092 m, the vertical slope gradient is −2.8%, the plane is located on the curve and straight line section of R = 735 m, and the maximum superelevation of the tunnel pavement is 4%. The karst in the entrance section of the tunnel is well-developed, and the karst is strong along the karst fissure. Most of the surface forms are karst gullies and sinkholes, which are mostly developed vertically. The covering layer in the tunnel section is mainly gravel soil, and lightly weathered dolomite limestone is located at the lower part. The surface strata at the exploration area are mainly Quaternary Holocene (Qh) strata, mostly composed of macadam soil with small thicknesses and uneven distribution. The underlying bedrock is a Carboniferous dolomite limestone formation. The surface water system in the tunnel area has not been developed. There are three kinds of groundwater in the site: bedrock fissure water, karst groundwater, and structure fissure water. A specific picture of the tunnel is shown in Figure 2.
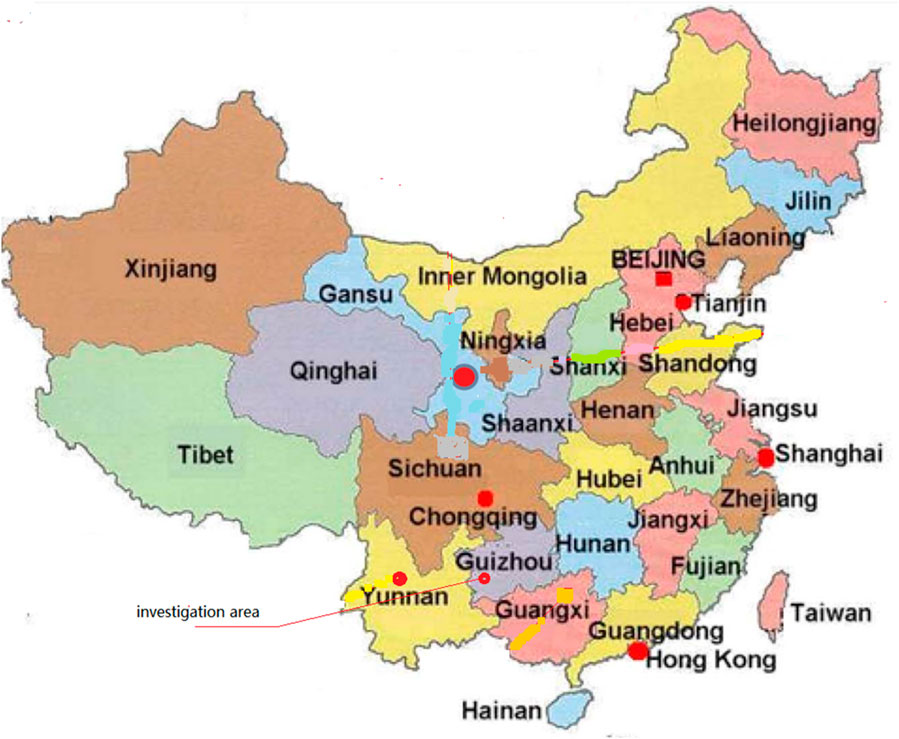
Figure 1. Geographical location of the survey area.
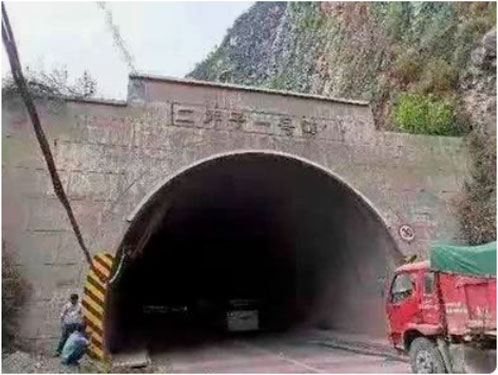
Figure 2. Picture of the tunnel.
The common weight calculation methods are divided into subjective, objective, and combination weights. Combination weighting is a common method; two or three kinds of subjective and objective weights are combined to obtain the comprehensive weight, which can reduce the error caused by a single method to a certain extent (Ding et al., 2022a; Ding et al., 2022b; Ding et al., 2023). Based on the discussion in the introduction, the entropy weight and criteria importance through inter-criteria correlation (CRITIC) methods are applied to represent the subjective and objective factors, and the combination weights are obtained using game theory (Zhou and Yang, 2007).
(1) The entropy method
The entropy weight method is an objective weighting method to determine the weight coefficient according to the degree of information utility value of each evaluation index. The entropy weight method can reflect the degree of discreteness among the index data (Zhao et al., 2021).
Its calculative process is listed as follows:
① Constructing the original matrix of assessment index
Assuming that there are
② Normalization and forward processing
To eliminate the impact of the different types of indicators and dimensional differences, dimensionless processing needs to be performed for each index; the indexes are expressed as follows:
The positive indicator is expressed as follows:
The negative indicator is expressed as follows:
where
③ Calculation of the information entropy of the
④ Calculation of weights
where
(2) The CRITIC method
Criteria importance through inter-criteria correlation (CRITIC) is an objective weighting method proposed by Diakoulaki that synthetically measures the index weight by calculating the variability and conflict of the index. Its calculative procedure follows (Zhou et al., 2014):
① Assuming that there are
② Matrix
where
③ Calculate the coefficient of variation of different indexes as follows:
where
④ The coefficients of correlation are calculated based on the standardization matrix
where
⑤ Calculate the quantitative coefficient about the degree of independence for different assessment indexes.
Its expression is shown as follows:
⑥ The quantitative coefficients of the comprehensive information and the degree of independence of each index are solved as follows:
⑦ The determination of the weight of each evaluation index can be expressed as follows:
(3) The combination weighting method of the game theory
Based on game theory, the combination weight
① The weight sets
② According to game theory, the linear combination coefficients
③ According to the differential properties of the matrix, the linear differential equation group for optimizing the first derivative condition of Eq. (15) is determined as follows:
④ The optimal combination coefficients
The normal cloud model is applied to determine the membership degree of different indicators. It is defined as follows:
where the distribution definitive degree
where
The quality assessment process of surrounding rocks is very complex, and many influencing factors affect the final evaluation results. The evaluation index of a model is often selected based on the actual case in the engineering site. Otherwise, a more significant deviation will occur (WANG et al., 2010). According to the actual investigation data, six assessment factors are considered the quality assessment index of surrounding rocks. These indexes are the uniaxial saturated compressive strength of rock
According to the relevant specifications, the six evaluation indexes can be classified into five levels in Table 1: risk level I (extremely stable), risk level II (stable), risk level III (common), risk level IV (unstable), and risk level V (extremely unstable). The monitoring values of six assessment indexes of the surrounding rocks determined via site inspections and indoor experiments are shown in Table 2.
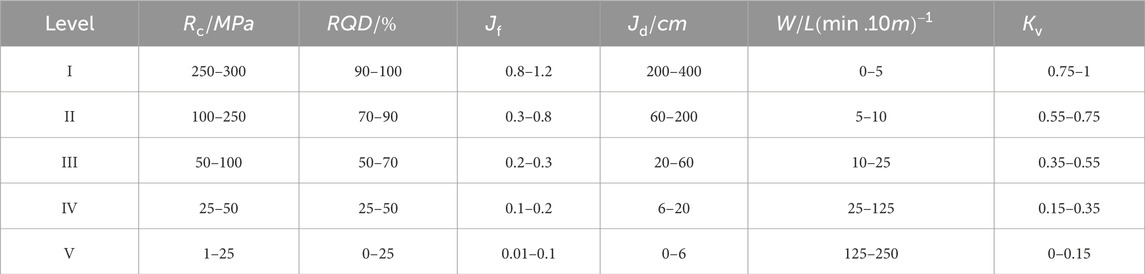
Table 1. Risk level classification of the surrounding rocks.
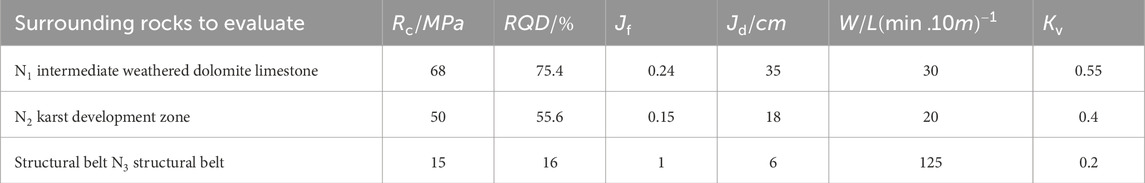
Table 2. Monitoring value.
The quality of surrounding rocks dramatically influences the safety of construction workers. So, assessing the risk level of surrounding rocks has great significance.
A new evaluation method of surrounding rocks based on the game theory combination weighting-normal cloud model is provided in this article. The process is outlined in Figure 3. First, to evaluate the risk level of surrounding rocks, a complete assessment index system is established. Second, the weight of each assessment index is determined according to the game theory combination weighting theory. Third, certain degrees are determined using the normal cloud theory. Then, the magnitudes of synthetic certainty degree
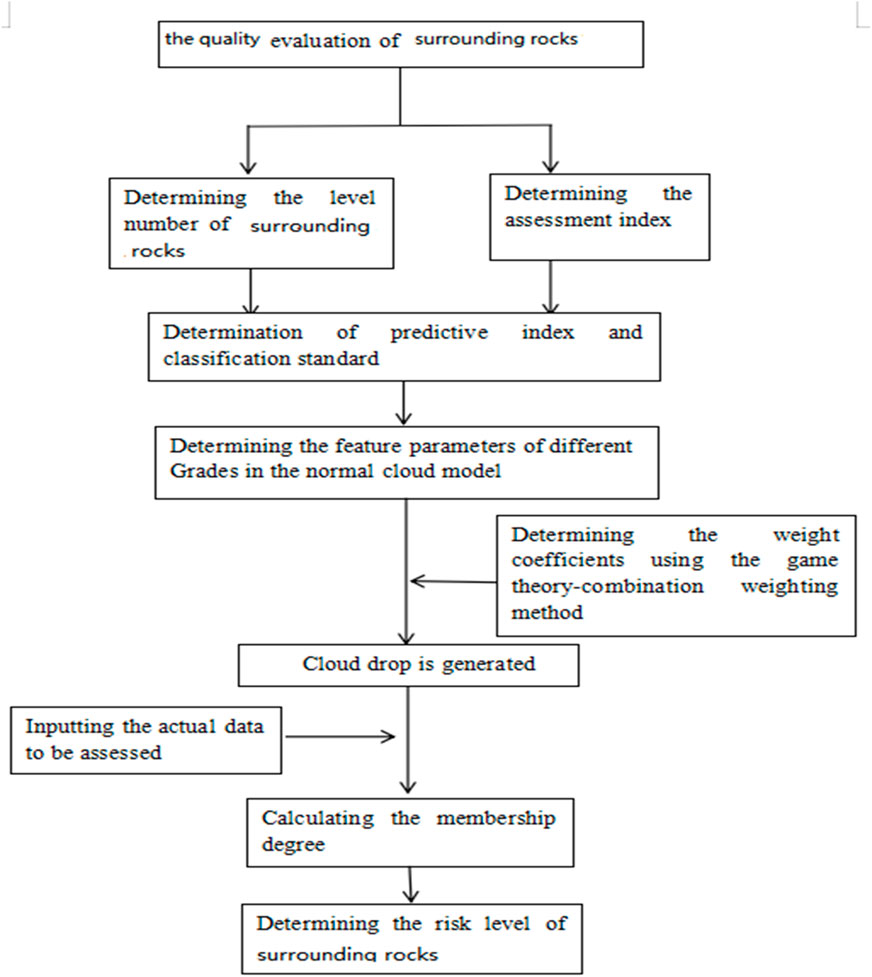
Figure 3. Process of evaluating the risk level of the surrounding rocks.
(1) Calculation of the weight coefficient
According to Eqs 1–7, and in combination with Table 1, the corresponding weight coefficient can be calculated as follows:
(2) Calculation of the weight coefficient
Based on Eqs 8–10, and in combination with Table 1, the correlation coefficients can be obtained as follows:
According to Eq. 11, the standard deviation of different columns is obtained as follows:
Similarly, according to Eqs 12, 13, the weight of each evaluation index can be calculated as follows:
(3) The calculation of the combination weight
Based on Eqs 14–17, and in combination with weight sets
Based on Table 2, and in combination with Eqs 19–22, the classification standard of normal cloud is depicted in Table 3.

Table 3. Digital features of the cloud model.
According to Table 3, the characters of the cloud model corresponding to different indexes are calculated using the forward cloud generator, which is plotted in Figure 4.
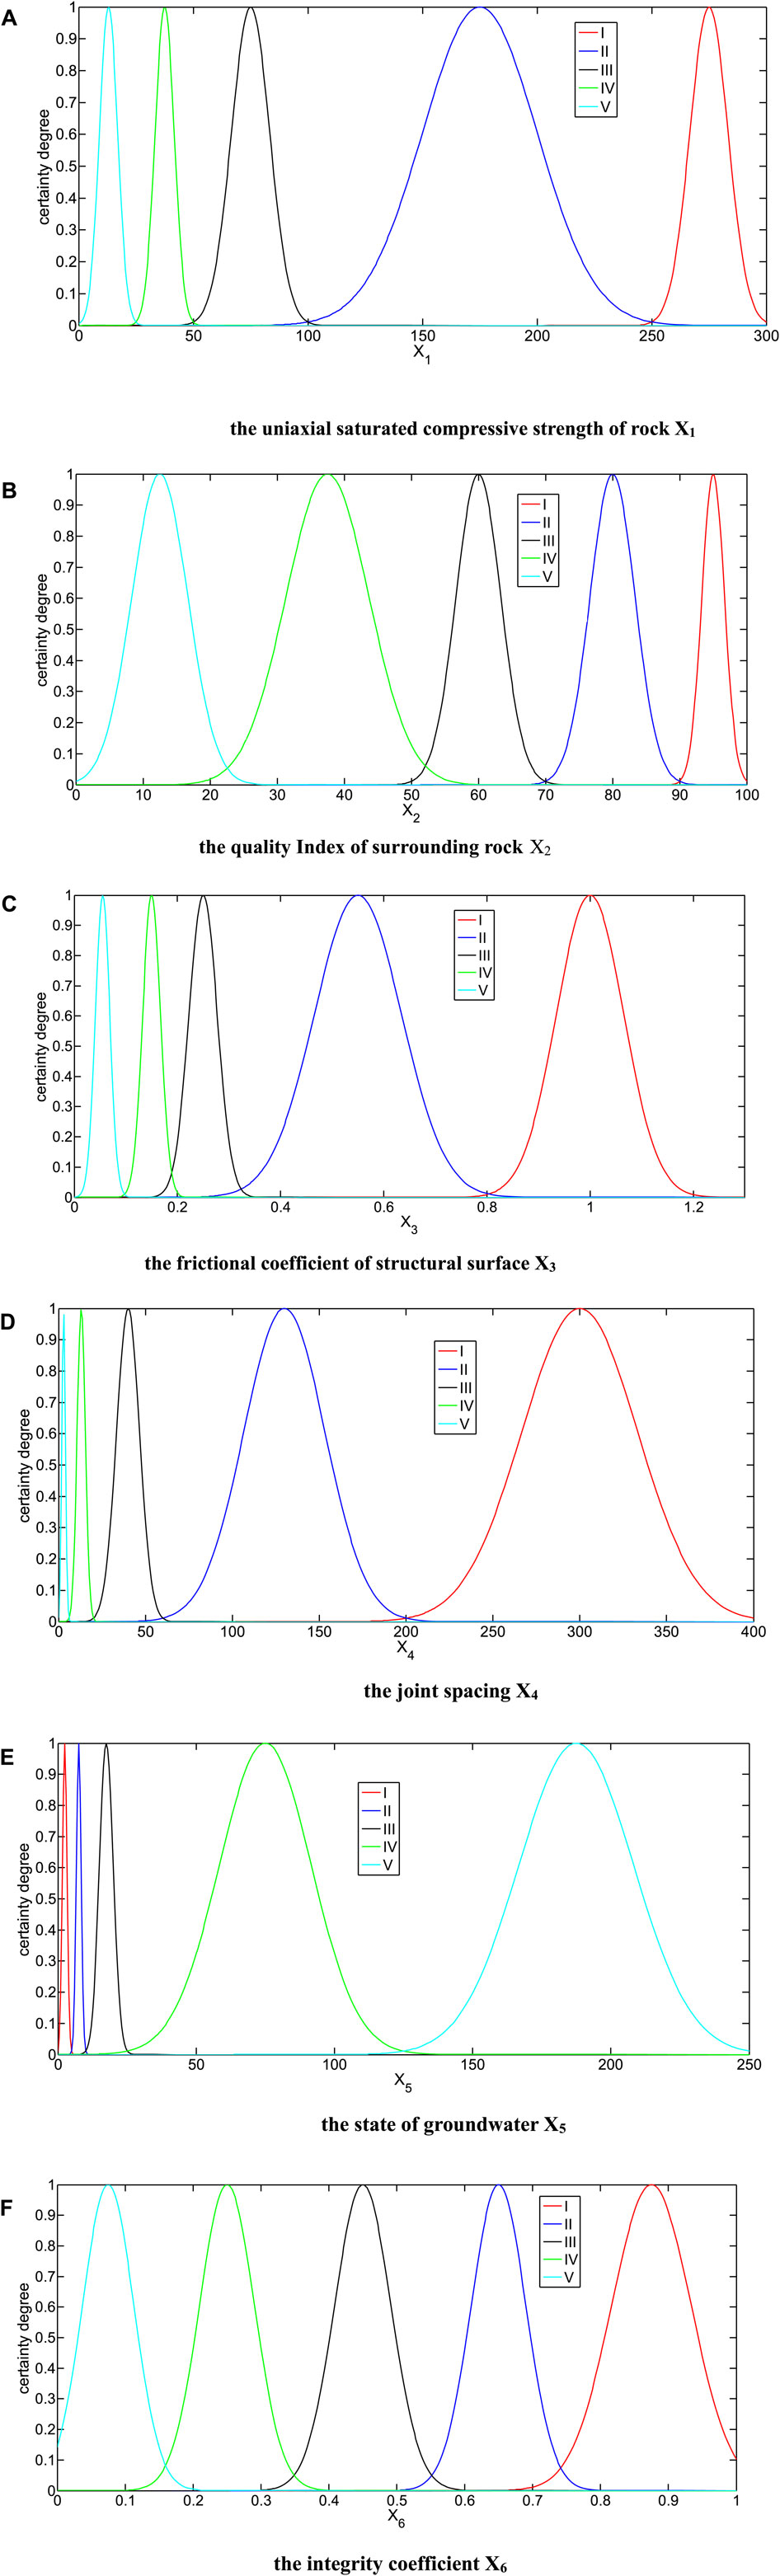
Figure 4. Cloud of each assessment index.
Its horizontal coordinates present the magnitude of different variables; the vertical coordinates present the magnitude of certainty degree. A sub-figure in Figure 4 includes five grades: I (very good), II (good), III (common), IV (unstable), and V (extremely unstable). This is the assessment result for the suggested model. When a certain variable is fixed, the certainty degree of the specific point at the state grade can be obtained.
According to Tables 2 and 3, and with Eqs (17)–(18), a comprehensive membership degree is obtained. Its results are listed in Table 4, and the results compared with the actual investigation are plotted in Figure 5.
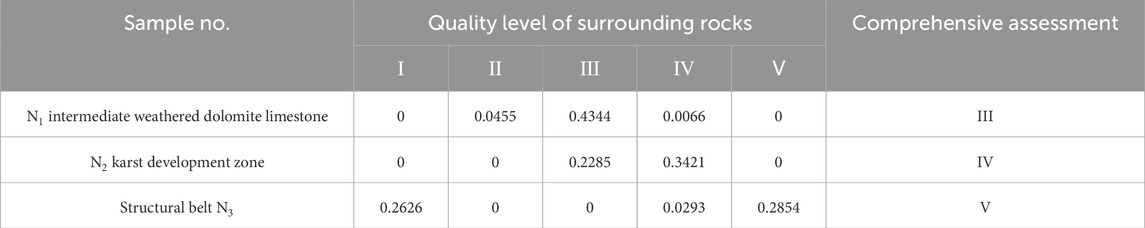
Table 4. Comprehensive membership degree.

Figure 5. Comparison results of the three methods.
The suggested model is applied to assess the surrounding rocks. The complete results are shown in Table 4. Table 4 shows that the quality levels of three different types of surrounding rocks differ. Based on the maximum membership degree criterion, the quality level of N1 intermediate weathered dolomite limestone is III; one of the N2 karst development zones is IV; one of the N3 structural belts is V. It means that the risk level of intermediate weathered dolomite limestone is common; one of the N2 karst development zones is unstable, and one of the structural belt N3 is very unstable. The qualified rate of the quality level of surrounding rock quality is 33.3%. Because the quality level of N1 intermediate weathered dolomite limestone is common, no measures need to be performed. Necessary consolidation measures must be adopted for the N2 karst development zone and the N3 structural belt. For example, rock bolts should be fixed in the surrounding rocks (Shao et al., 2022).
Based on the comparative results of the assessment model in Figure 5, the results assessed by the suggested method are consistent with the actual investigation. Its accuracy rate arrives at 100% in the text method, which is higher than the results from the basic quality indicators (BQ) method (67%) (HUANG et al., 2012). Compared to the BQ method, the suggested model improves the reliability of the assessment process and enhances the predicative accuracy of assessment results. Therefore, it is feasible to estimate the quality level of surrounding rocks using the suggested model. The method not only provides accurate results but also adds detail. For example,
A new assessment method is established in this article based on the game theory combination weighting-normal cloud model, and considering the uniaxial saturated compressive strength of rock (X1), the quality index of surrounding rock (X2), the frictional coefficient of structural surface (X3), the joint spacing (X4), the state of groundwater(X5), and the integrity coefficient (X6).
The proposed method is applied to assess the quality level of surrounding rocks. The result is compared with the current specifications and the BQ method; the results obtained based on the suggested method are consistent with the actual investigation. Its accuracy arrives at 100%, which is higher than the results from the BQ method (67%). The results give various quality grades of surrounding rocks from nos N1-N3 samples. The quality level of N1 intermediate weathered dolomite limestone is III; one of the N2 karst development zones is IV; one of the N3 structural belts is V. This means that the risk level of intermediate weathered dolomite limestone is common; one of the karst development zones is unstable, and one of the structural belts is very unstable. The qualified rate of the quality level of the surrounding rock is 33.3%. Necessary consolidation measures must be adopted for the karst development zone and the structural belt. In addition, the quality levels of the other indexes obtained for the N1 sample by the suggested model belong to level III, so its quality level probability at level III is more significant than that of levels I, IV, V, and II.
In total, the results from the proposed model accurately predict the quality levels of surrounding rocks and further determine the quality grade ranking for different samples at the same level. The suggested method provides a new approach to evaluating the quality grade assessment of surrounding rocks.
The raw data supporting the conclusions of this article will be made available by the authors, without undue reservation.
BZ: writing–original draft, investigation, and data curation. CY-Bing Shao: writing–original draft, methodology, and funding acquisition. CY: writing–review and editing, validation, and supervision. CZ: writing–review and editing, resources, and conceptualization.
The author(s) declare that financial support was received for the research, authorship, and/or publication of this article. This work is supported by the Opening Project of Sichuan Province University Key Laboratory of Bridge Non-destruction Detecting and Engineering Computing (2022QYJ02, 2023QYJ02, and 2022QYY02) and the key scientific research project of colleges and universities in Henan province (23B560019).
Author Y-BS was employed by Henan Kaiyang Architectural Design Co., Ltd.
The remaining authors declare that the research was conducted in the absence of any commercial or financial relationships that could be construed as a potential conflict of interest.
All claims expressed in this article are solely those of the authors and do not necessarily represent those of their affiliated organizations, or those of the publisher, the editors, and the reviewers. Any product that may be evaluated in this article, or claim that may be made by its manufacturer, is not guaranteed or endorsed by the publisher.
Alison, M. Q., Canbulat, I., and Oh, J. (2022). Methods applied in Australian industry to evaluate coal mine slope stability. Int. J. Min. Sci. Technol. 30 (2), 151–155.
Chen, J., Shou, Y., and Zhou, X. (2022). Implementation of the novel perfectly matched layer element for elastodynamic problems in time-domain finite element method. Soil Dyn. Earthq. Eng. 152, 107054. doi:10.1016/j.soildyn.2021.107054
Chen, J., and Zhou, X. (2024). Advanced absorbing boundaries for elastodynamic finite element analysis: the added degree of freedom method. Comput. Method Appl. M. 420, 116752. doi:10.1016/j.cma.2024.116752
Chen, J. W., and Zhou, X. P. (2019). The enhanced extended finite element method for the propagation of complex branched cracks. Eng. Analysis Bound. Elem. 104, 46–62. doi:10.1016/j.enganabound.2019.03.028
Dao-hong, Q. I. U. (2008). Evaluation of tunnel rock quality with Routh sets theory and artificial neural networks. J. Jilin Univ. 38 (1), 86–91.
Ding, F., Chen, L., Sun, C., Zhang, W., Yue, H., and Shuhan, Na (2022b). An upgraded groundwater quality evaluation based on Hasse diagram technique and game theory. Ecol. Indic. 140, 109024. doi:10.1016/j.ecolind.2022.109024
Ding, F., Zhang, W., Cao, S., Hao, S., Chen, L., Xie, X., et al. (2023). Optimization of water quality index models using machine learning approaches. Water Res. 243, 120337. doi:10.1016/j.watres.2023.120337
Ding, F., Zhang, W., Chen, L., Sun, Z., Li, W., Li, C.-yun, et al. (2022a). Water quality assessment using optimized CWQII in Taihu Lake. Environ. Res. 214, 113713. Part 1. doi:10.1016/j.envres.2022.113713
Gu, X. B., Ma, Y., Wu, Q. H., Ji, X. J., and Bai, H. (2021). The risk assessment of landslide hazards in Shiwangmiao based on intuitionistic fuzzy sets-Topsis model. Nat. Hazards 111, 283–303. doi:10.1007/s11069-021-05053-5
Gu, X.-B., Wang, Li, and Wu, Q.-H. (2022a). The risk assessment of debris flow in the duba river watershed using intuitionistic fuzzy sets: TOPSIS model. Math. Problems Eng. 2022, 1–12. Article ID 2031907, 12 pages. doi:10.1155/2022/2031907
Gu, X. B., and Wu, Q. H. (2016). The application of nonordinary, state-based peridynamic theory on the damage process of the rock-like materials. Math. Problems Eng. 3 (8), 1–9. doi:10.1155/2016/9794605
Gu, X.-B., Wu, Q.-H., and Ma, Y. (2022b). Risk assessment of the rockburst intensity in a hydraulic tunnel using an intuitionistic fuzzy sets-TOPSIS model. Adv. Mater. Sci. Eng. 2022, 1–14. Article ID 4774978. doi:10.1155/2022/4774978
Huang, R., and al, et (2012). Based on entropy weight method and extenics tunnel’s quality evaluation of surrounding. Rock 37 (1), 139–143. (in Chinese).
Huang, R., Kang, L. I. U., Tong, H., and Wang, H. (2014). Stability assessment of surrounding rocks based on entropy weight and ideal point methods. Technol. Rev. 32 (20), 64–68.
Li, S. C., and Wu, J. (2023). A multi-factor comprehensive risk assessment method of karst tunnels and its engineering application. Bull. Eng. Geol. Environ. 78 (6), 1761–1776. doi:10.1007/s10064-017-1214-1
Qin, Z., et al. (2016). Research on risk level evaluation of deep roadway stability. Min. Saf. Environ. Prot. 43 (5), 95–102. (In Chinese.
Shao, J.-Li, Gao, L., Wu, Q.-H., and Gu, X.-B. (2022). The application of variable fuzzy sets theory on the quality assessment of surrounding rocks. Adv. Mater. Sci. Eng. 2022, 1–10. doi:10.1155/2022/5441829
Tan, S.-lin, Ling, HUANG, and Ya-wei, L. I. 2022 Application of fuzzy-AHP comprehensive evaluation to the quality. Geol. Sci. Technol. Inf.,28(1):105–108. (in Chinese).
Wang, H.-de, and Cao, Y.-hao (2013). Evaluation of surrounding rock stability based on improved matter-element extension model with variable weight. China Saf. Sci. J. 23 (8), 23–29. (in Chinese).
Wang, Y.-chao, Yue-quan, SHANG, Hong-yue, S. U. N., and Xi-shui, Y. A. N. (2010). Study of prediction of rockburst intensity based on efficacy coefficient method. Rock Soil Mech. 31 (2), 529–534.
Wei, B., Huang, H., and Xu, Z. (2016). Two-dimensional evaluation model of rock mass based on combination weighting and cloud model. Chin. J. Rock Mech. Eng. 35, 3092–3099. supp 1.
Zhao, Y., Du, C., Bi, J., and Chaolin, W. (2021). Experimental investigation of triaxial compression and permeability of gritstone in geothermal environment. Bull. Eng. Geol. Environ. 80, 6971–6988. doi:10.1007/s10064-021-02370-8
Zhou, X. P., Bi, J., and Qian, Q. H. (2015a). Numerical simulation of crack growth and coalescence in rock-like materials containing multiple pre-existing flaws. ROCK Mech. ROCK Eng. 48 (3), 1097–1114. doi:10.1007/s00603-014-0627-4
Zhou, X. P., Bi, J., and Qian, Q. H. (2015b). Numerical simulation of crack growth and coalescence in rock-like materials containing multiple pre-existing flaws. Rock Mech. Rock Eng. 48 (3), 1097–1114. doi:10.1007/s00603-014-0627-4
Zhou, X. P., Cheng, H., and Feng, Y. F. (2014). An experimental study of crack coalescence behaviour in rock-like materials containing multiple flaws under uniaxial compression. ROCK Mech. ROCK Eng. 47 (6), 1961–1986. doi:10.1007/s00603-013-0511-7
Zhou, X.-P., En-Ming, X., Yang, H.-Q., and Qi-Hu, Q. (2012). Different crack sizes analyzed for surrounding rock mass around underground caverns in Jinping I hydropower station. Theor. Appl. Fract. Mech. 57 (1), 19–30. doi:10.1016/j.tafmec.2011.12.004
Zhou, X. P., Gu, X. B., and Qian, Q. H. (2016). Seismic bearing capacity of shallow foundations resting on rock masses subjected to seismic loads. KSCE J. Civ. Eng. 20 (1), 216–228. doi:10.1007/s12205-015-0283-6
Zhou, X. P., Pan, X. K., and Cheng, H. (2021). The nonlinear creep behaviors of sandstone under the different confining pressures based on NMR Technology. Rock Mech. Rock Eng. 54 (9), 4889–4904. doi:10.1007/s00603-021-02557-1
Zhou, X. P., and Yang, H. Q. (2007). Micromechanical modeling of dynamic compressive responses of mesoscopic heterogenous brittle rock. Theor. Appl. Fract. Mech. 48 (1), 1–20. doi:10.1016/j.tafmec.2007.04.008
Keywords: quality evaluation, surrounding rocks, the game theory combination weighting method, normal cloud model, application
Citation: Zhao B, Shao Y-B, Yang C and Zhao C (2024) The application of the game theory combination weighting-normal cloud model to the quality evaluation of surrounding rocks. Front. Earth Sci. 12:1346536. doi: 10.3389/feart.2024.1346536
Received: 29 November 2023; Accepted: 06 March 2024;
Published: 08 April 2024.
Edited by:
Manoj Khandelwal, Federation University Australia, AustraliaReviewed by:
Fei Ding, Beijing University of Technology, ChinaCopyright © 2024 Zhao, Shao, Yang and Zhao. This is an open-access article distributed under the terms of the Creative Commons Attribution License (CC BY). The use, distribution or reproduction in other forums is permitted, provided the original author(s) and the copyright owner(s) are credited and that the original publication in this journal is cited, in accordance with accepted academic practice. No use, distribution or reproduction is permitted which does not comply with these terms.
*Correspondence: Yang -Bing Shao, Z3V4aW5iYW8xMUAxNjMuY29t
Disclaimer: All claims expressed in this article are solely those of the authors and do not necessarily represent those of their affiliated organizations, or those of the publisher, the editors and the reviewers. Any product that may be evaluated in this article or claim that may be made by its manufacturer is not guaranteed or endorsed by the publisher.
Research integrity at Frontiers
Learn more about the work of our research integrity team to safeguard the quality of each article we publish.