 Maozhou Huang1,2
 Yinting Zhao
94% of researchers rate our articles as excellent or good
Learn more about the work of our research integrity team to safeguard the quality of each article we publish.
Find out more
ORIGINAL RESEARCH article
Front. Earth Sci., 15 March 2024
Sec. Geohazards and Georisks
Volume 12 - 2024 | https://doi.org/10.3389/feart.2024.1341922
When conducting tunnel construction in sandy gravel strata, disturbance to the sandy gravel soil is inevitable, resulting in alterations to the properties of the surrounding rock. This paper investigates the relationship between the relative density (Dr) and shear strength parameters under different disturbance states through the implementation of indoor triaxial tests. Utilizing Dr as a disturbance parameter, a unified disturbance function that reflects the weakening and strengthening of sandy gravel soil is proposed. Furthermore, a revised constitutive model based on this unified disturbance function is established for the first time. The study results indicated that the results calculated by traditional models, which do not take into account disturbance effects, deviate from the experimental results by more than 20%. However, the error rate of the results computed by the modified model can be reduced to within 8%. The new model establishes a dynamic relationship between relative compactness and shear strength parameters of sand and pebble soils, which can take into account both the effects of negative and positive perturbations. The results can more accurately characterise the strength and deformation properties of the surrounding rock under the influence of construction disturbances in sand and pebble ground tunnels.
Sand and gravel formations present a significant challenge for underground construction due to their loose soil structure and limited self-stability. For example, in the Weiyuan to Wudu section in Gansu, these formations have markedly affected the advancement and safety management of tunnel construction. The structure of sand and gravel soil is defined by discrete elements, uneven particle size distribution, limited self-stability of tunnel surrounding rock, high permeability, independent particle displacement, and gradual deformation of surrounding rock post-excavation (Hu et al., 2013a; Guo et al., 2019; Du et al., 2021). Consequently, tunnel construction in sand and gravel formations is more prone to settlement and collapse compared to more stable geological formations like hard rock and cohesive soils (Guo, 1999; Hu et al., 2013b; Shi et al., 2014a; Liu et al., 2015).
Excavating tunnels in sand and gravel formations frequently presents challenges due to significant geological disturbance and challenges in stabilizing the excavation face, significantly compromising tunnel construction safety. Scholars, both domestic and international, have extensively researched the distribution of sand and gravel layers (Wells et al., 1999; Cao et al., 2001). They’ve analyzed the stratigraphy of sand and gravel formations, established geological information, and investigated lithology, particle size characteristics, weathering degree, and the arrangement of sand and gravel. They’ve additionally explored regional disparities in sand and gravel layer distribution by investigating historical river course changes, sand and gravel formation and structural characteristics, and other relevant factors (Cao, 2003). Mohsen Haeri et al. (2005) performed undrained triaxial compression tests and unconfined compressive strength tests on both unconsolidated and artificially consolidated sand and gravel specimens to investigate coarse alluvium sand and gravel deposits in Tehran, Iran’s primary urban areas. Li Yong and Li Bing (Li et al., 2006) noted poor sorting of sand and silt stones, unstable bedding, and their widespread distribution in the Chengdu region. Sand and gravel layers display substantial regional disparities in composition, structure, and both horizontal and vertical characteristics. Concerning the mechanical traits of sand and gravel soil, JaroslavluiP (Feda, 1982; Feda, 2002) examined sand and gravel layers, identifying the interlocking action between particles as the primary cause of apparent shear dilation. They further analyzed the primary influencing factors. El Dine (El Dine et al., 2010) investigated how the characteristics of sand and gravel formations influence their mechanical properties through large-scale triaxial tests. Si Hongyang (Hong-tan, 1990) analyzed a substantial volume of S-axis test data, comparing differences between sand and gravel and aggregate materials regarding shear strength, shear dilation, stress-strain, and discussed the outcomes related to the Duncan model. Zhang Yu (Zhang et al., 2008) and colleagues investigated factors influencing the strength and deformation of both saturated and unsaturated sand and gravel via direct shear compression tests, subsequently devising an empirical formula correlating shear strength with pressure stress for these materials. Current research on the characteristics of sand and gravel strata primarily concentrates on the impact of water on the mechanical properties of these materials. Quantitative research exploring the relationship between changes in relative density and the strength of sand and gravel soil is relatively scarce. As a composite soil-rock material, its compaction significantly influences the performance of the surrounding rock mass (Wang et al., 2006; Zheng et al., 2018). Shi et al. (2014b) conducted experiments on the strength and deformation characteristics of coarse-grained soil, and studied the influence of different coarse-grained content and different confining pressure on the strength and deformation indexes of coarse-grained soil. Xu et al. (2015) believe that the Duncan-Zhang model can well reflect the loading stress path of coarse-grain soil in rockfill DAMS, but there are obvious differences in the simulation of unloading stress path, resulting in deformation description errors. Wang Linchao believe that under the cyclic action of high temperature heating and liquid nitrogen cooling, granite cracks are mainly caused by the inherent heterogeneity and expansion and contraction of internal particles (Wang et al., 2023). To quantitatively assess the mechanical property variations of sand and gravel soil for engineering applications, several scholars have utilized a blend of experiments and theoretical derivations to investigate soil stress conditions and mechanical parameters through soil constitutive models (Peng et al., 2019; Jia et al., 2021; Zhang et al., 2020). Although this method offers fresh perspectives on calculating the intricate mechanical properties of tunnel surrounding rock, traditional constitutive models are no longer adequate for practical engineering as engineering conditions grow more complex (Cui and Dong, 2018; Sun and Yan-sheng, 2018; Zhao et al., 2020). Concurrently, for a more comprehensive examination of the physical-mechanical properties of soil during construction disturbances, Xu explored the adaptation of the Duncan-Chang model using China’s ISO standard sand (Xu et al., 2012). Chen (Cheng et al., 2017) demonstrated, that relative density significantly impacts the strength-deformation characteristics of this type of sand via triaxial consolidation-drainage shear tests conducted on medium-coarse sand under various confining pressures in the Shenyang area. The adapted D-C model offers improved descriptions of the strength-deformation characteristics of medium-coarse sand under disturbance. Huang Ming (Huang et al., 2017) developed a creep constitutive model for soft rock using the disturbance states concept and experimentally proved its efficacy in describing the initial, stable, and accelerated stages of soft rock creep. Huang Jianbing (Huang et al., 2019) suggested a method to construct a nonlinear elastic constitutive model for coarse-grained soil considering disturbance, established on extensive large-scale triaxial consolidation-drainage shear tests of three prevalent coarse-grained soils in the northeastern region.
It can be obtained that the Duncan-Chang constitutive model is frequently employed to describe the constitutive relationships of sandy gravel soil in engineering applications both domestically and internationally. However, the model does not take into consideration the disturbance factors of sandy gravel soil. As a soil type susceptible to disturbance, sandy gravel soil exhibits variations in mechanical parameters such as stress and strain under different excavation conditions during actual construction. In addition, numerous physical parameters, including porosity, density, and moisture content, also undergo changes. These alterations in physical parameters can, in turn, lead to modifications in the mechanical parameters, a process that has garnered limited attention in previous studies of constitutive relationships. Therefore, the real mechanical state and the parameter selection of sand and gravel soil in tunnel construction remain ambiguous. The results of calculations without considering the disturbed state of sand and pebble soil differ significantly from the results of engineering field tests (Zhao and Ma, 2022). Therefore, a primary challenge in excavating sand and gravel layer tunnels involves modifying the constitutive model of sand and gravel soil to align with engineering practice. This paper initiates by considering the relationship between the relative density (Dr) of sand and gravel soil and the mechanical properties of the surrounding rock as a foundational aspect. Using indoor experiments as the primary method and in conjunction with disturbance theory, a disturbance formula is formulated, with Dr serving as the disturbance parameter. Finally, the modified model’s applicability and accuracy are validated.
The basic principle of the large-scale triaxial test for sandy pebble soil is the same as that of triaxial shear test for fine-grained soil, except that the scope of the study object is wider, the particle size is larger as well as the scale and size of the instrument are larger. This pertains to the coarse-grained and discrete sandy gravel soil suitable for the research presented in this paper. During the triaxial test, the vertical stress is first applied to the specimen, so that the vertical principal stress becomes greater than the horizontal one. When the horizontal principal stress remains unchanged and the vertical principal stress is gradually increased, the specimen finally damaged by shear stress. Provided that shear failure occurs in the specimen, the increment of the vertical compressive stress on the specimen is Δσ1, the major principal stress in the specimen is expressed as σ1=σ3+Δσ1, and then the small primary stress is σ3, so Mohr’s limit stress circle is obtained. Several specimens at least the three same specimens under different confining pressuresσ3are used to conduct the compressive test as per the above-stated method respectively, then large principal stress σ1 at shear failure is obtained. In combination with these results, a set of Mohr’s limit stress circles are obtained, including a common tangent line. This line indicates the shear strength envelope of sandy pebble soil under triaxial compression. The angle included between the tangent line and the x-axis denotes the internal friction angle φ of sandy pebble soil, while the intercept between the tangent line and y-axis illustrates the cohesion c of sandy pebble soil as shown in Figure 1.
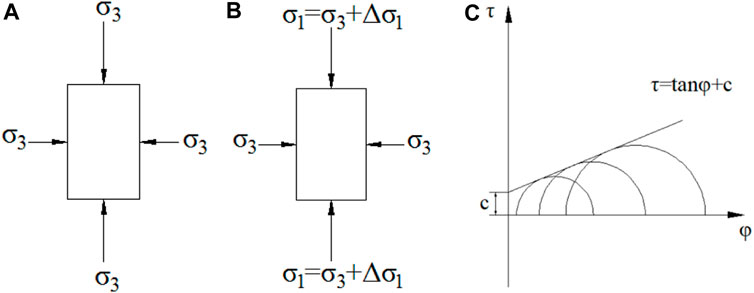
FIGURE 1. The principle of triaxial compression. (A) The sandy pebble soil specimen subject to confining pressure (Vertical view); (B) The increment of principal stress on the specimen; (C) Mohr’s stress circle.
To conduct triaxial compressive test for sandy pebble soil specimen, YLSZ30-3 stress-typed large triaxial testing machine is used (as shown in Figure 2). This set of apparatus is used to measure such properties as the total shear strength parameters, effective shear strength parameters and pore pressure coefficient of sandy pebble soil. Triaxial compressive tests for sandy pebble soil subject to constant confining pressure have been carried out according to the properties and engineering conditions of sandy pebble soil under different situations. The main performance indexes of the apparatus are listed in Table1.
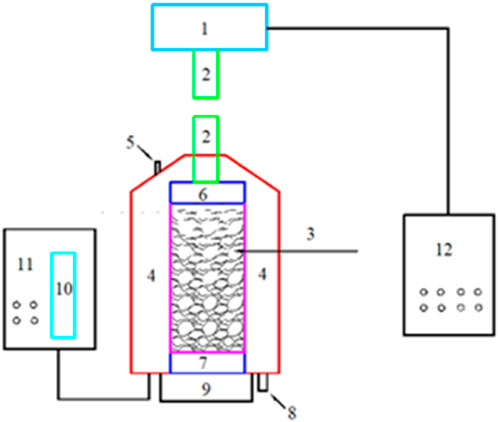
FIGURE 2. Stress-typed largescale triaxial testing machine. ① Loading column (Loading speed within 1.5 mm/min); ② Ergometer; ③ Pressure chamber containing sandy pebble soil; ④ Confining pressure control room (Water is used to exert confining pressure); ⑤ Water inlet; ⑥ Top plate; ⑦ Bottom plate; ⑧ Water outlet; ⑨ Machine base; ⑩ Water measuring tube; ⑪Confining pressure control room; ⑫ Loading control room.
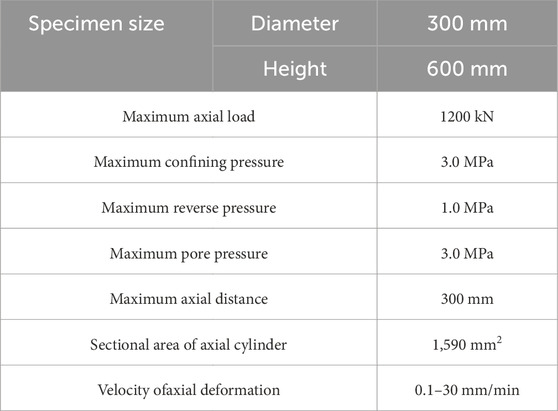
TABLE 1. Main performance indexes of the apparatus.
The soil samples selected for this experiment were from a metro project in a city in southwest China. Since most of the tunnel depths are within the sandy pebble soil layer, this experiment primarily focused on the study of sandy pebble soil. The composition of the pebbles mainly consists of igneous and metamorphic rocks. They are predominantly sub-rounded to sub-angular, with some rounded pebbles, poor sorting, and a pebble content ranging from 60% to 85%. The particle size mainly falls in the range of 20–80 mm, with some particles exceeding 100 mm, and the largest pebble has a diameter of 180 mm. The interstitial material is fine sand, and occasional floaters are present, as shown in Figure 3. The arithmetic average method of particle grading was used to obtain the grading of sand and pebble soil particles used in the test, as shown in Table 2. Field measurements determined that the density of the soil samples ranged between 0.4 and 0.6, with a natural moisture content of 4%. Consequently, the density of the specimens during the experiment was set at 0.4, 0.5, and 0.6. Furthermore, based on the depth from which the samples were extracted, the confining pressures for the laboratory tests were calculated to be 100 kPa, 200 kPa, and 300 kPa, respectively.
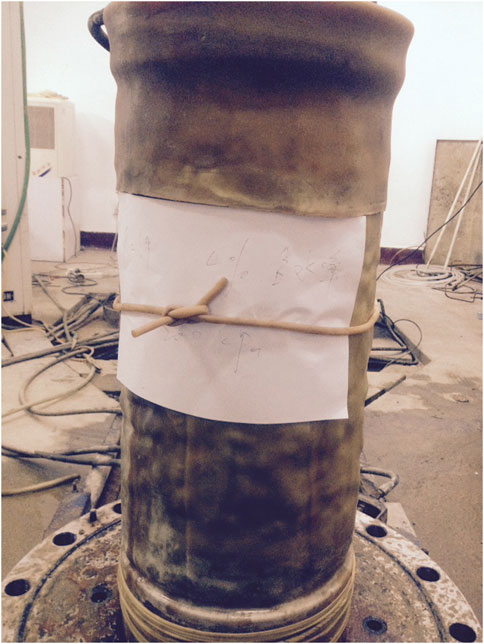
FIGURE 3. Sample preparation process of triaxial test.
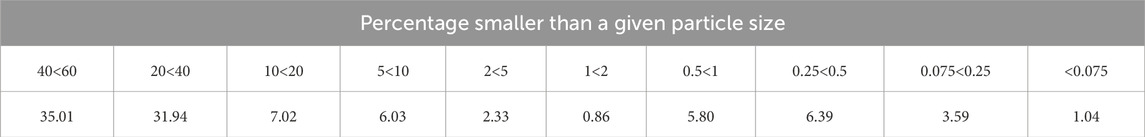
TABLE 2. Grading of sand and pebble soil particles.
In the triaxial shear test, it is essential first to prepare the testing apparatus, which involves filling the organic glass tube in the volume change measurement cabinet with water and removing any air. Next, the soil sample is prepared and placed step by step, including laying the permeable plate, filter cloth, and rubber mold, and layering the soil sample with compaction at each layer. Subsequently, a vacuum pump is used to create a negative pressure inside the sample to help remove air. Then, the pressure chamber shell is installed and ensured to be sealed, followed by water injection into the pressure chamber. Finally, the axial loading and the pressure chamber are synchronously lifted using the oil pump, and the test parameters are set on the control panel, marking the commencement of the test.
With the increase in confining pressure, the tangent slope and linearity of the stress-strain curve for the sand-pebble soil specimens improved (as shown in Figure 4). Additionally, the initial tangent modulus gradually increased, suggesting an enhancement in the compression modulus due to the interplay between hydrostatic pressure and shear deformation. This indicates a strengthening effect resulting from the coupling of these factors. Moreover, the peak stress of the sandy pebble soil specimen gradually increases, along with its initial elastic modulus. The shear failure in the sandy pebble soil specimen occurs as its axial strain approaches 3.5%. This behavior contrasts with fine-grained soil, where the axial strain reaches approximately 15% before specimen damage occurs. The higher density of sandy pebble soil prevents obvious strain softening, enabling it to withstand higher loads post its peak strength. The presence of large pebble particles in the sand and pebble soil induces a crushing effect during the compression process, resulting in non-ideal test curves with fluctuations observed during experimentation.
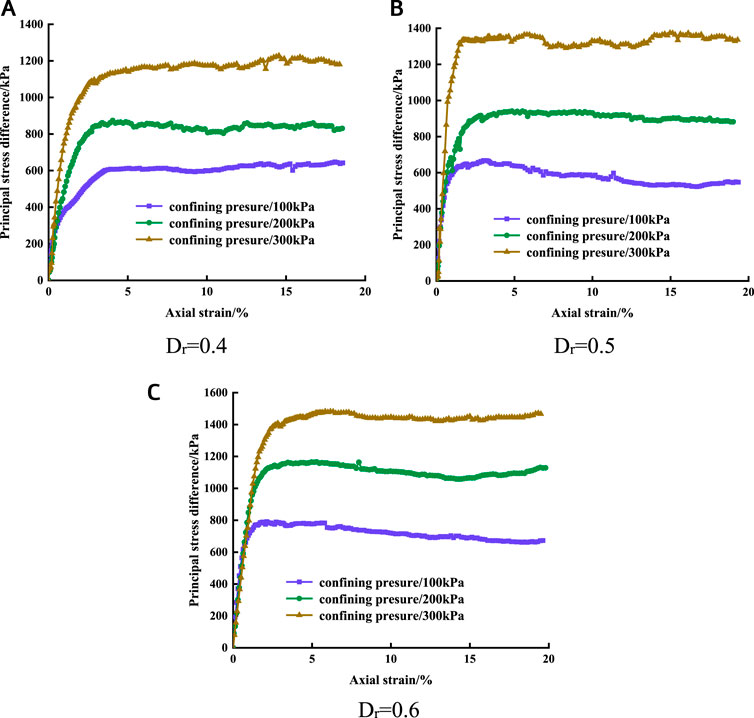
FIGURE 4. Stress-strain curves of sandy pebble soil with different compactness. (A) Dr = 0.4. (B) Dr = 0.5. (C) Dr = 0.6.
The difference in principal stresses obtained at various circumferential pressures increased with the rising Dr. At Dr = 0.6, the range of principal stress differences at different perimeter pressures reached 800–1,500 kPa.
The Mohr stress circle was constructed based on the results of triaxial shear tests, yielding the strength parameters of sandy pebble soil under varying relative densities, as displayed in Table 3. These results reveal a significant correlation between specimen density and the shear strength parameters of sandy pebble soil. Figure 5 demonstrates that the internal friction angle of sandy pebble soil decreases as relative density increases, showing a maximum reduction of 31.7%. In contrast, cohesion initially rises and subsequently diminishes, exhibiting a more notable decline when relative density surpasses 0.5. The correlation between the mechanical parameters of sandy pebble surrounding rock and relative density is shown as Eqs. 1, 2 (These formulas are only applicable to sandy pebbly soils with a densification of 0.4–0.6):

TABLE 3. Shear strength parameters of sandy pebbly soils.
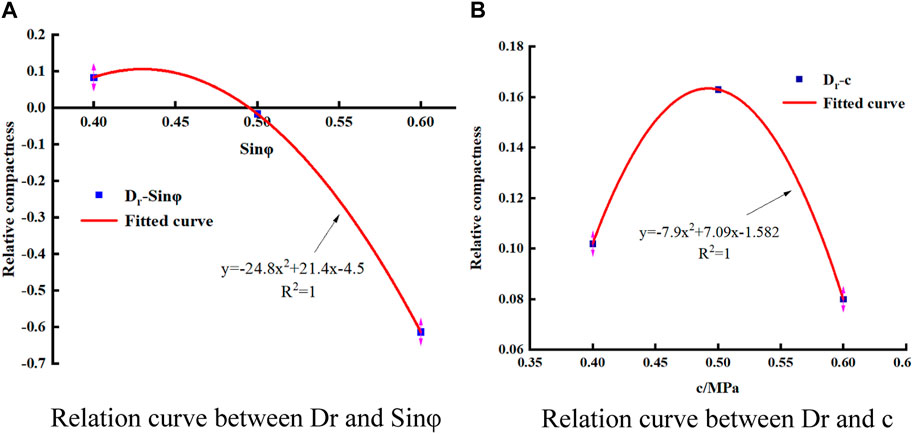
FIGURE 5. Relation between relative compactness and sand pebble parameter strength. (A) Relation curve between Dr and Sinφ. (B) Relation curve between Dr and c.
As depicted in Figure 4, the impact of relative compactness (Dr) on the strength and deformation characteristics of sandy pebble soil becomes evident. The curve delineating the connection between deviator stress (σ1-σ3) f and axial principal strain ε1 closely resembles a hyperbolic pattern, akin to the stress-strain constitutive relationship initially proposed by Kondner for soils. In this study, an approximate fit to the stress-strain curve of sandy pebble soil is accomplished through the utilization of a hyperbolic model. So, hyperbola is employed to approximately fit the stress-strain curve of sandy pebble soil in this paper and the hyperbolic relationship is illustrated in Eq. 3.
A straightforward manipulation of Eq. 3 results in the derivation of Eq. 4.
In relation to triaxial compressive test of sandy pebble soil subject to constant confining pressure, so σ2=σ3=constant, and then dσ2=dσ3=0. The expressiondenoting the initial tangent modulus Eiwhen ε1=0 in the compressive test is shown in Eq. 5.
If the principal stress ε1→∞ in Eq. 3, then Eq. 3 is turned into Eq. 6.
When Eq. 4 is used to find out the linear relationship betweenε1/(σ1-σ3) and ε1, the test point at low stress level and high stress level often deviates from the straight line. Duncan and Chang (1970) summarized formula Eq. 7 to calculate parameters a and b through a large number of laboratory experiments and field tests.
The subscripts 95% and 70% in Eq. 7 representthe corresponding test data as (σ1-σ3) is equal to 95% and 70% of the strength of the sand, namely, (σ1-σ3)f.When the stress-strain curve has a peak value, then (σ1-σ3)f=(σ1-σ3)max; As for the absence of a peak point, (σ1-σ3)ftakes the corresponding valueof ε1=15%. The damage ratio Rf is then defined in Eq. 8.
Employ Eq. 4 through Eq. 8 to compute the parameter values across varying degrees of compaction and confining pressures, encompassing Ei, (σ1-σ3)ult, (σ1-σ3)f, and Rf.
As evident from the data presented in Table 4, (σ1-σ3)f, Ei, (σ1-σ3)ult, a, and b exhibit variations in response to alterations in both the compactness and confining pressure of sandy pebble soil. Intriguingly, the damage ratio, denoted as Rf, remains remarkably stable throughout these changing conditions.
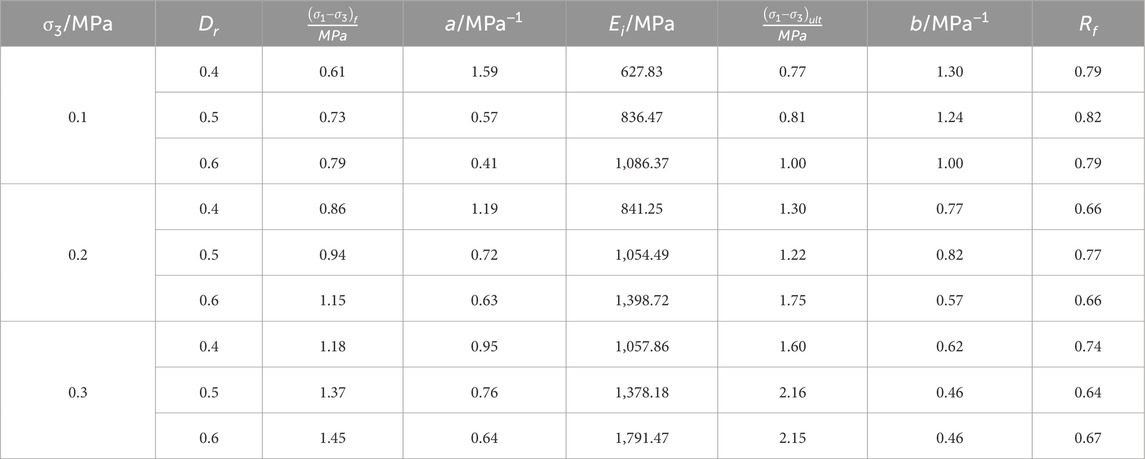
TABLE 4. Parameters in Duncan-Chang model of sandy pebble soil inrelated cases.
The Eq. 8 reveals that (σ1-σ3)ult is expressed as a function of Rf and (σ1-σ3)f. Furthermore, as indicated in Table 2, it becomes apparent that Dr exerts a substantial influence on (σ1-σ3)f, while its impact on Rf remains relatively insignificant. The effect of Dr on parameter b is considered in the context of (σ1-σ3)f. Taking into account the relationship between (σ1-σ3)f and the confining pressure σ3, Eq. 9 is formulated as follows.
Taking the logarithm of both sides of Eq. 9.
Where parameter lnO represents the intercept of the line, P is the slope of the line. If the test data in Table 4 are substituted into Eq. 10, then the values of O and P under different relative compactness are derived and listed in Table 5.
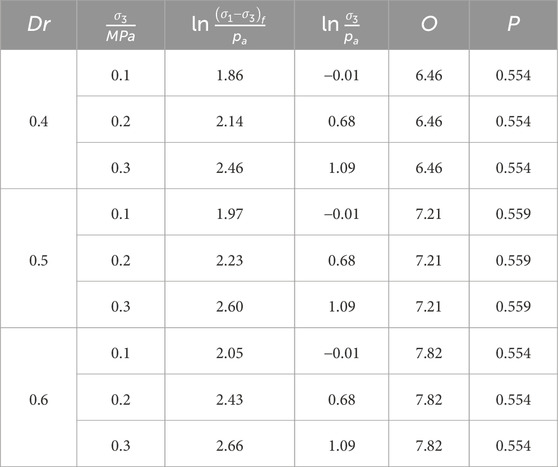
TABLE 5. Values of O and P under different compactness of sandy pebble soil.
From Table 5, it can be observed that, under different relative soil compaction levels, the value of P remains relatively constant, while O exhibits a relatively significant variation with respect to Dr. Figure 6 illustrates the relationship between lnO and Dr, revealing a roughly linear association between the lnO parameter and Dr. Consequently, Eq. 11 can be employed to perform a linear fit on lnO and Dr.
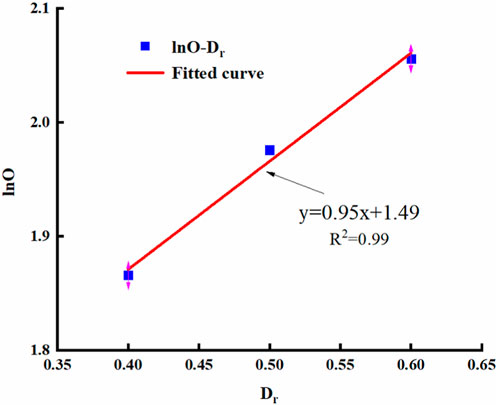
FIGURE 6. Linear regression showing relation between lnO and Dr.
Figure 6 reveals a compelling linear association between lnO and the relative compactness parameter Dr. In the context of sandy pebble soil, the dimensionless constants o and p within Eq. 11 were determined through experimental investigations, resulting in values of o = 0.18 and p = 1.331, accompanied by a remarkably high correlation coefficient of R2 = 0.999. These findings provide strong evidence supporting the appropriateness and efficacy of the linear regression model applied to lnO and Dr.
A great deal of research has been done to show that the initial shear modulus Ei of the soil is an exponential function of the lateral limit pressure, expressed as follows
A certain deformation of the formula can be obtained:
By substituting the parameters in Table 4 into Eq. 13, the values of lnM and N under different relative compactness are obtained and listed in Table 6.
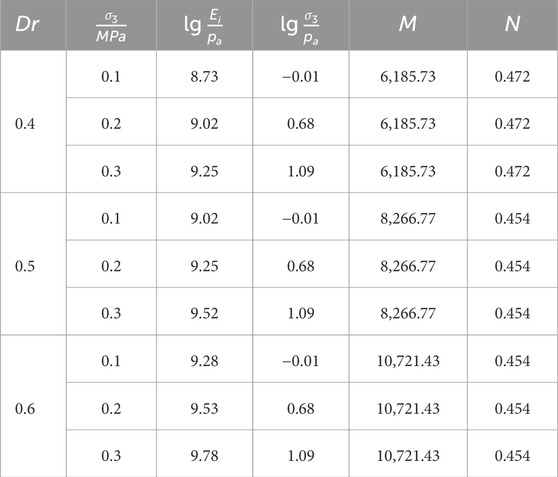
TABLE 6. Values of M and N under different compactness of sandy pebble soil.
It can be seen from Table 6 that the value of N basically remains unchanged, and lnM changes with Dr in a large range under different relative compactness. Figure 7 shows the linear relationship between lnM and Dr. As a result, Eq. 14 is obtained to express the linear relationship between lnM and Dr.
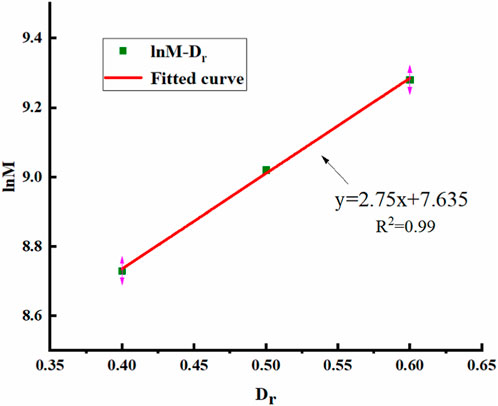
FIGURE 7. Linear regression showing relation between lnM and Dr.
Additionally, Figure 7 presents a clear and apparent linear correlation between lnM and the relative compactness parameter, Dr. Notably, for sandy pebble soil, the dimensionless constants m and n within Eq. 14 were derived from experimental data, resulting in the values m = 3.288 and n = 1.115. (accompanied by a high correlation coefficient of R2=0.996). This further affirms the logical and efficient nature of the linear regression model applied to lnM and Dr.
According to the theory of disturbed state concept (DSC), the microstructure of sandy pebble soil is disturbed by external force, resulting in the damage of micro-cracks or the reinforcement of particles due to the relative movement of particles. The disturbance process is described with function D, namely, disturbance function, and its magnitude is determined with disturbance degree. The disturbance evolution is expatiated by macroscopic measurement so as to simulate the behavior of sandy pebble soil. The disturbance function D of soil is established according to test results
It is apparent from Eq. 15 that the disturbance degrees introduced by Desai all possess positive values and are confined to the [0,1] interval, akin to the traditional interpretation of a damage variable. However, it's essential to recognize that disturbance doesn’t solely lead to the micro-crack damage within the material; it also has the capacity to enhance material properties, such as the compaction of sandy pebble soil. In this context, D assumes negative values, signifying an improvement in material performance following a disturbance. For the sake of clarity, the term “positive disturbance” is used to refer to a disturbance that decreases Dr, while “negative disturbance” characterizes a disturbance that increases Dr. Based on the fundamentals of the Disturbed State Concept (DSC), Dr is used as the perturbation parameter. The final perturbation function can be expressed as follows.
(a) Positive disturbance,
(b) Negative disturbance,
The functional relationship of Eqs 16, 17 is drawn and shown in Figure 8. It can be seen that the disturbance degree falls in to interval [−1, 1], it indicates the whole process of the change of sandy pebble soil from the initial state to the densest or the loosest state.
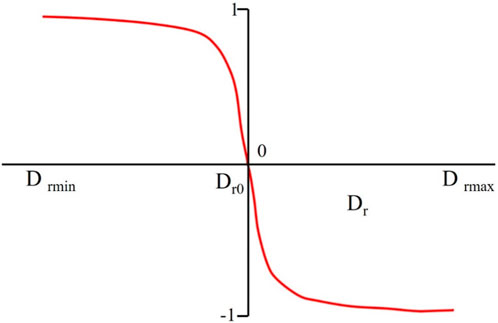
FIGURE 8. Relationship between disturbed degree and relative compactness of soil.
The physical and mechanical parameters of sandy pebble soil are prone to change under the influence of soil disturbance, resulting in significant alterations in the soil’s deformation and strength characteristics. The degree of disturbance in sandy pebble soil is primarily characterized by a disturbance equation. To effectively depict the changes in the soil’s mechanical properties under any disturbance scenario, it is necessary to establish a functional relationship between the soil’s mechanical parameters and D. Within the Duncan-Chang model, the initial modulus Ei and peak strength (σ1-σ3)f are most significantly affected by the relative compactness of the soil.
Under the condition of positive disturbance,
Morphing Eq. 18 gives
Substituting Eqs 9, 11 into Eq. 19 yields Eqs 20, 21.
If let
Combining Eqs 12, 14 with Eqs 19, 3 can be obtained
Simplifying Eq. 23 gives
Substituting M0 (
(2) Under the condition of Negative disturbance, Dr>Dr0, Drmax=1.
Morphing Eq. 26 gives
Combining Eqs 9, 11 with Eq. 27 gives
Simplifying the formula Eq. 28 gives
Substituting O0 (
Combining Eqs 12, 14 with Eq. 30 gives
Simplification of Eq. 31 gives
Substituting M0 (
In summary, it can be concluded that when sandy pebbly soils are undisturbed:
Dr=Dr0,
When the soil reaches its loosest state as a result of disturbance:
Dr=Drmin=0, D=1,
When the soil reaches its densest state as a result of disturbance:
Dr=Drmax=1, D=−1,
(1) Under the condition of positive disturbance,
In Eq. 34,
(2) Under the condition of Negative disturbance, Dr>Dr0, the following can be obtained:
for Eq. 36,
Eqs 35, 37 stand for the modified Duncan-Chang model considering the influence of the disturbance of sandy pebble soil under different compactness.
To validate the rationality and accuracy of the modified Duncan-Chang model considering the influence of disturbance, based on the test data in case Dr = 0.6, Both Eqs 35, 37 are used to predict the stress-strain curve of sandy pebble soil with different disturbance degrees at confining pressure σ3 = 100 kPa, and are compared with the Duncan-Chang model and the measured data. Moreover, the deviator stress (σ1-σ3)f is calculated by using Eq. 10, The obtained results are shown in Figure 9.
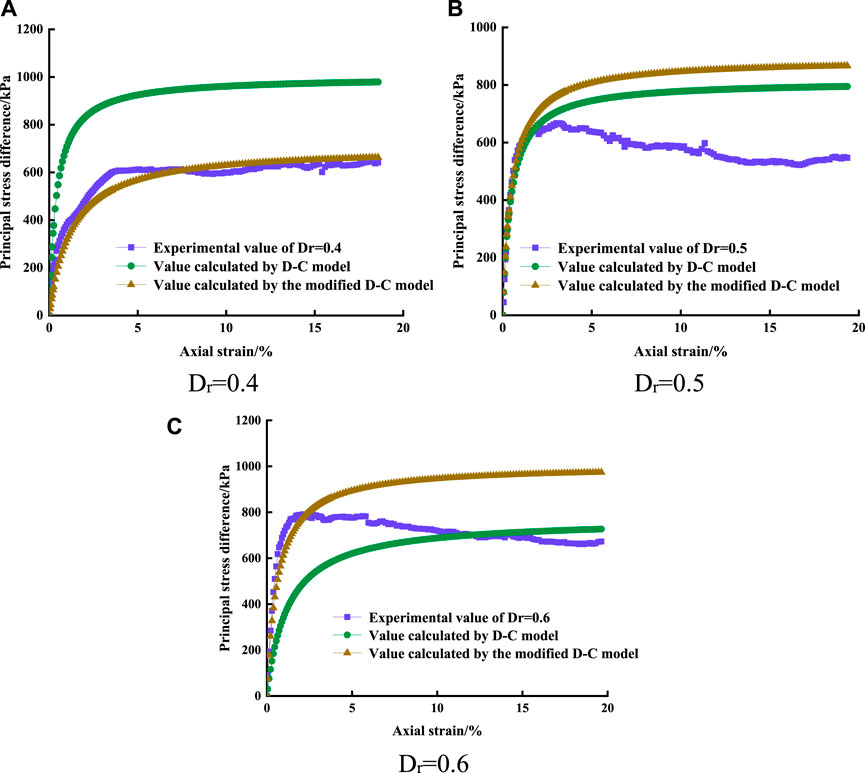
FIGURE 9. Stress-strain curve of sandy pebble soil under different disturbance states. (A) Dr = 0.4. (B) Dr = 0.5. (C) Dr = 0.6.
Upon comparing predicted and experimental results in Figure 9, it is evident that, at D = 0, the predicted values of the modified Duncan-Chang model align closely with the experimental results in the elastic phase. Predicted stress under the positive disturbance state (D>0) is notably higher, whereas under the negative disturbance state (D<0), it is significantly lower. Consequently, the Duncan-Chang model proves unsuitable for predicting the behavior of sandy pebble soil under disturbance states. Utilizing this modified Duncan-Chang model to forecast stress-strain curves under disturbance states (D>0), the predicted stress closely aligns with experimental values, akin to situations of negative disturbance (D<0) and D = 0, where predicted stress in the elastic stage and stress peak values closely match experimental data. Hence, the modified Duncan-Chang model demonstrates wider applicability.
The modified constitutive model proposed in this paper allows for the calculation of stress values of gravelly soil under various strain conditions. Analyzing experimental data from both the elastic and peak stress sections for comparative analysis of the fitting results. Table 7 presents the comparative results between initial model calculations and modified model calculations alongside experimental values. Stress calculation errors of the initial model surpass 35% when compaction densities range between 0.4 and 0.6, failing to meet engineering precision standards. Conversely, stress calculation errors of the modified model consistently range between 0% and 8%, aligning more closely with engineering application requirements. Comparative analysis with experimental data indicates that the calculations of the modified Duncan-Chang model closely align with experimental results. These findings affirm that the established modified constitutive model effectively represents the stress-strain relationship of gravelly soil under disturbance conditions.
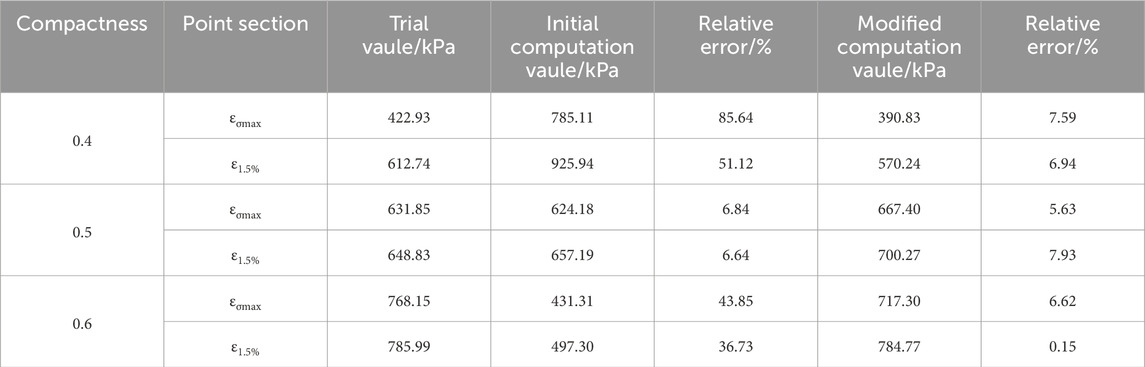
TABLE 7. Fitting results of the modified model (peak stress).
In this article, a unified disturbance degree function expression was established using the relative density of sandy gravel soil as the disturbance parameter. Subsequently, a modified Duncan-Chang model, which accounts for the effects of disturbances, was proposed. This model incorporates the influence of the gravelly soil’s physical parameter, Dr, on the characteristics of sandy gravel soil, thereby reflecting, to a certain extent, the nature of soil strength and deformation. However, the study of the modified constitutive model was limited to the elastic phase of sandy gravel soil, neglecting the evolution of the plastic and softening phases. Furthermore, while numerous physical parameters can indicate soil disturbances, and relative density (Dr) is a crucial factor, it is not the sole factor. Therefore, future research should focus on developing a disturbance theory for soils that correlates with coarse grain content, moisture content, and other physical parameters.
Through triaxial tests on sandy gravel soil and in conjunction with perturbation theory, a unified perturbation formula is derived. Utilizing relative density as the perturbation parameter, adjustments are made to the Duncan-Chang model, leading to several conclusions:
(1) During triaxial compression tests, strain softening is absent in sandy gravel soils, while their elastic modulus, tangent modulus, and peak stress show incremental increments with increasing confining pressure.
(2) As relative density increases, the internal friction angle of sandy gravel soils decreases, while cohesion exhibits an initial rise followed by a decline. A quadratic relationship is identified between the mechanical parameters of the surrounding rock of sandy gravel and relative density, showing less than 10% fluctuation through fitting.
(3) The perturbation formula D ranges between −1 and 1, encompassing the entire spectrum from the natural state to the maximum or minimum strength resulting from perturbation. This implies that the perturbation formula not only delineates the soil damage caused by perturbation but also enhances the characteristics of sandy gravel soil.
(4) Using the results from indoor tests and the perturbation function, the modified Duncan-Chang model for gravel soil was derived. Comparison of stress-strain curves between the modified model, original constitutive model, and experimental data reveals that deviations in calculated values from the initial constitutive model exceed 35%. Conversely, the stress-strain curve of the modified model closely aligns with the experimental curve, with errors within 8%.
The original contributions presented in the study are included in the article/Supplementary material, further inquiries can be directed to the corresponding author.
MH: Writing–original draft. DY: Conceptualization, Writing–review and editing. XL: Funding acquisition, Resources, Supervision, Writing–review and editing. YZ: Writing–review and editing.
The author(s) declare that no financial support was received for the research, authorship, and/or publication of this article.
Authors MH, DY, XL, and YZ were employed by Shudao Investment Group Co., Ltd.
All claims expressed in this article are solely those of the authors and do not necessarily represent those of their affiliated organizations, or those of the publisher, the editors and the reviewers. Any product that may be evaluated in this article, or claim that may be made by its manufacturer, is not guaranteed or endorsed by the publisher.
Cao, B.-L. (2003). Geomorphology and quaternary geology. Beijing: China University of Geosciences Press.
Cao, H.-L., Hua, R.-M., Ji, Y.-L., Hu, W.-X., and Zhang, S.-W. (2001). Depositional charateristics of sandstone and conglomerate reservoirs of fan delta andrelationship to reservoirs' physical properties - taking the fourth member of shahejie formation, luojia oilfield, zhanhua depression for an example. Geol. J. China Univ. 02, 222–229.
Cheng, C., Zhao, W., and Liu, B. (2017). Constitutive model of Shenyang medium-coarse sand based on disturbance theory. J. Northeast. Univ. Nat. Sci. Ed. 38 (3), 418–423.
Cui, X., and Dong, W.-X. (2018). Secondary development of a constitutive model in ABAQUS for tailings sand using generalized plasticity theory. Rock Soil Mech. 39 (02), 745–752.
Du, J., Whittle, A. J., Hu, L., Divoux, T., and Meegoda, J. N. (2021). Characterization of meso-scale mechanical properties of Longmaxi shale using grid microindentation experiments - ScienceDirect[J]. J. Rock Mech. Geotechnical Eng. 13 (3), 555–567.
Duncan, J. M., and Chang, C. Y. (1970). Nonlinear analysis of stress and strain in soils. J. Soil Mech. Found. Div. 96 (SM5), 1629–1653. doi:10.1061/jsfeaq.0001458
El Dine, , Seif, B., Dupla, J. C., Frank, R., and Kazan, Y. (2010). Mechanical characterization of matrix coarse-grained soils with a large-sized triaxial device. Can. Geotechnical J. 47 (4), 425–438. doi:10.1139/t09-113
Feda, J. (1982). Mechanics of particulate materials-the principle, development in geotechnical engineering. Amsterdam: Elsevier Scientific publishing company.
Feda, J. (2002). Notes on the effect of grain crushing on the granular soil behaviour. Eng. Geol. 63 (1), 93–98. doi:10.1016/s0013-7952(01)00072-2
Guo, H., Peng, G., Han, A., Li, T., Chen, D., and Cheng, H. (2019). Particle characteristics of muck of composite strata under different shield tunneling parameters. Tunn. Constr. 39 (11), 1848–1855.
Guo, Q.-G. (1999). Engineering characteristics and application of coarse grained soil. Beijing: The Yellow Water Conservancy press.
Hong-tan, S. (1990). On the mechanical properties of cohesionless sand cobbles and rockfill materials. Chin. J. Geotechnical Eng. 12 (6), 32–41.
Hu, M., Xu, G., and Hu, S. (2013a). Study of equivalent elastic modulus of sand gravel soil with Eshelby tensor and Mori-Tanaka equivalent method. Rock Soil Mech. 34 (5), 1437–1442.
Hu, W.-Y., Yan-lin, Q., Liu, E.-L., et al. (2013b). Study on Uniaxial Compression tests of coarse-grained soil particles crushing under high stress. Yellow River 35 (07), 108–109.
Huang, J.-B., Chen, J., and Li-qi, L. (2019). Establishment and application of modified Duncan-Chang model for disturbed coarse grained soil. Shanxi Archit. 45 (6), 46–48.
Huang, M., Jiang, Y.-J., and Wang, S.-J. (2017). Identification of the creep model and its parameters of soft rock on the basis of disturbed state concept. Chin. J. Solid Mech. 38 (6), 570–578.
Jia, P.-J., Khoshghalb, A., Chen, C., Zhao, W., Dong, M., and Alipour Esgandani, G. (2021). Modified duncan-chang constitutive model for modeling supported excavations in granular soils. Int. J. geomechanics 20, 1–13. doi:10.1061/(asce)gm.1943-5622.0001848
Li, Y., Li, B., and Steffen, B. (2006). Provenance analysis and drainage evolution in late Cenozoic Chengdu basin on eastern margin of Tibetan plateau. Acta sedimentol. sin. 24 (3), 309.
Liu, B., Chen, C., and Bo-wen, Y. (2015). Current situation and prospect the coarse grained soil its constitutive model. Shanxi Archit. 41 (26), 71–73.
Mohsen Haeri, S., Mahdi Hosseini, S., Toll, D. G., and Yasrebi, S. S. (2005). The behaviour of an artificially cemented sandy gravel. Geotechnical Geol. Eng. 23 (5), 537–560. doi:10.1007/s10706-004-5110-7
Peng, W., Wang, Q., Liu, Y., Sun, X., and Chen, Y. (2019). The influence of freeze-thaw cycles on the mechanical properties and parameters of the duncan-chang constitutive model of remolded saline soil in nong'an county, jilin province, northeastern China. Appl. sciences-basel 9 (22), 4941–4949. doi:10.3390/app9224941
Shi, Z.-M., Zhao, X.-W., and Peng, M. (2014a). Review of studies on lager scale triaxial tests of coarse-grained soils. J. Eng. Geol. 22 (05), 792–796.
Shi, X., Zhang, J., Liu, B., et al. (2014b). Test of high-speed railway coarse grained filler of improved particle size distribution. J. Central South Univ. Sci. Technol. 45 (11), 3964–3969.
Sun, W., and Yan-sheng, H. (2018). Anisotropic nonlinear elastic model of concrete and secondary development in ABAQUS. Open Civ. Eng. J. 10, 615–624. doi:10.2174/1874149501610010615
Wang, L., Xue, Y., Cao, Z., Kong, H., Han, J., and Zhang, Z. (2023). Experimental study on mode I fracture characteristics of granite after low temperature cooling with liquid nitrogen. Water 15 (19), 3442–3520. doi:10.3390/w15193442
Wang, R., Jia, B., Deng, A., and Wang, J. (2006). Dynamic triaxial testing study on dynamic characteristics of sandy pebble soil. Chin. J. Rock Mech. Eng. 25 (2), 4059–4064.
Wells, J. T., Scholz, C. A., and Soreghan, M. J. (1999). Processes of sedimentation on a lacustrine border-fault margin; interpretation of cores from Lake Malawi, East Africa. J. Sediment. Res. 69, 816–831. doi:10.2110/jsr.69.816
Xu, H., Cheng, Z.-L., Pei, T., Pan, J.-J., and Huang, B. (2015). Centrifuge model test and numerical simulation of coarse-grained soil. Rock Soil Mech. 36 (5), 1322–1327.
Xu, R., Zhang, J., and Zhu, J.-F. (2012). Modified Duncan-Chang model considering disturbance. J. Zhejiang Univ. Eng. Sci. 46 (1), 1–7.
Zhang, L.-S., Chen, Y., Liu, X., and Wei, X. (2020). A unified monotonic model for sand based on modified hyperbolic equation and state-dependent dilatancy. Comput. Geotechnics 128, 103788–104409. doi:10.1016/j.compgeo.2020.103788
Zhang, Y., Jia, B., and Wang, H.-R. (2008). Study on static characteristic of sandy pebble soil. Shanxi Archit. 34 (21), 78–79.
Zhao, G.-F., Wei, X.-D., Liu, F., and Liu, W. B. (2020). Non-parameterized numerical analysis using the distinct lattice spring model by implementing the duncan-chang model. Rock Mech. rock Eng. 53, 2365–2380. doi:10.1007/s00603-020-02047-w
Zhao, P., and Ma, W. (2022). Study on the correlation of macro-fine parameters of surrounding rock in sand and cobble tunnel based on discrete element. Mater. Res. Express 9 (9), 095502. doi:10.1088/2053-1591/ac86b7
Zheng, X., Ao, D.-H., Li, Y.-Z., Zhang, S., and Song, X.-W. (2018). A preliminary study of measurement and evaluation of geometry characteristics of coarse gravel. Rock Soil Mech. 39 (5), 1805–1810.
Keywords: disturbance of tunnelling, sandy pebble soil, denseness, perturbation modelling, Duncan-Chang model
Citation: Huang M, Yu D, Li X and Zhao Y (2024) Study on the mechanical characteristics of sand pebble surrounding rock considering the disturbance effect of tunnel excavation. Front. Earth Sci. 12:1341922. doi: 10.3389/feart.2024.1341922
Received: 21 November 2023; Accepted: 25 January 2024;
Published: 15 March 2024.
Edited by:
Manoj Khandelwal, Federation University Australia, AustraliaReviewed by:
Wanli Guo, Nanjing Hydraulic Research Institute, ChinaCopyright © 2024 Huang, Yu, Li and Zhao. This is an open-access article distributed under the terms of the Creative Commons Attribution License (CC BY). The use, distribution or reproduction in other forums is permitted, provided the original author(s) and the copyright owner(s) are credited and that the original publication in this journal is cited, in accordance with accepted academic practice. No use, distribution or reproduction is permitted which does not comply with these terms.
*Correspondence: Yinting Zhao, dGpqMTIzMDZAMTI2LmNvbQ==
Disclaimer: All claims expressed in this article are solely those of the authors and do not necessarily represent those of their affiliated organizations, or those of the publisher, the editors and the reviewers. Any product that may be evaluated in this article or claim that may be made by its manufacturer is not guaranteed or endorsed by the publisher.
Research integrity at Frontiers
Learn more about the work of our research integrity team to safeguard the quality of each article we publish.