 Yapeng Zhang1,2
 Long Liu1,3Jian Wu1,3Shaoxiang Zeng4,5Jianquan Hu6
 Yuanqin Tao4,5*Yong Huang1,3Xuetao Zhou1,3Xu Liang6
- 1Power China Huadong Engineering Corporation Limited, Hangzhou, China
- 2Zhejiang Engineering Research Center of Green Mine Technology and Intelligent Equipment, Hangzhou, China
- 3Zhejiang Huadong Engineering Construction and Management Corporation Limited, Hangzhou, China
- 4College of Civil Engineering, Zhejiang University of Technology, Hangzhou, China
- 5Engineering Research Center of Ministry of Education for Renewable Energy Infrastructure Construction Technology, Hangzhou, China
- 6Hangzhou Urban Infrastructure Construction Management Center, Hangzhou, China
Total thrust and torque are two key indicators of shield movement performance. Most existing data-driven machine learning studies focus on developing more accurate models for predicting total thrust and torque but overlook the interpretability of the models. To address this black-box issue, this study proposes an interpretable probabilistic prediction algorithm for the shield movement performance. The algorithm uses the natural gradient boosting (NGBoost) model to iteratively update the parametric probability distributions (e.g., mean and variance) and achieve probabilistic predictions of the total thrust and torque. The impact of each feature on the prediction values and uncertainty is quantified by extending the importance analysis of a single deterministic predictive value to both the mean and variance. The feature interactions are analyzed and their predictive contributions are quantified by the shapley additive explanations (SHAP) method. The transparency of the NGBoost model is improved through the visualization of the decision-making process. A shield tunneling project in Hangzhou is used to validate the effectiveness of the proposed algorithm. The results indicate that the NGboost model outperforms other five models in terms of accuracy. The prediction results are interpretable, and the interpretable probabilistic model provides decision-makers with a more intuitive and reliable reference.
1 Introduction
With the progression of urbanization and the increasing demand for underground space, shield tunneling technology has become increasingly important in modern urban infrastructure development (Zhou et al., 2023). However, poor shield movement performance (total thrust and torque) can lead to inefficient tunneling, excessive ground settlements, tunnel structural damage, and even pose serious threats to surrounding buildings and infrastructures (Chen et al., 2019). Total thrust refers to the axial force generated by the shield machine to advance forward. It is produced by hydraulic jacks, mechanical rams, or other mechanisms that push against the tunnel face. Torque is the rotational force exerted on cutting tools to break and loosen the soil or rock. Appropriate monitoring, adjustment, and optimization of total thrust and torque are essential for maximizing productivity and reducing risks in shield tunneling projects.
Due to the rapid advancements in big data and computational capabilities, machine learning has received increasing attention in the field of geotechnical engineering (Moayedi et al., 2020; Zhang et al., 2021; Baghbani et al., 2022; Kannangara et al., 2022; Tao et al., 2022a; Tao et al., 2022b; Zhang et al., 2022a; Phoon and Zhang, 2023). Machine learning is a powerful tool that can extract nonlinear relationships among features, leading to a better understanding and prediction of geotechnical behaviors. In tunnel constructions, machine learning models have been successfully applied to predict the total thrust and torque (Lin et al., 2022a; Li et al., 2023a; Li et al., 2023b; Yu et al., 2023). For example, Gao et al. (2019) employed three recurrent neural network (RNN) models, including basic RNN, long short-term memory (LSTM), and gated recurrent unit (GRU), to predict the total thrust and torque of the shield machine. These models were selected for their inherent ability to process time-series data, effectively capturing dynamic characteristics over time. However, manual parameter tuning of these models is complex and prone to getting stuck in local optima. Based on this, Lin et al. (2022b) developed a hybrid model combining particle swarm optimization (PSO) and GRU for torque predictions. PSO is a population-based optimization algorithm that simulates the foraging behavior of flocks of birds to select the best hyperparameters automatically. Elbaz et al. (2023) applied reinforcement learning to optimize the process of PSO hyperparameter tuning, which further improved the accuracy of torque and total thrust predictions. It has been found in practice that, although adding additional optimization layers (such as using reinforcement learning to optimize PSO parameters) can enhance prediction accuracy, the process is complex and time-consuming, and the accuracy improvements are not so significant in most cases. From the perspective of feature engineering, Shi et al. (2021) used the variational mode decomposition and the empirical wavelet transform to preprocess the raw dataset, which can also improve the prediction accuracy of shield tunneling parameters. The studies above focus on developing innovative algorithms to improve the model accuracy for total thrust and torque, but to some extent overlook the interpretability of the model. Due to the black-box nature of machine learning models, especially deep learning models like LSTM that involve multiple parameters and layers, the prediction results and decision-making processes are difficult to explain. This lack of transparency results in decision-makers having insufficient confidence and a skeptical attitude toward applying these models. Xu et al. (2021) compared the performance of various machine learning models for predicting the total thrust and torque, demonstrating that random forest, a tree-based model, offered the best balance between model accuracy and computation time while also being more interpretable compared to other models. Given its performance and greater transparency relative to complex models like LSTM, tree-based models like random forests provide a viable option for interpretable total thrust and torque predictions.
A series of interpretable methods, such as shapley additive explanations (SHAP) (Lundberg and Lee, 2017) and causal artificial intelligence methods (Kuang et al., 2020; Wang et al., 2023), have been proposed to make complex machine learning models more transparent and understandable (Zhou et al., 2021; Iban, 2022; Wen et al., 2023; Das et al., 2024). For example, Iban and Bilgilioglu (2023) employed the local explainable artificial intelligence method of SHAP to attain the contribution of each factor to the avalanches. Based on SHAP values, the most critical factors triggering avalanches were identified. Scavuzzo et al. (2022) used SHAP with extreme gradient boosting (XGBoost) for geospatial health prediction, aiming to understand the impact of each input feature on the predicted outcomes. Similarly, Parsa et al. (2020) used XGBoost to predict real-time traffic accidents and employed SHAP to analyze the factors leading to risk. Although SHAP has been successfully applied in various fields, its effectiveness in providing interpretability for thrust and torque predictions remains unclear. While SHAP can explain how features affect predictions, it still lacks transparency in clarifying the decision-making process. Moreover, it is commonly acknowledged that there is inevitable uncertainty in geotechnical engineering (Phoon and Kulhawy, 1999; Gu et al., 2023; Tao et al., 2023; Tao, et al., 2024). However, the existing studies on shield tunneling often overlook such uncertainty, which may result in potential safety risks of the project.
This paper thoroughly compares and analyzes multiple machine learning models used in current shield tunneling prediction research, summarizing the findings as follows: First, although time series models like LSTM can effectively utilize lagged time series information to predict shield movement performance, tuning their parameters is notably complex and time-consuming. Second, the multi-layered and opaque structure of LSTM models complicates the interpretation of their decision-making processes, adversely affecting model transparency and explainability. Moreover, while the SHAP method is a mature interpretability technique that has proven effective in other domains, its effectiveness for predicting total thrust and torque in shield tunneling applications has not yet been validated. Crucially, SHAP struggles to assess the importance of variance, which limits its utility in conducting uncertainty analysis for risk assessments. To address these limitations, this paper proposes an interpretable probabilistic prediction algorithm for predicting the movement performance of shield machines (i.e., total thrust and torque). By constructing a natural gradient boosting (NGBoost) probabilistic prediction model, the approach not only provides predictions for total thrust and torque but also offers prediction uncertainty. This is essential for comprehensive risk assessment, as improper loads can lead to equipment failures, ground collapse, or tunnel instability. Unlike standard tree model importance analyses, which typically evaluate only the mean predictions, this study extends the importance analysis to include both the mean and variance of the model. This allows for a more comprehensive understanding of how each feature impacts the overall prediction outcomes and associated uncertainties. The model can quantitatively assess how geological conditions and shield tunneling parameters specifically affect predictions of total thrust and torque. The interactions between features are analyzed, and their contributions to the predictions are quantified using the SHAP method. The predictive mechanism of the model is explained from both global and local perspectives, enhancing the transparency and explainability of decision-making. Furthermore, the transparency of the model is further enhanced by visualizing the decision path. This visualization not only helps operators better understand how the model predicts total thrust and torque but can also show how the model responds to varying geological conditions, thus optimizing decision-making and preventing potential risks.
2 Methodology
This section is composed of three main parts: first, the principle of the NGBoost model is introduced to provide a theoretical basis for the subsequent model interpretability analysis; second, the interpretability of model predictions is explored; finally, an overview of the proposed interpretable probabilistic algorithm is given.
2.1 Principle of the NGBoost model
Natural gradient boosting (NGBoost) (Duan et al., 2020) is an advanced model designed for probabilistic forecasting. Figure 1 shows the structure of the NGBoost model. Unlike gradient boosting and XGBoost methods (Friedman, 2001; Chen and Guestrin, 2016) that focus on point predictions, NGBoost emphasizes the entire probability distribution, making it possible to estimate prediction uncertainty. In addition, an iterative method is employed to improve model predictions based on the errors in the previous steps. This approach consists of several key steps:
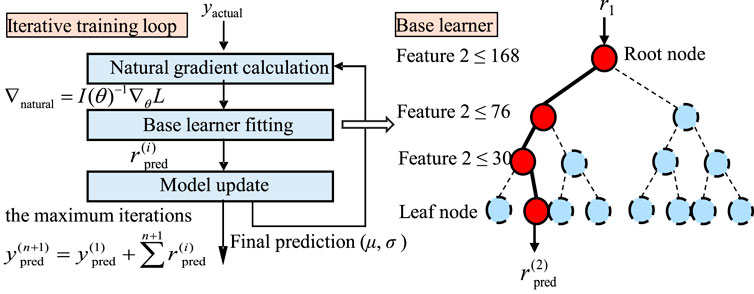
Figure 1. Structure of the NGBoost model.
The natural gradient (Amari, 1998) is computed firstly. In a standard gradient descent, the geometric structure of the parameter space is not considered, resulting in potential instability and inefficiency during optimization. By considering the local curvature, the natural gradient can alleviate these problems. Specifically, the Fisher information matrix measures the local curvature of the parameter space. It shows how changes in pairs of parameters affect the output distribution of the model. For a parameterized distribution model, the Fisher information matrix is defined in Eq. (1):
where θ represents the parameter of the model; I(θ) represents the Fisher information matrix; E denotes the expectation, which is an average of all possible outcomes; ∇θ is the gradient; log p (y | θ) is the log-likelihood of the outcome y given the parameter θ. The natural gradient ∇natural is then computed by using the Fisher information matrix to correct the standard gradient, as shown in Eq. (2):
where L is the loss function, and I(θ)−1 represents the inverse of the Fisher information matrix I(θ). The natural gradient gives a direction to the model optimization so that the prediction errors are minimized more efficiently. This adjustment ensures that parameter updates are in line with the geometry of the parameter space, leading to faster convergence rates and improved robustness.
After calculating the natural gradient, the model residuals can then be determined, which represent the prediction errors in the current iteration. Specifically, yactual represents the actual measurement, and
Once the predicted residual
2.2 Interpretability methods for NGBoost model
Most existing machine learning models are seen as black boxes, with unclear principles and decision processes (Guidotti et al., 2018). To address this issue, this study interprets the model from two main perspectives: global interpretability and local interpretability. For local interpretability, the decision tree-based NGBoost model can visualize the decision-making process to track and explain how an individual prediction is made through the branches of the trees. In addition, the SHAP method (Lundberg and Lee, 2017) is employed to explain the interactions between multiple features and their contributions to the target individual prediction. SHAP utilizes the principles of Shapley values from cooperative game theory to quantify the importance of each feature within the NGBoost model. Within cooperative game theory, Shapley values offer a way to fairly share game rewards, ensuring participants receive compensation in line with their overall contribution to the total gain. When applied in machine learning, SHAP assesses how much each feature contributes to the model prediction, specifically how each feature impacts the final prediction result. Through this process, SHAP uncovers the importance and function of each feature within the internal decision-making mechanism of the model, significantly improving model transparency.
For a given feature xj, its Shapley value is computed as shown in Eq. (3):
where N denotes a set of all features; S is a subset excluding xj; n is the total number of features in the set N; |S| is the size (number of elements) of the subset S; ϕj represents the Shapley value of feature; N\{j} means the set of all features except xj; and
For global interpretability, SHAP summary plots are used to help understand the overall trends and patterns in model predictions by assessing the average contribution of features across all data points, revealing which features have the greatest impact on the model prediction. In addition, the decision tree-based NGBoost model can also show the global importance analysis of each feature on the target prediction, including the mean and the standard deviation of the prediction, aiming to provide a global analysis method based on the model itself for assessing prediction accuracy and uncertainty. The importance of each feature is evaluated using Eq. (4):
where FI(xj) denotes the importance of feature xj; I(i) is an indicator function, which is equal to one if the node i splits and 0 otherwise;
2.3 Flowchart of the interpretable probabilistic prediction algorithm
The proposed algorithm for shield movement performance has five main steps: data acquisition, data preprocessing, model construction, model evaluation, and model interpretability, as shown in Figure 2. For the tunnel boring excavation, data are acquired from the installed sensors on the shield machine equipment. Typical parameters include the total thrust, torque, advance rate, etc. These data are sequentially stored in a secured database, either locally or in the cloud. In the data preprocessing step, the downtime data and outliers are first removed. The reserved dataset is then divided into a training set and a test set at a ratio of 8:2. In the model construction step, the NGBoost model is constructed using a decision tree as a base learner. Decision trees are chosen because they are highly interpretable (Quinlan, 1986). The model undergoes an iterative training loop that consists of natural gradient calculation for optimization, fitting of base learners, and adaptive model updating. Specifically, the NGBoost model uses the natural gradient descent to adjust the model parameters. The base decision tree fits the residuals from the previous iteration and serves as the current base learner. A natural gradient is then computed from the loss function MSE (mean squared error) and model parameters, guiding an adaptive parameter update. This process is repeated until a predefined maximum iteration number is met. Next, the trained NGBoost model can provide probabilistic prediction results due to its inherent capability to estimate the distribution of the target variable. Optimal hyperparameters and the superior model are determined through comparative analysis. Finally, based on the prediction results, the importance and influence of each feature on the target variable are analyzed. By visualizing the decision-making process, the transparency of the model can be improved.
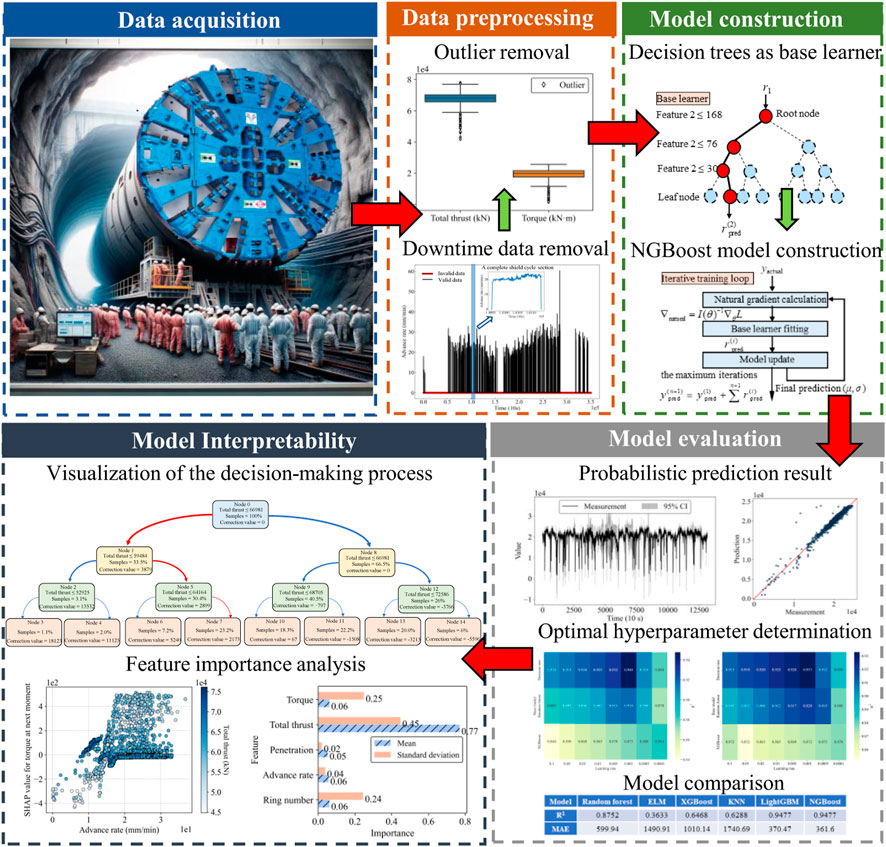
Figure 2. Flowchart of shield movement performance predictions.
3 Case study
3.1 Data acquisition
A shield tunneling project in Hangzhou is used to illustrate the proposed method. The dataset has real-time tunneling information from 100 rings, all gathered by the monitoring system. Specifically, this tunneling dataset is collected from seven subsystems: the propulsion system, cylinder stroke system, mud and water silo pressure system, air cushion silo pressure system, cutter system, grouting system, and shield attitude system, totaling 50 tunneling parameters. Among these parameters, the total thrust and torque directly reflect the shield movement performance. The values of total thrust and torque at the next moment are chosen as the output for the prediction model (Ntoutsi et al., 2020). Advance rate is the distance that the shield machine tunnels within a unit of time. Penetration is an important indicator for assessing the propulsive capacity of a shield machine. A higher penetration means the shield can traverse hard geological conditions more easily. Ring number is usually used to label segments of the tunnel, and it is an indicator of construction progress. The aforementioned three parameters (advance rate, penetration, and ring number) are closely related to the shield movement performance. Therefore, they are selected as input parameters for the predictive model. In addition, as this task is a time-series prediction, the future states are influenced by the past states. Therefore, the torque and total thrust at the current moment are also selected as the input parameters for the model. The monitoring system automatically logs data every 10 s, resulting in approximately 350,000 data samples.
3.2 Data preprocessing
Data preprocessing is crucial to ensure data quality and model accuracy (Liu et al., 2019; Zhang et al., 2022b). The data preprocessing in this study includes removing the downtime data and the outliers.
In practical engineering projects, there is a significant amount of downtime data for shield machines due to cutterhead replacement, electrical circuit inspections, lubrication system maintenance, and so on. Figure 3 shows the change in advance rate during the shield tunneling process. A complete shield tunneling operational cycle, as illustrated in the upper subfigure, consists of a rising phase, a stable phase, and a declining phase. When the advance rate = 0, it indicates that the shield machine has stopped tunneling. In this case, the downtime data cannot provide practical value for predicting the shield movement performance, therefore, they are removed, and 66,224 data samples are then reserved.
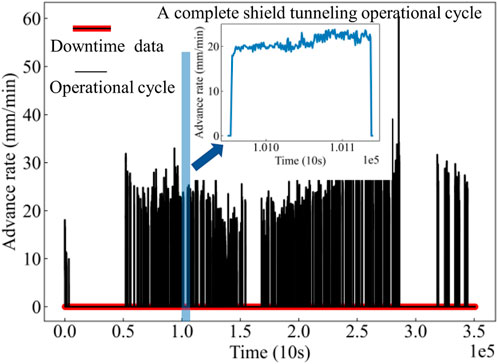
Figure 3. Advance rate during the shield tunneling process.
The raw dataset may include outliers caused by factors such as sensor errors or human operational mistakes, which could negatively affect the training of the model. To solve this problem, this paper firstly divides the 66,224 samples into a training set and a test set at a ratio of 8:2. Boxplot analysis has been proved as an effective method for identifying and addressing outliers in shield tunneling, as shown in Hou et al. (2022), Ma et al. (2024), and Chen et al. (2024). Given its proven efficacy, this technique is utilized to discern and remove outliers from the training set. Specifically, the boxplot analysis is used to identify and eliminate the outliers in the training set to improve the data quality. Figure 4 illustrates the outlier removal for the total thrust and torque. In the boxplot, the central horizontal line rep-resents the median, while the bottom and top of the box denote the first and third quartiles, respectively. The upper and lower edges of the boxplot represent the maxi-mum and minimum values of the data. The scattered points represent the outliers. There are 1782 outliers for total thrust and 1,508 outliers for torque in the training set. To improve data quality, records including these outliers are removed (Qin et al., 2023).
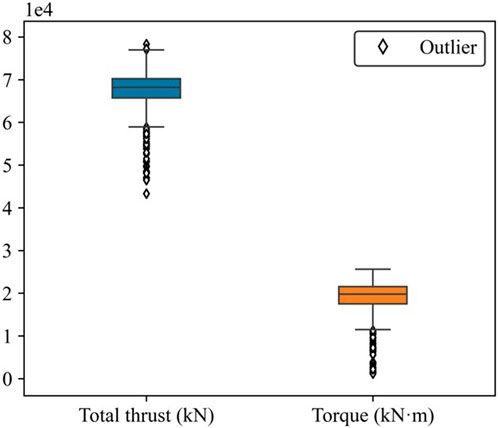
Figure 4. Outliers for the total thrust and torque (training set).
3.3 Model construction
Based on the preprocessed dataset, a shield movement performance prediction model is developed. The hyperparameters of the NGBoost model are determined through random search, and the last 20% of the training set is used as a validation set for model evaluation. The optimal hyperparameters are summarized in Table 1. The “n_estimators” parameter is set to 300 iterations. The normal distribution is selected as the target distribution for the NGBoost model. This is because when the number of independent random variables is large enough, their sum tends to approximate a normal distribution. In regression problems, the target variable can be considered as the sum of multiple factors (Devore, 2011). To determine the learning rate and the base learner combination, a systematic comparison of model performance is then conducted. Mean absolute error (MAE), R-squared (R2), and Root mean square error (RMSE) shown in Eqs 5–7 are used as the evaluation metrics.
where n represents the number of measurements, yi is the actual value for the ith measurement.
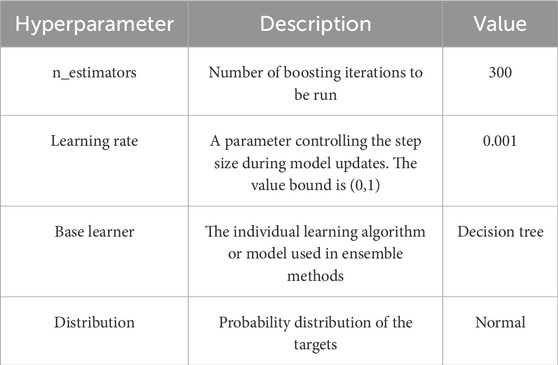
Table 1. Optimal hyperparameter settings for the NGBoost model.
The selection of base learner and learning rate has significant impact on the model performance. Figure 5 shows the model performance for the total thrust and torque. The decision tree is a simple and effective model for making decisions based on previous data, and random forest is an ensemble method that aggregates multiple decision trees. The two models both show steady performances across different learning rates. Extreme gradient boosting (XGBoost) improves predictions by adding weak learners iteratively, but it does not perform well in this case. Specifically, for the total thrust shown in Figure 5A, the decision tree with a learning rate of 0.001 achieves the highest R2 value of 0.948. In contrast, XGBoost with a learning rate of 0.1 results in the lowest R2 of 0.840. For the torque shown in Figure 5B, the decision tree with a learning rate of 0.001 leads to the best R2 value of 0.933. In contrast, XGBoost with a learning rate of 0.05 has the lowest R2 of 0.852. Therefore, the base learner is selected as the decision tree, with a learning rate of 0.001.
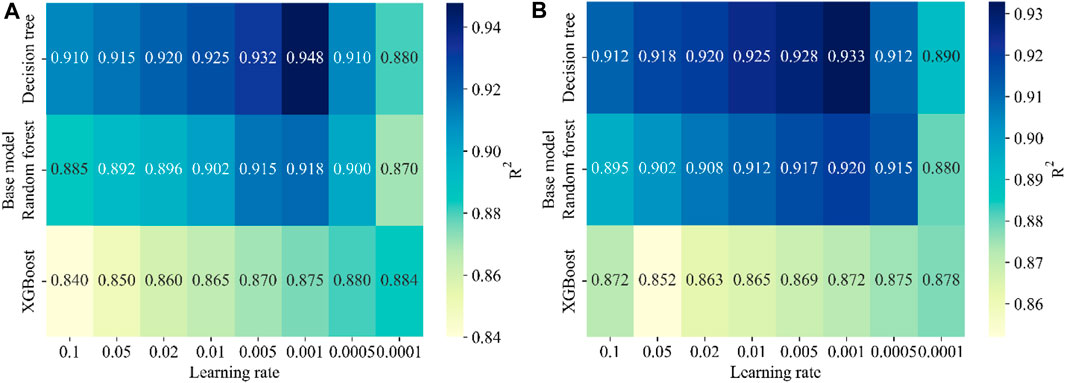
Figure 5. Model performance using various learning rates and base learner combinations for (A) Total thrust; and (B) Torque.
3.4 Model evaluation
Probabilistic prediction is helpful for risk management and decision-making as it provides decision makers with a prediction interval besides a single prediction value. Figure 6 displays the prediction results of the NGBoost model. The 95% confidence interval (CI) is plotted, which means that it includes the actual dataset parameter in about 95 out of 100 cases when sampled repeatedly. Overall, the measurements predominantly reside within the 95% confidence interval. This indicates that the model has a high level of predictive accuracy. Specifically, between the 3000th and 7500th sample points, the CI is considerably wider, which indicates a larger prediction uncertainty in this region. According to the geological survey report, this region is transitioning from a uniform layer to an upper-soft and lower-hard composite stratum, leading to heightened prediction challenges. In this complex geological situation, it is particularly important to control the operational parameters of the shield machine with greater precision and caution. In practice, the shield control system can automatically adjust the advance rate and rotation speed of the shield machine based on the confidence interval to adapt to the current geological conditions. When the model provides significant uncertainty in complex strata, such as the area between the 3000th and 7500th sample points, the system may suggest reducing the advance rate and increasing torque to ensure that the cutting head can effectively break through hard strata without causing mechanical overload.
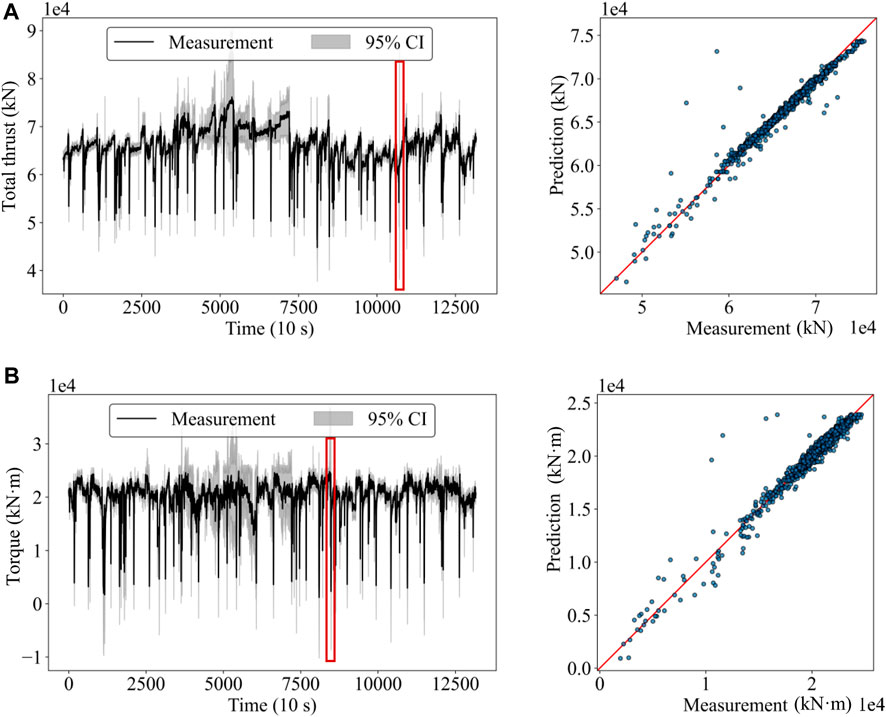
Figure 6. Probabilistic prediction results of the NGBoost model for (A) total thrust and (B) torque.
In addition, the width of the confidence interval is also suddenly increased at the area marked by the red box, where no anomalies are identified by the geological survey. The possible reason is that the geological survey report is not detailed enough to reflect the local variations in strata. The scatter plot shows the comparison between the model predictions and the actual monitored values. Most of the points are densely clustered around the diagonal line. This indicates that the model can predict the total thrust force and torque accurately. However, Figure 6 also displays several noticeable outliers, where the model overestimates the monitored values. Specifically, these outliers mainly appear during the descending phase of the shield tunneling operational cycle. The appearance of outliers during the descending phase can be attributed to various factors, such as geological shifts, equipment malfunctions, or regular inspections of the shield machine. These factors introduce significant randomness to abrupt changes, which makes the prediction more challenging.
The performance of the NGBoost model is compared to five other machine learning models. The hyperparameter settings for the five models are determined through random search, as detailed in Table 2. Three popular decision-tree-based models are used for comparison, specifically, random forest consists of a collection of decision trees. Each tree is trained on a random subset of the data and gives its own prediction. The random forest model then averages these results to produce a final outcome. Extreme gradient boosting (XGBoost) is a decision tree-based ensemble model that uses a gradient boosting framework. It iteratively adds new trees and corrects errors made by previously trained trees. Light gradient boosting machine (LightGBM) also follows the gradient boosting framework. Instead of simply growing trees level by level, it prioritizes splitting the most optimal leaf nodes. In addition, to further demonstrate the effectiveness of the established NGBoost model, two commonly used machine learning models for the shield tunneling problem, namely extreme learning machine (ELM) and K-nearest neighbors (KNN), are also included for comparison. ELM is a feedforward neural network with a single layer of hidden nodes, where the weights are randomly assigned and do not require iterative tuning. KNN considers the “k” nearest data points to estimate the value of a data point based on the average of neighbors. Table 3 summarizes the performance of all the models for predicting the total thrust. The LightGBM and NGBoost models show superior accuracy, with an R2 value of 0.9477. The ELM model has the worst performance, with an R2 of 0.3633. In terms of MAE, NGBoost has the lowest MAE of 361.60 kN, which is less than 1% of the total thrust during the stable phase, indicating that the average deviation of its predictions from the measurements is small. Table 4 shows the model performance for predicting the torque. The NGBoost model performs the best with an R2 value of 0.9329 and an MAE of 432.22 kN m. For both torque and total thrust, the NGBoost model performs best in term of the R2, MAE, and RMSE. The predictive accuracy of the LightGBM model is close to that of the NGBoost. However, the NGBoost model can provide probabilistic predictions for the shield movement performance. Based on these probabilistic results, decision-makers can better understand the uncertainty of predictions and make more reasonable adjustments accordingly.
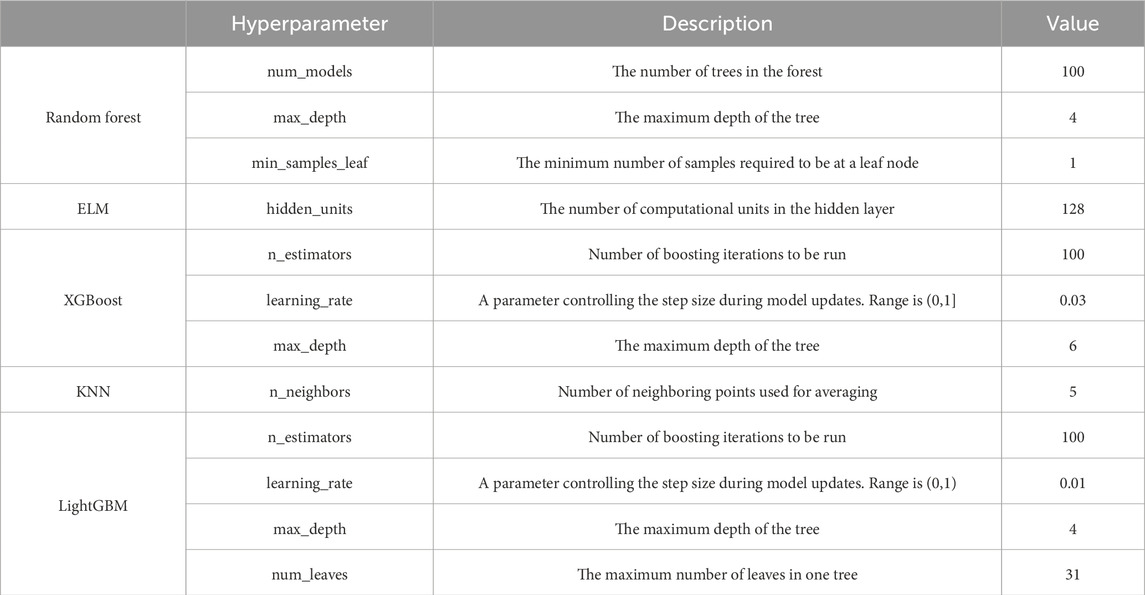
Table 2. Hyperparameter settings of the five machine learning models.
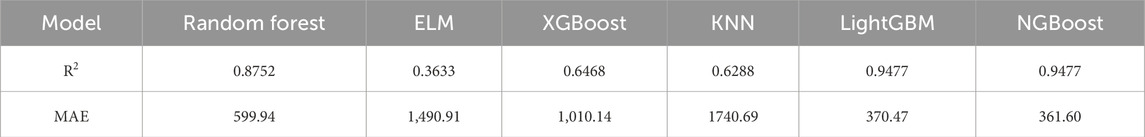
Table 3. Performance of different machine learning models for predicting the total thrust.
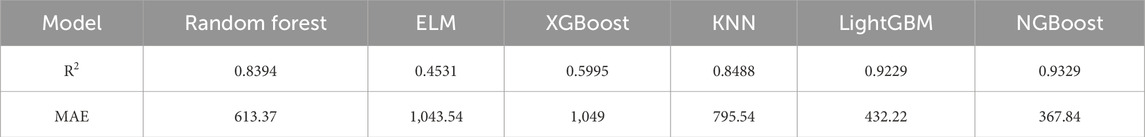
Table 4. Performance of different machine learning models for predicting the torque.
3.5 Model interpretability
Sections 3.4, 3.5 show the accuracy of the decision tree-based NGBoost model. In practical engineering applications, an interpretable model is preferable because it improves transparency and acceptance of the model. The paper visualizes the decision pathways of NGBoost and utilizes the SHAP technique to explore the influence of different features on the prediction of shield movement performance.
Each decision tree path can translate into clear rules to improve model interpretability and transparency of its decisions. This study combines this highly interpretable feature with the NGBoost model to explain the decision path changes during each iteration of NGBoost. Figure 7 shows the decision path of the 1st and 300th iterations in the NGBoost model for predicting the total thrust. Node 0 is the root node of the decision tree; “Samples” denotes the number of samples under the path; and “Correction value” denotes an adjustment to the model prediction. The decision path directs samples from the root node to the leaf nodes based on their feature values and node rules. Samples go left if they meet the rule; otherwise, they go right. For example, during the 300th iteration as shown in Figure 7B, given the input conditions of penetration = 16 mm/r, advance rate = 25 mm/min, and total thrust = 5,000 kN, the path proceeds left to Node 1 as the penetration 16 mm/r ≤ 17 mm/r meets the condition at Node 0. At Node 1, since the advance rate 25 mm/min ≤28 mm/min is met, the path continues left to Node 2. However, failing to meet the condition of advance rate ≤12 mm/min at Node two (i.e., 25 ≥ 12), it finally reaches Node 4 with a correction value of −1.7 kN. Note that the correction from the 300th iteration is just one example. The actual prediction is based on the cumulative sum of the corrections from 300 iterations.
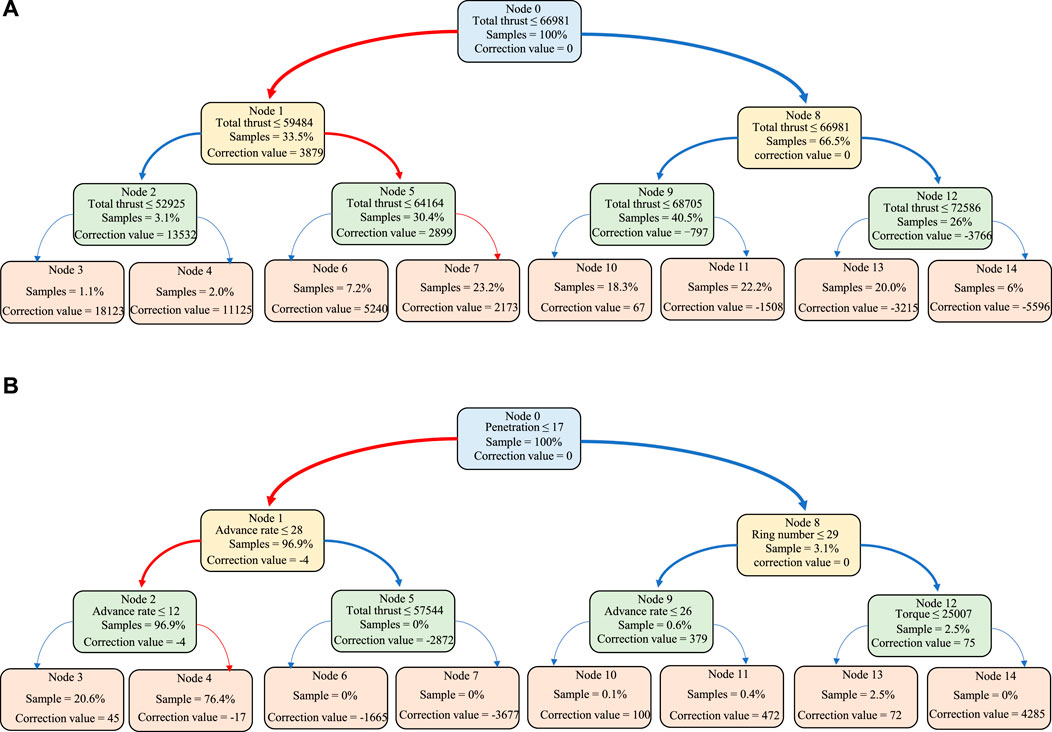
Figure 7. Decision path of the NGBoost model for predicting the total thrust at the next moment: (A) first iteration; (B) 300th iteration.
In the first iteration of the NGBoost model, only the feature “total thrust” is used as the criterion for decision-making. This indicates that in this task of predicting the total thrust, the total thrust of the current moment is the most crucial feature for forecasting the total thrust of the next moment. The large correction values in the first iteration indicate that the model initially tends to make a wide range of parameter adjustments to move quickly towards the target value. In contrast, in the 300th iteration of NGBoost, more features are used for parameter tuning. The corrections are small and are mainly used to fine-tune the model. These results indicate that in the 300th iteration, the model has gradually stabilized and attempts to reduce the prediction error using as many features as possible.
The importance of input features for total thrust and torque at the next moment is shown in Figure 8. Overall, “total thrust” and “torque” show the highest levels of importance when predicting their respective future values, and the value of importance is significantly higher than all other input features. The torque and total thrust significantly affect the standard deviation of their respective predicted outcomes (see Figures 8A, B). This is because the torque mainly overcomes the friction between the cutter and the soil, and the total thrust pushes the shield machine forward. Excessive thrust with insufficient torque may cause the cutting tools to slip or jam, while insufficient thrust can lead to slow progress or machine stalling. Therefore, an increase in one parameter leads to a higher demand for the other, resulting in increased uncertainty in the predictive results. The ring number in shield tunneling significantly affects the standard deviation of the predicted values for total thrust and torque. The possible reason might be the variation in geological layers traversed by shield machine at different ring numbers, which also leads to increased predictive uncertainty.
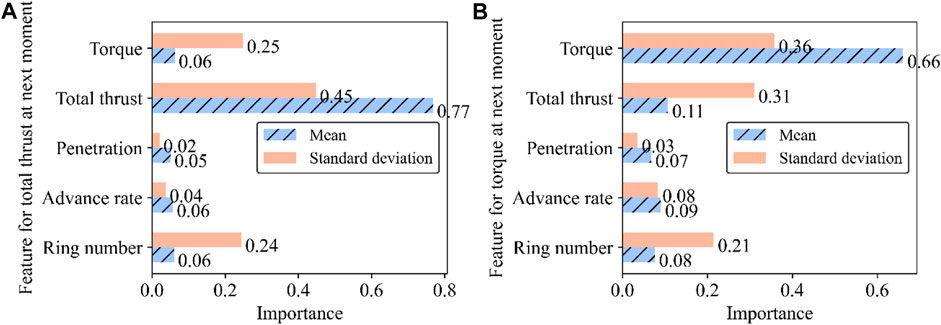
Figure 8. Importance of input features for predicting the (A) total thrust and (B) torque.
A SHAP summary plot shown in Figure 9 is used to illustrate how the different features of shield tunneling affect model predictions. The SHAP values on the horizontal axis show how much each feature contributes to the prediction, and the features are listed on the vertical axis in order of their importance, from most to least. The color indicates the magnitude of the feature values, with blue colors for lower values and green colors for higher values. Overall, the two subfigures show distinct orders of impact for different prediction targets. For the total thrust at the next moment, the order of impact is total thrust > penetration > ring number > advance rate > torque. For the torque at the next moment, the order of impact is torque > penetration > ring number > advance rate > total thrust. Specifically, Figure 9A explains that the total thrust at the next moment is mostly influenced by its previous value, highlighting the significance of past conditions on future predictions. Other factors like penetration rate, advance rate, and torque have a more minor effect, and they usually reduce the total thrust at the next moment. Although the impact of the ring number is similarly small, higher ring numbers tend to reduce the total thrust for the next ring more significantly. Figure 9B discusses the torque required at the next moment and shows that, except for a significant impact of torque, all other features have minor impacts and no apparent trends.
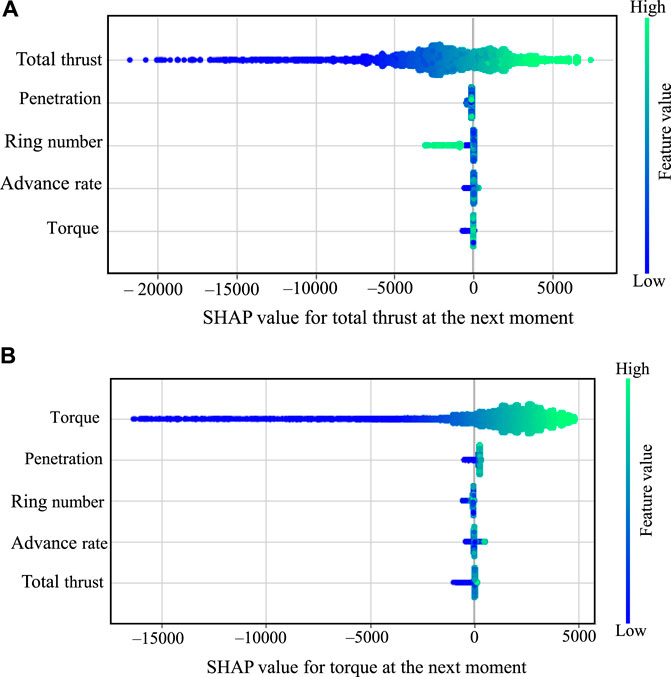
Figure 9. SHAP summary plot of (A) total thrust and (B) torque.
Shield tunneling is a highly intricate process involving multiple variables and complex interactions. The contribution of a single feature to the tunneling performance is not isolated but depends on the other features. Partial dependence plots for double features are employed to examine the influence of these feature on the predictive accuracy, which illustrate how two features interact to affect the predictions of the NGBoost model. The SHAP value quantifies the contribution of each feature to the predictions made by the NGBoost model. The larger the value, the greater the contribution. The horizonal axis represents the value of the most important feature, and the vertical axis represents the SHAP values contributed by the main feature. The color intensity of each point represents the value of the second important feature, with darker colors indicating larger values. Figure 10A shows the interplay between the advance rate and the total thrust and how they affect the torque at the next moment. When the advance rate ranges from 0 mm/min to 1.3 mm/min, it makes a negative contribution to the predicted value of torque at the next moment. The negative contribution increases as the advance rate is gradually decreased. This phenomenon indicates that the shield machine faces less resistance at a lower advance rate, leading to a lower torque. When the range of the advance rate is between 1.3 mm/min and 3.2 mm/min, a total thrust of 70,000 kN to 75,000 kN causes no increase in the torque. Similarly, Figure 10B shows the interplay between the penetration and the torque and how they affect the torque at the next moment. When the value of penetration is less than 1 mm/r, it results in a negative contribution. However, when it exceeds 1 mm/r, the contribution becomes positive, peaking at around a SHAP value of 3. Figure 10C shows that as the total thrust increases, its negative contribution to the torque at the next moment decreases to about 0. This means that the total thrust can be adjusted to reduce the torque, but not to increase the torque. Figure 10D demonstrates that the SHAP values remain unchanged with the changes in the ring number. The ring number has little effect on the subsequent torque. Based on these interpretable results, the proposed algorithm can adjust various tunneling parameters more precisely, thereby significantly enhancing shield movement performance. The partial dependence plots and SHAP value analysis provide a scientific basis for this predictive adjustment. For example, these analyses reveal that the relationship between increasing the advance rate, torque and the total thrust at the next moment is not simply linear but exhibits complex non-linear dynamics, with significant boosts in some ranges and reductions in others. This not only helps maintain the shield machine in optimal working condition but also effectively minimizes downtime caused by inappropriate adjustments, thereby improving the overall construction efficiency and safety of the project.
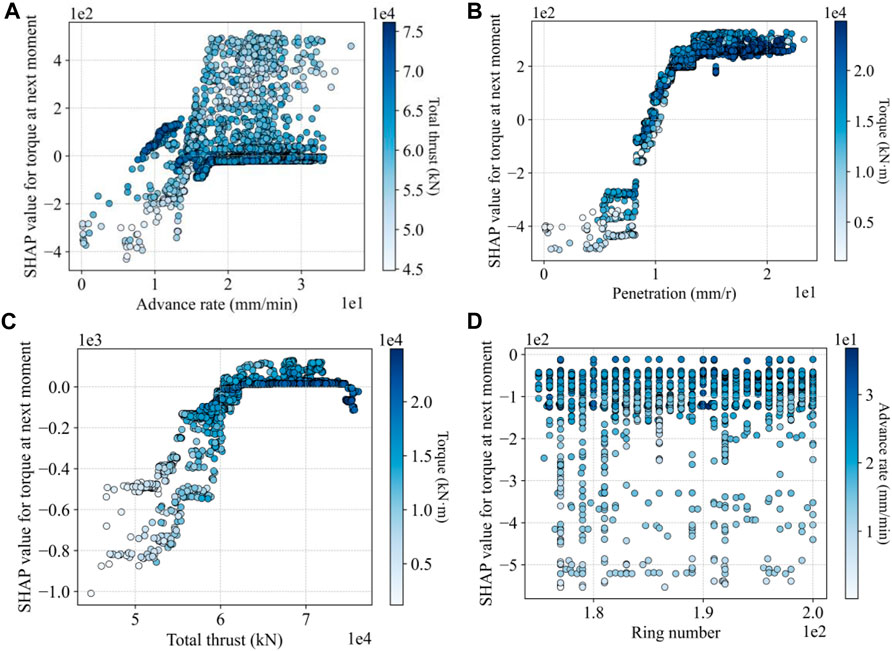
Figure 10. Interaction of two features on the next-moment torque: (A) advance rate vs. total thrust; (B) penetration vs. torque; (C) total thrust vs. torque; and (D) ring number vs. advance rate.
Figure 11 shows the partial dependence plots for the total thrust at the next moment. Overall, the trends observed in Figure 11 are similar to those for the next-moment torque shown in Figure 10. Specifically, Figure 11C demonstrates that as the penetration increases to about 1.7 mm/r, its negative impact on the next-moment thrust decreases to 0. As the penetration increases further, its impact suddenly changes, dropping to about −0.7 mm/r and continuing to decline to −3 mm/r. This pattern of change is different from that for the next-moment torque shown in Figure 10C. In Figure 10C, as the penetration increases, the negative impact on the torque changes from negative to positive, eventually increasing to about +2 mm/r. This difference may be due to a change in the penetration mechanism from cutting to squeezing upon reaching a certain penetration. After the transition, the shield tunneling needs to overcome greater resistance, thus negatively impacting the total thrust.
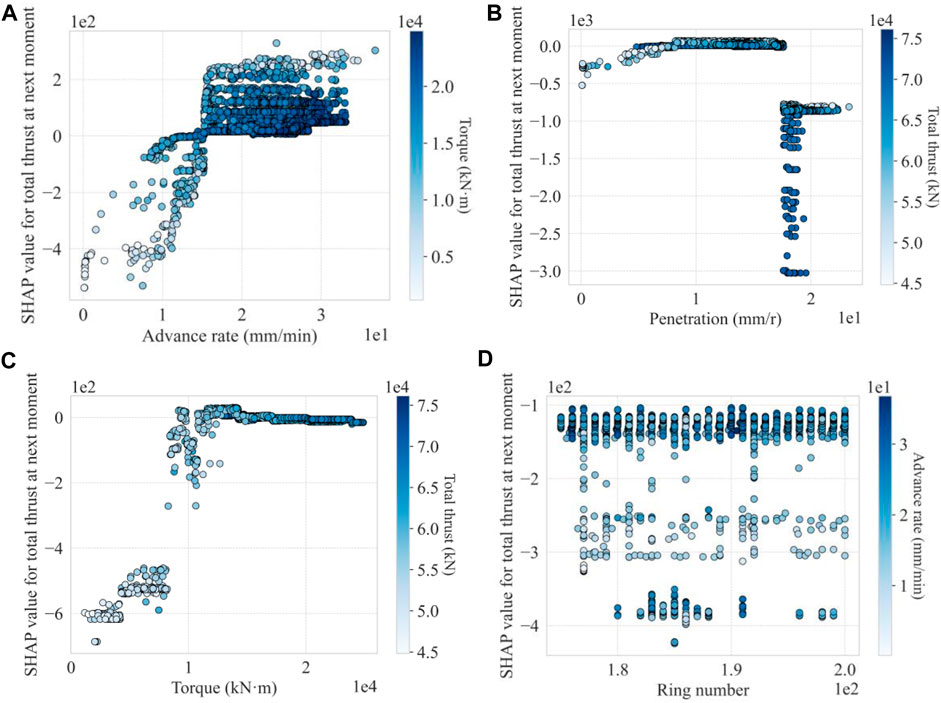
Figure 11. Interaction of two features on the next-moment total thrust: (A) advance rate vs. torque; (B) penetration vs. total thrust; (C) torque vs. total thrust; and (D) ring number vs. advance rate.
4 Conclusion
In this study, an interpretable probabilistic prediction algorithm is proposed for predicting the shield movement performance (i.e., total thrust and torque). Specifically, the natural gradient boosting (NGBoost) model is used to iteratively update the parametric probability distributions and achieve probabilistic predictions. The impact of each feature on the prediction values and uncertainty is quantified by extending the importance analysis of a single predictive value to the mean and variance. The feature interactions are analyzed and their contributions to the predictions are quantified by the SHAP method. The transparency of the NGBoost model is improved through the visualization of the decision-making process. The main conclusions are as follows.
(1) The NGBoost model can provide a probabilistic prediction of the total thrust and torque. The results show that the model produces a wider confidence interval in the complex geological conditions, guiding decision-makers to adjust the tunneling parameters with more caution.
(2) In terms of model interpretability, the total thrust and torque rank the most important features for predicting their respective future values. During the decision visualization process, the NGBoost model mainly uses the most important features for making decisions at the first iteration and makes significant corrections to the predicted outcomes. However, as the number of iterations increases, the model begins to incorporate additional features and fine-tunes the outcomes. In addition, partial dependence plots for double features show that the interaction between different features significantly affects the torque at the next moment. Based on these interpretable results, the proposed algorithm can acquire more information to help decision-making and adjust tunneling parameters more accurately, leading to improved shield movement performance.
(3) The NGBoost model outperforms the random forest, ELM, XGBoost, KNN, and LightGBM in terms of prediction accuracy. Optimal performance is achieved using the decision trees as the base learner and a learning rate of 0.001. These indicate that the NGBoost model, under these hyperparameter settings, is most suitable for predicting the torque and total thrust for the studied project.
Data availability statement
The original contributions presented in the study are included in the article/Supplementary material, further inquiries can be directed to the corresponding authors.
Author contributions
YZ: Conceptualization, Data curation, Resources, Writing–review and editing. LL: Conceptualization, Data curation, Supervision, Writing–review and editing. JW: Methodology, Writing–review and editing. SZ: Software, Writing–original draft. JH: Project administration, Writing–review and editing. YT: Funding acquisition, Validation, Visualization, Writing–review and editing. YH: Resources, Writing–review and editing. XZ: Project administration, Validation, Writing–review and editing. XL: Project administration, Funding acquisition, Writing–review and editing.
Funding
The author(s) declare financial support was received for the research, authorship, and/or publication of this article. This study is supported by the Postdoctoral Research Foundation of Zhejiang Province (Grant No. ZJ2023057) and the Construction Research Project of Zhejiang Province (2023K155).
Conflict of interest
Authors YZ, LL, JW, YH, and XZ were employed by Power China Huadong Engineering Corporation Limited. Authors LL, JW, YH, and XZ were employed by Zhejiang Huadong Engineering Construction and Management Corporation limited.
The remaining authors declare that the research was conducted in the absence of any commercial or financial relationships that could be construed as a potential conflict of interest.
Publisher’s note
All claims expressed in this article are solely those of the authors and do not necessarily represent those of their affiliated organizations, or those of the publisher, the editors and the reviewers. Any product that may be evaluated in this article, or claim that may be made by its manufacturer, is not guaranteed or endorsed by the publisher.
References
Amari, S. I. (1998). Natural gradient works efficiently in learning. Neural Comput. 10 (2), 251–276. doi:10.1162/089976698300017746
Baghbani, A., Choudhury, T., Costa, S., Costa, S., and Reiner, J. (2022). Application of artificial intelligence in geotechnical engineering: a state-of-the-art review. Earth-Science Rev. 228, 103991. doi:10.1016/j.earscirev.2022.103991
Chen, L., Tian, Z., Zhou, S., Gong, Q., and Di, H. (2024). Attitude deviation prediction of shield tunneling machine using time-aware LSTM networks. Transp. Geotech. 45, 101195. doi:10.1016/j.trgeo.2024.101195
Chen, R., Zhang, P., Wu, H., Wang, Z., and Zhong, Z. (2019). Prediction of shield tunneling-induced ground settlement using machine learning techniques. Front. Struct. Civ. Eng. 13, 1363–1378. doi:10.1007/s11709-019-0561-3
Chen, T., and Guestrin, C. (2016). “Xgboost: a scalable tree boosting system,” in Proceedings of the 22nd ACM SIGKDD international conference on knowledge discovery and data mining, San Francisco, CA, August 13–17, 2016, 785–794.
Das, P., Kashem, A., Hasan, I., and Islam, M. (2024). A comparative study of machine learning models for construction costs prediction with natural gradient boosting algorithm and SHAP analysis. Asian J. Civ. Eng. 25, 3301–3316. doi:10.1007/s42107-023-00980-z
Devore, J. (2011). Probability and statistics for engineering and the sciences. Boston, MA: Cengage Learning.
Duan, T., Anand, A., Ding, D. Y., Thai, K. K., Basu, S., Ng, A., et al. (2020). “Ngboost: natural gradient boosting for probabilistic prediction,” in Proceedings of the international conference on machine learning, (Vienna: The International Machine Learning Society), 2690–2700.
Elbaz, K., Zhou, A., and Shen, S. L. (2023). Deep reinforcement learning approach to optimize the driving performance of shield tunnelling machines. Tunn. Undergr. Space Technol. 136, 105104. doi:10.1016/j.tust.2023.105104
Friedman, J. H. (2001). Greedy function approximation: a gradient boosting machine. Ann. Statistics 29, 1189–1232. doi:10.1214/aos/1013203451
Gao, X., Shi, M., Song, X., Zhang, C., and Zhang, H. (2019). Recurrent neural networks for real-time prediction of TBM operating parameters. Automation Constr. 98, 225–235. doi:10.1016/j.autcon.2018.11.013
Gu, X., Wang, L., Ou, Q., Zhang, W. G., and Sun, G. H. (2023). Reliability assessment of rainfall-induced slope stability using Chebyshev-Galerkin-KL expansion and Bayesian approach. Can. Geotechnical J. 60, 1909–1922. doi:10.1139/cgj-2022-0671
Guidotti, R., Monreale, A., Ruggieri, S., Turini, F., Giannotti, F., and Pedreschi, D. (2018). A survey of methods for explaining black box models. ACM Comput. Surv. (CSUR) 51 (5), 1–42. doi:10.1145/3236009
Hou, S., Liu, Y., and Yang, Q. (2022). Real-time prediction of rock mass classification based on TBM operation big data and stacking technique of ensemble learning. J. Rock Mech. Geotechnical Eng. 14 (1), 123–143. doi:10.1016/j.jrmge.2021.05.004
Iban, M. C. (2022). An explainable model for the mass appraisal of residences: the application of tree-based Machine Learning algorithms and interpretation of value determinants. Habitat Int. 128, 102660. doi:10.1016/j.habitatint.2022.102660
Iban, M. C., and Bilgilioglu, S. S. (2023). Snow avalanche susceptibility mapping using novel tree-based machine learning algorithms (XGBoost, NGBoost, and LightGBM) with eXplainable Artificial Intelligence (XAI) approach. Stochastic Environmental Research and Risk Assessment. Stoch. Environ. Res. Risk Assess. 37 (6), 2243–2270. doi:10.1007/s00477-023-02392-6
Kannangara, K. K. P. M., Zhou, W., Ding, Z., Hong, Z., and Hong, Z. (2022). Investigation of feature contribution to shield tunneling-induced settlement using Shapley additive explanations method. J. Rock Mech. Geotechnical Eng. 14 (4), 1052–1063. doi:10.1016/j.jrmge.2022.01.002
Kuang, K., Li, L., Geng, Z., Xu, L., Zhang, K., Liao, B., et al. (2020). Causal inference. Causal Inference. Eng. 6, 253–263. doi:10.1016/j.eng.2019.08.016
Li, J. B., Chen, Z. Y., Li, X., Jing, L. J., Zhang, Y. P., Xiao, H. H., et al. (2023a). Feedback on a shared big dataset for intelligent TBM Part I: feature extraction and machine learning methods. Undergr. Space 11, 1–25. doi:10.1016/j.undsp.2023.01.001
Li, J. B., Chen, Z. Y., Li, X., Jing, L. J., Zhang, Y. P., Xiao, H. H., et al. (2023b). Feedback on a shared big dataset for intelligent TBM, part II: application and forward look. Undergr. Space 11, 26–45. doi:10.1016/j.undsp.2023.01.002
Lin, S. S., Shen, S. L., and Zhou, A. (2022a). Real-time analysis and prediction of shield cutterhead torque using optimized gated recurrent unit neural network. J. Rock Mech. Geotechnical Eng. 14 (4), 1232–1240. doi:10.1016/j.jrmge.2022.06.006
Lin, S. S., Zhang, N., Zhou, A., Shen, S. L., and Shen, S. L. (2022b). Time-series prediction of shield movement performance during tunneling based on hybrid model. Tunn. Undergr. Space Technol. 119, 104245. doi:10.1016/j.tust.2021.104245
Liu, B., Wang, R., Guan, Z., Li, J., Xu, Z., Guo, X., et al. (2019). Improved support vector regression models for predicting rock mass parameters using tunnel boring machine driving data. Tunn. Undergr. Space Technol. 91, 102958. doi:10.1016/j.tust.2019.04.014
Lundberg, S. M., and Lee, S.-I. (2017). A unified approach to interpreting model predictions. Adv. Neural Inf. Process. Syst. 30, 4765–4774.
Ma, J., Ma, C., Li, T., Yan, W., Faradonbeh, R. S., Long, H., et al. (2024). Real-time classification model for tunnel surrounding rocks based on high-resolution neural network and structure–optimizer hyperparameter optimization. Comput. Geotechnics 168, 106155. doi:10.1016/j.compgeo.2024.106155
Moayedi, H., Mosallanezhad, M., Rashid, A. S. A., Jusoh, W. A. W., and Muazu, M. (2020). A systematic review and meta-analysis of artificial neural network application in geotechnical engineering: theory and applications. Neural Comput. Appl. 32, 495–518. doi:10.1007/s00521-019-04109-9
Ntoutsi, E., Fafalios, P., Gadiraju, U., Iosifidis, V., Nejdl, W., Vidal, M., et al. (2020). Bias in data-driven artificial intelligence systems—an introductory survey. WIREs Data Min. Knowl. Discov. 10, 3. doi:10.1002/widm.1356
Parsa, A. B., Movahedi, A., Taghipour, H., Derrible, S., and Mohammadian, A. K. (2020). Toward safer highways, application of XGBoost and SHAP for real-time accident detection and feature analysis. Accid. Analysis Prev. 136, 105405. doi:10.1016/j.aap.2019.105405
Phoon, K. K., and Kulhawy, F. H. (1999). Characterization of geotechnical variability. Can. Geotechnical J. 36 (4), 612–624. doi:10.1139/cgj-36-4-612
Phoon, K. K., and Zhang, W. (2023). Future of machine learning in geotechnics. Georisk Assess. Manag. Risk Eng. Syst. Geohazards 17 (1), 7–22. doi:10.1080/17499518.2022.2087884
Qin, C., Wu, R., Huang, G., Tao, J., and Liu, C. (2023). A novel LSTM-autoencoder and enhanced transformer-based detection method for shield machine cutterhead clogging. Sci. China Technol. Sci. 66 (2), 512–527. doi:10.1007/s11431-022-2218-9
Scavuzzo, C. M., Scavuzzo, J. M., Campero, M. N., Anegagrie, M., Aramendia, A. A., Benito, A., et al. (2022). Feature importance: opening a soil-transmitted helminth machine learning model via SHAP. Infect. Dis. Model 7 (1), 262–276. doi:10.1016/j.idm.2022.01.004
Shi, G., Qin, C., Tao, J., Liu, C., and Liu, C. (2021). A VMD-EWT-LSTM-based multi-step prediction approach for shield tunneling machine cutterhead torque. Knowl. Based Syst. 228, 107213. doi:10.1016/j.knosys.2021.107213
Tao, Y., He, W., Sun, H., Cai, Y., and Cai, Y. (2022a). Multi-objective optimization-based prediction of excavation-induced tunnel displacement. Undergr. Space 7 (5), 735–747. doi:10.1016/j.undsp.2021.12.005
Tao, Y., Sun, H., Cai, Y., and Cai, Y. (2022b). Predictions of deep excavation responses considering model uncertainty: integrating BiLSTM neural networks with Bayesian updating. Int. J. Geomechanics 22 (1), 04021250. doi:10.1061/(asce)gm.1943-5622.0002245
Tao, Y., Phoon, K. K., Sun, H., and Cai, Y. (2023). Hierarchical Bayesian model for predicting small-strain stiffness of sand. Can. Geotechnical J. 61, 668–683. online. doi:10.1139/cgj-2022-0598
Tao, Y., Phoon, K. K., Sun, H., and Ching, J. (2024). Variance reduction function for a potential inclined slip line in a spatially variable soil. Struct. Saf. 106, 102395. doi:10.1016/j.strusafe.2023.102395
Wang, K., Zhang, L., Fu, X., and Fu, X. (2023). Time series prediction of tunnel boring machine (TBM) performance during excavation using causal explainable artificial intelligence (CX-AI). Automation Constr. 147, 104730. doi:10.1016/j.autcon.2022.104730
Wen, S., Lin, N., Huang, S., Wang, Z., and Zhang, Z. (2023). Lithium battery health state assessment based on vehicle-to-grid (V2G) real-world data and natural gradient boosting model. Energy 284, 129246. doi:10.1016/j.energy.2023.129246
Xu, C., Liu, X., Wang, E., Wang, S., and Wang, S. (2021). Prediction of tunnel boring machine operating parameters using various machine learning algorithms. Tunn. Undergr. Space Technol. 109, 103699. doi:10.1016/j.tust.2020.103699
Yu, H., Qin, C., Tao, J., Liu, C., and Liu, Q. (2023). A multi-channel decoupled deep neural network for tunnel boring machine torque and thrust prediction. Tunn. Undergr. Space Technol. 133, 104949. doi:10.1016/j.tust.2022.104949
Zhang, W., Li, H., Li, Y., Liu, H., Chen, Y., and Ding, X. (2021). Application of deep learning algorithms in geotechnical engineering: a short critical review. Artif. Intell. Rev. 54, 5633–5673. doi:10.1007/s10462-021-09967-1
Zhang, P., Yin, Z. Y., Jin, Y. F., and Jin, Y. F. (2022a). Machine learning-based modelling of soil properties for geotechnical design: review, tool development and comparison. Archives Comput. Methods Eng. 29, 1229–1245. doi:10.1007/s11831-021-09615-5
Zhang, Y., Safdar, M., Xie, J., Li, J., Sage, M., and Zhao, Y. F. (2022b). A systematic review on data of additive manufacturing for machine learning applications: the data quality, type, preprocessing, and management. J. Intelligent Manuf. 34, 3305–3340. doi:10.1007/s10845-022-02017-9
Zhou, C., Gao, Y., Chen, E. J., Ding, L., and Qin, W. (2023). Deep learning technologies for shield tunneling: challenges and opportunities. Automation Constr. 154, 104982. doi:10.1016/j.autcon.2023.104982
Keywords: shield movement performance, probabilistic prediction, model interpretability, NGBoost, shap
Citation: Zhang Y, Liu L, Wu J, Zeng S, Hu J, Tao Y, Huang Y, Zhou X and Liang X (2024) An interpretable probabilistic prediction algorithm for shield movement performance. Front. Earth Sci. 12:1340437. doi: 10.3389/feart.2024.1340437
Received: 01 December 2023; Accepted: 03 June 2024;
Published: 01 July 2024.
Edited by:
Manoj Khandelwal, Federation University Australia, AustraliaReviewed by:
Muzaffer Can Iban, Mersin University, TürkiyeHossein Moayedi, Southern Illinois University Edwardsville, United States
Copyright © 2024 Zhang, Liu, Wu, Zeng, Hu, Tao, Huang, Zhou and Liang. This is an open-access article distributed under the terms of the Creative Commons Attribution License (CC BY). The use, distribution or reproduction in other forums is permitted, provided the original author(s) and the copyright owner(s) are credited and that the original publication in this journal is cited, in accordance with accepted academic practice. No use, distribution or reproduction is permitted which does not comply with these terms.
*Correspondence: Yuanqin Tao, dGFveXVhbnFpbkB6anUuZWR1LmNu