
94% of researchers rate our articles as excellent or good
Learn more about the work of our research integrity team to safeguard the quality of each article we publish.
Find out more
ORIGINAL RESEARCH article
Front. Earth Sci., 07 February 2024
Sec. Biogeoscience
Volume 12 - 2024 | https://doi.org/10.3389/feart.2024.1340399
This article is part of the Research TopicNatural Methane Emissions in a Changing Arctic - Implications for Climate and EnvironmentView all 16 articles
 Gabrielle E. Kleber1,2,3*
 Leonard Magerl3
 Alexandra V. Turchyn1
 Kelly Redeker4
 Stefan Thiele5
 Martin Liira6,7
 Koit Herodes8
 Lise Øvreås5
 Andrew Hodson2,9
Glacial groundwater can mobilize deep-seated methane from beneath glaciers and permafrost in the Arctic, leading to atmospheric emissions of this greenhouse gas. We present a temporal, hydro-chemical dataset of methane-rich groundwater collected during two melt seasons from a high Arctic glacial forefield to explore the seasonal dynamics of methane emissions. We use methane and ion concentrations and the isotopic composition of water and methane to investigate the sources of groundwater and the origin of the methane that the groundwater transports to the surface. Our results suggest two sources of groundwater, one shallow and one deep, which mix, and moderate methane dynamics. During summer, deep methane-rich groundwater is diluted by shallow oxygenated groundwater, leading to some microbial methane oxidation prior to its emergence at the surface. Characterization of the microbial compositions in the groundwater shows that microbial activity is an important seasonal methane sink along this flow-path. In the groundwater pool studied, we found that potential methane emissions were reduced by an average of 29% (±14%) throughout the summer due to microbial oxidation. During winter, deep groundwater remains active while many shallow systems shut down due to freezing, reducing subsurface methane oxidation, and potentially permitting larger methane emissions. Our results suggest that ratios of the different groundwater sources will change in the future as aquifer capacities and recharge volumes increase in a warming climate.
Groundwater systems within glaciated catchments play a significant role in proglacial hydrology, often modulating the timing and magnitude of bulk runoff (Andermann et al., 2012; Liljedahl et al., 2017; Ó Dochartaigh et al., 2019), and controlling winter baseflow (Chesnokova et al., 2020a). A complex hydrological system contributes to groundwater aquifers in periglacial environments, which can be recharged by subglacial meltwater, snow melt, buried ice formations, moraine lakes, summer precipitation and hillslope groundwater (Chesnokova et al., 2020b; Hodson et al., 2023).
In the high Arctic, the presence of permafrost and buried glacier ice in the proglacial environment dramatically limits the hydraulic conductivity of moraine and talus (Williams and Smith, 1989). Near-surface groundwater flow in permafrost regions can be seasonal and dependent on the thawing of the active layer during summer (Cooper et al., 2011). Alternatively, perennial, intra-permafrost groundwater flow requires the maintenance of a zone of unfrozen ground that penetrates the permafrost, known as a talik. In this case, the talik is maintained by the constant, year-round flow of water, which transfers sufficient advective heat to prevent freeze-back during winter (Hodson et al., 2023).
Winter baseflows, which are related to hydrologic systems that are active year-round, are increasing in response to climactic changes in glacierized (Walvoord and Striegl, 2007; Liljedahl et al., 2017; Chesnokova et al., 2020a) and non-glacierized (Lammers et al., 2001; Smith et al., 2007; St. Jacques and Sauchyn, 2009; Danilovich et al., 2019; Makarieva et al., 2019) catchments across the Arctic and subarctic. Larger groundwater storage capacities and increased summer recharge of deeper groundwater aquifers are responsible for this increased discharge during the freezing season (Liljedahl et al., 2017). The capacity of aquifer storage is increasing as a result of the deepening of the permafrost active layer and taliks with increased summer temperatures and longer melt seasons (Liljedahl et al., 2017). Larger inputs of water sources such as precipitation, permafrost thaw and glacier melt collectively contribute to increased groundwater recharge (Liljedahl et al., 2017).
At high latitudes, cold conditions mean that the thermal regime of valley glaciers is primarily polythermal (i.e., only a small portion of basal ice is at the pressure-melting point) or cold-based (i.e., the ice is completely frozen to the glacier bed) (Hodgkins, 1997). In addition, the thinning of previously polythermal glaciers due to a warming climate is leading to an increased proportion of cold-based glaciers in the high Arctic (Hambrey et al., 2005; Lovell et al., 2015). The predominance of cold ice suggests that groundwater recharge due to subglacial melt and hydraulic connectivity is limited in the subglacial environment. However, large icings, which are stratified layers of ice formed by the freezing of continuous outflows of groundwater during winter (Carey, 1973), are commonly observed in proglacial plains of the high Arctic. These icings provide evidence for year-round groundwater systems that are active in both polythermal and cold-based catchments (Moorman and Michel, 2000; Hodgkins et al., 2004; Bukowska-Jania and Szafraniec, 2005; Pollard, 2005; Bælum and Benn, 2011; Mallinson et al., 2019; Chesnokova et al., 2020b; Kleber et al., 2023). Hydrological observations suggest that taliks formed beneath glaciers can extend beyond the glacial margin, providing a conduit for the groundwater flow (Moorman, 2003). The source of this groundwater, however, is less understood, particularly in high Arctic glaciers where subglacial meltwaters can be limited.
A recent study identified over 100 groundwater springs present in the forefields of glaciers across central Svalbard in the Norwegian high Arctic (Kleber et al., 2023). The study found that each of these springs was super-saturated with methane and, consequently, a source of this greenhouse gas to the Arctic atmosphere. The methane concentrations were correlated with the local geology, with higher concentrations occurring more frequently in regions with outcrops of Jurassic and Triassic shale. Our current study aims to investigate the primary sources of this methane-rich groundwater to gain a better understanding of the origin of the methane and the chemical and biological reactions that occur along the groundwater flowpaths.
Over a spring and summer season, we collect a high-resolution, temporal dataset of biogeochemical parameters of the river water and groundwater from one glacial catchment in central Svalbard. We perform an in-depth analysis, or inverse deduction, of this biogeochemical data to identify the primary sources of the groundwater and its flowpaths. Furthermore, we determine the source of methane in the proglacial groundwater and consider its seasonal modifications, which ultimately govern its potential emissions. We explore the relationships between groundwater, glacial meltwater, snow melt, weather conditions and mineral weathering to unravel a complex, interconnected hydrological system that moderates methane dynamics in a high Arctic glacial catchment.
Svalbard is a Norwegian archipelago located in the Arctic Ocean between 76 and 81ºN. The majority of its landmass (57%) is covered by glacier (Nuth et al., 2013) and permafrost is continuous throughout the islands, reaching up to 500 m in thickness (Humlum et al., 2003). Our study focuses on the Vallåkrabreen catchment in central Svalbard (Figure 1). This catchment contains a ∼20 km2 valley glacier, Vallåkrabreen, that has likely been receding since the start of the 20th century—which represents the onset of significant glacial retreat on Svalbard (Svendsen and Mangerud, 1997). The thermal regime of Vallåkrabreen is presumed to be polythermal based on published thermal regimes of similarly sized glaciers on Svalbard (Macheret et al., 2019).
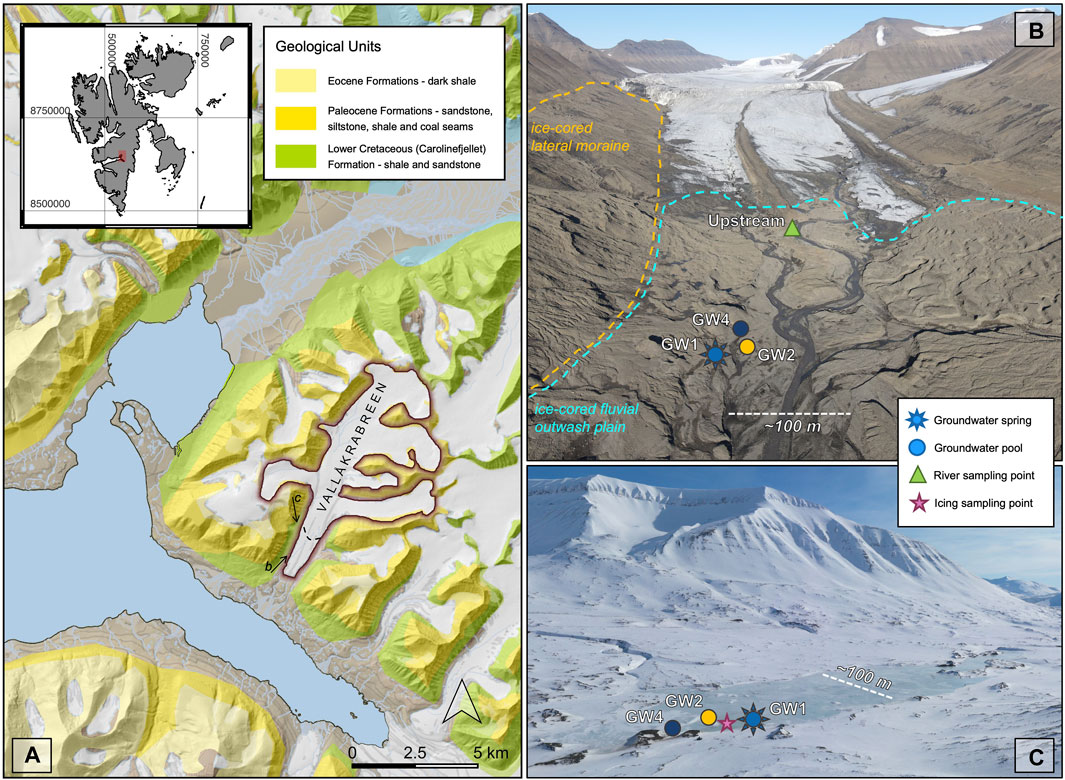
FIGURE 1. Overview of the Vallåkrabreen catchment: (A) geological map of the study region with inset map of Svalbard, arrows mark the approximate locations and angles that drone images in b and c were taken (base map provided by the Norwegian Polar Institute and created with data from 2011—dotted line represents 2021 glacier margin, maps displayed in WGS84 UTM Zone 33 coordinates (EPSG:25833)); (B) overview of summertime sampling locations (photograph taken in summer 2022); (C) image of the winter icing with summer and springtime sampling locations marked (photo credit: Erik Schytt Mannerfelt, taken in spring 2022).
The forefield of Vallåkrabreen is ∼3.5 km long, from the glacier terminus to the fjord, and 1 km across, flanked by mountains with ∼750 m elevation on either side. Aerial images of the region taken by the Norwegian Polar Institute in 1936 show that Vallåkrabreen terminated in the fjord at the time, and thus the forefield has been exposed within the last 85 years. The moraine is largely ice-cored and dominated by a glaciofluvial outwash plain and till plain with buried ice. The forefield is dotted with many small ponds and has little-to-no vegetation. During the winter and spring, a large icing forms in the proglacial plain and extends with some discontinuities along the river plain to the fjord. During summer, groundwater springs form pools and small streams throughout the proglacial plain, with bubbling often observed.
The geology of central Svalbard is dominated by the Central Palaeogene Basin, a 3,000–4,000 m thick succession of sandstone, siltstone and shale that accumulated during the Paleocene and Eocene. Vallåkrabreen sits primarily within the Carolinefjellet geological formation, a shale-dominated formation which is composed of Lower Cretaceous successions of fine-to medium-grained sandstones and shales deposited in pro-delta to distal marine conditions (Dallmann, 2015). The members of the Carolinefjellet formation are dominated by silicate minerals with quartz and feldspars (plagioclase and alkali) making up 74%–100% of the grain composition (Maher et al., 2004). Other silicate minerals such as micas (muscovite, biotite, glauconite), chlorite and, to a lesser degree, andalusite and hornblende are present throughout the members (Maher et al., 2004). Micrite beds and coquina horizons bearing carbonate minerals such as siderite, calcite and glendonite are found in the upper part of the formation, as well as large “cannon ball” carbonate concretions (Maher et al., 2004). Pyrite is present throughout the shale as well as within a distinctive horizon of iron ooids found in the lower part of the formation (Mutrux et al., 2008).
During the summer of 2021, we focused primarily on sampling a groundwater spring called ‘GW2’ which formed a small (∼7 x 2 m) pool in the forefield of Vallåkrabreen, about 250 m from the glacier terminus. Water samples were collected from the pool every 2–5 days between 03 July (day of year, DOY = 184) and 24 September (DOY = 267), alongside in situ measurements of electrical conductivity (EC) and dissolved oxygen (DO) taken with a Hach HQ40d meter and electrodes. Less frequent sampling and in situ measurements of two other groundwater springs were also undertaken: GW1 (n = 6), a spring that flowed from an ice-cored hummock in the moraine and GW4 (n = 2), a spring that formed a larger (∼6 x 8 m) pool nearby. Water was also collected and in situ measurements taken every 2–5 days from the main melt river at an upstream location, as close to the glacier terminus as possible. The sampling location was approximately 50 m downstream of the confluence of the main subglacial river and a supraglacial river. It was assumed that the much larger size of the subglacial river meant that the degree of mixing between these two sources would have minimal impacts on sample chemistry, although discrete discharge measurements of each river were not taken.
During the summer of 2022, more frequent sampling of the GW1 spring was completed to gain a more comprehensive understanding of the dynamics of the spring throughout the melt season, which was not fully captured by the irregular sampling in 2021. Water samples and in situ measurements of the GW1 spring were taken every 3–9 days between 12 July (DOY = 193) and 18 September 2022 (DOY = 261).
Springtime sampling of the Vallåkrabreen groundwaters also occurred three times throughout April and May 2021, while the winter icing still covered the proglacial floodplain. Samples were collected by drilling into the icing with a 7 cm diameter auger until pressurized water was released. The springtime sampling location was close to the locations of the GW1 spring and GW2 pool. Six water samples were also collected during summer for profiling the microbial community composition with specific emphasis on known methanogenic and methanotrophic microorganisms within the GW1, GW2 and GW4 groundwaters. Springtime and summer sampling locations are marked on Figure 1.
The following method was used for samples collected in both spring and summer. Water samples for the analyses of the oxygen and hydrogen isotopic composition of water, the carbon isotopic composition of dissolved inorganic carbon (DIC), alkalinity and anion concentrations (SO42- and Cl−) were pressed through a 0.45 μm Whatman cellulose acetate syringe filter. The filtrate was collected in a 50 mL falcon tube with no headspace. Samples for the analyses of cation concentrations (Ca2+, K+, Mg2+, Na+, Si) were also filtered and 10 mL filtrate was collected in 15 mL falcon tubes that were pre-acidified with 0.1 mL 69% nitric acid. Unfiltered samples for the analysis of methane (CH4) concentration, the stable carbon isotopic composition of methane (δ13C-CH4), and ethane (C2H6) and propane (C3H8) concentrations were sealed in 22 mL gas-tight serum vials with no headspace. Samples for the analyses of methane concentration and the isotopic composition of methane were spiked within 12 h with 1 mL of 1 M NaOH while concurrently removing 1 mL of sample to stop microbial activity. All samples were stored at ∼4°C in the dark until analysis.
The oxygen and hydrogen isotopic composition of the waters (δ2H-H2O and δ18O-H2O) were measured using a Picarro Cavity Ringdown Spectrometer. Average values of six repeat measurements are reported with reference to the international standard VSMOW. Analytical precision was better than 1.0‰ for δ2H and 0.1‰ for δ18O. Measurements of the carbon isotopic composition of DIC (δ13C-DIC) were made using a Thermo Gas Bench attached to a Delta V Mass Spectrometer. Approximately 1.5 mL of sample water was injected into a helium-flushed vial pre-acidified with four drops of orthophosphoric acid (100%) and left to react for 1 hour. The resulting CO2 in the headspace was analyzed alongside a series of standards and reference samples used to calibrate to the international standard VPDB. Analytical precision was better than 0.1‰. The above isotopic analyses were completed in the Godwin Laboratory of Paleoclimate Research at the University of Cambridge, United Kingdom.
Major anion (SO42- and Cl−) concentrations were measured by ion chromatography on a Thermo Scientific Dionex ICS5000+ at the University of Cambridge, with an error of ±2%. Alkalinity, presumed to be predominantly HCO3−, was determined with the inflection point method by titrating 1–10 mL aliquots of samples with 0.0166 M analytical grade hydrochloric acid. Major and minor cation concentrations of all 2021 water samples (Ca2+, K+, Mg2+, Na+, Si) were measured by an Agilent 5,100 Inductively-Coupled Plasma Optical Emission Spectrometer (ICP-OES) at the University of Cambridge, United Kingdom, with an error of ±10%. Major and minor cation concentrations of the 2022 GW1 samples were also determined using ICP-OES (iCAP-7400, Thermo Scientific, United Kingdom) at the University of York, United Kingdom, with an error of ±10%.
The concentration of methane was measured by the headspace method described in Kleber et al. (2023), using a gas chromatograph fitted with a flame ionization detector (GC/FID, Agilent Technologies United Kingdom Ltd.) at Queen Mary University of London, United Kingdom. Measurements have an error of ±5%. The carbon isotopic composition of methane was measured using a Picarro G2201-I cavity ringdown spectrometer at the University of Cambridge, United Kingdom in the LASER-ENVI gas isotope facility and were reported with an error of ±1‰ and with reference to the international standard VPDB.
The concentrations of ethane and propane were measured using an Agilent Technologies 7890A GC System equipped with a 30 m x 530 μm x 1.5 μm DB-5MS column (Agilent J&W GC columns) and flame ionization detector (FID) at the University of Tartu, Estonia. The carrier gas was high purity helium with a flow rate of 6 mL min−1. The oven was programmed with an initial temperature of −30°C (using liquid N2) for 1.7 min, increasing at 30°C min−1–60°C with run time 4.7 min. The inlet was set at 40°C and flow split ratio 10:1. The FID was set at 300°C. The FID hydrogen flow rate was 30 mL min−1, the air flow rate was 400 mL min−1, and nitrogen makeup gas flow rate was 25 mL min−1. Identification and quantification were done using external alkane standard gas mixtures. A 5 mL helium headspace was added to the samples and equilibrated by vigorously shaking for >10 min before 50 μL of the sample was injected manually to the GC system.
Water samples used to profile the microbial community composition were taken by pushing 250–1,000 mL of water through a sterile 0.22 μm Sterivex filter unit using a sterile 50 mL syringe. Filters were stabilized with RNAlater (Thermo Fisher) in the field and stored in the dark at 4°C until access to a −80°C freezer was available up to 2 months later.
Extractions for DNA and RNA were done using the AllPrep DNA/RNA kit (QIAGEN, Hilden, Germany) according to the manual. From the RNA, DNA was removed using the DNA-free DNA Removal kit (Invitrogen, Waltham, US) and subsequently cDNA was synthesized using the SuperScript III First-strand synthesis system (Invitrogen, Waltham, US). The DNA and cDNA was send for sequencing using primers 515F–5′- GTGYCAGCMGCCGCGGTAA-3′ and 806R–5′- GGACTACNVGGGTWTCTAAT-3’ (Apprill et al., 2015; Parada et al., 2016). The libraries were sequenced using Illumina NextSeq technology with paired-end reads of 2x250 bp length at Novogene Co., Cambridge, United Kingdom. The raw reads were deposited in the European Nucleotide Archive as project PRJEB60294.
The DADA2 pipeline was used in R to generate Amplicon sequence variants (ASVs) (Callahan et al., 2016). For this, primers were removed, the quality of the sequences checked, and trimmed according to sequence quality. The final ASVs were then generated after dereplication. Subsequently, the complementary reads were merged, chimeras were removed, and the taxonomy was assigned to the ASVs using a trained Silva database, based on the Silva release SSU Ref NR v138 (Quast et al., 2013). Thereafter, ASVs identified as mitochondria, chloroplasts, Eukaryotes, <4 sequences or <1 x 10⁻⁵% of relative abundance, as well as samples with <10.000 reads were removed. The samples are presented relative abundances with standard errors if applicable. The analyses were done using R and the “vegan”, “tidyverse”, “phyloseq”, “ggplot2”, “forcats”, “patchwork”, “scales”, and “ape” packages (Mazerolle, 2020; McMurdie and Holmes, 2013; Oksanen et al., 2022; Paradis and Schliep, 2019; Pedersen, 2022; R Core Team, 2023; Wickham et al., 2022; Wickham et al., 2019; Wickham, 2023). Using PiCRUST2 with standard parameters in bioconda, the metabolic potential of the different ASVs was inferred based on their location in a phylogenetic tree of fully sequenced organisms and the genomic assets of the closest relative in this tree (Grüning et al., 2018; Douglas et al., 2020). Enzyme commission (EC)-numbers marker genes, namely, pmoA and mmoX (methanotrophy) and mcrA (methanogenesis), were extracted and used to identify methanogens and methanotrophs. Due to the uncertainty in PiCRUST analyses, known methanotrophs and methanogens were found manually and added to the analyses.
A Hobo U30 USB Weather Station was erected in the forefield of Vallåkrabreen, approximately 900 m from the glacier front and 650 m from the groundwater station. Hourly average measurements of temperature, incident radiation, relative humidity, wind and gust speed and wind direction were taken at an elevation of ∼2 m throughout the melt season.
The geochemical composition of waters collected from the GW1 spring remained relatively constant throughout the 2021 and 2022 summers, with very little variation among the measured samples. The GW2 pool, on the other hand, showed considerable variation throughout the 2021 summer. The geochemical compositions of the GW1 and GW2 groundwaters are shown in Figure 2–5, along with the upstream melt river, and estimates of the average composition of the GW4 pool (n = 2) and the water sampled from the winter icing during April and May 2021 (n = 3).
The hydrogen and oxygen isotopic composition of the waters lie between the Global Meteoric Water Line (GMWL) and the Local Meteoric Water Line (LMWL), which is based on precipitation at Isfjord Radio, a location 85 km northwest of Vallåkrabreen (Figure 2). Throughout both summers, the GW1 spring maintained a lower hydrogen and oxygen isotopic composition between −109.7‰ and −107.3‰ for δ2H and between −15.5‰ and −15.1‰ for δ18O, consistently plotting close to the winter average (δ2H = −108.6‰, δ18O = −15.3‰). The GW2 pool varied considerably and ranged within the bounds of the winter average and the average of the GW4 pool (δ2H = −94.7‰, δ18O = −13.3‰). The upstream melt river maintained a higher hydrogen and oxygen isotopic composition, ranging between −97.9‰ and −92.6‰ for δ2H and between −13.8‰ and −13.1‰ for δ18O, consistently plotting close to the GW4 average.
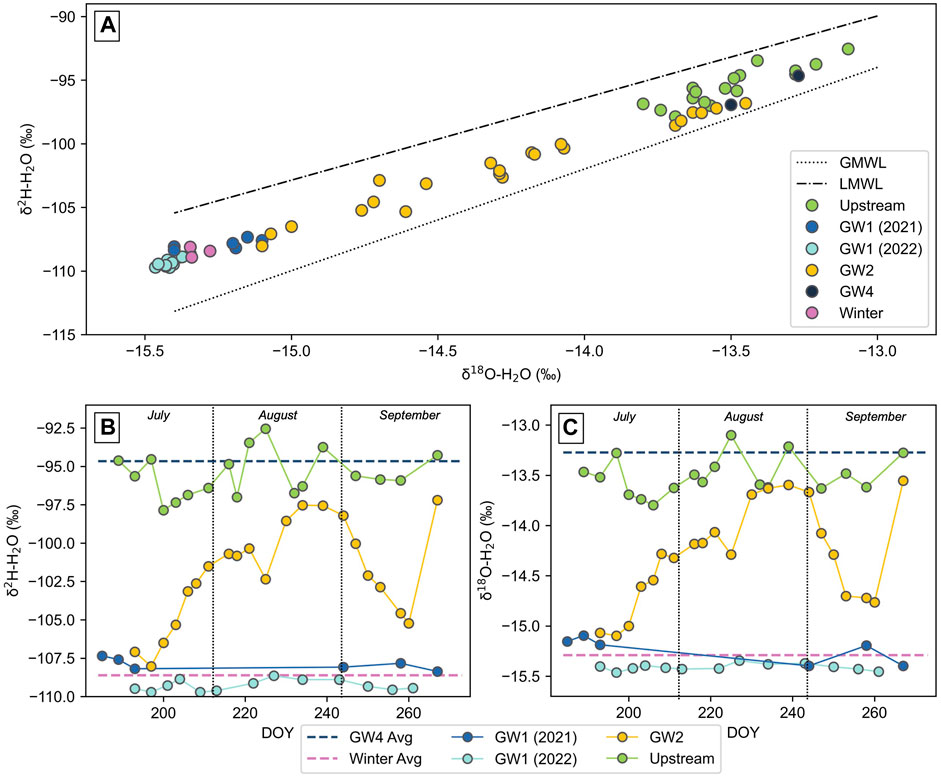
FIGURE 2. Oxygen and hydrogen isotopic composition of water collected during summer from the GW1 spring, GW2 pool, GW4 pool, the upstream melt river and the winter icing (taken during springtime): (A) plotted with the global meteoric water line (GMWL) and the local meteoric water line (LMWL, based on precipitation at Isfjord Radio), Svalbard and (B), (C) plotted temporally across the summer. DOY represents the day number of the year.
The electrical conductivity (EC) of the GW1 spring was stable throughout both summers, ranging from 450 to 493 μS cm−1, which was close to the winter average of 489 μS cm−1 (Figure 3). The EC of the GW2 pool was higher and more variable, fluctuating between 436 and 643 μS cm−1. The GW4 pool average was 574 μS cm−1. The EC of the upstream melt river was much lower than the groundwaters, staying below 100 μS cm−1 for most of the summer but rising up to a maximum of 133 μS cm−1 towards the end of the summer. The dissolved oxygen (DO) of the GW1 spring was consistently low at the beginning of the 2021 summer and throughout the 2022 summer (between 0.65 and 1.28 ppm) but rose to higher levels at the end of the 2021 summer with a maximum of 4.05 ppm (Figure 3). The winter average had even lower DO levels, at 0.28 ppm. The DO of the GW2 pool fluctuated throughout the summer between 0.52 and 9.20 ppm and the GW4 pool average was 6.13 ppm. The DO of the upstream melt river was high (between 12.4 and 15.4 ppm), often exceeding the atmospheric equilibrium concentration in freshwater at 0°C, which is 14.6 ppm.
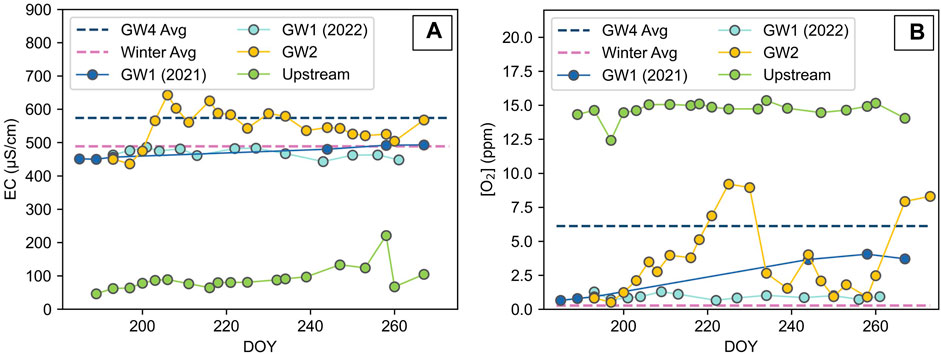
FIGURE 3. Temporal variation of in situ measurements (A) electrical conductivity (EC) and (B) dissolved oxygen of the GW1 spring, GW2 pool and the upstream melt river. Average values of the GW4 pool (n=2, taken during the summer) and the samples taken from the winter icing (denoted ‘Winter Avg’, n = 3) are plotted as endmember lines. DOY represents the day number of the year.
The concentrations of all ions (Ca2+, K+, Mg2+, Na+, SO42-, Cl−, and HCO3−) within the GW1 spring remained relatively stable throughout both summers and consistently plot close to the winter average concentrations (Figure 4). Ionic concentrations of the GW2 pool fluctuated throughout the summer between the bounds of the winter and GW4 average concentrations. Concentrations of the various ions within the upstream melt river were generally lower than or similar to concentrations in the groundwaters. The carbon isotopic composition of DIC was variable for all water types, although its values were generally more positive in the GW2 pool (Figure 4).
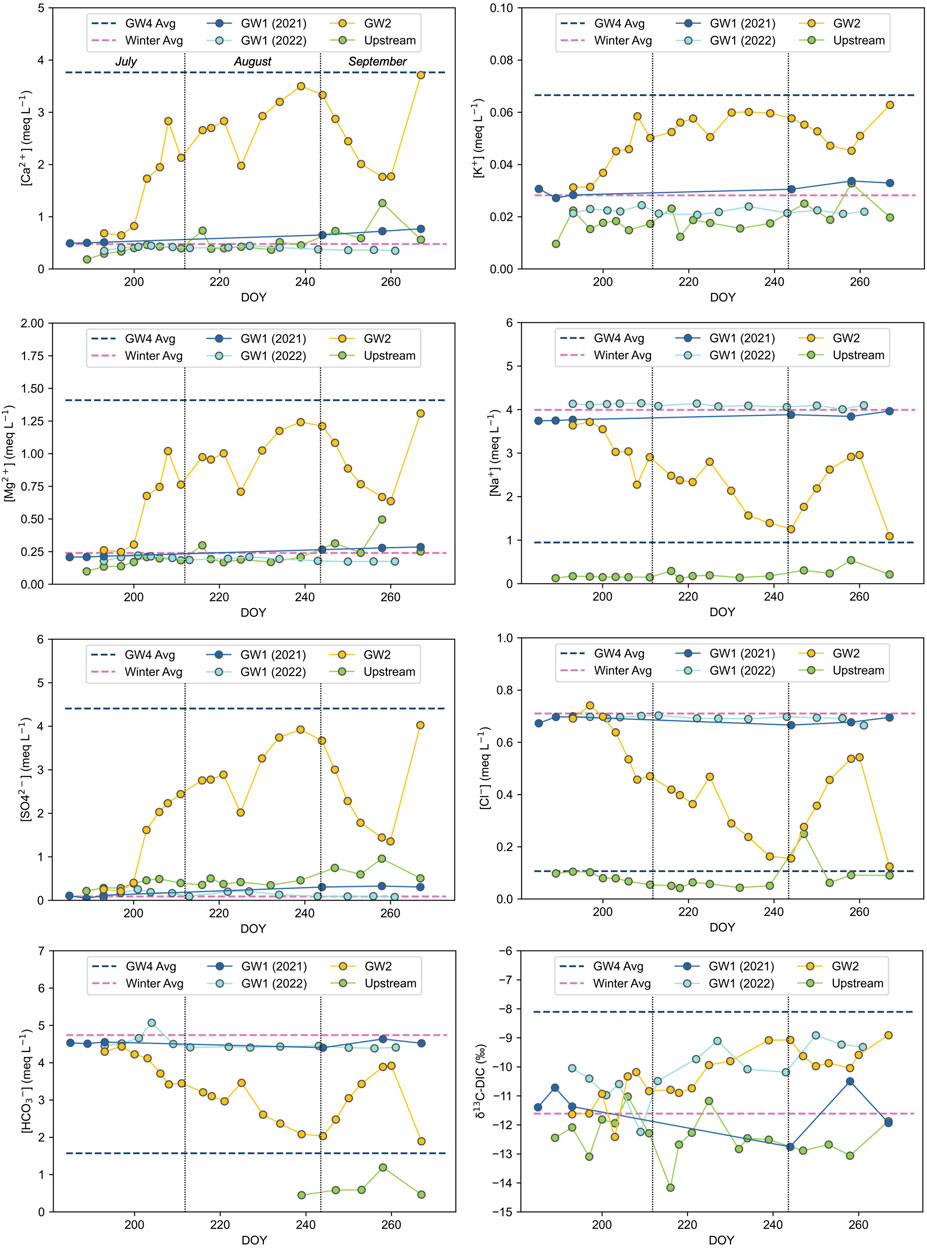
FIGURE 4. Temporal variation of major ion concentrations and carbon isotopes of DIC (δ13C-DIC) in the GW1 spring, GW2 pool and the upstream melt river. Average values of the GW4 pool (n = 2, taken during the summer) and the springtime samples taken from the winter icing (denoted ‘Winter Avg,’ n = 3) are plotted as endmember lines. HCO3− concentrations are based on alkalinity measurements; early summer measurements of the upstream melt river were below the detection limit. DOY represents the day number of the year.
The methane concentrations of the GW1 spring have two distinctly different trends between the two summers sampling seasons (Figure 5). The groundwater spring started each summer with similar concentrations (roughly 950,000 nM), but the concentrations in 2021 dropped considerably at the end of the summer to less than half the initial concentrations. The carbon isotopic composition of the methane, which started the summer at an average of −45‰, correspondingly showed a slight enrichment in 13C at the end of the 2021 summer with an average composition of −44‰. In 2022, the methane concentration of the GW1 spring remained relatively stable (ranging from 956,000 nM to 11,650,000 nM) and likewise, the carbon isotopic composition varied little (ranging from −44.3‰ to −43.9‰). Like the geochemistry of the GW2 spring, the methane concentration and the isotopic composition of the methane varied significantly throughout the summer. The concentration ranged from 122,000 nM to 945,000 nM and the isotopic composition ranged from −45‰ to −41‰. Both the GW1 and GW2 springs started each summer with methane concentrations similar to the winter average (808,000 nM).
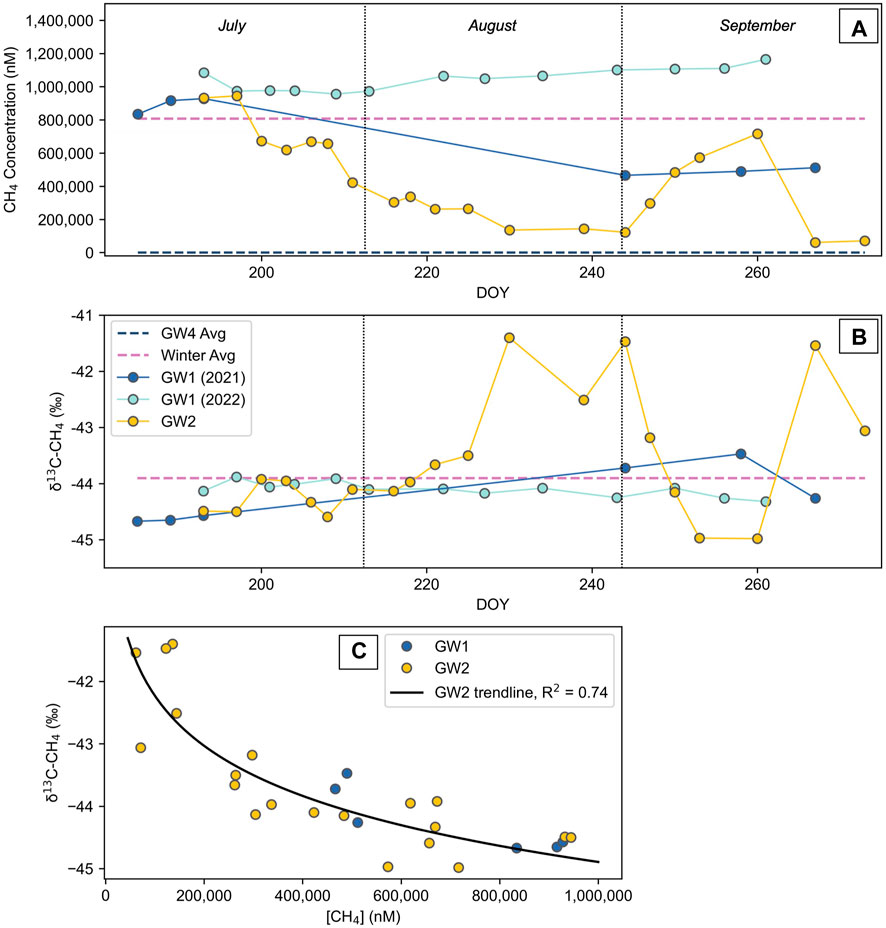
FIGURE 5. (A) Methane concentrations of the GW1 spring during summer 2021 and summer 2022 and the GW2 pool during summer 2021. Winter average concentrations (n=3) and the average of the GW4 pool during summer 2021 (n=2) are included. (B) The stable carbon isotopic compositions of the same sites listed above, except the GW4 pool. The legend in (B) applies to both plots. (C) Methane concentrations of the GW1 spring in 2021 and the GW2 pool plotted against the corresponding isotopic composition of carbon in methane.
One water sample taken from the winter icing during springtime and three samples taken during summer (including one from the GW1 spring and two from the GW2 pool) were analyzed for the concentration of ethane and propane to aid in the identification of a thermogenic gas source. The results are displayed in Table 1. Ethane was present in both the winter sample as well as the GW1 spring. Propane was only present in the winter sample. Neither gas was detected in the samples from the GW2 pool.
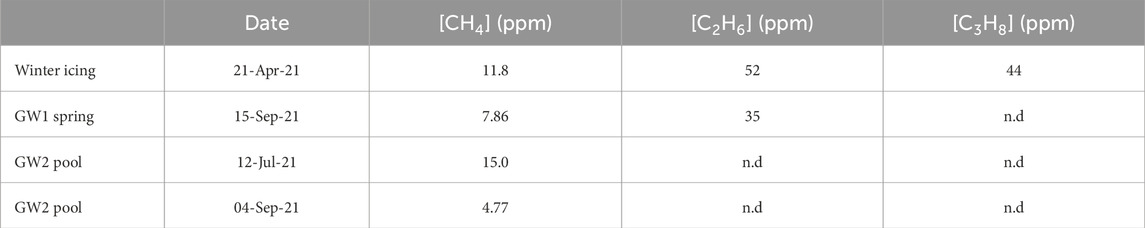
TABLE 1. Methane, ethane (C2H6) and propane (C3H8) concentrations of a selection of water samples.
Hight throughput sequencing of DNA of the 16S ribosomal RNA gene provide information on all sequences in the samples analyzed and might also originate from dead and inactive cells, or from extracellular DNA captured in the water. The direct examination of rRNA through RNA isolation has been found, in general, to be a more reliable indicator of cellular viability than rRNA gene targets. In an environment with low biological activity and has many dead and metabolically inactive cells, the rRNA fraction can provide a more ecologically relevant insight into the factors that drive microbial community dynamics (Gomez-Silvan et al., 2018). Here we refer to the DNA based sequences as the relative abundance of microorganisms and the RNA based sequences as the relatively active part of the community.
Methanogens were found with very low or no relative abundance in all groundwater samples taken apart from the GW1 spring, which showed 1.2% relative abundance of Bathyarchaeia in early summer but just 0.01% later in the season (Figure 6). Similarly, the relative activity of methanogens was very low in all samples throughout the season, with no activity in the GW2 or GW4 pool and less than 0.1% relative rRNA sequence abundance in the GW1 spring. The community of methanotrophic bacteria and archaea was more abundant in the groundwater samples and was dominated by Candidatus Methanoperedens, Crenothrix, Methylobacter, and Methylomonadaceae. The highest relative abundance was found in GW1 in September (6.1%) and GW2 in mid-September (5.0%), whereas the highest relative activity was found with Candidatus Methanoperedens in the GW2 pool in late-July (33.2%) and mid-September (14.4%).
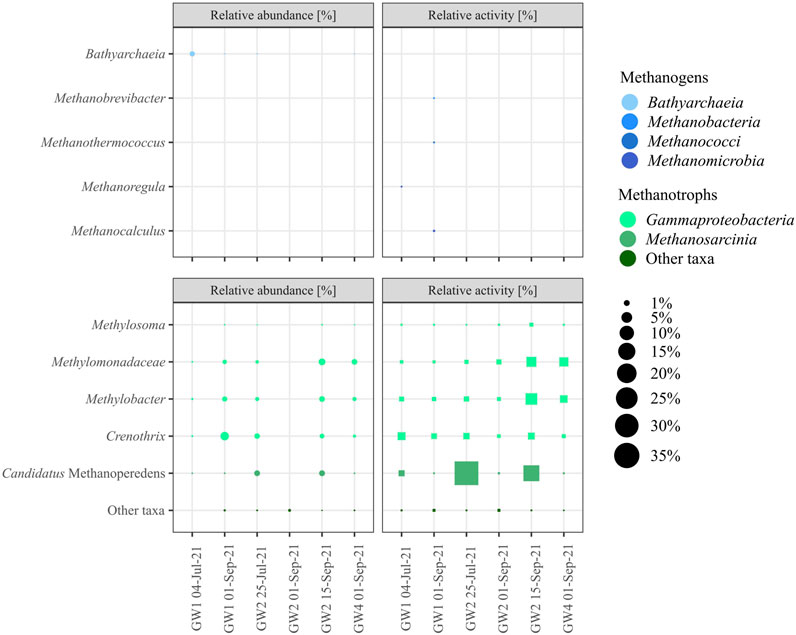
FIGURE 6. Relative abundance (●) and relative activity (■) of taxa associated with methanogenesis (blue, top two boxes) and methanotrophy (green, lower two boxes). Taxa with an average of relative abundance and activity <0.1% are summed as Other taxa.
Changes in the geochemistry of the GW2 pool throughout the summer suggest mixing of two discrete groundwater sources. The average composition of the GW4 groundwater pool and the groundwater sampled from the winter icing are shown as approximate endmember compositions of the two groundwater sources in Figures 2–5. Although these average compositions are based on few samples (GW4: n = 2, winter: n = 3), the geochemistry of the GW2 pool consistently fluctuated within the bounds of these two average compositions and thus they represent a good approximation for projected endmembers. In addition, the notable similarity between the GW1 spring and the winter samples suggest the same source, which appears to maintain consistent geochemistry year-round, making it a likely primary groundwater source. Thus, the projected chemistry of the two groundwater sources that feed into the GW2 pool, hereafter referred to as “GW-shallow” and “GW-deep” and depicted in Figure 7, are represented by the GW4 pool and the groundwater that forms the winter icing, respectively.
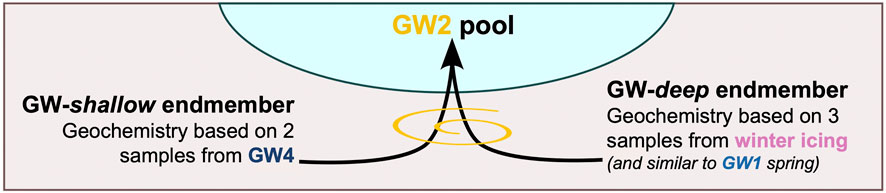
FIGURE 7. Mixing of the groundwater endmembers to form the GW2 pool.
Considering these endmembers, GW-shallow is characterized by a higher δ2H and δ18O (Figure 2), a slightly higher EC (Figure 3) and higher concentrations of Ca2+, Mg2+, K+, and SO42- (Figure 4). It is also more oxygenated (Figure 3), with DIC that is less enriched with 13C (Figure 4) and relatively low levels of methane (∼102–103 nM range, Figure 5). In contrast, GW-deep is characterized by distinctly different geochemistry: nearly anoxic water with higher concentrations of Na+, Si, Cl−, and HCO3−. It is also much more concentrated with aqueous methane (∼106 nM). A summary of the average projected water chemistries of these two endmembers (Table 2) can be used to establish the provenance of their hydrological sources throughout the rest of this paper.
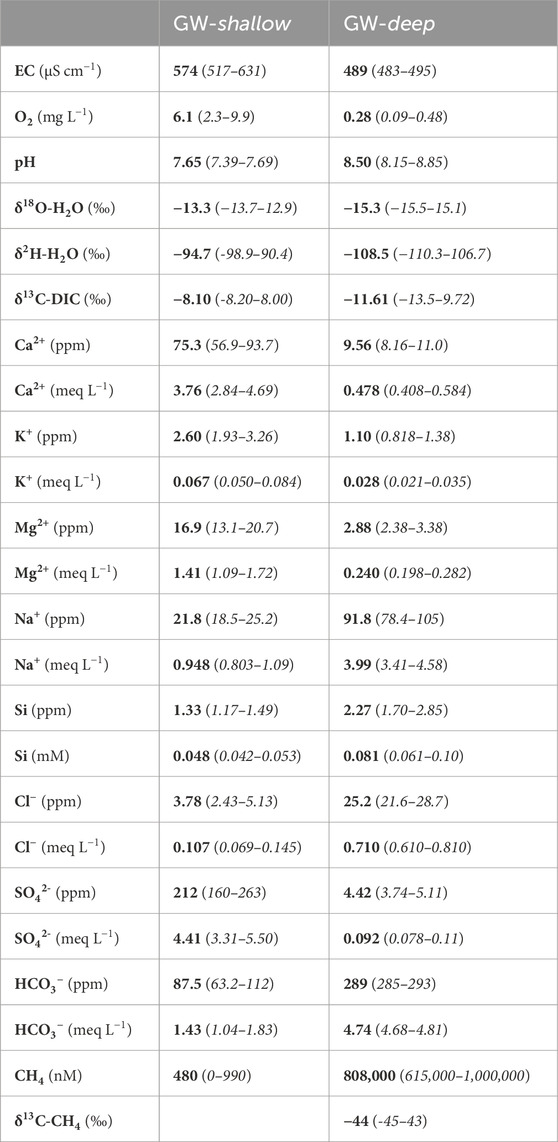
TABLE 2. Average water chemistries of the GW-shallow and GW-deep endmembers. GW-shallow is based on average values of samples taken at GW4 during summer (n = 2). GW-deep is based on average values of samples taken from the winter icing (n = 3). Error ranges are based on two-times the standard deviation of n measurements and include analytical error.
The oxygen and hydrogen isotopic composition of the GW-shallow endmember lies within the range of isotopic composition measured in the main glacial melt river (Figure 2), suggesting the water is sourced by melting glacier ice. A lack of Cl− in the GW-shallow endmember further hints that the water is not of recent meteoric origin where it would contain marine aerosols. The conservative behaviour of Cl− within the glacial drainage system has meant that it is commonly used as a tracer for snowmelt (Tranter et al., 1993; Wadham et al., 1998; Hodson, 2006; Hodson and Yde, 2022). Chloride is released from the snow through snowpack elution while transforming into glacier ice, producing glacier ice with very little Cl− to mobilize upon melting. A low Cl− concentration is therefore further evidence supporting the notion that GW-shallow originates from melting glacier ice.
Rather than subglacial melt supplying the GW-shallow water, we suggest that it is sourced seasonally from buried glacier ice within the moraine. The groundwater springs are located approximately 250 m from the 2021 glacier margin at the edge of the floodplain formed by the main glacial melt river. In this area, the floodplain is bordered by moraine that was uncovered by the retreating glacier within the last 10 years and further bound by a lateral moraine flanking the neighbouring mountain (see Figure 1). The moraine is largely ice-cored, evident by patches of exposed, melting ice throughout the proglacial area and the flank of the mountain during summer. Observations in the field showed that many springs have formed beneath patches of buried ice, disappearing into moraine and resurfacing several times as the water flows towards the GW2 pool. Buried glacier ice within the active layer is recognized as a common contributor to groundwater systems in proglacial environments (Cooper et al., 2002; Levy et al., 2015).
Melting of buried ice is a seasonal phenomenon, requiring the active layer to thaw before heat can penetrate to melt the ice. This can delay the contribution of shallow groundwater sources such as buried ice, which then increase as the melt season proceeds and the active layer progressively deepens (Cooper et al., 2011). As such, a seasonal change should be observed in the contribution from GW-shallow to the GW2 pool. Using Cl− (which is present in much higher concentrations in GW-deep than GW-shallow) as an indicator of the degree of mixing within the GW2 pool, we can assess the impact of seasonal air temperature changes on the proportion of GW2 that is sourced from GW-shallow. Figure 8 shows the variation of Cl− concentrations in the GW2 pool throughout the summer plotted with average hourly air temperatures. High concentrations of Cl− at the start of the melt season (∼25 mg L−1), similar to the GW-deep endmember value, indicate little to no contribution from GW-shallow. The delayed contribution from GW-shallow, followed by a progressive increase in the contribution from GW-shallow, is due to the thawing and gradual deepening of the active layer, which can begin after the recession of the snowpack at the start of the summer. This delay is later than would be expected if subglacial meltwaters were the source, as the isotopic composition of the water and low Cl− concentrations in the melt river at this time indicate that glacier ice melt is already active and the primary contributor to the melt river. Later in the melt season, temperatures were near freezing during a cold period at the start of September, which coincided with a decrease in contribution from GW-shallow to GW2, likely due to a recess of moraine ice melt. This reverted when the temperatures began to increase again.
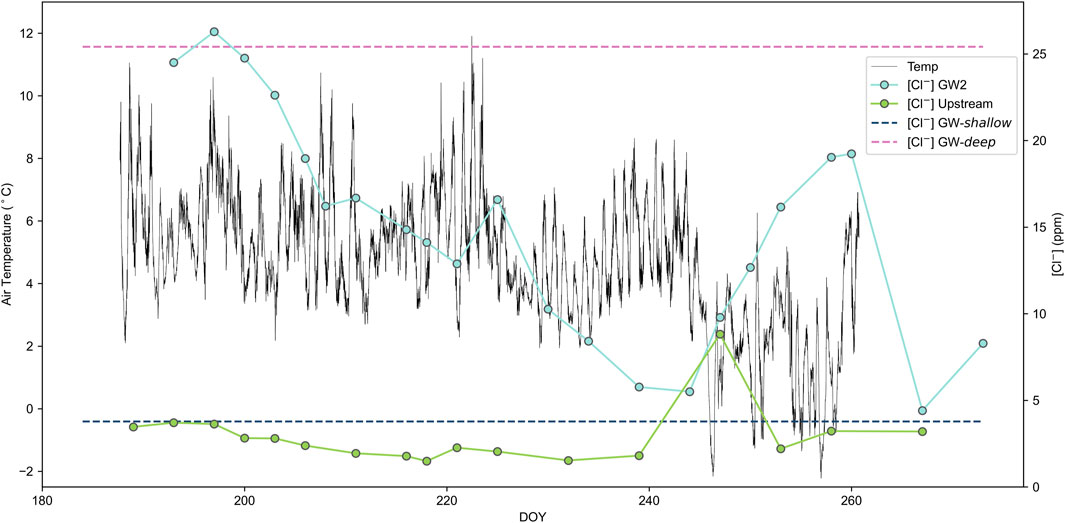
FIGURE 8. Cl-concentrations of the upstream river and GW2 pool throughout the summer with GW-shallow and GW-deep endmember concentrations plotted over the hourly air temperature.
The short distance between the buried ice along the edge of the moraine and the GW2 pool (<500 m) limits the time available for chemical weathering reactions to occur along the flowpath. However, the relatively high EC of the GW-shallow endmember (∼575 μS cm−1) suggests that the water must acquire ions rapidly by flowing through a highly reactive substrate such as glacial till. This near-surface, high rock-water contact environment facilitates efficient chemical weathering, including aerobic oxidation reactions that utilize oxygen readily acquired from the atmosphere.
Geochemical modelling by WEB-PHREEQ suggests that the GW-shallow endmember is undersaturated with respect to all minerals except iron-hydroxides, thus it is not expected that its major ion chemistry would be altered by mineral precipitation along its flowpath, but more by mineral dissolution. Among other ions, the GW-shallow endmember is characterized by high levels of Ca2+ (75.3 mg L−1) and SO42- (212 mg L−1). While this could suggest the dissolution of an evaporite mineral such as gypsum, there is no known source of evaporite minerals in the local bedrock. Instead, the presence of Ca2+ and SO42- in such high concentrations likely results from a shallow flowpath where secondary, or efflorescent, gypsum that has precipitated on the surface of the moraine dissolves into the groundwater. White, efflorescent salts were observed on the surface of the Vallåkrabreen moraine during the melt season, presumably formed by evaporative concentration of groundwater during summer or cryoconcentration during winter. Similar observations are common in proglacial water and moraines of other Arctic and Antarctic glaciers (Cooper et al., 2002; Bisson et al., 2015; Stachnik et al., 2016; Lehn et al., 2017; Puigdomenech et al., 2017; Deuerling et al., 2018). The molar ratio of SO42-/Ca2+ (1.17) in GW-shallow suggests an excess of SO42- above the 1:1 ratio that would be expected from the simple dissolution of gypsum, hinting that there is an additional source of SO42-, or a reaction that is consuming calcium, such as carbonate mineral precipitation. We favor the former given the undersaturation of the groundwater with respect to carbonate mineral precipitation, although ion exchange reactions cannot be ruled out, which may remove calcium from the groundwater flow.
Pyrite (FeS2) oxidation, a key weathering mechanism in many glacial environments, produces SO42-. It also produces acidity which aids in the dissolution of carbonate and silicate minerals. The high concentration of SO42- and the low concentration of HCO3− in the GW-shallow endmember suggests that pyrite oxidation is the prevailing producer of acidity. The sulfate mass fraction (SMF), can be calculated:
Equation 1 uses concentrations in molar equivalents. The SMF provides insights into chemical weathering reactions in a catchment. An SMF ratio of 0.5 suggests that sulfide oxidation coupled with carbonate dissolution is most prevalent (Tranter et al., 2002). Values <0.5 are associated with reactions driven by the dissolution of CO2 with rock consisting of few sulfide minerals, or anoxic environments where microbial sulfide reduction consumes SO42- and yields HCO3− (Wadham et al., 1998). In the case of the GW-shallow endmember, the SMF is >0.5 (at 0.75) which suggests that the dominant weathering reaction is sulfide oxidation coupled to silicate mineral dissolution. While both carbonate (siderite, calcite) and silicate (quartz, albite, microcline, chlorite, micas) minerals are present in the Carolinefjellet formation (Dixon, 2019), the HCO3− concentration is much too low for extensive carbonate mineral dissolution to be occurring and thus silicate mineral dissolution is expected to dominate the supply of cations to the GW-shallow endmember. This is not surprising considering that silicate minerals make up at least three-quarters of the grains within the Carolinefjellet formation (Maher et al., 2004). In addition, the carbon isotopic composition of DIC (δ13C-DIC, −8.1‰) is lower than what would be expected for carbonate mineral weathering, which typically yields isotopic ratios closer to 0‰, which is closer to the ‘average’ δ13C of carbonate minerals (Darling et al., 2006). The DIC is likely derived from a mix of processes, mainly the dissolution of atmospheric CO2 due to the near-surface flowpath, with some carbonate mineral dissolution and the oxidation of organic carbon, which would produce DIC with a lower carbon isotopic composition.
There is very little methane present in the GW-shallow endmember (∼477 nM) compared to concentrations measured in GW-deep (∼808,000 nM). At such low methane concentrations and with trivial levels of methanogenic activity detected in the GW4 pool by 16S analysis (Figure 6) (GW4 is the groundwater that the GW-shallow endmember is founded on), it does not appear that methane is acquired or produced along the GW-shallow flowpath. Any methane that is present in the GW4 pool is likely introduced by minor mixing of groundwaters or nearby degassing of methane from the methane-rich groundwaters, as the groundwater springs and pools are in close proximity to each other.
In summary, the GW-shallow endmember is a seasonal, shallow, oxygenated groundwater system that is sourced from the melt of buried glacial ice within the moraine and is active only during the melt season. It flows through highly reactive glacial till where it weathers mostly silicate minerals, driven predominantly by sulfide mineral oxidation which depletes the water of some of its oxygen, presumably before consuming other electron acceptors. It exhibits open-system behavior due to its shallow flowpath that allows for some interaction and exchange with atmospheric gases, notably O2 and CO2. Methane is not expected to be acquired or produced in significant amounts along the flowpath of GW-shallow.
The GW-deep endmember is represented by the average chemistry of samples taken from the groundwater that forms the winter icing (n = 3). It is important to note that the chemistry of the GW1 spring throughout the summer is remarkably similar to the projected chemistry of the GW-deep endmember. Thus, it is assumed that the GW1 spring runs year-round and contributes substantially to the formation of the proglacial icing throughout the winter. This is also supported by the observation that the GW1 spring discharge did not appear to fluctuate with weather, precipitation or temperature throughout the summer, but rather its flow remained more or less constant.
The chemistry of the GW-deep endmember is distinct to that of GW-shallow, first evident by the isotopic composition of the water (Figure 2). The water is much more negative in its hydrogen and oxygen isotopic composition and closer to what would be expected from high-elevation snowmelt. Progressive isotopic fractionation during precipitation in mountainous regions, in which molecules containing heavier isotopes of hydrogen and oxygen preferentially partition from atmospheric water vapor, leads to snowpack that is more depleted in heavy isotopes with increasing altitude (Siegenthaler and Oeschger, 1980). Therefore, the isotopic composition of high-elevation snow tends to be more negative than snowpack at lower elevations, with δ18O-H2O ratios found to decrease by about 0.48‰ per 100 m of increasing altitude in other regions of Svalbard (Pohjola et al., 2002).
The GW-deep endmember therefore likely originates from upper-catchment and high mountain snowmelt that enters storage in the sub-permafrost or sub-glacial environment through discontinuities such as bergschrunds, crevasses, or fractures in the bedrock. Surprisingly, the water isotopic composition of the GW1 spring remained stable throughout the summer, with δ18O-H2O only fluctuating between −15.10 and −15.40‰ and δ2H-H2O between −107.3 and −108.4‰ (n=6). This suggests that the reservoir of snowmelt is large enough to supply the spring year-round and is not recharged by glacial melt during summer.
Closed-system leaching experiments carried out on crushed rock samples from glacial catchments in Svalbard by Dixon (2019) suggest a larger degree of HCO3−, Na+ and silica released from the upper Carolinefjellet formation and the overlying Eocene formations compared to the lower Carolinefjellet formation. In 6°C leaching experiments, HCO3− concentrations were up to 5.4-times higher after 11 days using rock powders from the upper Carolinefjellet formation than from the lower. Sodium concentrations were up to 20-times higher and silica up to 3.5-times higher. The dominance of HCO3−, Na+ and silica in the GW-deep endmember is likely the result of a flowpath through the upper catchment within the upper Carolinefjellet formation and the overlying Eocene formations. Conversely, the other cations (Ca2+, K+ and Mg2+) were leached at higher concentrations in the lower part of the Carolinefjellet formation, aligning more closely with the GW-shallow endmember.
A high concentration of Cl− (25.2 mg L−1) further supports that the GW-deep endmember is snowmelt-derived and indicates a significant contribution of major ions from marine aerosols. The Cl− concentration is in a similar range to that of some glacial melt rivers on Svalbard during the early melt-season, when the river is predominantly snowmelt (Hodson and Yde, 2022). Sampling for this study did not begin until after the initial snowmelt had passed through the drainage system and so it is not possible to compare to the early melt-season discharge of Vallåkrabreen. Due to the high contribution from sea salt to the chemistry of the GW-deep endmember, standard marine ratios-to-chloride are used to remove the major ion contribution from seasalt aerosols and thus reveal the major ion concentrations of crustal provenance (denoted hereafter by ‘*’).
The lack of oxygen in the GW-deep endmember requires a closed system with no interaction with the atmosphere. Any oxygen present in the snowmelt when it initially entered the groundwater system would have been depleted within the flowpath, probably due to a combination of the oxidation of sulfide minerals, such as pyrite, and methane oxidation. Weathering of pyrite produces sulfuric acid which lowers the pH of the water. With a pH of 8.30, as well as notably low concentrations of *SO42- (the calculated contribution of sulfate from rock weathering), the GW-deep flowpath most likely runs through rocks that contain low abundances of pyrite, such that carbonic-acid weathering and hydrolysis reactions dominate.
Sodium is typically sourced from weathering of silicate minerals (Hodson et al., 2023) and thus high *Na+ concentrations (70.5 ppm) in the GW-deep endmember imply weathering of silicate minerals such as albite. Low concentrations of Ca2+ and Mg2+ suggest minimal carbonate mineral weathering; although cation exchange reactions, in which divalent cations are preferentially substituted for monovalent cations on exchange sites (Stumm and Morgan, 2012), may also account for the lack of Ca2+ and Mg2+ relative to HCO3−. While carbonic-acid weathering of both silicate and carbonate minerals may be occurring, the dominance of Na+ suggests a greater occurrence of silicate mineral weathering.
Carbonic and sulfuric acid drives the weathering of carbonate and silicate minerals to produce distinctive ratios of cations to SO42- and HCO3−. The molar equivalence ratio of the total sum of cations to HCO3− (*catsum/HCO3−), which should be unity or greater according to the idealized weathering products of these reactions, is 0.77 in the GW-deep endmember. This suggests a source of HCO3− in addition to any supplied by carbonate mineral dissolution. Additional sources of DIC can be derived from dissolved atmospheric CO2 or DIC produced from aerobic bacterial respiration, however low oxygen levels in the GW-deep endmember suggest that the flowpath has little-to-no interaction with the atmosphere and thus neither CO2 nor O2 are readily available. Evidence for microbial sulfate reduction (MSR), a microbially-mediated process that occurs in anoxic environments, consuming sulfate and producing HCO32- and HS−, has been found in the subglacial environment of glaciers in Svalbard and Greenland (Lauritzen and Bottrell, 1994; Skidmore et al., 2000; Wadham et al., 2004; Hodson et al., 2023). Considering the notably low *SO42- concentration (0.95 mg L−1, SMF = 0.004) and lack of oxygen in GW-deep, the additional source of HCO3− could rather be from microbial sulfate reduction. It is worth noting that a strong smell of HS− was observed at the GW1 site as well as at the winter icing.
There are several potential sources of organic carbon that can be used as the electron donor in microbial sulfate reduction, including hydrocarbons, kerogen in the bedrock and microbial necromass (Wadham et al., 2004). Due to the high concentration of methane present in the GW-deep endmember (>800,000 nM), we surmise that the anaerobic oxidation of methane (AOM) coupled to sulfate reduction (sulfate-driven AOM) is occurring. This process should result in a DIC pool that is depleted in 13C because methane is exceptionally depleted in 13C and when it is oxidized, it adds its highly negative δ13C to the DIC pool. The δ13C of the methane in the GW-deep endmember is −43.9‰, thus the δ13C-DIC (−11.6‰) of the GW-deep endmember suggests that the DIC is sourced from a mixture of sulfate-driven AOM and some dissolution of carbonate minerals. Measurements of the sulfur and oxygen isotopic composition of the sulfate would be useful to substantiate if sulfate-driven AOM is occurring in the GW-deep endmember.
An upper catchment or high mountain source suggests a much longer flowpath and travel time for the GW-deep endmember than the GW-shallow endmember, however the EC of GW-deep is consistently within a narrow range that is slightly lower than the EC of GW-shallow. This is likely due to a flowpath through fractured bedrock with less surface area for rock-water interaction, as opposed to comminuted glacial till. It is expected that within this bedrock, geologic methane is introduced to the groundwater. The δ13C-CH4 of the GW-deep endmember (−43.9‰ on average, n=3), the presence of ethane (C2H6) and propane (C3H8) gases in the formation water of the winter icing and the GW1 spring (Table 1), and a lack of active methanogenic microbial communities in all groundwaters (Figure 6) suggest a thermogenic source of the methane. The methane is thus introduced in a pressurized environment, allowing the concentrations to reach extreme levels of supersaturation, up to 275,000 times the concentration at equilibrium with the atmosphere. As the groundwater reaches the surface and the pressure reduces, the methane begins to rapidly degas from solution and causes ebullition, which was observed at the site in both summer and winter.
The methane gas is presumed to originate in the Agardhfjellet formation, a Middle Jurassic geologic formation containing organic-rich black shale that lies beneath the Carolinefjellet formation. The Agardhfjellet formation is a well-known source rock for petroleum on Svalbard (Leith et al., 1993) and is also known to contain C1-C4 gaseous hydrocarbons within fluid inclusions (Abay et al., 2017). Abay et al. (2017) determined that petroleum and thermogenic gaseous hydrocarbons (67.8% C1 and 32.1% C2-4) identified in outcrop samples of the Carolinefjellet formation had originated and migrated upward from the Agardhfjellet formation. It is expected that the gases introduced to the GW-deep groundwater are also derived from the Jurassic shales of the Agardhfjellet formation and have migrated upwards to the Carolinefjellet formation, where they became trapped beneath glacier ice and permafrost.
In summary, the GW-deep endmember is a deeper, anoxic groundwater that is sourced from high-elevation snowmelt. It is stored in a fracture-dominated hard rock aquifer that is likely present within the upper Carolinefjellet formation, where it acquires substantial amounts of thermogenic methane. The GW-deep groundwater system is perennial, and thus continues to flow throughout the winter, bringing methane gas to the surface year-round. Its residence time within the aquifer must be greater than 1 year, allowing for a steady state system that yields a groundwater with water chemistry and a flow rate that is constant year-round. It exhibits a more closed-system behavior due to its lack of interaction with the atmosphere, as is expected with a deep groundwater flowpath. A conceptual model of groundwater flow in the Vallåkrabreen catchment is presented in Figure 9.
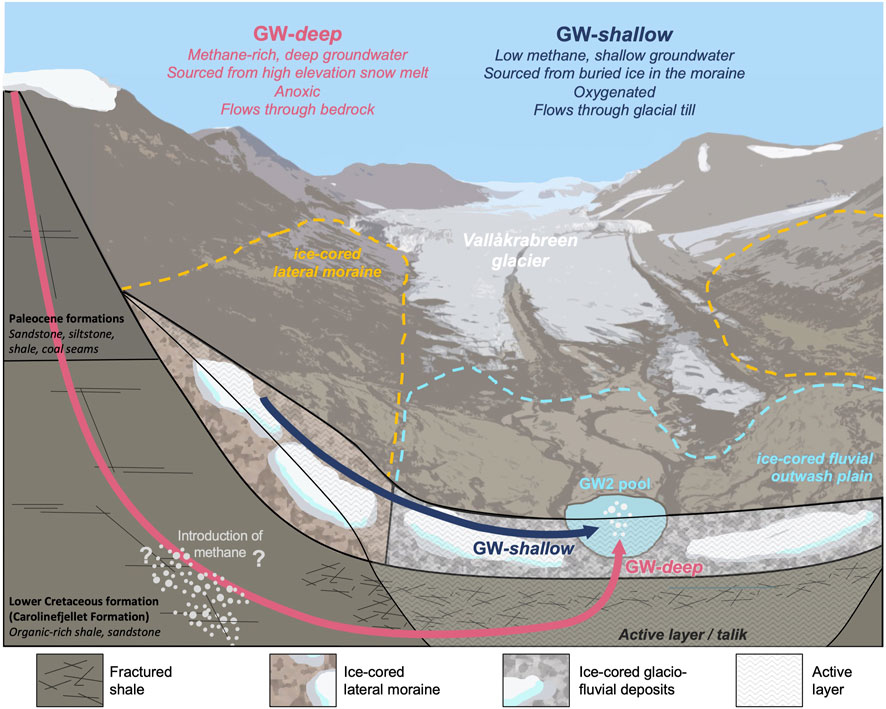
FIGURE 9. Conceptual model of groundwater flow in the Vallåkrabreen catchment.
The drop in methane concentration in GW1 observed at the end of summer 2021 (Figure 5) is likely due to an introduction of oxygen to the groundwater flowpath. The oxygen is potentially introduced through mixing with another groundwater source or subglacial melt water, although the degree of mixing is likely to be minor considering that the geochemistry of the GW1 spring exhibited very little change (Figure 4). The measured oxygen concentration changed from approximately 0.65 mg L−1 at the start of the summer to 4.0 mg L−1 at the end. While much of the measured geochemistry showed only slight changes, such as the isotopic composition of the water and most ion concentrations, the introduction of oxygen will have changed the redox environment of the system. It is likely that this inhibited microbial sulfate reduction, leading to higher concentrations of sulfate, and likely caused more efficient aerobic methane oxidation (MOx), leading to lower concentrations of methane.
Methylobacter is a prevalent, abundant and environmentally important methanotroph found in the high Arctic wetland soil of Svalbard (Wartiainen et al., 2003) and is known to oxidize methane under aerobic conditions in freshwater environments (Pester et al., 2004). Methylobacter has been identified in all sampled groundwaters from the Vallåkrabreen forefield (Figure 6). These methanotrophs can be stimulated by the addition of oxygen (Rothfuss et al., 1997) and thus may have become more active in the GW1 spring later in the 2021 season when oxygen was introduced to the system. This is also reflected in a slight enrichment of 13C in the residual methane (Figure 5).
While the variation in methane concentrations of the GW2 pool is driven partly by the degree of mixing between GW-shallow and GW-deep, there is evidence that methanotrophy along the groundwater flowpath is also influencing these values. The isotopic composition of the methane becomes more enriched in 13C in GW2 samples with lower methane concentrations (Figure 5), which may be the result of methanotrophic microbes preferentially oxidizing molecules with the lighter 12C. Methanotropic bacteria and archaea were found to be abundant and active in all groundwaters (Figure 6), with a high relative activity of Candidatus Methanoperedens (33.2% relative 16S rRNA sequence abundance in the sample of the GW2 pool taken on 25 July 2021), hinting that methanotrophic communities act as a methane sink along the flowpath of each endmember.
To determine the extent of methanotrophy that may be occurring, a methane deficit was calculated for each GW2 sample. First, the impact upon the methane concentrations due to mixing was considered. The δ2H of water was used as a tracer for the GW-deep endmember to determine the fraction of each GW2 sample that is likely sourced from GW-deep. Assuming all methane is sourced from GW-deep, an expected methane concentration was calculated, removing the impact of mixing. This expected methane concentration was then compared to the measured concentrations to determine a deficit.
A linear regression between the δ2H-H2O and the methane concentration of the two endmembers, plotted as a line in Figure 10, is used to determine the contribution from GW-deep and thus the expected methane concentration. All samples that plot below the trendline in Figure 10 suggest a quantifiable methane deficit, while all samples that plot above the trendline suggest a methane surplus. Most samples exhibit a methane deficit.
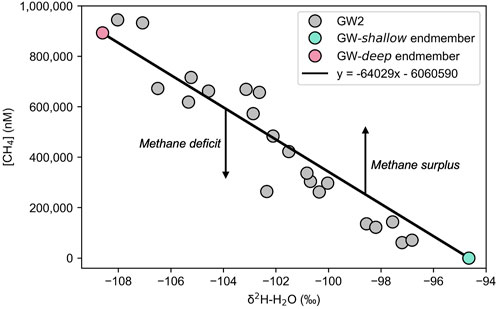
FIGURE 10. Linear regression for methane deficit calculation. Measured methane concentrations and δ2H of sample water are plotted for each GW2 sample taken throughout the 2021 summer. The GW-shallow and GW-deep endmembers are plotted with a linear regression line between.
The methane deficits are plotted against the corresponding δ13C of methane in Figure 11A, and shaded according to their dissolved oxygen content. Figure 11A suggests that the deficits of methane are due to methanotrophy along the GW2 flowpath. As expected, larger methane deficits correspond with methane more enriched in the heavier carbon isotope (R2 = 0.69). This is likely the result of the preferential uptake of the lighter isotope during methanotrophy, leaving behind a methane pool that’s more enriched in the heavier isotope. Larger methane deficits are also found to correspond with more oxygenated water (Figure 11A), likely due to stimulated aerobic methane oxidation (MOx) in the presence of oxygen.
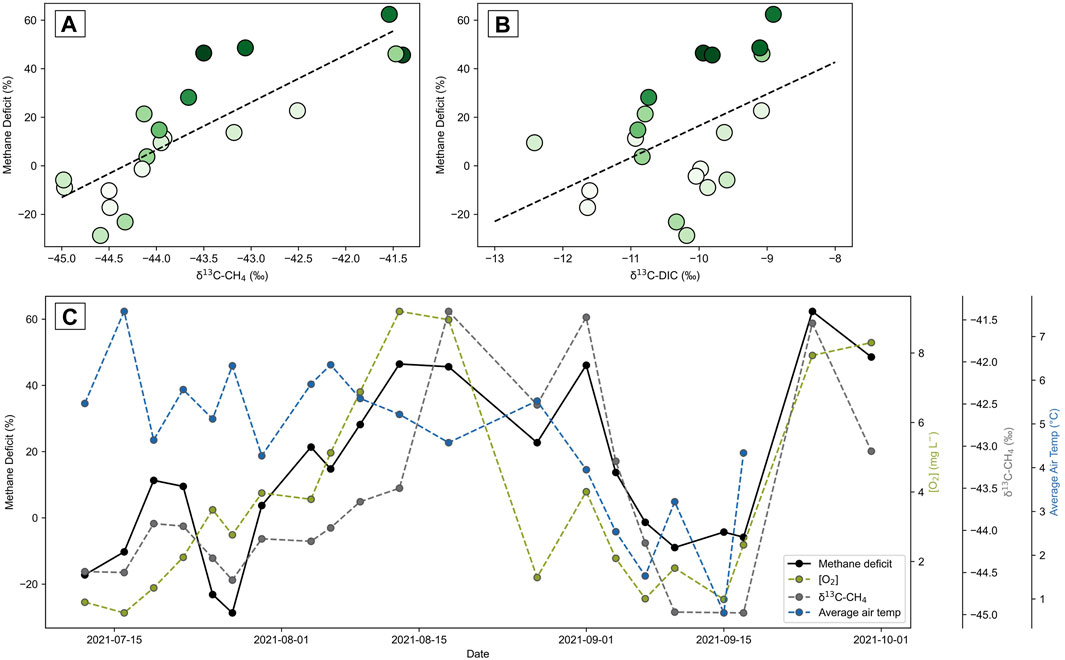
FIGURE 11. Methane deficit (%) of the GW2 pool, determined by the δ2H of water, plotted against the corresponding (A) δ13C of methane and (B) δ13C of DIC. Positive values represent a deficit of methane and negative values represent a surplus of methane, above the expected amount. Markers are colored on a linear scale according to dissolved oxygen (DO) content. Lighter greens represent lower DO, down to 0.52 mg L−1, while darker greens represent higher DO, up to 9.2 mg L−1. The trendline plotted in (A) has R2 = 0.69 and (B) has R2 = 0.23. (C) Methane deficit of the GW2 pool is plotted temporally with DO, the δ13C of methane and the average air temperature of the sampling day.
Temporally examining the extent of methane deficiency throughout the melt season in Figure 11C suggests that the methane deficiency and the corresponding enrichment of 13C in the methane are driven by the extent of oxygenation in the water. The level of oxygen in the GW2 pool is regulated by its relative contribution of the GW-shallow endmember, which slowly increases at the start of the melt season as the active layer progressively thaws and releases more melt from buried ice in the moraine. The system reverts to low oxygen and thus low methane deficits when the air temperatures decrease in mid-September and the melt of buried ice is reduced.
The methane deficit calculations suggest that microbial activity is likely a significant methane sink within the GW2 flowpath, especially when oxygen is available for more efficient oxidation. The deficit calculations suggest that this oxygenation has led to variable consumption of the methane within the GW2 flowpath—reducing an average of 29% (±14%) of the methane throughout the summer and up to 62% (±14%) when the water was most oxygenated in mid-summer. This implies that the melt season methane emissions from groundwater within the Vallåkrabreen catchment are likely to be lower than the emissions occurring throughout the rest of the year due to the mixing of oxygen-rich waters that are active during summer.
The methane deficit calculations in the previous subsection suggest that the GW2 pool exhibits a surplus of methane in some cases, up to 29% (±14%) above what would be expected from a GW-deep contribution alone. The presence of thermogenic methane, which may lead to the system being depleted of its oxygen through methane oxidation, can generate a low redox environment that is conducive for methanogenesis. This has been observed beneath the Icelandic glacier, Sólheimajökull, where the introduction of reduced volcanic gases lowers the redox status of the subglacial environment, facilitating the production of methane and preventing its consumption (Burns et al., 2018). In the case of the GW2 pool however, no activity of microbial methanogenic communities was found (Figure 6). One might also hypothesize that additional microbial methanogenesis would change both the δ13C of the methane and the residual DIC, which is not observed (Figure 11B) (Whiticar, 1999). Thus, we conclude that microbial methane production is not a significant contributor to the methane levels in the GW2 pool.
Instead, the surplus methane is likely due to accumulation and freeze-concentration of methane beneath ice. Samples that show a methane surplus occur within two time periods: the start of the summer season and a cold period during mid-September (Figure 11C). At the start of the summer, methane that has accumulated beneath the winter icing may still be flushed out of the groundwater system, as there were still remnants of the winter icing in the flood plain. During mid-September, low air temperatures led to a thin layer of ice forming on the surface of the GW2 pool which could have trapped methane and elevated concentrations within the water. A reduced contribution from GW-shallow due to a reduction in the rate of buried ice ablation means that less oxygen was available in the groundwater mixture to promote methane oxidation, allowing for the methane to accumulate. In addition, partial freezing of the pool may have led to some freeze-concentration of methane in the water. Neither of these processes are related to any significant kinetic isotopic fractionation and thus they are more likely to explain the methane surpluses observed.
In summary, the thermogenic methane present in the groundwater springs within the Vallåkrabreen catchment does not appear to be supplemented by the microbial production of methane.
Our findings demonstrate how shallow and deeper groundwaters interact to control methane dynamics in glacierized environments within permafrost regions. However, ratios of the differing groundwater sources will change markedly in years to come. Climatic changes are leading to larger storage capacities of aquifers and increased summer recharge of groundwater aquifers in glacierized catchments across the Arctic (Liljedahl et al., 2017). Such changes are likely to expand aquifers that store methane-super-saturated groundwaters and increase the recharge of aquifers supplied by upper-catchment precipitation. Therefore, the contribution of deep groundwaters to total runoff may increase. Conversely, as the summer melt season is prolonged due to rising air temperatures, the period in which shallow, oxygenated groundwater is available to oxidise methane may increase, thus reducing yearly emissions. However, as glaciers are reduced in size and more buried ice has melted out of the moraine, less glacier ice will be available to produce shallow, oxygenated groundwaters during summer. These changes may ultimately lead to less oxidation of methane in the future and, in turn, larger overall methane emissions. Deep, methane-rich groundwaters will become increasingly important to catchment runoff chemistry and methane dynamics.
The objectives of this study were to identify and characterize the active groundwater in the Vallåkrabreen catchment, while also establishing their provenance and their role in methane dynamics. This study concludes that two dominant groundwater sources interact within the Vallåkrabreen catchment to moderate methane emissions during the melt season. One is a seasonal, shallow oxygenated groundwater system that is sourced from the melt of buried glacial ice within the moraine and is active only during the melt season. The other is a deeper, anoxic groundwater that is sourced from high-elevation snowmelt and acquires substantial amounts of geologic methane along its flowpath. This deep groundwater system is perennial, and thus it continues to flow throughout the winter, bringing methane gas to the surface year-round.
During summer, methane-rich deep groundwaters are diluted and oxidized by shallow groundwaters, invoking more efficient methanotrophic communities and tempering the release of methane to the Arctic atmosphere. This has led to an average reduction of 29% (±14%) of potential emissions from the GW2 spring. Given that the oxygenated shallow groundwaters are not expected to be as active outside of the melt season, it is likely that these oxygenation processes are less efficient throughout the rest of the year. A reduction in the efficiency of the microbial methane sink within the groundwater flowpaths may lead to higher net methane release to the atmosphere. Therefore, the melt season methane emissions from groundwater in the Vallåkrabreen catchment are likely to be lower than the emissions occurring throughout the rest of the year.
In summary, this study has demonstrated that during the Arctic summer, methane emissions from proglacial groundwaters are regulated by subsurface oxidation. Oxygenated groundwater that is only active during the melt season is mixed with anoxic, methane-rich groundwater that flows year-round. The introduction of oxygen induces more efficient microbial consumption of methane and thereby reduces potential methane emissions. Microbial activity is an important moderator of methane emissions from proglacial groundwaters during the Arctic summer.
The datasets presented in this study can be found in online repositories. The names of the repository/repositories and accession number(s) can be found below: https://zenodo.org/records/10600361, PRJEB60294.
GEK: Conceptualization, Data curation, Formal Analysis, Funding acquisition, Investigation, Methodology, Project administration, Visualization, Writing–original draft. LM: Investigation, Visualization, Writing–review and editing. AVT: Supervision, Resources, Writing–review and editing. KR: Formal Analysis, Writing–review and editing. ST: Data curation, Formal Analysis, Writing–review and editing. ML: Formal Analysis, Writing–review and editing. KH: Formal Analysis, Methodology, Writing–review and editing. LØ: Writing–review and editing. AH: Conceptualization, Funding acquisition, Investigation, Project administration, Resources, Supervision, Writing–review and editing.
The author(s) declare financial support was received for the research, authorship, and/or publication of this article. This research was supported by grants awarded by The Research Council of Norway to GEK (RCN project no. 329174) and AH (RCN project no. 294764).
We thank Yizhu Zhu and Mark Trimmer for their support with the methane analysis at the School of Biological and Behavioural Sciences, Queen Mary University of London. We thank the governor of Svalbard for granting us access to restricted zones to conduct fieldwork, as well as Sara Mollie Cohen and the rest of the UNIS Logistics team for their field support. We are grateful to Marjolein Gevers for her help in the field.
The authors declare that the research was conducted in the absence of any commercial or financial relationships that could be construed as a potential conflict of interest.
All claims expressed in this article are solely those of the authors and do not necessarily represent those of their affiliated organizations, or those of the publisher, the editors and the reviewers. Any product that may be evaluated in this article, or claim that may be made by its manufacturer, is not guaranteed or endorsed by the publisher.
Abay, T. b., Karlsen, D. a., Lerch, B., Olaussen, S., Pedersen, J. h., and Backer-Owe, K. (2017). Migrated petroleum in outcropping mesozoic sedimentary rocks in spitsbergen: organic geochemical characterization and implications for regional exploration. J. Petroleum Geol. 40, 5–36. doi:10.1111/jpg.12662
Andermann, C., Longuevergne, L., Bonnet, S., Crave, A., Davy, P., and Gloaguen, R. (2012). Impact of transient groundwater storage on the discharge of Himalayan rivers. Nat. Geosci. 5, 127–132. doi:10.1038/ngeo1356
Apprill, A., McNally, S., Parsons, R., and Weber, L. (2015). Minor revision to V4 region SSU rRNA 806R gene primer greatly increases detection of SAR11 bacterioplankton. Aquat. Microb. Ecol. 75, 129–137. doi:10.3354/ame01753
Bælum, K., and Benn, D. I. (2011). Thermal structure and drainage system of a small valley glacier (Tellbreen, Svalbard), investigated by ground penetrating radar. Cryosphere 5, 139–149. doi:10.5194/tc-5-139-2011
Bisson, K. M., Welch, K. A., Welch, S. A., Sheets, J. M., Lyons, W. B., Levy, J. S., et al. (2015). Patterns and processes of salt efflorescences in the McMurdo region, Antarctica. Arct. Antarct. Alp. Res. 47, 407–425. doi:10.1657/AAAR0014-024
Bukowska-Jania, E., and Szafraniec, J. (2005). Distribution and morphometric characteristics of icing fields in Svalbard. Polar Res. 24, 41–53. doi:10.3402/polar.v24i1.6252
Burns, R., Wynn, P. M., Barker, P., McNamara, N., Oakley, S., Ostle, N., et al. (2018). Direct isotopic evidence of biogenic methane production and efflux from beneath a temperate glacier. Sci. Rep. 8, 17118. doi:10.1038/s41598-018-35253-2
Callahan, B. J., McMurdie, P. J., Rosen, M. J., Han, A. W., Johnson, A. J. A., and Holmes, S. P. (2016). DADA2: high-resolution sample inference from Illumina amplicon data. Nat. Methods 13, 581–583. doi:10.1038/nmeth.3869
Chesnokova, A., Baraër, M., and Bouchard, É. (2020a). Proglacial icings as records of winter hydrological processes. Cryosphere 14, 4145–4164. doi:10.5194/tc-14-4145-2020
Chesnokova, A., Baraër, M., Laperrière-Robillard, T., and Huh, K. (2020b). Linking Mountain glacier retreat and hydrological changes in southwestern yukon. Water Resour. Res. 56, e2019WR025706. doi:10.1029/2019WR025706
Cooper, R., Hodgkins, R., Wadham, J., and Tranter, M. (2011). The hydrology of the proglacial zone of a high-Arctic glacier(Finsterwalderbreen, Svalbard): sub-surface water fluxes and complete water budget. J. Hydrology 406, 88–96. doi:10.1016/j.jhydrol.2011.06.008
Cooper, R. J., Wadham, J. L., Tranter, M., Hodgkins, R., and Peters, N. E. (2002). Groundwater hydrochemistry in the active layer of the proglacial zone, Finsterwalderbreen, Svalbard. J. Hydrology 269, 208–223. doi:10.1016/S0022-1694(02)00279-2
Danilovich, I., Zhuravlev, S., Kurochkina, L., and Groisman, P. (2019). The past and future estimates of climate and streamflow changes in the western dvina river basin. Front. Earth Sci. 7. doi:10.3389/feart.2019.00204
Darling, W. G., Bath, A. H., Gibson, J. J., and Rozanski, K. (2006). “ISOTOPES IN WATER,” in Isotopes in palaeoenvironmental research, developments in paleoenvironmental research. Editor M. J. Leng (Netherlands, Dordrecht: Springer), 1–66. doi:10.1007/1-4020-2504-1_01
Deuerling, K. M., Martin, J. B., Martin, E. E., and Scribner, C. A. (2018). Hydrologic exchange and chemical weathering in a proglacial watershed near Kangerlussuaq, west Greenland. J. Hydrology 556, 220–232. doi:10.1016/j.jhydrol.2017.11.002
Douglas, G. M., Maffei, V. J., Zaneveld, J. R., Yurgel, S. N., Brown, J. R., Taylor, C. M., et al. (2020). PICRUSt2 for prediction of metagenome functions. Nat. Biotechnol. 38, 685–688. doi:10.1038/s41587-020-0548-6
Gomez-Silvan, C., Leung, M. H. Y., Grue, K. A., Kaur, R., Tong, X., Lee, P. K. H., et al. (2018). A comparison of methods used to unveil the genetic and metabolic pool in the built environment. Microbiome 6, 71. doi:10.1186/s40168-018-0453-0
Grüning, B., Dale, R., Sjödin, A., Chapman, B. A., Rowe, J., Tomkins-Tinch, C. H., et al. (2018). Bioconda: sustainable and comprehensive software distribution for the life sciences. Nat. Methods 15, 475–476. doi:10.1038/s41592-018-0046-7
Hambrey, M. J., Murray, T., Glasser, N. F., Hubbard, A., Hubbard, B., Stuart, G., et al. (2005). Structure and changing dynamics of a polythermal valley glacier on a centennial timescale: midre Lovénbreen, Svalbard. J. Geophys. Res. Earth Surf. 110. doi:10.1029/2004JF000128
Hodgkins, R. (1997). GLACIER HYDROLOGY IN SVALBARD, NORWEGIAN HIGH ARCTIC. Quat. Sci. Rev. 16, 957–973. doi:10.1016/s0277-3791(97)00032-2
Hodgkins, R., Tranter, M., and Dowdeswell, J. A. (2004). The characteristics and formation of a high-arctic proglacial icing. Geogr. Ann. Ser. A, Phys. Geogr. 86, 265–275. doi:10.1111/j.0435-3676.2004.00230.x
Hodson, A. (2006). Biogeochemistry of snowmelt in an Antarctic glacial ecosystem. Water Resour. Res. 42. doi:10.1029/2005WR004311
Hodson, A., Kleber, G., Johnson, J., Lonardi, M., Petroselli, C., Dixon, T., et al. (2023). Effects of glacier retreat upon glacier-groundwater coupling and biogeochemistry in Central Svalbard. J. Hydrology 624, 129894. doi:10.1016/j.jhydrol.2023.129894
Hodson, A. J., and Yde, J. C. (2022). “4.15 - the geochemistry of glacial meltwaters,” in Treatise on geomorphology J. Shroder, and F. Jack 2 (Oxford: Academic Press), 290–304. doi:10.1016/B978-0-12-818234-5.00145-0
Humlum, O., Instanes, A., and Sollid, J. L. (2003). Permafrost in Svalbard: a review of research history, climatic background and engineering challenges. Polar Res. 22, 191–215. doi:10.1111/j.1751-8369.2003.tb00107.x
Kleber, G. E., Hodson, A. J., Magerl, L., Mannerfelt, E. S., Bradbury, H. J., Zhu, Y., et al. (2023). Groundwater springs formed during glacial retreat are a large source of methane in the high Arctic. Nat. Geosci. 16, 597–604. doi:10.1038/s41561-023-01210-6
Lammers, R. B., Shiklomanov, A. I., Vörösmarty, C. J., Fekete, B. M., and Peterson, B. J. (2001). Assessment of contemporary Arctic river runoff based on observational discharge records. J. Geophys. Res. Atmos. 106, 3321–3334. doi:10.1029/2000JD900444
Lauritzen, S., and Bottrell, S. (1994). Microbiological activity in thermoglacial karst springs, south spitsbergen. Geomicrobiol. J. 12, 161–173. doi:10.1080/01490459409377983
Lehn, G. O., Jacobson, A. D., Douglas, T. A., McClelland, J. W., Barker, A. J., and Khosh, M. S. (2017). Constraining seasonal active layer dynamics and chemical weathering reactions occurring in North Slope Alaskan watersheds with major ion and isotope (δ34SSO4, δ13CDIC, 87Sr/86Sr, δ44/40Ca, and δ44/42Ca) measurements. Geochimica Cosmochimica Acta 217, 399–420. doi:10.1016/j.gca.2017.07.042
Leith, T. L., Weiss, H. M., Mørk, A., århus, N., Elvebakk, G., Embry, A. F., et al. (1993). “Mesozoic hydrocarbon source-rocks of the Arctic region,” in Norwegian petroleum society special publications. Editors T. O. Vorren, E. Bergsager, Ø. A. Dahl-Stamnes, E. Holter, B. Johansen, E. Lieet al. (Amsterdam, Netherlands: Elsevier), 1–25. doi:10.1016/B978-0-444-88943-0.50006-X
Levy, A., Robinson, Z., Krause, S., Waller, R., and Weatherill, J. (2015). Long-term variability of proglacial groundwater-fed hydrological systems in an area of glacier retreat, Skeiðarársandur, Iceland. Earth Surf. Process. Landforms 40, 981–994. doi:10.1002/esp.3696
Liljedahl, A. K., Gädeke, A., O’Neel, S., Gatesman, T. A., and Douglas, T. A. (2017). Glacierized headwater streams as aquifer recharge corridors, subarctic Alaska. Geophys. Res. Lett. 44, 6876–6885. doi:10.1002/2017GL073834
Lovell, H., Fleming, E. J., Benn, D. I., Hubbard, B., Lukas, S., and Naegeli, K. (2015). Former dynamic behaviour of a cold-based valley glacier on Svalbard revealed by basal ice and structural glaciology investigations. J. Glaciol. 61, 309–328. doi:10.3189/2015JoG14J120
Macheret, Y., Glazovsky, A., and Lavrentiev, I. (2019). Distribution of cold and temperate ice and water in glaciers at Nordenskiöld Land, Svalbard, according to data on ground-based radio-echo sounding. Bull. Geogr. Phys. Geogr. Ser. 17, 77–90. doi:10.2478/bgeo-2019-0016
Maher, , Hays, T., Shuster, R., and Mutrux, J. (2004). Petrography of lower cretaceous sandstones on spitsbergen. Polar Res. 23, 147–165. doi:10.3402/polar.v23i2.6276
Makarieva, O., Nesterova, N., Post, D. A., Sherstyukov, A., and Lebedeva, L. (2019). Warming temperatures are impacting the hydrometeorological regime of Russian rivers in the zone of continuous permafrost. Cryosphere 13, 1635–1659. doi:10.5194/tc-13-1635-2019
Mallinson, L., Swift, D. A., and Sole, A. (2019). Proglacial icings as indicators of glacier thermal regime: ice thickness changes and icing occurrence in Svalbard. Geogr. Ann. Ser. A, Phys. Geogr. 101, 334–349. doi:10.1080/04353676.2019.1670952
McMurdie, P. J., and Holmes, S. (2013). Phyloseq: an R package for reproducible interactive analysis and graphics of microbiome census data. PLOS ONE 8, e61217. doi:10.1371/journal.pone.0061217
Moorman, B. J., and Michel, F. A. (2000). Glacial hydrological system characterization using ground-penetrating radar. Hydrol. Process. 14, 2645–2667. doi:10.1002/1099-1085(20001030)14:15<2645::AID-HYP84>3.0.CO;2-2
Mutrux, J., Maher, H., Shuster, R., and Hays, T. (2008). Iron ooid beds of the Carolinefjellet formation, spitsbergen, Norway. Polar Res. 27, 28–43. doi:10.1111/j.1751-8369.2007.00039.x
Nuth, C., Kohler, J., König, M., von Deschwanden, A., Hagen, J. O., Kääb, A., et al. (2013). Decadal changes from a multi-temporal glacier inventory of Svalbard. Cryosphere 7, 1603–1621. doi:10.5194/tc-7-1603-2013
Ó Dochartaigh, B. É., MacDonald, A. M., Black, A. R., Everest, J., Wilson, P., Darling, W. G., et al. (2019). Groundwater–glacier meltwater interaction in proglacial aquifers. Hydrology Earth Syst. Sci. 23, 4527–4539. doi:10.5194/hess-23-4527-2019
Oksanen, J., Simpson, G. L., Blanchet, F. G., Kindt, R., Legendre, P., Minchin, P. R., et al. (2022). Vegan: community ecology package.
Parada, A. E., Needham, D. M., and Fuhrman, J. A. (2016). Every base matters: assessing small subunit rRNA primers for marine microbiomes with mock communities, time series and global field samples. Environ. Microbiol. 18, 1403–1414. doi:10.1111/1462-2920.13023
Paradis, E., and Schliep, K. (2019). Ape 5.0: an environment for modern phylogenetics and evolutionary analyses in R. Bioinformatics 35, 526–528. doi:10.1093/bioinformatics/bty633
Pester, M., Friedrich, M. W., Schink, B., and Brune, A. (2004). pmoA-based analysis of methanotrophs in a littoral lake sediment reveals a diverse and stable community in a dynamic environment. Appl. Environ. Microbiol. 70, 3138–3142. doi:10.1128/AEM.70.5.3138-3142.2004
Pohjola, V. A., Moore, J. C., Isaksson, E., Jauhiainen, T., van de Wal, R. S. W., Martma, T., et al. (2002). Effect of periodic melting on geochemical and isotopic signals in an ice core from Lomonosovfonna, Svalbard. J. Geophys. Res. Atmos. 107. ACL 1-1-ACL 1-14. doi:10.1029/2000JD000149
Pollard, W. H. (2005). Icing processes associated with high arctic perennial springs, axel heiberg island, nunavut, Canada. Permafr. Periglac. Process. 16, 51–68. doi:10.1002/ppp.515
Puigdomenech, I., Tullborg, E.-L., Kontula, A., and Lamminmäki, T. (2017). Glacial meltwater and moraine interaction: evolution of near-surface waters at kangerlussuaq, western Greenland. Procedia Earth Planet. Sci. 17, 778–781. doi:10.1016/j.proeps.2017.01.027
Quast, C., Pruesse, E., Yilmaz, P., Gerken, J., Schweer, T., Yarza, P., et al. (2013). The SILVA ribosomal RNA gene database project: improved data processing and web-based tools. Nucleic Acids Res. 41, D590–D596. doi:10.1093/nar/gks1219
R Core Team (2023). The R project for statistical computing. [WWW Document]. URL Available at: https://www.r-project.org/ (Accessed February 19, 23).
Rothfuss, F., Bender, M., and Conrad, R. (1997). Survival and activity of bacteria in a deep, aged lake sediment (lake constance). Microb. Ecol. 33, 69–77. doi:10.1007/s002489900009
Siegenthaler, U., and Oeschger, H. (1980). Correlation of 18O in precipitation with temperature and altitude. Nature 285, 314–317. doi:10.1038/285314a0
Skidmore, M. L., Foght, J. M., and Sharp, M. J. (2000). Microbial life beneath a high arctic glacier. Appl. Environ. Microbiol. 66, 3214–3220. doi:10.1128/AEM.66.8.3214-3220.2000
Smith, L. C., Pavelsky, T. M., MacDonald, G. M., Shiklomanov, A. I., and Lammers, R. B. (2007). Rising minimum daily flows in northern Eurasian rivers: a growing influence of groundwater in the high-latitude hydrologic cycle. J. Geophys. Res. Biogeosciences 112. doi:10.1029/2006JG000327
Stachnik, Ł., Majchrowska, E., Yde, J. C., Nawrot, A. P., Cichała-Kamrowska, K., Ignatiuk, D., et al. (2016). Chemical denudation and the role of sulfide oxidation at Werenskioldbreen, Svalbard. J. Hydrology 538, 177–193. doi:10.1016/j.jhydrol.2016.03.059
St. Jacques, J.-M., and Sauchyn, D. J. (2009). Increasing winter baseflow and mean annual streamflow from possible permafrost thawing in the Northwest Territories, Canada. Geophys. Res. Lett. 36. doi:10.1029/2008GL035822
Stumm, W., and Morgan, J. J. (2012). Aquatic chemistry: chemical equilibria and rates in natural waters. New Jersey, United States: John Wiley & Sons.
Svendsen, J. I., and Mangerud, J. (1997). Holocene glacial and climatic variations on Spitsbergen, Svalbard. Holocene 7, 45–57. doi:10.1177/095968369700700105
Tranter, M., Brown, G., Raiswell, R., Sharp, M., and Gurnell, A. (1993). A conceptual model of solute acquisition by Alpine glacial meltwaters. J. Glaciol. 39, 573–581. doi:10.3189/S0022143000016464
Tranter, M., Sharp, M. J., Lamb, H. R., Brown, G. H., Hubbard, B. P., and Willis, I. C. (2002). Geochemical weathering at the bed of Haut Glacier d’Arolla, Switzerland—a new model. Hydrol. Process. 16, 959–993. doi:10.1002/hyp.309
Wadham, J. L., Bottrell, S., Tranter, M., and Raiswell, R. (2004). Stable isotope evidence for microbial sulphate reduction at the bed of a polythermal high Arctic glacier. Earth Planet. Sci. Lett. 219, 341–355. doi:10.1016/S0012-821X(03)00683-6
Wadham, J. L., Hodson, A. J., Tranter, M., and Dowdeswell, J. A. (1998). The hydrochemistry of meltwaters draining a polythermal-based, high Arctic glacier, south Svalbard: I. The ablation season. Hydrol. Process. 12, 1825–1849. doi:10.1002/(sici)1099-1085(19981015)12:12<1825::aid-hyp669>3.3.co;2-i
Walvoord, M. A., and Striegl, R. G. (2007). Increased groundwater to stream discharge from permafrost thawing in the Yukon River basin: potential impacts on lateral export of carbon and nitrogen. Geophys. Res. Lett. 34. doi:10.1029/2007GL030216
Wartiainen, I., Hestnes, A. G., and Svenning, M. M. (2003). Methanotrophic diversity in high arctic wetlands on the islands of Svalbard (Norway) - denaturing gradient gel electrophoresis analysis of soil DNA and enrichment cultures. Can. J. Microbiol. 49, 602–612. doi:10.1139/w03-080
Whiticar, M. J. (1999). Carbon and hydrogen isotope systematics of bacterial formation and oxidation of methane. Chem. Geol. 161, 291–314. doi:10.1016/S0009-2541(99)00092-3
Wickham, H., Averick, M., Bryan, J., Chang, W., McGowan, L., François, R., et al. (2019). Welcome to the tidyverse. JOSS 4, 1686. doi:10.21105/joss.01686
Keywords: methane, groundwater, Svalbard, glacier, biogeochemistry, cryosphere, hydrology
Citation: Kleber GE, Magerl L, Turchyn AV, Redeker K, Thiele S, Liira M, Herodes K, Øvreås L and Hodson A (2024) Shallow and deep groundwater moderate methane dynamics in a high Arctic glacial catchment. Front. Earth Sci. 12:1340399. doi: 10.3389/feart.2024.1340399
Received: 17 November 2023; Accepted: 23 January 2024;
Published: 07 February 2024.
Edited by:
Patrick G Hatcher, Old Dominion University, United StatesCopyright © 2024 Kleber, Magerl, Turchyn, Redeker, Thiele, Liira, Herodes, Øvreås and Hodson. This is an open-access article distributed under the terms of the Creative Commons Attribution License (CC BY). The use, distribution or reproduction in other forums is permitted, provided the original author(s) and the copyright owner(s) are credited and that the original publication in this journal is cited, in accordance with accepted academic practice. No use, distribution or reproduction is permitted which does not comply with these terms.
*Correspondence: Gabrielle E. Kleber, Z2FrbGUyOTE0QHVpdC5ubw==
Disclaimer: All claims expressed in this article are solely those of the authors and do not necessarily represent those of their affiliated organizations, or those of the publisher, the editors and the reviewers. Any product that may be evaluated in this article or claim that may be made by its manufacturer is not guaranteed or endorsed by the publisher.
Research integrity at Frontiers
Learn more about the work of our research integrity team to safeguard the quality of each article we publish.