 Junchao Cai
 Junping Wang1*
95% of researchers rate our articles as excellent or good
Learn more about the work of our research integrity team to safeguard the quality of each article we publish.
Find out more
ORIGINAL RESEARCH article
Front. Earth Sci. , 19 June 2024
Sec. Geohazards and Georisks
Volume 12 - 2024 | https://doi.org/10.3389/feart.2024.1339169
This article is part of the Research Topic Advances and Applications of Artificial Intelligence and Numerical Simulation in Risk Emergency Management and Treatment, volume II View all 13 articles
For the widespread exposure of toppling deformation phenomena in anti-dip engineering slopes such as hydropower, transportation, and mining, especially deep-seated toppling, these large-scale deep-seated toppling deformations reaching depths of hundreds of meters have become significant geotechnical engineering problems that restrict large-scale engineering construction and require urgent solutions. There are significant differences in the failure characteristics and mechanisms of anti-dip rock slopes under different soft and hard rock conditions. This study, starting from the failure characteristics and mechanisms under different soft and hard conditions of rocks, summarizes two types of toppling deformation: ductile bending deep toppling (DBDT) and brittle fracture shallow toppling (BFST). The UDEC method is used to preliminarily explore the threshold of rock mechanical parameters for these two types of toppling, with 80 MPa (UCS, uniaxial compressive strength) mechanical parameters serving as the preliminary threshold. The results indicate that hard rock undergoes BFST, whereas soft rock undergoes DBDT. The rock mechanical parameters of 100 MPa (UCS) and 20 MPa (UCS) were selected to study the evolution process and mechanism of DBDT and BFST deformations, respectively. Numerical simulation results have innovatively revealed the mechanical behavior characteristics between rock layers during the process of toppling deformation. Because toppling deformation mainly originates from interlayer displacement deformation and intra-layer tensile deformation of rock layers, the interlayer mechanical characteristics are of great significance for understanding the mechanism of toppling deformation. This research can provide a theoretical basis for the stability assessment and development utilization of anti-dip rock slopes and toppled slopes.
Toppling failure occurs in layered or quasi-layered rock masses, which trend parallel to the slope surface, with bending deformation toward the free face. As a typical slope failure mode, this occurs in an increasing number of engineering constructions, such as hydropower, transportation, and mining (Cruden and Hu, 1994; Tamrakar et al., 2002; Goodman, 2013; Hungr et al., 2014; Liu et al., 2016; Huang et al., 2017; Ning et al., 2019; Sardana et al., 2019; Zhu et al., 2020; Zhao et al., 2021; Jensen et al., 2024). The representative examples of toppling slopes include the left bank slope of the Jinping first-level Hydropower Station, the Yinshuigou slope of the Xiaowan Hydropower Station, the right dam shoulder slope of the Huangdeng Hydropower Station, the dam front slope of the Miaowei Hydropower Station, the dam front slope of the Gushui Hydropower Station, the Guobu bank slope of the Laxiwa Hydropower Station, the Cardinal River Coal Mine slope in Alberta, and the open-pit mine slope in Jinchuan.
The large-scale toppling deformation of rock masses with a depth of hundreds of meters has become a major geotechnical engineering problem that restricts the construction of large-scale projects and needs to be solved urgently. Once instability and failure occur, it can pose a threat to the safety of people’s lives and property, bringing about significant disasters to the development of the country (Xia et al., 2019; Tu et al., 2020; Zhao et al., 2021).
There are currently two mainstream classification methods for toppling failure. One of them is the Goodman and Bray (GB) method classification. Goodman and Bray (1976), through extensive case studies and by considering differences in the failure characteristics of toppling deformation, categorized toppling into two major types: primary toppling and secondary toppling. Primary toppling is further divided into three categories based on the deformation and failure modes of rock layers: flexural toppling, block toppling, and block-flexural toppling. Heok and Bray (1981) categorized secondary toppling deformation into five types based on the deformation location and mechanical mode of rock layers: sliding-head toppling, plastic flow toppling, sliding-toe toppling, tension-crack toppling, and sliding-base toppling. In actual practice, toppling slopes often involve a combination of two or more types of failure modes. Many scholars have conducted in-depth research and analysis on its influencing factors, deformation and failure mechanisms, and occurrence conditions. They mostly use a single numerical simulation method or incorporate on-site survey, monitoring, and model experiments. (Wang et al., 1992; Huang et al., 1994; Han and Wang, 1999; Huang, 2007; Huang, 2011; Huang et al., 2017; Cai et al., 2023; Guo et al., 2023; Zhang et al., 2024; Zheng et al., 2024).
Another classification of toppling deformation is summarized by Huang et al. (1994; 2007; 2012; 2017), who have analyzed numerous toppling cases. They classify toppling deformation into three categories from the perspective of genetic mechanisms and evolutionary processes: shallow toppling (brittle fracture toppling), deep toppling (ductile bending toppling), and complex toppling deformation (Figure 1). The brittle fracture shallow toppling (BFST) primarily corresponds to the block toppling and block-flexural toppling of the GB classification. The ductile bending deep toppling (DBDT) mainly corresponds to flexural toppling. Complex toppling mainly corresponds to secondary toppling. Nichol et al. (2002) also mentioned two types of toppling modes: brittle fracture toppling and ductile bending toppling.
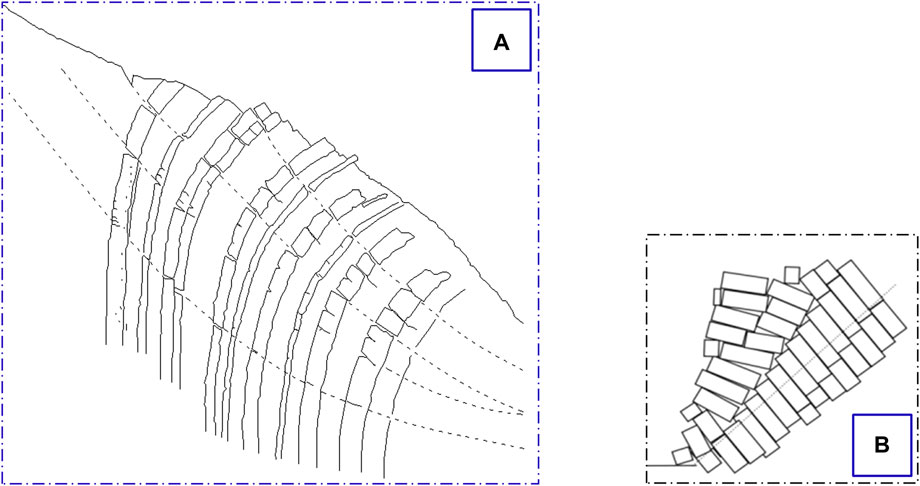
Figure 1. Schematic diagram of toppling model. (A) ductile bending deep toppling model; (B) brittle fracture shallow toppling modl.
As key controlling factors influencing the development of toppling deformation, in addition to the spatial relationship between the rock layer orientation and slope surface, the rock soft and hard conditions are also crucial factors influencing the development of toppling slopes. Complex toppling is primarily influenced by the rock mass structural characteristics of the slope. The BFST and DBDT are significantly influenced by the soft and hard conditions of the rock.
The DBDT primarily occurs in geological formations dominated by soft rocks, including layers with certain thicknesses of hard rocks or interlayers (Figure 1A). It is widely distributed in “flexible” metamorphic rock formations, such as interbedded formations of metamorphic sandstone and slate, carbonaceous slate, phyllite, and other similar formations, as well as interbedded formations of gneiss and schist (Huang et al., 2017; Cai, 2020). Such rock masses are generally characterized by their soft nature behavior, low strength, thin individual layers, steeply dipping slopes, or nearly vertical orientations. They experience bending, creeping, and time-dependent deformation under the influence of sustained gravitational moments. This deformation is characterized by long-term bending toppling with minimal fracturing and exhibits a “flexible” deformation pattern.
The BFST primarily occurs in hard rock formations, such as carbonate rock formations and platy or blocky igneous rock formations subjected to jointing and fracturing (such as thin to moderately thick limestone, sandstone, and densely jointed granite). The essence of deformation in these formations is the “brittle” fracturing of hard rock layers or the “rigid” structural rotation along the bending fracture planes. Due to the brittle characteristics of these rock masses, even slight “bending” deformation can lead to fracture, resulting in a clear bending fracture surface (Figure 1B).
Based on the summary of a large number of case studies and starting from the soft and hard conditions of rocks, this study summarizes two types of toppling deformation: DBDT and BFST. Using the UDEC numerical simulation method, it preliminarily explores the rock mechanical parameter threshold values for these two types of toppling. Based on this, the study investigates the deformation evolution and mechanisms of DBDT and BFST.
The failure characteristics of DBDT and BFST are described through case studies.
As a typical toppling case, the Guobu bank slope of the Laxiwa Hydropower Station is used to illustrate the basic characteristics of BFST. The bank slope comprises ditches and ridges. The lithology of the slope rock mass mainly contains granites, which were formed in the Indosinian Period.
The Guobu bank slope at the Laxiwa Hydropower Station reveals a large-scale BFST. The reason for this is the intense unloading effect on blocky granite due to the down-cutting of the valley. This leads to the dense development of steep unloading fractures parallel slope surface, effectively transforming the blocky rock mass into a “plate-like” structure, resulting in the occurrence of toppling deformation. According to the observed characteristics of toppling deformation and structure, the toppling rock masses can be divided into intensified strong toppling (zone A), strong toppling (zone B), weak toppling (zone C), and loose-tensile fracture rock mass (zone D) (Figure 2). The zoning characteristics of the rock mass in the toppled slope are described as follows (Cai et al., 2019):
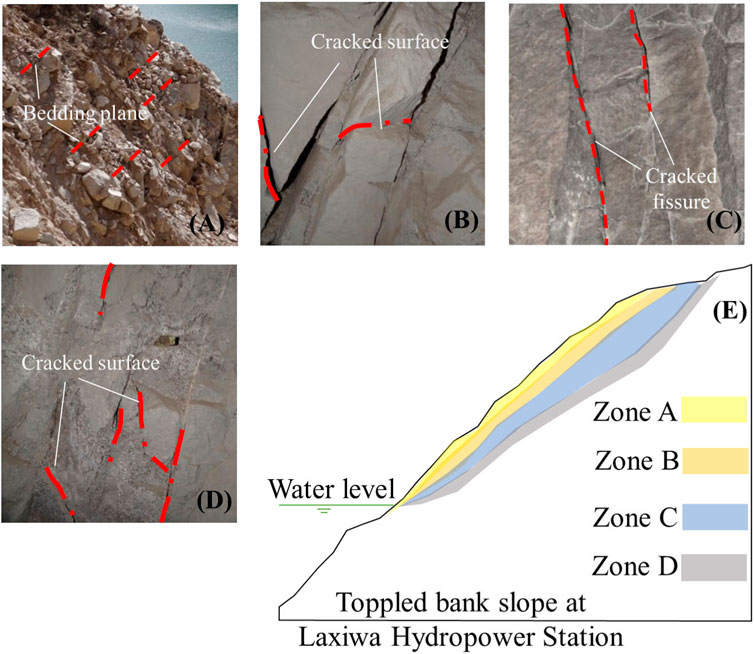
Figure 2. Rock mass of toppling zones of bank slope at Laxiwa Hydropower Station. (A) Zone A rock mass; (B) zone B rock mass; (C) zone C rock mass; (D) zone D rock mass; (E) toppled bank slope section at Laxiwa Hydropower Station.
Zone A—intensified strong toppling zone: the plate-like granite rock mass undergoes intense “cantilever beam”-type toppling and breaking, forming a tension-shear fracturing zone outside the gently inclined slope. The shallow fractured rock mass near the slope surface undergoes gravity overturning along the toppling fracture surface (zone) inclined toward the outside of the slope. This situation mainly occurs in the protruding part of the terrain where the three sides of that face free face (Figure 2A).
This type of rock mass exhibits intense toppling fracture. It generally has embedded fragmentation and blocky structures with some local fragmented structures, and it is in a state of intense unloading and relaxation. The prominent feature of this deformation and fracturing is that unlike the situation where a toppled angle greater than 50° is usually required for whole breaking and fracturing to occur in plate-like metamorphic rock mass, the plate-like granite rock mass begins to experience fracturing at a toppled angle exceeding 18°, with overall breaking and fracturing occurring at around 35°. In zone A, rock masses after toppling and fracturing experience partial collapse and destabilization. Most of them remain in a “stacked” shape on the shallow surface of the slope, typically in a state of blocky fractures or disintegration. This situation often leads to shallow stability issues of the toppled slope.
Zone B—strong toppling zone: toppling deformation results in tension cracks between granite rock slabs, resulting in wide tension cracks. The rock slabs are partially fractured and broken, and the variation of toppled angle generally ranges from 10° to 15°. The rock mass undergoes tensile and relaxation deformation, and the bedding plane generally undergoes relatively strong tensile deformation, with an overall blocky structure and locally embedded fragmented structure. The rock mass is generally under overall strong unloading and local weak unloading, with relatively poor integrity (Figure 2B).
Zone C—weak toppling zone: the toppled angle of the granite rock slabs in this zone is very small, less than 5°, or almost non-existent. There are only tensional fractures occurring between rock slabs, and within rock slabs, there are localized minor tensile fractures (fractures within the rock slabs become visible when the toppled angle reaches 5°). The rock mass is generally in a weak unloading state of tensional fracture, with a blocky structure, and it exhibits relatively good overall integrity. This type of deformation represents a weaker degree of toppling deformation and generally occurs in the deeper parts of the deformed rock mass, which is a relatively stable part within the slope (Figure 2C).
Zone D—relaxation with tensional fractures: this zone represents an elastic relaxation area in the deeper parts of the slope, resulting from the outward toppling effect. No significant toppling is observed; only localized relaxation and tensional fractures along joint surfaces are seen. The rock mass exhibits a blocky-whole structure and is essentially in its original state. This phenomenon is one of the characteristics of the plate-like fractured granite rock mass, which shows its prominent elastic properties (Figure 2D).
The slope in front of the dam at the Miaowei Hydropower Station is a typical soft and hard interbedded structure slope, primarily composed of metamorphic rocks. Using the slope in front of the dam as an example, the basic characteristics of the DBDT are explained.
The exposed bedrock in this slope is the third sub-rock group (J2h2–3) in the upper section of the Jurassic Huakai Left Formation. The rock types mainly include slate, phyllite, schist, and metamorphic quartz sandstone, with alternating soft and hard rock conditions. Due to significant tectonic activity, the structural orientation of the rock layers varies considerably in space, and the overall trend of the normal bedding planes is with a dip angle of 80°–85°. Due to factors such as slope terrain and rock mass structure, the slope in front of the dam experiences strong toppling deformation (Figure 3).
(1) Zone A—toppling and collapse zone
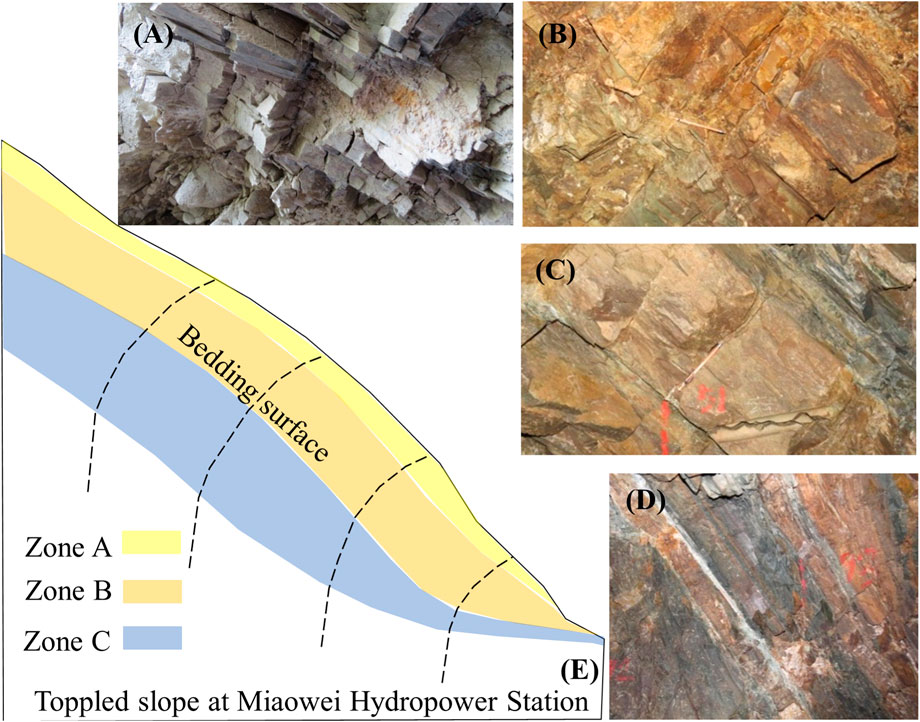
Figure 3. Rock mass of toppling zones of the slope in front of the dam at Miaowei Hydropower Station. (A) Zone A rock mass; (B) zone B upper rock mass; (C) zone B lower rock mass; (D) zone C rock mass; (E) toppled front slope of the dam section at Miaowei Hydropower Station.
When the rock layers topple and rotate significantly, the rock mass undergoes intense fracturing and breaking, forming a tensile fracture zone steep dip outside the slope. There is significant internal rock tensile fracture, strong relaxation, and clear evidence of overhangs, with cracks filled with gravel, angular fragments, and rock debris. For those with severe deformation, the rock mass above the fracture zone is almost separated from the underlying bedrock, and local gravitational fall displacement occurs. This type of fracture is extremely intense toppling deformation and occurs in the shallow surface of the rock mass undergoing toppling deformation (Figure 3A).
(2) Zone B—strong toppling zone
This zone can be further divided into two subsections, upper and lower, based on the intensity of toppling and the different fracturing mechanisms.
Zone B upper-toppling and dislocation zone (Figure 3B).
When the rock layers experience significant toppling, in addition to intense tensile fracturing within the layers, shear deformation (tensile-shear) occurs along gentle dip outer joints of the slope, exhibiting significant development of cutting shear layer. This type of deformation and fracturing belongs to the upper section of intense toppling and occurs in the middle part of the rock mass undergoing toppling deformation.
Zone B lower-toppling and tensile zone (Figure 3C).
With an increasing toppled angle of the rock layers, vertical bedding tensile fracturing begins to develop within the layers or along existing structural planes. This type of tensile fracturing generally occurs in the hard rock layers between two softer rock layers, representing a situation with a relatively strong toppling deformation. Spatially, it occurs in the deeper parts of the toppled slope.
(3) Zone C—weak toppling deformation zone
In this zone, the toppled angle of rock layers is relatively small, which is generally less than 10°. The layered rock masses experience shear sliding along interlayer or relatively weak rock zones. There are no significant fractures within the layers, and only minimal tensile fractures occur within the harder rock layers. This type of situation represents a weak toppling deformation and is typically found in the deeper parts of the slope (Figure 3D).
It is worth noting that the interface between zones B and C is also where the rock layers exhibit the higher curvature of bending toppling. It is the location where rock layer fracturing is most likely to occur. Therefore, the bottom surface of zone C and the top surface of zone B serve as potential sliding surfaces for deep-seated sliding associated with toppling deformation (Figure 3E).
From the existing research works, it is evident that the mechanical properties of the toppled rock mass are closely related to the development characteristics of its toppling deformation. Starting from the soft and hard conditions of rocks, we can summarize the relationship between the characteristics of toppling deformation and the rock mass’s mechanical parameters through typical cases. Table 1 presents the selected typical examples of toppled slopes and their rock mass mechanical parameters.
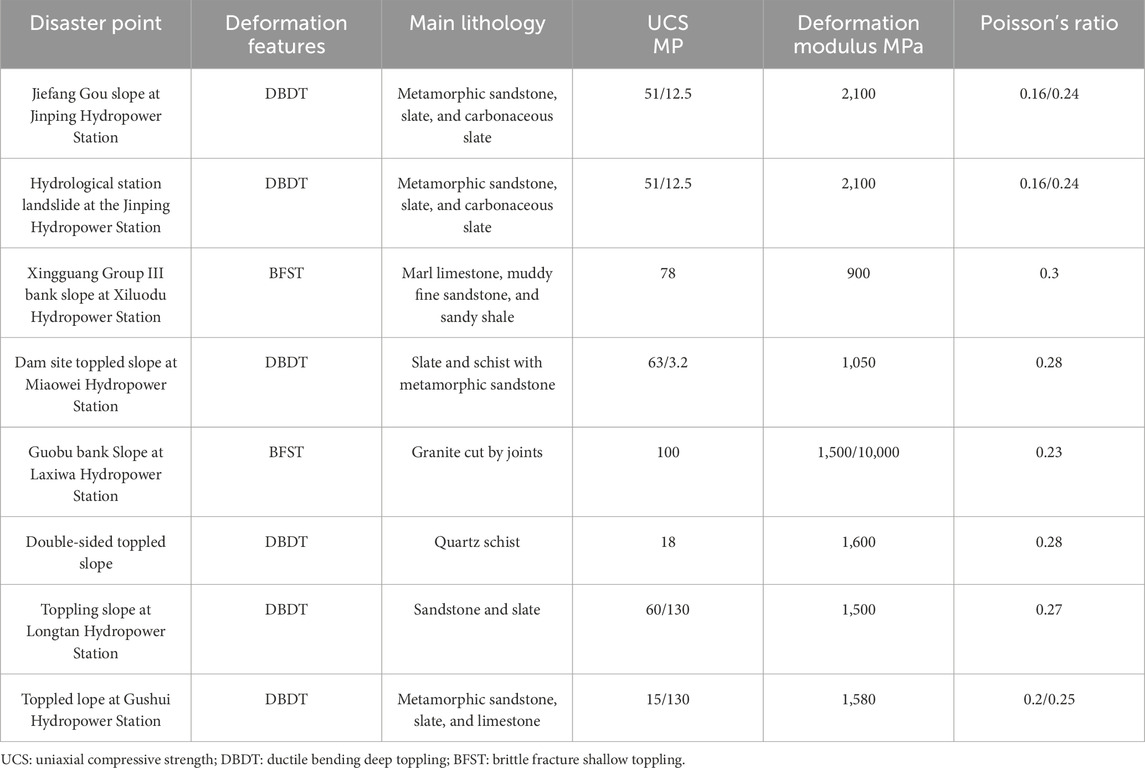
Table 1. Typical cases of toppled slopes and their rock mass mechanical parameters.
According to the standard for engineering classification of rock mass (Ministry of Construction of the People’s Republic of China, 2014), the uniaxial compressive strength (UCS) value is used to differentiate between hard and soft rock for the classification of engineering rock masses. If the UCS is greater than 30 MPa, it is classified as hard rock, and if it is less than 30 MPa, it is classified as soft rock. However, the soft and hard characteristics of toppling rock masses are different from those of engineering rock masses.
The classification of soft and hard rock in toppling rock masses is different from the classification of general engineering rock masses (Table 1). Table 1 provides statistics of rock mechanics parameters for typical toppled rock mass cases, demonstrating significant differences in mechanical parameters (saturated uniaxial compressive strength, elastic modulus, and Poisson’s ratio) between toppled rock masses and general rock masses. Hard rock typically exhibits characteristics of breaking and fracturing, whereas soft or relatively soft rock generally shows “flexible” features, involving ductile deformation, and experiences ductile bending toppling.
This section adopts the discrete element method (UDEC) to establish a numerical simulation model to investigate the mechanical parameter thresholds between BFST hard rock and DBDT soft rock. The discrete element method is highly effective for analyzing toppling deformations in layered and blocky rock masses.
The numerical model will provide a detailed representation of the development and evolution of toppling deformations, including the law of interlayer dislocation and movement and the development of interlayer stresses. The model parameters are chosen with reference to the research parameters of Nichol et al. (2002) to analyze the effects of toppling deformations for different UCS rock mechanical parameter sets. Considering that toppling deformations commonly occur in rock masses with blocky or massive structures, it is assumed to select a block structured rock mass with a rock mass strength index (GSI=62). The UCS values selected for the numerical model are 10, 20, 40, 60, 80, and 100 MPa, representing a range of rock mechanical parameters for the threshold analysis. The parameters used in the models are shown in Tables 2–4.
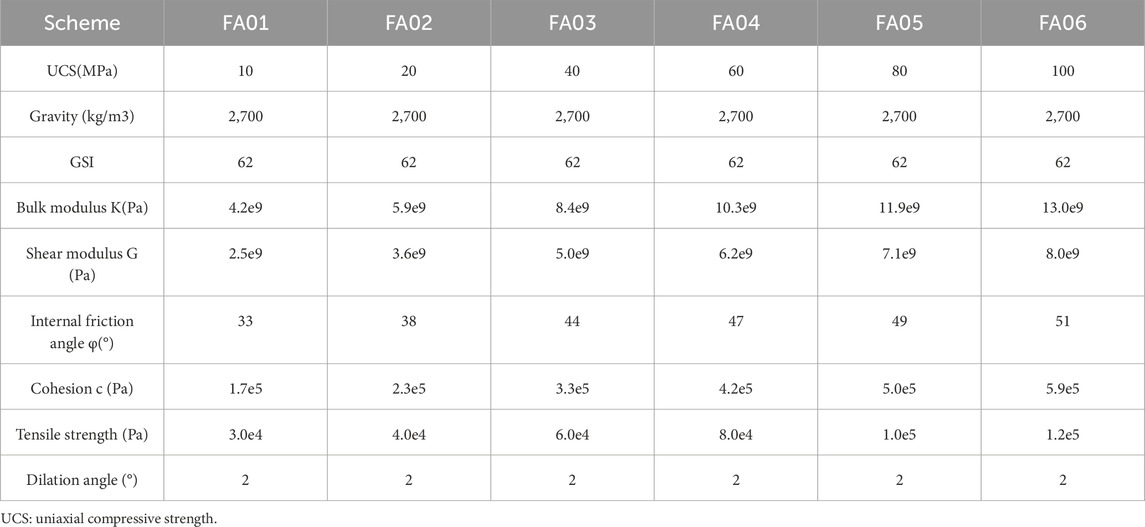
Table 2. Mechanical parameters of rock mass.
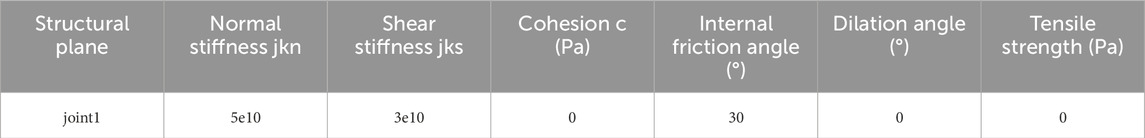
Table 3. Mechanical parameters of the structural plane.
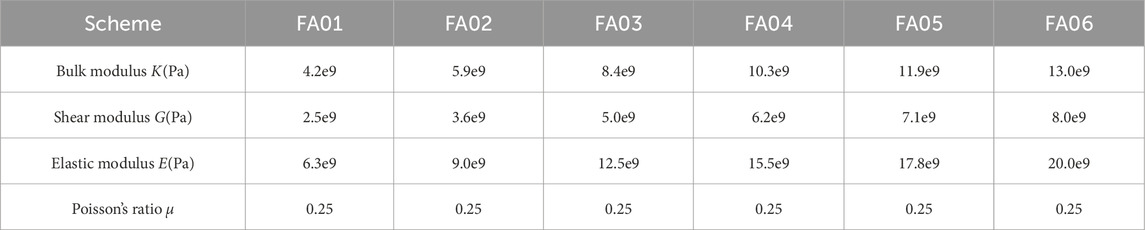
Table 4. Elastic modulus and Poisson’s ratio parameters of rock mass.
The experimental model in this study takes into account the influence of boundary effects on the study area. The simplified model has dimensions of 380 m (horizontal direction) × 200 m (horizontal direction) and includes a single set of bedding planes. The rock layers have a dip angle of 75°, and within the main study area, the spacing between them is 3 m. From the surface of the slope toward the interior of the slope, the spacing gradually increases to 3 m, 12 m, and 48 m. The main research area has a slope height of 80 m. The numerical model created for this study is shown in Figure 4. The boundary conditions of the model are set with velocity constraints on the left and right boundaries (X-direction) and the bottom boundary (Y-direction), whereas the slope surface is considered a free face. The model’s rock materials adopt an elastic–plastic model with the Mohr–Coulomb yield condition, and the stress field in the model only considers the effects of gravity.
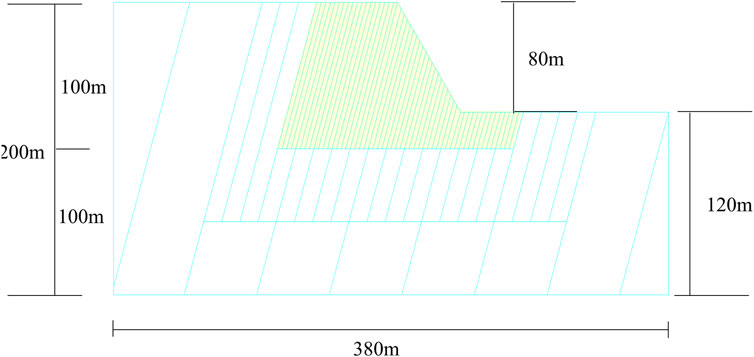
Figure 4. Experimental design model.
The model was computed to obtain its toppling failure process. The same steps of iterations were set (100,000). The final failure patterns for different schemes were overlaid with the original model, as shown in Figure 5.
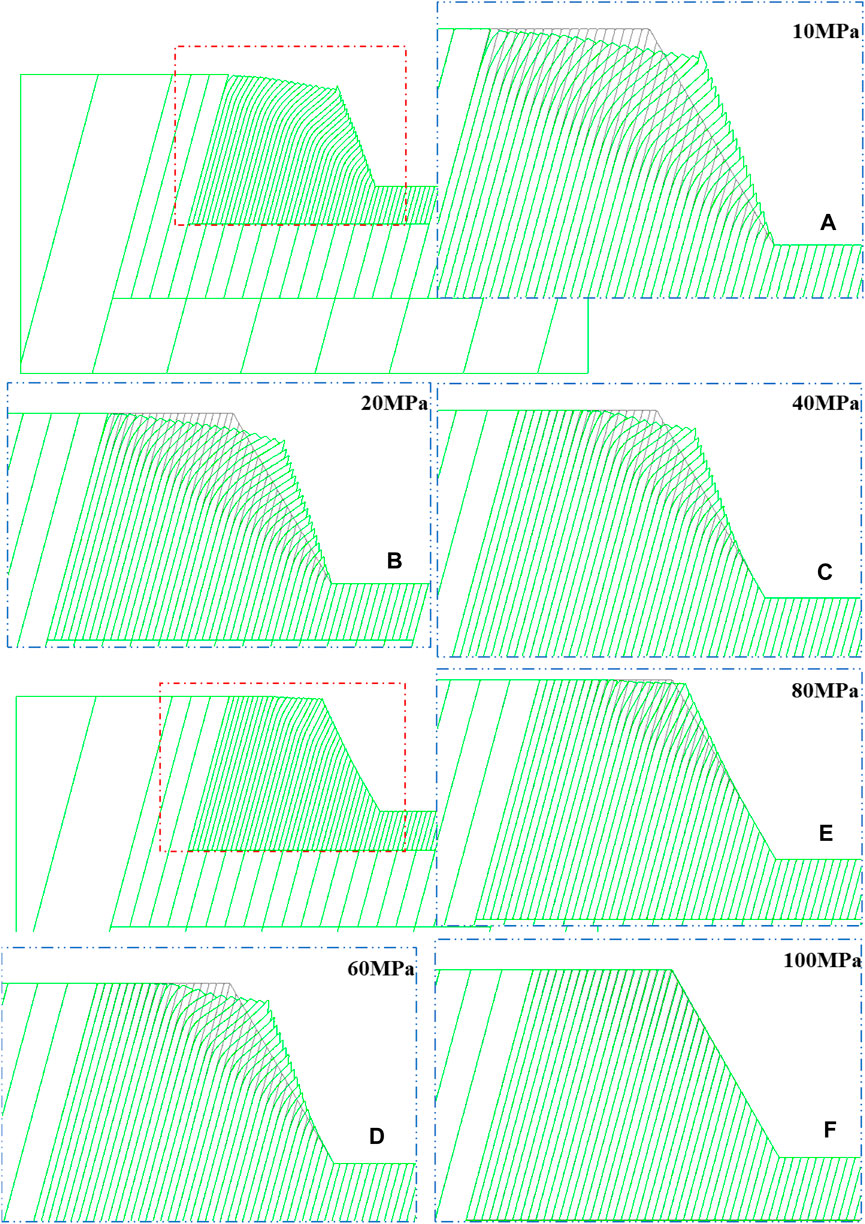
Figure 5. Model overlay effect images of different rock mechanics parameters. (A) FA01, 10 MPa; (B) FA02, 20 MPa; (C) FA03, 40 MPa; (D) FA04, 60 MPa; (E) FA05, 80 MPa; (F) FA06, 100 MPa.
The comparative analysis of overlay effect images for different schemes with varying rock mechanics parameters reveals the following. In the images (Figure 5), the left corner shows the final failure state of the model, while the right corner displays enlarged overlay images of the models before calculation and after failure. The black lines represent the model before calculation, and the green lines represent the final failure state after 100,000 steps.
From Figure 5, it is evident that within a UCS range of 10 MPa–80 MPa, significant bending toppling deformations occur near the crest of the model. As UCS increases, the extent of the toppling deformation and the magnitude of deformation decrease gradually. Specifically, when UCS is 80 MPa, the bending toppling deformations are minimal and not significant. When UCS is 100 MPa, as seen in the local magnification of the deformation overlay images, the deformation values are minimal, and there are no apparent toppling and bending phenomena.
Based on the analysis of the overlay effect images, it can be concluded that the range of rock mechanics parameters corresponding to bending toppling deformations in the model lies within the range of 80 MPa–100 MPa for UCS. The Poisson’s ratio of the rock is assumed to be 0.25, and the range of values for tensile strength and elastic modulus are 0.01 MPa–0.12 MPa and 17.8 MPa–20.0 MPa, respectively. It is reasonable to preliminarily assume that the rock mechanics parameters with UCS = 80 MPa serve as the threshold values that separate soft rock with ductile bending deformations from hard rock with brittle fractures. These threshold values are as follows: tensile strength of 0.01 MPa, Poisson’s ratio of 0.25, and elastic modulus of 17.8 MPa.
As the parametric study through numerical simulations is not comprehensive enough and lacks depth, further calibration is needed through extensive investigations of field cases to confirm whether 80 MPa is indeed the critical threshold for ductile bending toppling deformations. However, for trend analysis in numerical simulations, this threshold can be considered a preliminary reference value for rock mechanics parameters, subject to further validation by additional research.
For the BFST, the rock mechanical parameters are chosen with UCS = 100 MPa.
The experimental design considered that the UDEC calculation process cannot simulate block self-fracture breaking. We determine bending fracture based on the plastic zone of tension failure, and a verification model for rock tensile failure was chosen to reveal the tensile fracture process in brittle fracturing toppling failure (Cai et al., 2020).
The approach for brittle fracturing toppling failure is to insert a stepped fracture plane based on the depth of toppling fracture. The depth of fracture is determined according to the mechanical analysis (Cai et al. 2022). To analyze the mechanical behavior characteristics throughout the development of toppling deformation, multiple levels of fracture depths are inserted, mainly to capture tensile failure in the plastic zone of the model.
After calculating 100,000 steps for the BFST model, there were no significant macroscopic flexible toppling deformations or signs of failure. On examining the distribution of the plastic zone, it is apparent that the rock layers have experienced tensile failure. As the UDEC software itself cannot simulate block self-fracture breaking, and to account for the rock’s tensile fracture, fractures are inserted to represent the occurrence of tensile fractures in the model. The depths of these inserted fractures represent multiple levels of toppling fracture depths.
In the model’s slope foot, based on studies of toppling fracture surfaces (Aydan and Kawamoto, 1992), a straight line inclined at an angle of 12° to the plane of the rock layers was chosen as the base sliding surface for the lower sliding area of the slope. This line intersects with the model’s toppling fracture depth. The specific deformation and failure evolution process is described as follows.
The original model underwent 100,000 steps without showing significant macroscopic flexural deformation or signs of failure. However, the displacement vectors during the computation process indicated the toppling deformation of the rock layers, with the horizontal component being significantly greater than the vertical component. The vector’s direction corresponds to the direction of the toppling deformation. With an increase in the number of iterative steps, the values of the displacement vectors gradually increased, changing from 0.08866 m at 10,000 steps to 0.4581 m at 100,000 steps, with the horizontal displacement component increment being larger than the vertical component increment. Figure 6 shows the overlay images of the initial model (in gray) and the certain step model (in green), and a clear comparison of the rock slab deformation before and after also highlights its toppling deformation characteristics.
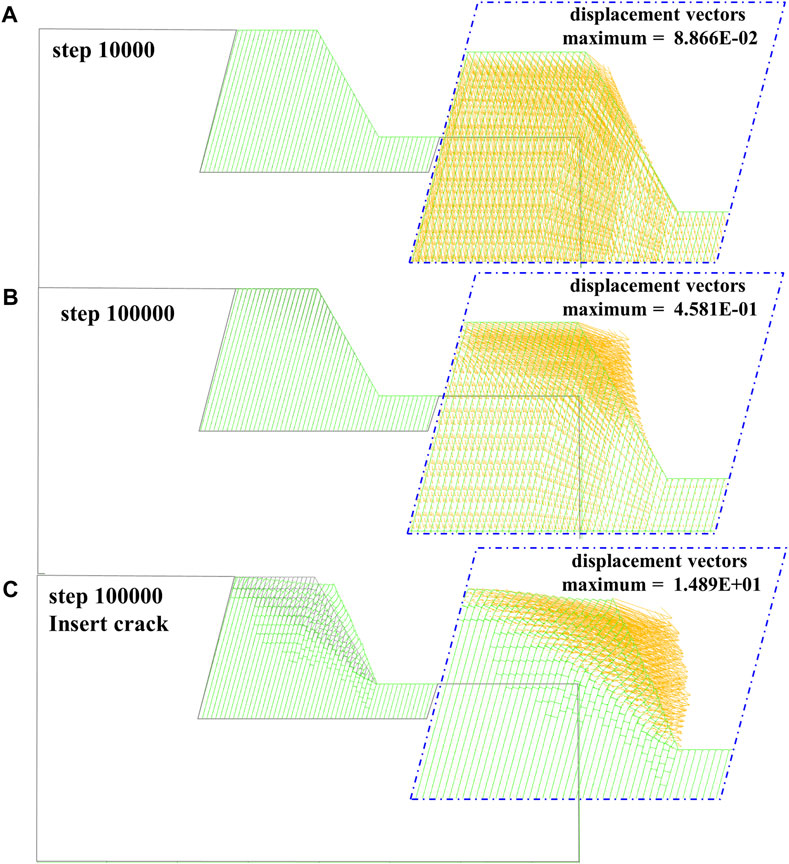
Figure 6. BFST displacement vectors evolution process. (A) Original model 10,000 steps; (B) original model 100,000 steps; (C) inserted cracks model 10,000 steps.
When the iteration reached 100,000 steps, the plastic zone was primarily characterized by tension failure. Those yielded in past elements during the model stress adjustment process were not considered for the current slope failure. These elements on the yield surface or undergoing tension failure is similar in shape to the calculated fracture depth of a single rock slab in the rock layer, approximately in a stepped shape, as illustrated in Figure 7.
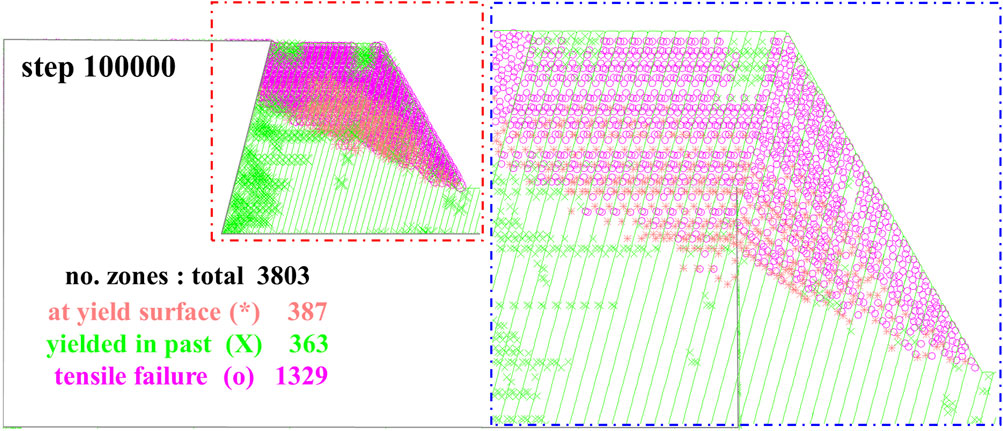
Figure 7. Plastic zone distribution of the original model at 100,000 steps.
Based on the distribution characteristics of the plastic zone after 100,000 steps and the toppling fracture depth (Cai et al., 2022), a new calculation model was constructed by inserting cracks (fracture surfaces). The newly toppled fractured model was then recalculated, and each level of fracture depth at this time was simplified as the first fracture depth.
Figure 6C indicates that the maximum displacement vector of the new model after 100,000 steps is 14.89 m, and the maximum displacement vector occurs at the top corner of the slope, with the toppling deformation being most prominent. At this point, the failure baseline mainly occurs at the interface of the same level fracture depth within the slope.
The results of the BFST original model are shown in Figure 8 to Figure 9.
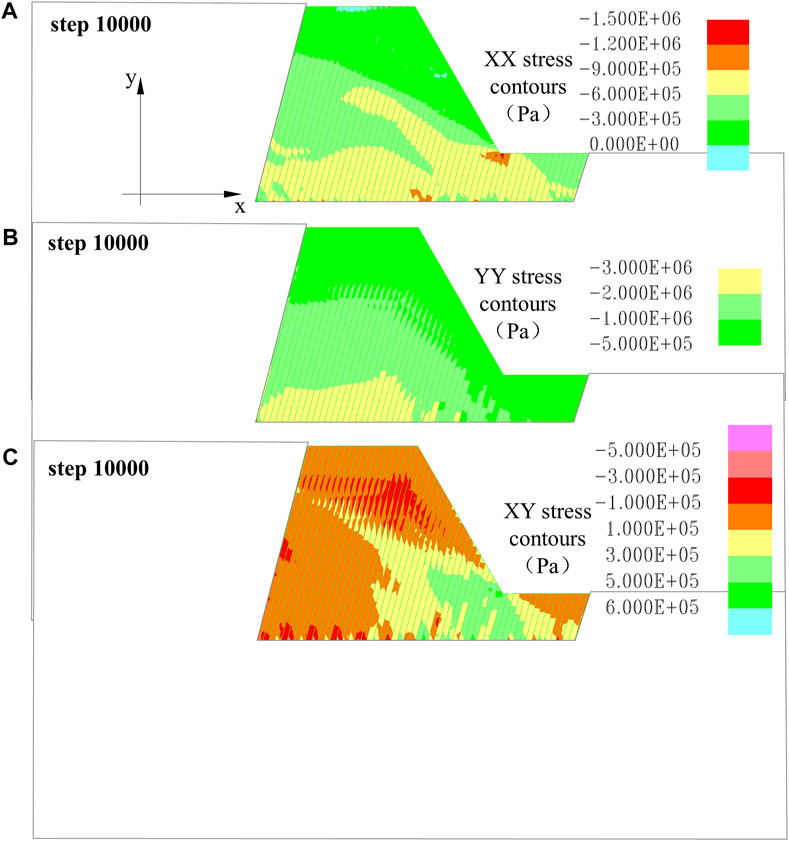
Figure 8. Stress characteristics of the original model evolution process. (A) XX stress contour 10,000 steps; (B) YY stress contour 10,000 steps; (C) XY stress contour 10,000 steps.
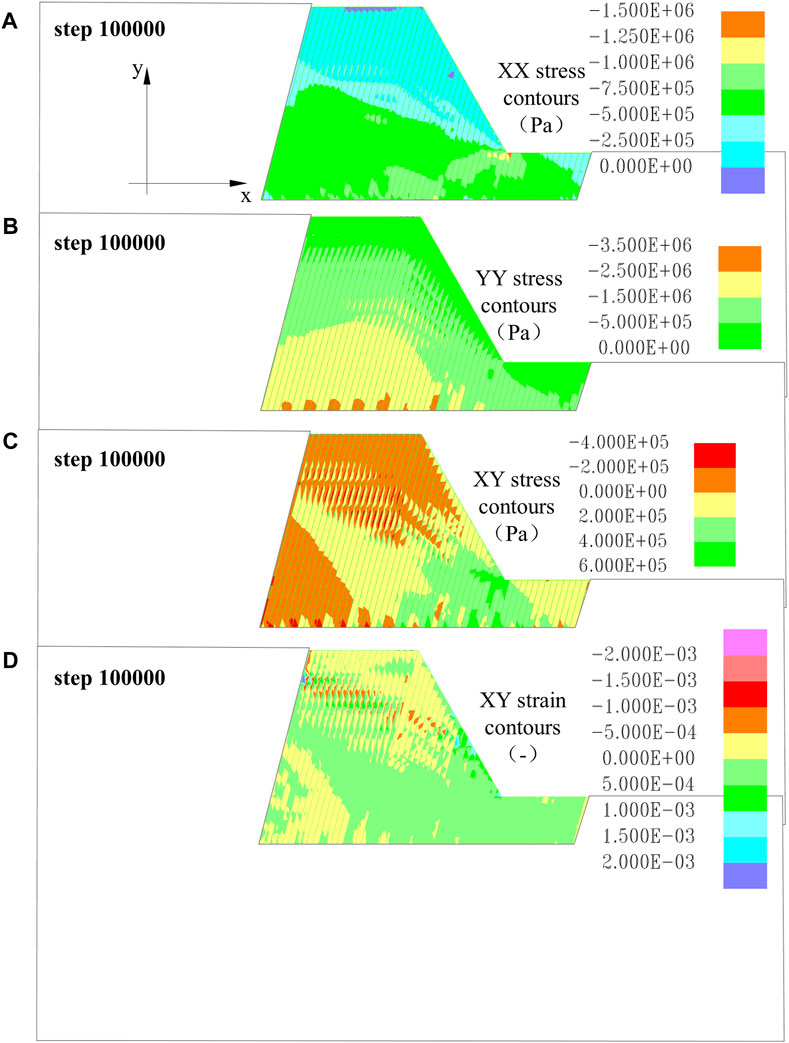
Figure 9. Stress characteristics of the original model evolution process. (A) XX stress contour 100,000 steps; (B) YY stress contour 100,000 steps; (C) XY stress contour 100,000 steps; (D) XY strain contour 100,000 steps.
Figure 8 displays stress distribution after 10,000 iterations, and the Y-direction stress conforms to the typical layer-wise distribution. The X-direction stress contour shows the presence of localized compressive stress at the slope foot, with an area of tensile stress concentration at the slope crest. The XY shear stress contour reveals a concentration of shear stress in a certain depth range at the slope foot, with the maximum shear stress value being 6×10⁵Pa.
When the iteration increases to 100,000 steps (Figure 9), the Y-direction stress shows compressive stress concentration in individual layers at the bottom of the study area, as a result of stress adjustments. The numerical values of compressive stress concentration at the slope foot in the X-direction stress contour have increased from 1.2×10⁶ Pa to 1.5×10⁶Pa, and the scale of tensile stress concentration at the slope crest has also expanded. The range of shear stress concentration at the slope crest in the XY shear stress has increased. Figure 9 indicates that, at this point, the model exhibits relatively small shear strains with an irregular distribution, and there is no apparent potential surface for instability or failure.
After inserting cracks into the newly created model, the stress–strain characteristics of 100,000 steps are as shown in Figure 10. At this point, the rock mass exhibits significant toppling deformation along the toppled fracture surfaces.

Figure 10. Stress characteristics of the inserted crack model evolution process. (A) XX stress contour 100,000 steps; (B) YY stress contour 100,000 steps; (C) XY stress contour 100,000 steps; (D) XY strain contour 100,000 steps.
Figure 10 illustrates the X-direction stress, with compressive stress increasing to 3.75×10⁶Pa at the slope foot. Y-direction stress experiences an increase in compressive stress within the toppled slope along the same level fracture surfaces, with stress values rising to 1–2×10⁶Pa. XY shear stress, centered at the slope foot, forms multiple bands of concentrated shear stress along the same-level fracture surfaces, with shear stress values increasing to 3.5×10⁶Pa. Figure 10 indicates that shear strain mainly occurs within the rock blocks at the slope foot and within the range of the second-level fracture depth. These results suggest that the implantation cracks of the newly created model result in significant toppling deformation and stress concentration related to the toppled fractured surfaces.
After 100,000 iterations of the original model, the model overlay images show that there was no significant deformation. The specific displacement results can be seen in Figure 11. As the steps increase, both the maximum displacements in the X and Y directions slightly increase. At 10,000 steps, the maximum displacements were 0.06 m in the X-direction and 0.06 m in the Y-direction. However, at 100,000 steps, the maximum displacement increased to 0.4 m in the X-direction and 0.16 m in the Y-direction, with the X-direction displacement being greater than the Y-direction displacement change. Overall, the extent of deformation development did not change significantly.
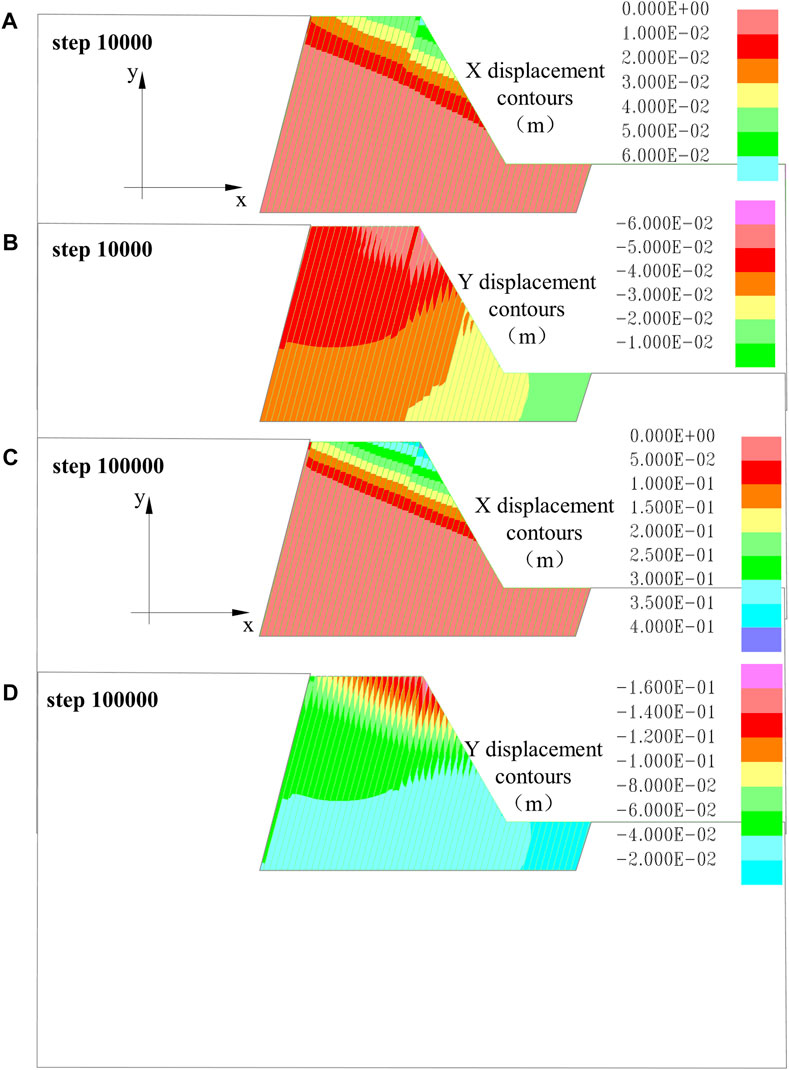
Figure 11. Displacement characteristics of the original model evolution process. (A) XX displacement contour 10,000 steps; (B) YY displacement contour 10,000 steps; (C) XX displacement contour 100,000 steps; (D) YY displacement contour 100,000 steps.
After inserting cracks and reconstructing the model, the overlay image results of the newly created model reveal that significant toppling deformation and failure occur after 100,000 iterations (Figure 12). The results of the iterative calculations indicate that as the steps increase, both the maximum displacements in the Xand Ydirections increase. At 10,000 steps, the maximum displacements were 1.2 m in the X-direction and 0.35 m in the Y-direction. However, at 100,000 steps, the maximum displacements increased to 12.0 m in the X-direction and 6.0 m in the Y-direction. It is evident that the X-direction displacement change is greater than that in the Y-direction, indicating the characteristics of toppling deformation. Additionally, the range of deformation and failure continuously expands.

Figure 12. Displacement characteristics of the inserted crack model evolution process. (A) XX displacement contour 10,000 steps; (B) YY displacement contour 10,000 steps; (C) XX displacement contour 100,000 steps; (D) YY displacement contour 100,000 steps.
When the tensile and shear stress acting on the structural planes exceed their strength, the cracks begin to open. Once the opening exceeds a certain limit, it becomes impossible to obtain information about further opening changes and the stress distribution on the structural planes. The magnitude of the opening obtained in the model is directly proportional to the forces acting on the structural planes within the model. The opening of the structural planes can reflect the stress distribution on the rock layer’s structural planes.
From Figure 13, each red line in the figure has a width equal to “each line thick” shown in the figure. The overall width represents the cumulative opening of multiple lines, and this width signifies the opening of the structural planes. During the development of toppling deformation, the maximum opening of the structural planes in the original model was 0.0159 m at 10,000 steps and 0.1117 m at 100,000 steps, respectively. After inserting the cracks, the maximum opening of the structural planes was 0.2795 m at 50,000 steps and 0.2697 m at 100,000 steps, respectively.
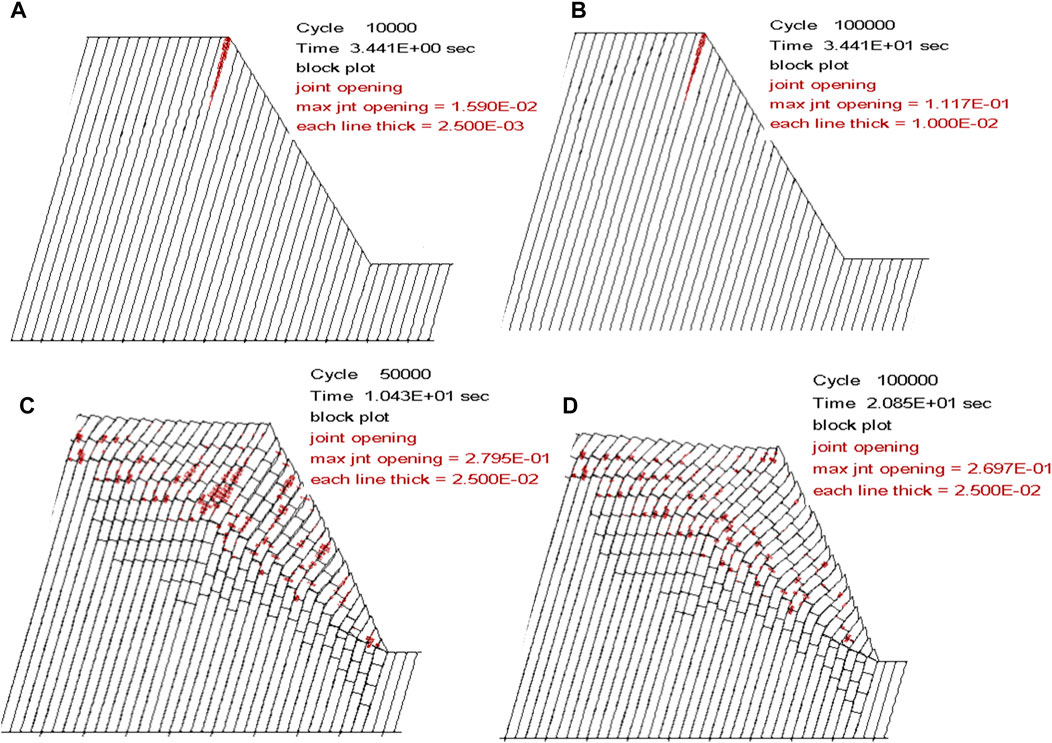
Figure 13. Distribution and variation of structural plane openings. Each red line in the figure has a width equal to “each line thick,” where the overall width represents the cumulative opening of multiple lines, and this width signifies the opening of the structural planes. (A) Original model 10,000 steps; (B) original model 100,000 steps; (C) inserted crack model 50,000 steps; (D) inserted crack model 100,000 steps.
The structural plane opening of the original model initially occurred at the front edge of the slope, and the deformation in the original model was not significant. The opening values were relatively small, with a maximum of 0.1117 m, and there was no extension of the opening of the structural plane.
The structural plane opening of the inserted cracks model was larger, and the opening phenomenon is significant. Additionally, the pre-existing opening of the structural planes extended into the deeper slope. The opening of the structural planes often occurred near the root of the toppled fracture surfaces. The main reason was the rotational deformation of rock blocks after the fracture, which resulted in non-coordinated deformation between the blocks, leading to the formation of open spaces near the fracture surfaces and in triangular areas above the fracture surfaces. As the toppling deformation continued, some of the local openings closed.
The toppling deformation originates from the interlayer shear displacement, and the development of interlayer shear displacement can reflect the displacement characteristics of toppling deformation. From Figure 14, it is evident that each red line has a width equal to “each line thick,” as shown in the figure. The overall width represents the cumulative width of multiple lines, and this width signifies the value of shear displacement of the structural planes.
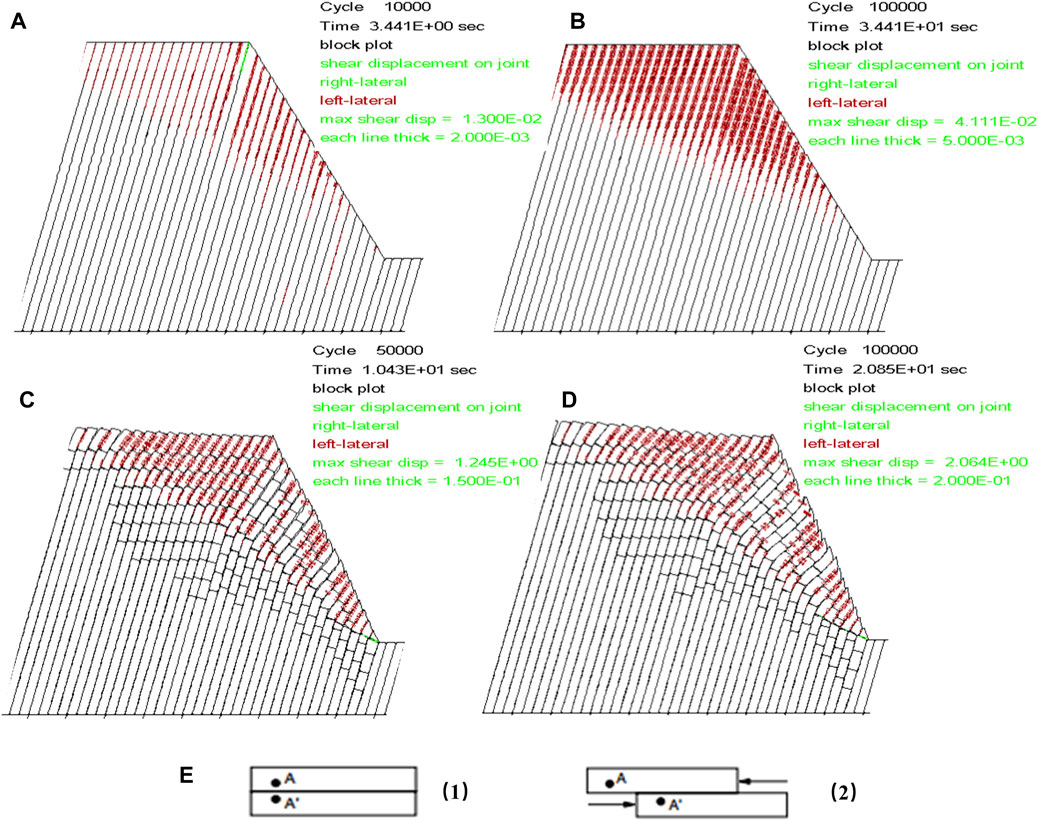
Figure 14. Distribution and variation of shear displacement on structural planes. Each red line has a width equal to “each line thick,” where the overall width represents the cumulative width of multiple lines, and this width signifies the value of shear displacement of the structural planes. (A) Original model 10,000 steps; (B) original model 100,000 steps; (C) inserted crack model 50,000 steps; (D) inserted crack model 100,000 steps; (E) definition of shear displacement direction, two points A and A′, before separation (1), after separation (2); left lateral shear displacement is the left side of A at the original corresponding point after separation.
During the development of toppling deformation, the maximum shear displacement of the structural planes was 0.013 m at 10,000 steps and 0.0411 m at 100,000 steps in the original model. The maximum shear displacement of the structural planes was 1.245 m at 50,000 steps and 2.064 m at 100,000 steps in the inserted cracks model.
Overall, the original model exhibited insignificant shear deformation, with relatively small maximum shear displacement values, reaching a maximum of 0.0411 m. There is no significant extension of shear displacement along the structural planes. The shear displacement of the structural planes was larger, and shear dislocation was more pronounced in the inserted cracks model.
For the DBDT, the rock mechanical parameters are chosen with UCS = 20 MPa. The DBDT takes into account the development characteristics of the plastic zone, the distribution law of shear strain, and the curvature of rock slabs comprehensively. Different bending curvature values are selected to insert cracks instead of potential bending fracture surfaces to reconstruct the model for the toppling failure process analysis.
After calculating 100,000 steps, significant macroscopic flexible deformation becomes apparent, and the rock layers exhibit notable tensile failure. The multiple fracture depths for toppling are expressed through the depth of inserted cracks. Simultaneously, considering the maximum tensile strain characteristics, the deformation trace lines of maximum curvature experience complex tensile and compressive stresses and the deformation failure is severe. These areas serve as toppling bending surfaces and are most likely to evolve into potential sliding surfaces after long-term geological periods. Field investigations suggest that flexible toppling deformation leading to instability and failure typically occurs at moderate to relatively deep levels along the curvature surfaces.
The specific evolution of deformation failure is described as follows.
Figure 15 illustrates the displacement vectors of the original model during the calculation process. The direction of the vectors corresponds to the toppling direction. As the number of steps increases, the values of the maximum displacement vectors gradually increase. The maximum displacement at 10,000 steps is 1.644 m, at 50,000 steps, it is 25.66 m, and at 100,000 steps, it is 25.67 m. Additionally, the increment in the horizontal displacement component is larger than that of the vertical displacement component.
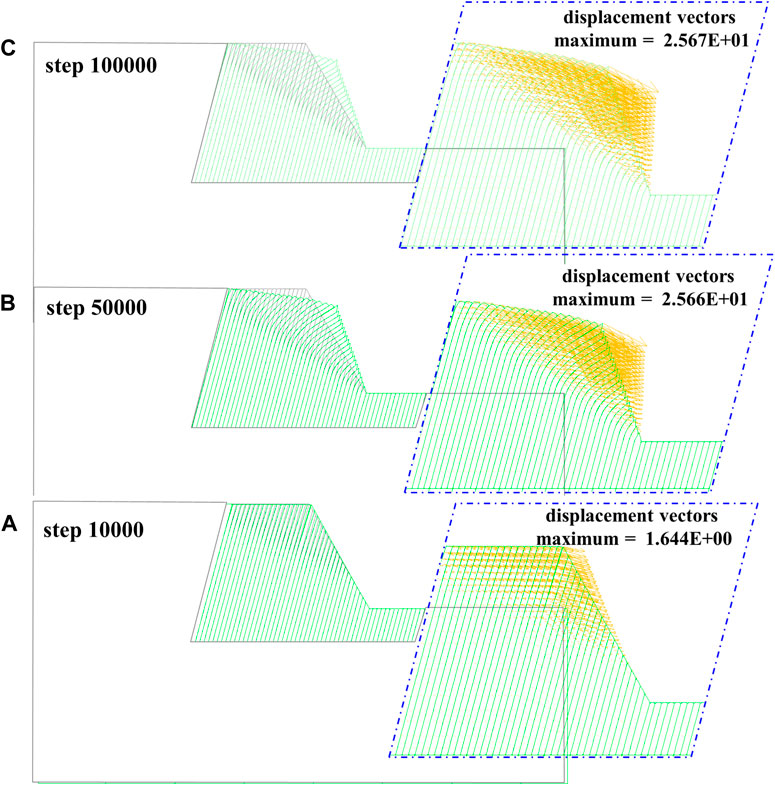
Figure 15. DBDT displacement vectors evolution process. (A) Original model 10,000 steps; (B) original model 50,000 steps; (C) original model 100,000 steps.
At this point, the deformation displacement also tends to stabilize, and it can be considered to have entered the creep stage. Due to the software’s own limitations, the rock blocks will not undergo further fracture. It is assumed that the final failure of the slope will occur along the curved fracture surfaces along the fracture surfaces with approximately equal curvature, and the deepest maximum curvature trace line is inserted as the potential sliding surface.
Figure 16 shows the deformation characteristics of the inserted cracks model during the entire process of 100,000 iterations. The calculation results indicate that as the number of steps increases, the value of the maximum displacement vector gradually increases. The toppling rock slabs begin to slide and become unstable along the inserted potential sliding surface. The maximum displacement at 10,000 steps is 5.935 m, at 50,000 steps it is 26.46 m, and at 100,000 steps, it is 37.27 m. At this point, the maximum deformation displacement occurs at the slope foot.
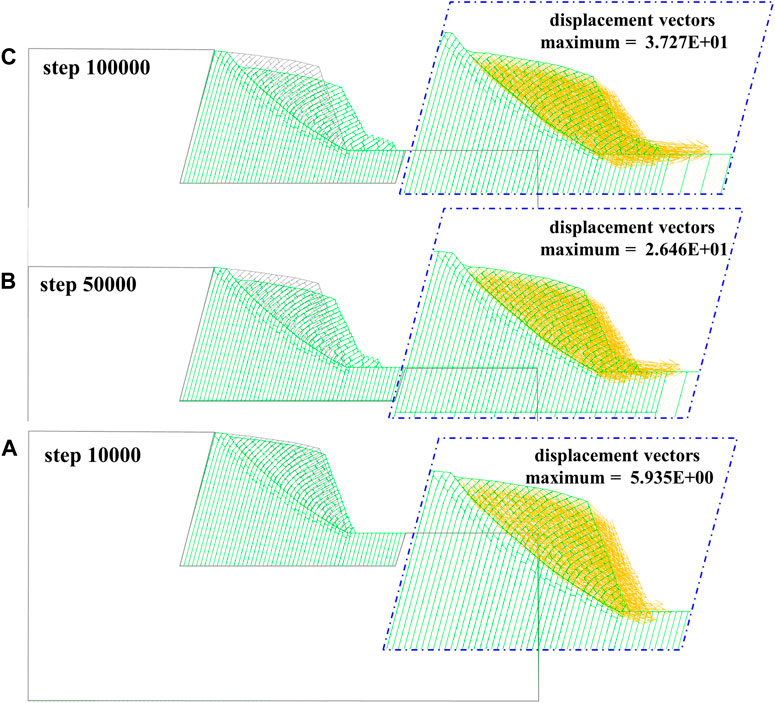
Figure 16. DBDT displacement vectors evolution process. (A) Inserted cracks model 10,000 steps; (B) inserted cracks 50,000 steps; (C) inserted cracks model 100,000 steps.
The results of the original models for the DBDT can be seen in Figure 17 and Figure 18. Figure 17 shows the stress distribution at 10,000 steps, and the stress distribution in the Y-direction conforms to the typical layer-wise distribution. The X-direction stress distribution indicates a concentration of compressive stress in the slope foot, with a maximum X-direction stress value of 3×10⁶ Pa. The shear stress distribution in the XY plane shows a concentration of shear stress in the slope foot, with a maximum shear stress of 1.5×10⁶ Pa. When it reaches 100,000 steps, the X-direction stress distribution in the slope foot exhibits a higher concentration, increasing from 3.0×10⁶ Pa to 4.0×10⁶ Pa.
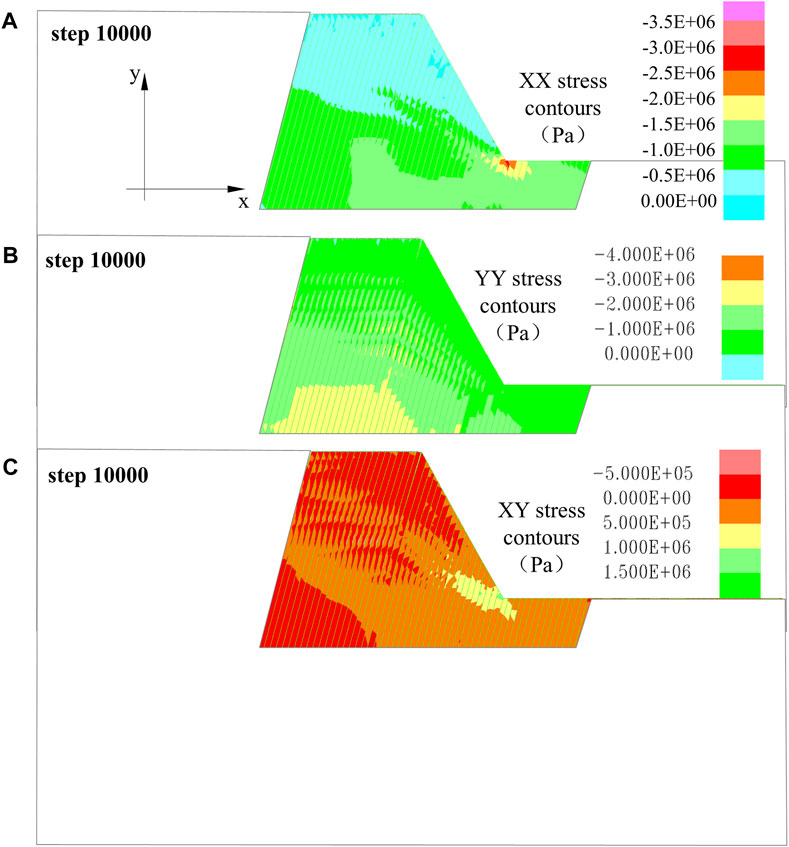
Figure 17. Stress characteristics of the original model evolution process. (A) XX stress contour 10,000 steps; (B) YY stress contour 10,000 steps; (C) XY stress contour 10,000 steps.
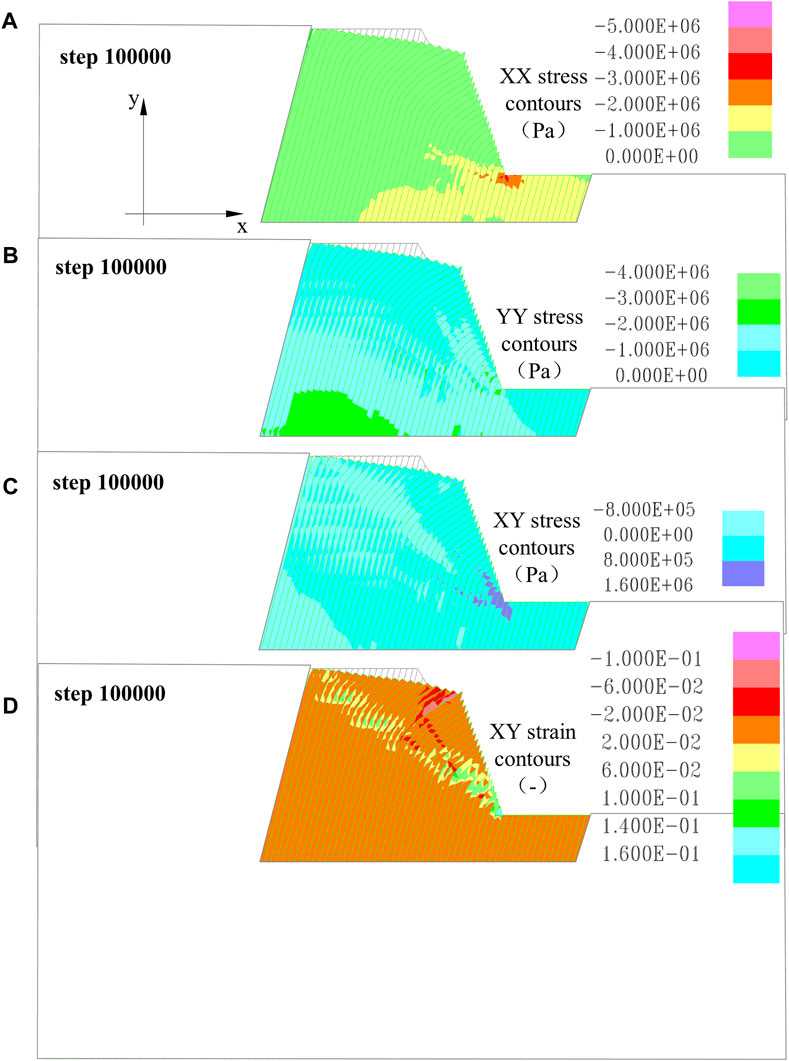
Figure 18. Stress characteristics of the original model evolution process. (A) XX stress contour 100,000 steps; (B) YY stress contour 100,000 steps; (C) XY stress contour 100,000 steps; (D) XY strain contour 100,000 steps.
Figure 18 indicates that the shear strain in the model at 100,000 iterations is nearly continuous, with a likely potential surface for instability and failure that extend along the curvature equivalent points from near the front edge of the slope to the slope crest.
After 100,000 iterations, the rock mass of the inserted cracks model exhibits significant sliding deformation along the trace lines of the curvature equidistant points and the bending surfaces (Figure 19).
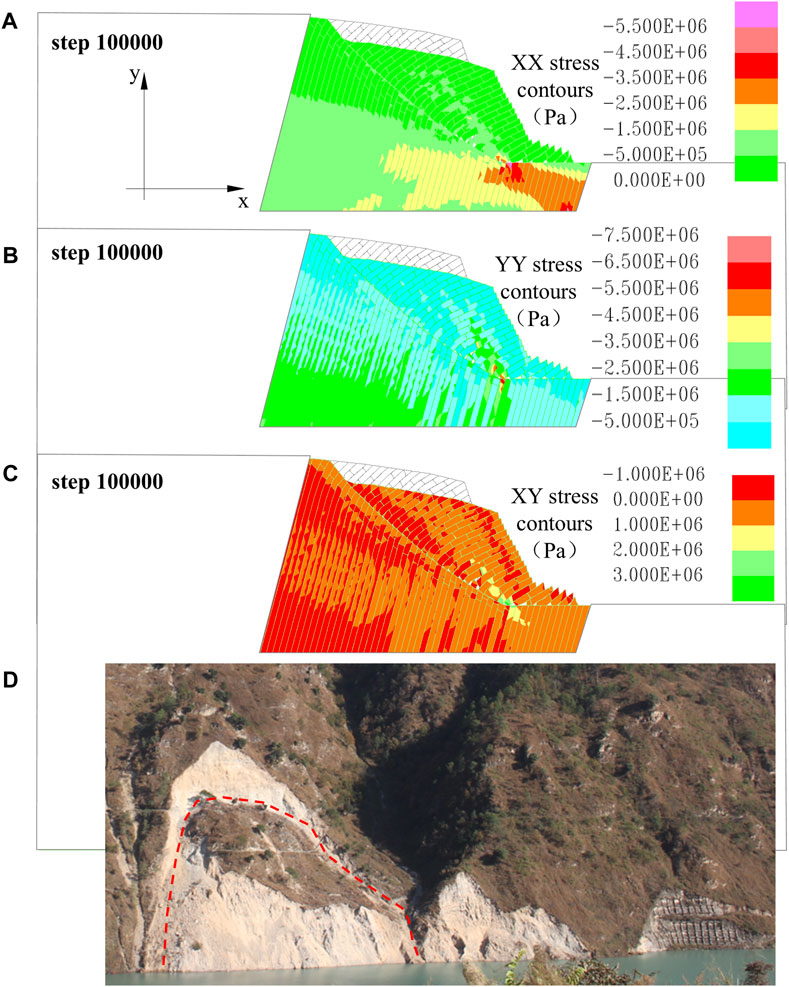
Figure 19. Stress characteristics of the inserted crack model evolution process. (A) XX stress contour 100,000 steps; (B) YY stress contour 100,000 steps; (C) XY stress contour 100,000 steps; (D) accumulation rock mass of toppled bank slopes at Miaowei Hydropower Station.
The compressive stress in the X-direction at the slope foot increases to 5.5×10⁶ Pa. In the Y-direction, the compressive stress in the X-direction near the slope foot experiences an increase along the fracture surfaces, with stress values increasing to 6.5–7.5×10⁶ Pa. Shear stress in the XY plane is centered at the slope foot, forming localized bands of concentrated shear stress along the same level fracture surfaces, with shear stress values increasing to 3.0×10⁶ Pa. The structural effect of the toppled rock mass controls the non-collapse discretization of the accumulation rock mass, as shown in Figure 19C.
The support conditions of the slope foot control the deformation and failure of the toppling slope. If the support of the slope foot is lost, the toppling slope will experience instability and failure along the potential sliding surface with the maximum shear strain zone. On the other hand, when the support conditions at the foot of the slope are intact, the toppling slope experience enters a temporary stable stage until the support conditions of the slope foot are lost (Figure 19D).
As the steps of the original model increase, the maximum displacements in both the X-direction and Y-direction increase (Figure 20). At 10,000 steps, the X-direction displacement is 0.06 m and the Y-direction displacement is also 0.06 m. At 100,000 steps, the X-direction displacement is 0.4 m and the Y-direction displacement is 0.16 m. The displacement in the X-direction is greater than the change in the Y-direction. Overall, the extent of deformation development did not change significantly.
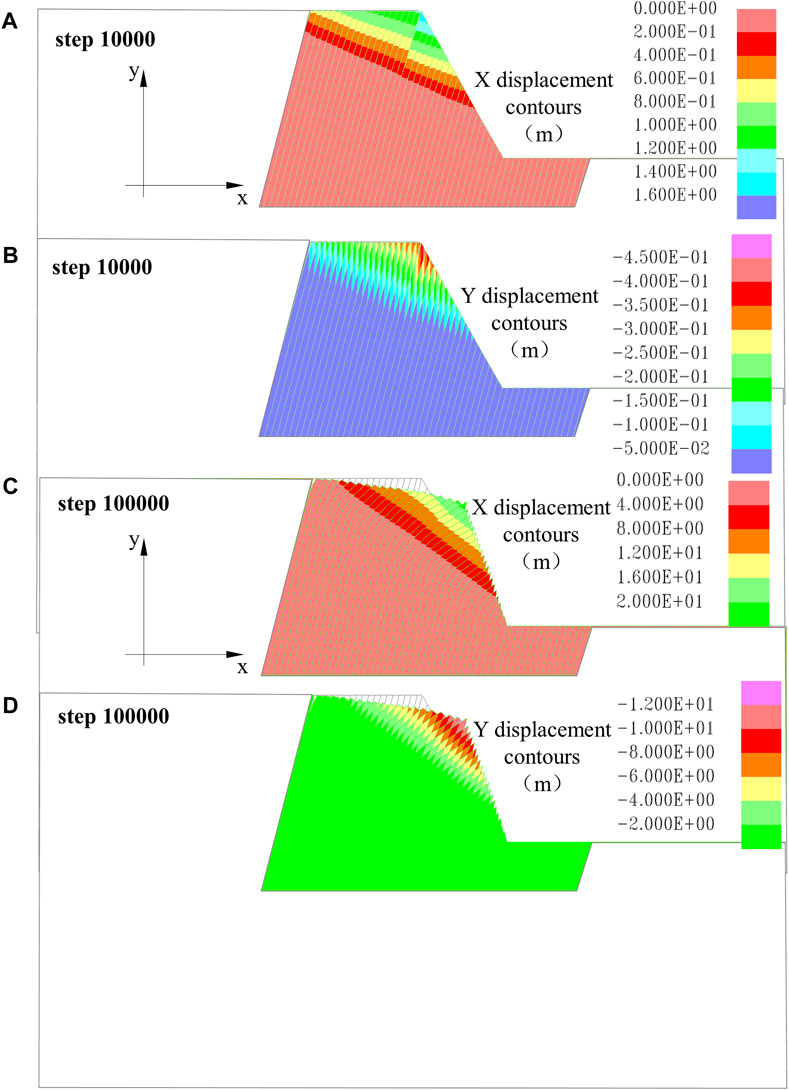
Figure 20. Displacement characteristics of the original model evolution process. (A) XX displacement contour 10,000 steps; (B) YY displacement contour 10,000 steps; (C) XX displacement contour 100,000 steps; (D) YY displacement contour 100,000 steps.
After reconstructing the model, the calculation results indicate that as the steps of the inserted model increase, the maximum displacements in both the X-direction and Y-direction also increase (Figure 21). At 10,000 steps, the X-direction displacement is 5.0 m, and the Y-direction displacement is 4.0 m. At 100,000 steps, the X-direction displacement is 35.0 m, and the Y-direction displacement is 14.0 m. It is evident that in the initial stage of deformation, the maximum displacement occurs at the slope crest, and then the maximum deformation displacement occurs at the slope foot. The deformation development at the slope foot further intensifies the toppling deformation of the toppled rock mass.
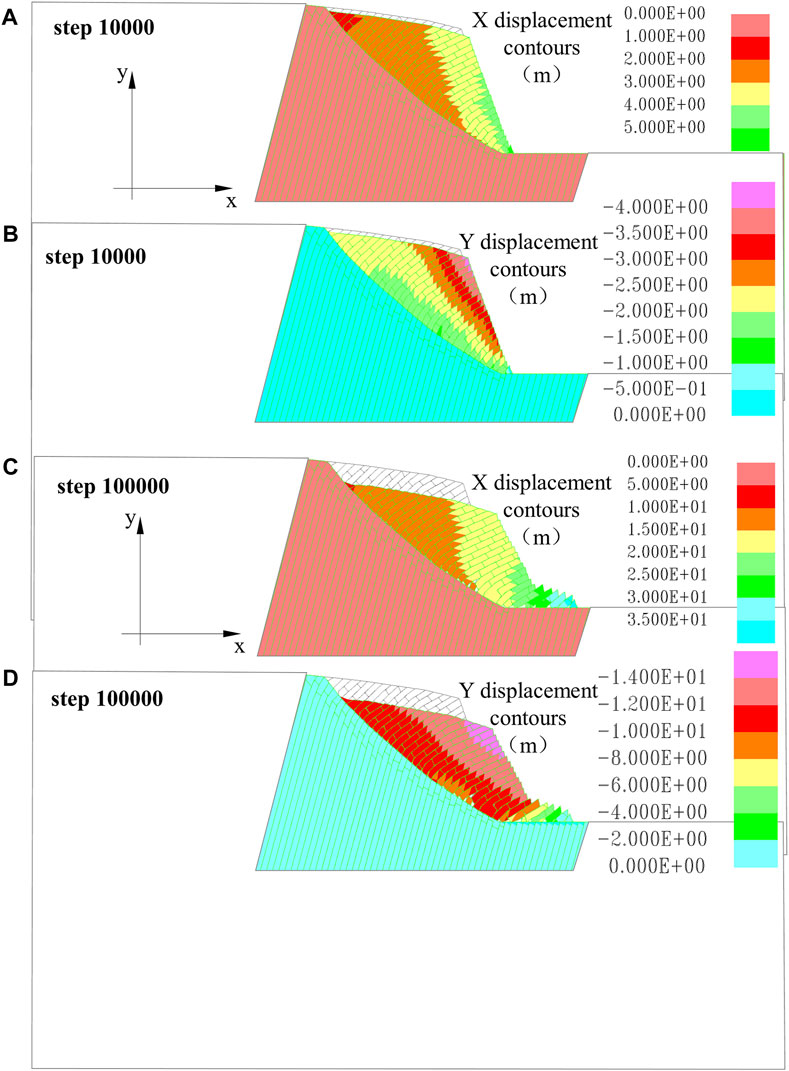
Figure 21. Displacement characteristics of the inserted crack model evolution process. (A) XX displacement contour 10,000 steps; (B) YY displacement contour 10,000 steps; (C) XX displacement contour 100,000 steps; (D) YY displacement contour 100,000 steps.
From Figures 22A,B, it can be observed that the red lines in the figure, with each line having a width equivalent to “each line thick,” represent the cumulative width of multiple lines, signifying the opening degree of the structural planes.
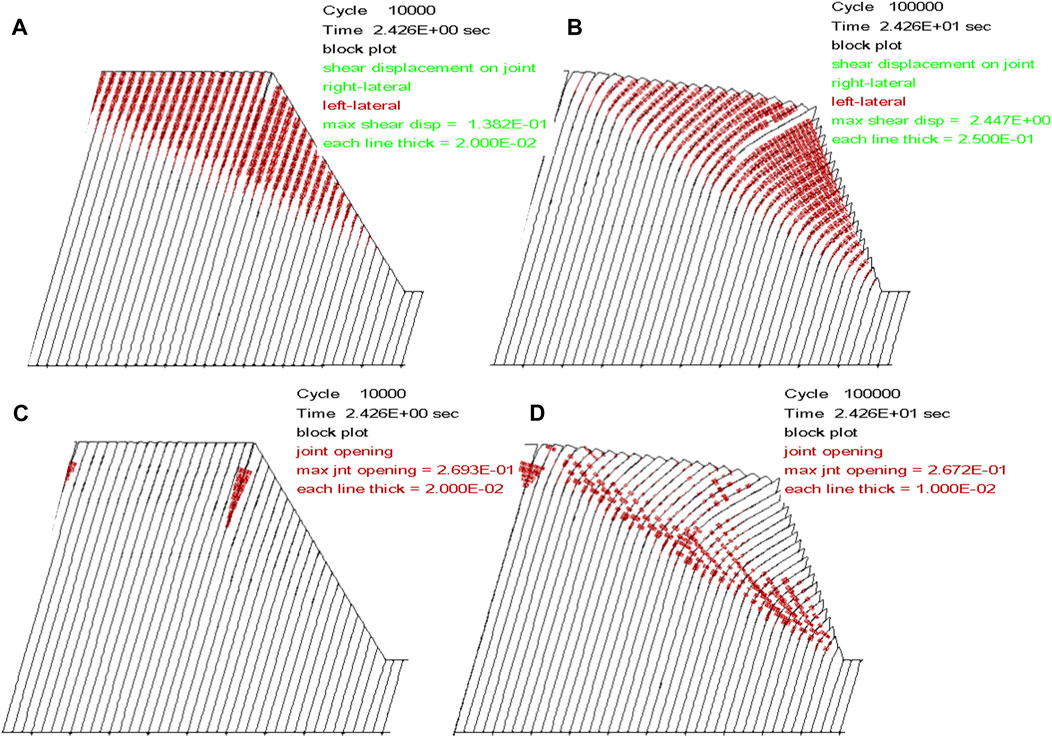
Figure 22. Distribution and variation of structural plane opening and shear displacement on structural planes. Each red line in the figures (A) and (B) has a width equal to “each line thick,” where the overall width represents the cumulative opening of multiple lines, and this width signifies the opening of the structural planes. Each red line in the figures (C) and (D) has a width equal to “each line thick,” where the overall width represents the cumulative width of multiple lines, and this width signifies the value of shear displacement of the structural planes. (A) Original model 10,000 steps; (B) original model 100,000 steps; (C) inserted crack model 50,000 steps; (D) the inserted crack model 100,000 steps.
During the development of toppling deformation, the maximum opening of these structural planes is recorded as 0.2693 m at 10,000 steps and 0.2672 m at 100,000 steps. The structural planes opening of the original model initially occurs at the front edge of the slope, and the original model exhibits a significant toppling deformation effect with relatively large structural planes openings. The existing structural planes opening continue to develop deeper into the model. Structural planes openings mainly occur near the portions with significant curvature and bending in the layers. This is primarily due to the occurrence of detachment of layers as a result of the interlayer bending. At this point, anti-slope scarps are visible at the slope crest and the slope surface, and some of the local openings close with the toppling deformation continuing.
The toppling deformation originates from the interlayer shear displacement, and the development of interlayer shear displacement can reflect the displacement characteristics of toppling deformation. From Figures 22C,D, it is evident that each red line has a width equal to “each line thick,” as shown in the figure. The overall width represents the cumulative width of multiple lines, and this width signifies the value of shear displacement of the structural planes. During the development of toppling deformation, the maximum shear displacement of the structural planes is recorded as 0.1382 m at 10,000 steps and 2.447 m at 100,000 steps in the original model. Overall, the original model exhibits significant shear deformation with relatively large shear displacement of the structural planes, and shear dislocation was more pronounced in the original model.
Generally, hard rock masses typically develop into shallow toppling, primarily characterized by stability issues at shallow depths of toppled slope. Most studies are focused on addressing these concerns of shallow toppling stability. However, rock masses dominated by soft rocks exhibit greater depths of toppling deformation, and once overall instability and failure occur, the engineering hazards are significant (Alejano et al., 2018; Zheng et al., 2018).
The rock mass mainly composed of soft rock undergoes bending and toppling deformation, resulting in certain interlayer openings at the maximum bending position, while other parts exhibit interlayer closures. In contrast, formations dominated by hard rock undergo BFST, with significant rock fragmentation and overhead state at the toppling fracture surface.
Ductile bending toppling deformations in formations dominated by soft rock require a relatively long evolutionary process, whereas brittle fracture toppling in formations dominated by hard rock tends to be sudden. This study is in agreement with the works of research workers namely, Huang et al. (2017) and Huang. (2007). These characteristics also indicate the primary features and mechanisms of toppling deformations under different rock hardness conditions.
Using the UDEC numerical simulation method, we can conclude that the range of rock mechanics parameters correspond to bending toppling deformations within the range of 80 MPa–100 MPa. This 80 MPa can be considered a preliminary reference threshold for two types of toppling; this threshold can be considered a preliminary reference value for rock mechanics parameters of ductile bending deep toppling.
Based on the summary of a large number of case studies, we summarize two types of toppling deformation: DBDT and BFST. The Guobu bank slope at the Laxiwa Hydropower Station reveals a large-scale BFST of blocky granite. The toppling rock masses are divided into intensified strong toppling (zone A), strong toppling (zone B), weak toppling (zone C), and loose-tensile fracture rock mass (zone D) based on the characteristics of toppling deformation and structure. The dam front slope at the Miaowei Hydropower Station is a typical DBDT case with alternating soft and hard rock conditions. The toppling rock masses are divided into toppling and collapse (zone A), strong toppling (zone B), and weak toppling (zone C).
Using the UDEC numerical simulation method, the development process and characteristics of DBDT and BFST were revealed from the displacement vector, overall displacement stress characteristics, interlayer stress, and displacement characteristics, which are in good agreement with the field investigation results.
The original contributions presented in the study are included in the article/supplementary material; further inquiries can be directed to the corresponding authors.
JC: conceptualization, investigation, methodology, software, validation, writing–original draft, and writing–review and editing. JW: conceptualization, methodology, software, supervision, validation, and writing–review and editing. ZL: investigation, methodology, software, validation, and writing–original draft. YK: formal analysis, investigation, methodology, validation, and writing–original draft. LZ: investigation, methodology, validation, and writing–original draft. GQ: conceptualization, investigation, methodology, supervision, validation, and writing–review and editing.
The author(s) declare that financial support was received for the research, authorship, and/or publication of this article. The study is financially supported by the International Scientific and Technological Cooperation Base for Geological Disaster Prevention of Zhejiang Province (IBGDP-2022-04), the National Natural Science Foundation of China (42107169), the Scientific and Technological Project in Henan Province (222102210298), the Opening fund of State Key Laboratory of Geohazard Prevention and Geoenvironment Protection (Chengdu University of Technology, SKLGP 2022K004), and the Opening fund of Key Laboratory of Geological Hazards on Three Gorges Reservoir Area (China Three Gorges University), Ministry of Education (2022KDZ01).
The authors appreciate the linguistic assistance provided by AJE during the preparation of this manuscript. The authors specially thank the expert comments from the reviewers and editors for improving the manuscript.
Author LZ was employed by the Henan Communications Investment Construction Group Co., Ltd.
The remaining authors declare that the research was conducted in the absence of any commercial or financial relationships that could be construed as a potential conflict of interest.
All claims expressed in this article are solely those of the authors and do not necessarily represent those of their affiliated organizations, or those of the publisher, the editors, and the reviewers. Any product that may be evaluated in this article, or claim that may be made by its manufacturer, is not guaranteed or endorsed by the publisher.
Alejano, L. R., Alonso, C. S., Rey, I. P., Arzúa, J., Alonso, E., González, J., et al. (2018). Block toppling stability in the case of rock blocks with rounded edges. Eng. Geol. 234, 192–203. doi:10.1016/j.enggeo.2018.01.010
Aydan, O., and Kawamoto, T. (1992). The stability of slopes and underground openings against flexural toppling and their stabilisation. Rock Mech. Rock Eng. 25, 143–165. doi:10.1007/BF01019709
Cai, J. C. (2020). Research on mechanical behavior and stability of anti-dip rock slope in the whole process of flexible flexural toppling. Chengdu, China: Chengdu University of Technology.
Cai, J. C., Ju, N. P., Huang, R. Q., Zheng, D., Zhao, W. h., Li, L. q., et al. (2019). Mechanism of toppling and deformation in hard rock slope: a case of bank slope of Hydropower Station, Qinghai Province, China. J. Mt. Sci. 16, 924–934. doi:10.1007/s11629-018-5096-x
Cai, J. C., Lu, S. Q., Li, K., Wu, Z., Zhao, R., and Wang, J. (2023). Mechanical mechanism of rock mass slabbing aggravating toppling failure. J. Mt. Sci. 10, 1103249. doi:10.3389/fevo.2022.1103249
Cai, J. C., Zheng, D., Ju, N. P., Huang, R. q., and Zhao, W. h. (2022). Boundary effect of toppling failure based on three-dimensional mechanical model. J. Mt. Sci. 19 (11), 3314–3322. doi:10.1007/s11629-022-7337-2
Cruden, D. M., and Hu, X. Q. (1994). Topples on underdip slopes in the highwood pass, Alberta, Canada. Q. J. Eng. Geol. Hydrogeology 27, 57–68. doi:10.1144/GSL.QJEGH.1994.027.P1.08
Goodman, R. E. (2013). “Toppling- A fundamental failure mode in discontinuous materials Description and analysis,” in 2013 Congress on Stability and Performance of Slopes and Embankments III, Geo-Congress 2013, San Diego, United States, 2348–2378.
Goodman, R. E., and Bray, J. W. (1976). “Toppling of rock slopes,” in Rock engineering for foundations & slopes (Reston, Virginia, United States: ASCE), 201–234.
Guo, H., Yan, C. Z., Zhang, G. H., Xu, R., Wang, T., and Jiao, Y. Y. (2024). Mechanical analysis of toppling failure using FDEM: a case study for soft-hard interbedded anti-dip rock slope. Comput. Geotechnics 165, 105883. doi:10.1016/j.compgeo.2023.105883
Han, B. C., and Wang, S. J. (1999). Mechanism for toppling deformation of slope and analysis of influencing factors on it. J. Eng. Geol. 7 (3), 213–217. doi:10.3969/j.issn.1004-9665.1999.03.004
Hoek, E., and Bray, J. W. (1981). Rock slope engineering. London, UK: Institution of Mining and Metallurgy.
Huang, R. Q. (2007). Large-scale Landslides and their sliding mechanisms in China since the 20th Century. Chin. J. Rock Mech. Eng. 26 (32), 433–454. doi:10.3321/j.issn:1000-6915.2007.03.001
Huang, R. Q., and Li, W. L. (2011). Formation, distribution and risk control of landslides in China. J. Rock Mech. Geotechnical Eng. 3 (2), 97–116. doi:10.3724/sp.j.1235.2011.00097
Huang, R. Q., Li, Y. S., and Yan, M. (2017). The implication and evaluation of toppling failure in Engineering geology practice. J. Eng. Geol. 25 (05), 1165–1181. doi:10.13544/j.cnki.jeg.2017.05.001
Huang, R. Q., Wang, Z. R., and Xu, Q. (1994). A study of failure rules of anti-dip strata slopes Advance of Engineering Geology. Naeem Muhammad, Pakistan: Chengdu:Southwest Jiaotong University Press, 47–51.
Hungr, O., Leroueil, S., and Picarelli, L. (2014). The Varnes classification of landslide types, an update. Landslides 11 (2), 167–194. doi:10.1007/s10346-013-0436-y
Jensen, E. K., Moore, J. R., Geimer, P. R., and Finnegan, R. (2024). Combined ambient vibration and surface displacement measurements for improved progressive failure monitoring at a toppling rock slab in Utah, USA. Front. Earth Sci. 12, 1364653. doi:10.3389/feart.2024.1364653
Liu, M., Liu, F. Z., Huang, R. Q., and Pei, X. j. (2016). Deep-seated large-scale toppling failure in metamorphic rocks: a case study of the Erguxi slope in southwest China. J. Mt. Sci. 13, 2094–2110. doi:10.1007/s11629-015-3803-4
Ministry of Construction of the People’s Republic of China (2014). GB50218T-2014 Standard for engineering classification of rock mass. Beijing: China Construction Industry Press.
Nichol, S. L., Hungr, O., and Evans, S. G. (2002). Large-scale brittle and ductile toppling of rock slopes. Can. Geotechnical J. 39 (4), 773–788. doi:10.1139/t02-027
Ning, Y. B., Zhang, G. C., Tang, H. M., Shen, W., and Shen, P. (2019). Process analysis of toppling failure on anti-dip rock slopes under seismic load in southwest China. Rock Mech. Rock Eng. 52, 4439–4455. doi:10.1007/s00603-019-01855-z
Sardana, S., Verma, A. K., Verma, R., and Singh, T. N. (2019). Rock slope stability along road cut of Kulikawn to Saikhamakawn of Aizawl, Mizoram, India. Nat. Hazards 99, 753–767. doi:10.1007/s11069-019-03772-4
Tamrakar, N. K., Yokota, S., and Osaka, O. (2002). A toppled structure with sliding in the Siwalik Hills, midwestern Nepal. Eng. Geol. 64, 339–350. doi:10.1016/S0013-7952(01)00095-3
Tu, G. X., Deng, H., Shang, Q., Zhang, Y., and Luo, X. (2020). Deep-seated large-scale toppling failure: a case study of the lancang slope in southwest China. Rock Mech. Rock Eng. 53, 3417–3432. doi:10.1007/s00603-020-02132-0
Wang, S. J., Xiao, Y., and Du, Y. L. (1992). The Mechanism of bending creep of bedded rockmass in the slope on the left bank of Longtan dam site in Hongshui River, Guangxi, China. Chin. J. Geol. (S1), 342–352.
Xia, M., Ren, G. M., Li, T. B., Cai, M., Yang, T. J., and Wan, Z. L. (2019). Complex rock slope deformation at Laxiwa Hydropower Station, China: background, characterization, and mechanism. Bull. Eng. Geol. Environ. 78, 3323–3336. doi:10.1007/s10064-018-1371-x
Zhang, B. C., Tang, H. M., Fang, K., Ding, B., and Gong, Q. (2024). Experimental study on deformation and failure characteristics of interbedded anti-inclined rock slopes induced by rainfall. Rock Mech. Rock Eng. 57, 2933–2960. doi:10.1007/s00603-023-03633-4
Zhao, W. H., Zhang, C. Q., and Ju, N. P. (2021). Identification and zonation of deep-seated toppling deformation in a metamorphic rock slope. Bull. Eng. Geol. Environ. 80, 1981–1997. doi:10.1007/s10064-020-02027-y
Zheng, Y., Chen, C. X., Liu, T. T., Zhang, H., Xia, K., and Liu, F. (2018). Study on the mechanisms of flexural toppling failure in anti-inclined rock slopes using numerical and limit equilibrium models. Eng. Geol. 237, 116–128. doi:10.1016/j.enggeo.2018.02.006
Zheng, Y., Wu, R. F., Yan, C. Z., Wang, R., and Ma, B. (2024). Numerical study on flexural toppling failure of rock slopes using the finite discrete element method. Bull. Eng. Geol. Environ. 83, 111. doi:10.1007/s10064-024-03589-x
Keywords: toppling failure, soft and hard rock conditions, deformation characteristics, anti-dip layered rock slope, evolution mechanism
Citation: Cai J, Wang J, Li Z, Kong Y, Zhang L and Qi G (2024) Study on deformation characteristics of toppling failure of anti-dip rock slopes under different soft and hard rock conditions. Front. Earth Sci. 12:1339169. doi: 10.3389/feart.2024.1339169
Received: 05 December 2023; Accepted: 20 May 2024;
Published: 19 June 2024.
Edited by:
Yihuai Zhang, University of Glasgow, United KingdomCopyright © 2024 Cai, Wang, Li, Kong, Zhang and Qi. This is an open-access article distributed under the terms of the Creative Commons Attribution License (CC BY). The use, distribution or reproduction in other forums is permitted, provided the original author(s) and the copyright owner(s) are credited and that the original publication in this journal is cited, in accordance with accepted academic practice. No use, distribution or reproduction is permitted which does not comply with these terms.
*Correspondence: Junping Wang, MjgwMDc2MTIzQHFxLmNvbQ==; Qi Guoqing, ZHIuZ3VvcWluZ3FpQDE2My5jb20=
Disclaimer: All claims expressed in this article are solely those of the authors and do not necessarily represent those of their affiliated organizations, or those of the publisher, the editors and the reviewers. Any product that may be evaluated in this article or claim that may be made by its manufacturer is not guaranteed or endorsed by the publisher.
Research integrity at Frontiers
Learn more about the work of our research integrity team to safeguard the quality of each article we publish.