 Tingting Huang1
 Meiyan Fu
- 1CNPC Chuanqing Drilling Engineering Co., Ltd., Geological Exploration and Development Research Institution, Chengdu, China
- 2College of Energy, Chengdu University of Technology, Chengdu, China
- 3State Key Lab of Oil and Gas Reservoir Geology and Exploitation (Chengdu University of Technology), Chengdu, China
Rock types with similar lithological components and pore structures form the basic units of porous limestone reservoirs; this influences the reservoir evaluation efficiency and water injection development. As the main oil and gas pay zone in central Iraq, the Cretaceous Khasib Formation reservoirs are influenced by deposition, dissolution, and cementation. There is strong vertical heterogeneity in the most important zone of the Kh2 layer, with diverse rock types and complex pore structures. Based on core observation and casting thin-section identification, the Kh2 layer in the study area was divided into eight lithofacies types as argillaceous bioclastic wackestone, planktic foraminiferium wackestone, lamellar bioclastic wackestone, intraclastic–bioclastic packstone, patchy green algae packstone, green algae and pelletoid packstone, benthic foraminiferium–bioclastic packstone, and intraclastic grainstone. Along with the reservoir void space types of the lithofacies, capillary pressure curves are used to quantitatively analyze the throat and pore features of the different lithofacies. From the porosity–permeability cross-plot characteristics and distribution of pore types, 14 petrophysical facies are obtained. Finally, based on the differences between the lithofacies and petrophysical facies, the Kh2 member is divided into 13 rock types with different geological origins and petrophysical characteristics. Among these, the rock type RT1-8-14 has the best and rock type RT1-1-1 has the worst physical properties among the reservoir rock types. This study provides an optimization method for carbonate reservoir evaluation and is expected to be beneficial for efficient development of similar carbonate reservoirs.
1 Introduction
The classification of reservoir types is a key step in carbonate reservoir research. Conventional carbonate reservoir classifications are based on the structural geneses of the carbonate rocks (Aqrawi et al., 2010; Chen et al., 2020; Jiang et al., 2015; Liu et al., 2012; Radwan et al., 2022., Shehata, 2022) and have been widely implemented for decades. Many researchers have proposed other methods, such as petrophysical classification of carbonate rock (Sharland et al., 2001; Saneifar et al., 2015) as well as pore classification based on rock fabric and petrophysics (Tan et al., 2013; Sun, 2020). By improving these two classification methods, scholars have added uniform and patched pore distribution states to obtain 20 rock types (Xiao, 1995). The assembly of lithofacies and pore types is also used to classify carbonate reservoirs (Zhang, 1992; Nabawy et al., 2023). In addition, there are classification methods based on pore structure (Aqrawi et al., 1998; Ausbrooks, 1999; Clerke, 2003; Aqrawi et al., 2010; Burrowes et al., 2010), conventional logging methods (Ross et al., 1995), nearest neighbor (Folk, 1959; Embry, 1971), nuclear magnetic resonance (Folk, 1962; Frank, 2005; Lucia, 2007; Kharrat et al., 2009; Gunter et al., 2014). In general, reservoir classification methods are mostly geological genesis or pore-structure based, and there is no combination of the geological genesis type and petrophysical facies.
The carbonate reservoir of the Cretaceous Khasib Formation in the A oilfield in central Iraq has a strong vertical heterogeneity with complex pore structure and diverse particle types. The heterogeneity of a reservoir is a key element for evaluating the oil zone, which intensively affects the prediction of distribution of the oil and gas reservoirs. Carbonate reservoirs have relatively higher heterogeneities than sandstone reservoirs, and heterogeneity evaluation is therefore important for reservoir development (Sharifi-Yazdi et al., 2020; Radwan et al., 2021; Mohammed et al., 2022). Evaluating the characteristics of carbonate reservoirs with strong heterogeneities has always been a challenge because the porosity and permeability that are influenced by rock physical characteristics often vary greatly in these reservoirs. The traditional geological genesis classification method cannot effectively reflect the differences in reservoir quality.
Therefore, the present study differs from traditional geological genesis classification methods and innovatively classifies porous limestone reservoirs of carbonate reservoirs with strong heterogeneity by considering the comprehensive characteristics of the lithofacies and rock petrophysical facies. The lithofacies are classified by thin sections, and the petrophysical facies are classified on the basis of capillary pressure curve coarsening. The different rock types can reflect the differences in reservoir characteristics more effectively, thereby providing reliable geological bases for oilfield productivity predictions and injection-production plan adjustments.
2 Geological setting
The study area is located along the northern margin of Gondwana, an unstable continental shelf in the northern part of the Persian Gulf Basin, with the Paleo-Tethys Ocean to the northeast (Aqrawi et al., 1998). By the end of the late Paleozoic era, owing to the closure of the Paleo-Tethys Ocean and expansion of the Neo-Tethys Ocean, the Indian Plate (including central and northwestern Iran) separated from the northeastern edge of the Arabian Shield (Lalanne, 2014). At the end of the Permian period, neritic sedimentary basins began to develop along the platform margins of the eastern margin of Iraq, and the Mesopotamian basin began to develop carbonate platform facies (Lalanne, 2014; Moradi, 2017). From the Late Jurassic to Early Cretaceous periods, owing to the strong uplift and corrosion caused by the Larami tectonic activity, there was an unconformity contact between the Cretaceous and Jurassic period formations (Lalanne, 2014). The foreland depression began to appear in the Campanian period of the mid-to-late Cretaceous epoch, indicating the beginning of the closure of the Neo-Tethys Ocean. At the beginning of the Neogene period, the Alpine movement began in response to the collision between the African-Arabian platform and Eurasian continent, reaching peak tectonic activity in the Miocene to Pliocene epochs and resulting in complete closure of the Neo-Tethys Ocean. Then, the Zagros folds rose gradually after closure of the Neo-Tethys Ocean (Lalanne, 2014).
During the Cretaceous period, the depositional environment in the study area inherited the neritic shelf during the late Jurassic period. In the middle of the early Cretaceous period, a huge carbonate ramp developed in the area, and the depositional areas of the coastal plains decreased while those of the shallow-water carbonate rocks expanded at the end of this period. A regional unconformity surface was formed at the same time as the mid-term receding of the Aptian age. In the mid-Cretaceous period, alluvial plains and coastal plains developed in the southwestern part of the Persian Gulf Basin and gradually transitioned to coastal and carbonate platform sedimentary facies to the east (Lalanne, 2014). Rapid transgression occurred at the end of the Albian period, during which the clastic rock deposition period ended and shallow marine carbonate platform was deposited again; this carbonate deposition continued until the Turonian period. By the late Cretaceous period, although the Mesopotamian region had still mainly developed shallow carbonate platforms, the influence of the Alpine movement had already started spreading to the unstable shelf area.
The A oilfield is structurally located on the south-central Mesopotamian basin along the northern edge of the Arabian Plate (Figure 1) (Han et al., 2014; Abdel-Fattah et al., 2022; Wang et al., 2022) and is an important oil-producing area (Liu et al., 2019; Wang et al., 2022). The field is a NE–SW trending broad and gentle long-axis anticline; the long axis of this anticline is approximately 50 km in length, and the short axis is 15–20 km wide (Sherwani and Aqrawi, 1987). The Khasib Formation began to be deposited during the middle Turonian age. Subsidence of the Mesopotamian Belt occurred toward the end of the Permian period under the influence of the early Alpine movement; tectonic activity occurred during the late Cretaceous Turonian age, and foreland basin evolution occurred next during the Paleoproterozoic–Pliocene epoch, resulting in the present tectonic morphology (Aqrawi, 1997; Al-Qayim, 2010; Guo et al., 2014; Zhang et al., 2023). The Upper Cretaceous period can be divided into eight formations as Ahmadi, Rumaila, Mishrif, Khasib, Tanuma, Sadi, Harth, and Shiranish. The Khasib Formation is further divided into four members, namely Kh1, Kh2, Kh3, and Kh4. The Kh2 member is the main zone having a thickness of 42.2–44.6 m and is subdivided into five layers as Kh2-1, Kh2-2, Kh2-3, Kh2-4, and Kh2-5. The Kh2 member is deposited on the carbonate ramp with a small beach scale (Figure 2). From the Kh2-5 to Kh2-1 layers, there is a depositional cycle that is shallower in the upward direction (Figure 3).
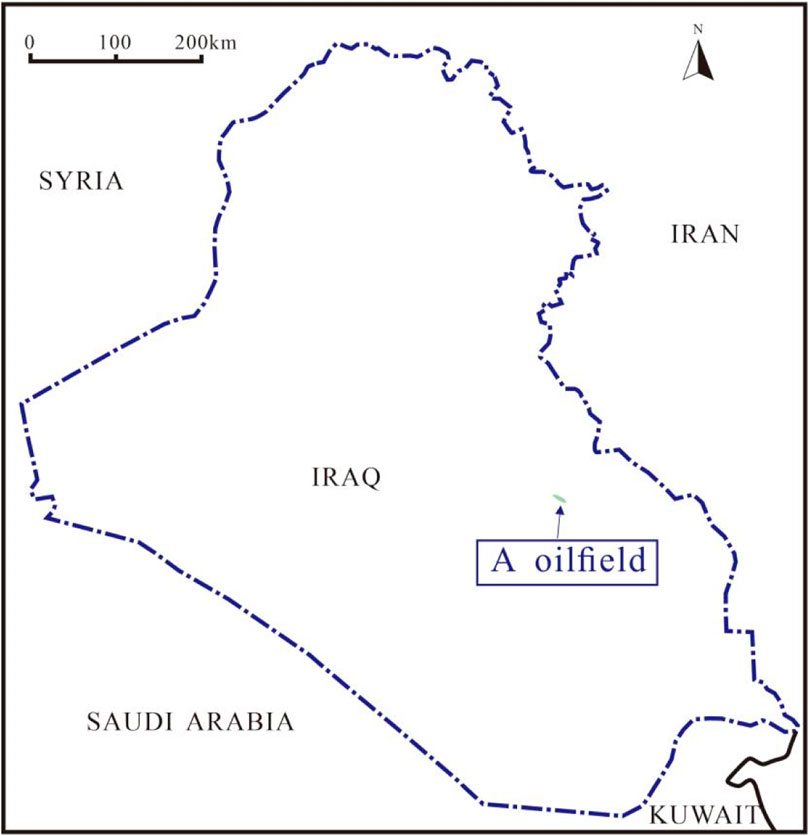
Figure 1. Location map of the study area. The A oilfield is located in central Iraq.
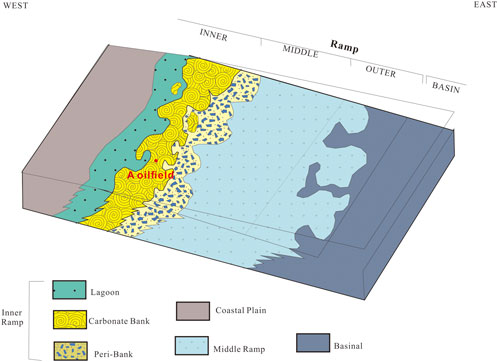
Figure 2. Sedimentary model of the Khasib Formation in central Iraq (modified from Al-Qayim, 2010).The sedimentary facies is a carbonate ramp, which includes an inner ramp, a middle ramp, and an outer ramp. The area of A oilfield was deposited on the inner ramp.
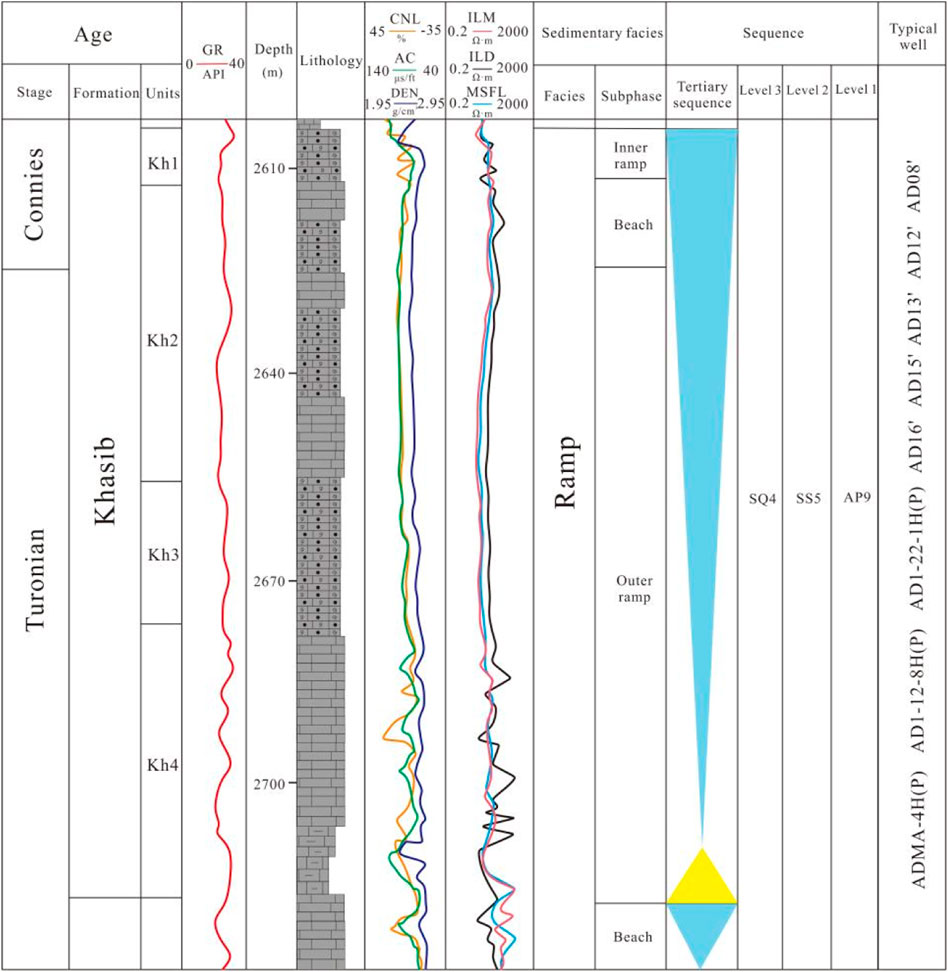
Figure 3. Comprehensive histogram of the stratigraphy and sedimentary facies of the Khasib Formation in the study area (Ling et al., 2024). The sedimentary facies of the upper part of the Kh2 member is the beach in the inner ramp.
3 Samples and methods
A total of 278 cores of the Kh2 member was collected from seven wells in the A oilfield. The petrography and physical properties of these cores were studied in the State Key Lab of Oil and Gas Reservoir Geology and Exploitation, China.
3.1 Petrographic measurements
All thin sections were stained with alizarin red reagent in 0.2% HCl solution (cold) to differentiate dolomite from calcite and impregnated with blue resin under vacuum conditions to characterize the pore structure. Microscopic feature observations were then made using a microscope (DM4500 P, Leica, Germany), and photographs were obtained. Finally, 130 thin sections were observed under a microscope and recorded with the aim of confirming the rock and mineral compositions of the study area. According to Dunham’s classification (Dunham, 1962), the lithofacies were divided after combining the determined compositions of the complex rocks and pores. The porosities of the cores were tested by the alcoholization method with vacuumizing for 72 h. The porosity calculations included the weights of the cores before and after vacuuming. The permeabilities of the cores were measured using the gas method with a confining pressure of 3 MPa. The relative deviations of the porosity determinations were 0.5%–1.5% and those of permeability were ≤10% for low-permeability samples.
Mercury injection tests of 40 cores were performed using an automatic mercury injection instrument (Pore master 60 (GT), Anton Paar, USA), and the capillary pressure curves were used to distinguish the pore structures of the lithofacies. Micro computed tomography (CT, Nano voxel 3,000, Sanying Precision, China) imaging of cores was also performed in this study; here, the CT imaging helps visualize and physically demonstrate the microstructural characteristics inside the rock samples using 256 gray scale levels to differentiate the rock densities of the imaging units, such as fracture, pore, microfracture, secondary dissolved pore, homogeneity, and heterogeneity.
3.2 Petrophysical evaluations
The petrophysical facies show similarities in petrophysical properties in reference to rock units with similar pore types, pore geometries, and throat distribution characteristics, as well as similar porosity and permeability distribution ranges. Rocks formed in the same depositional environment may have different petrophysical properties, while rocks formed in different depositional environments may have similar petrophysical properties, and both are caused by diagenetic alterations. Therefore, a given petrophysical facies can contain one or more petrofacies, and a given petrofacies can contain one or more petrophysical facies.
The division of petrophysical facies is mainly based on the core capillary pressure curve, porosity, and permeability, combined with cast thin sections and other data. Rocks with similar capillary pressure curves, pore–permeability intersection characteristics, and pore types are classified into the same petrophysical facies. Most extant classification methods classify the capillary pressure curves or pore–permeability intersection characteristics of all core samples in a reservoir as a whole. However, for carbonate rocks with strong heterogeneities, the shape of the capillary pressure curve changes greatly along with large changes in the pore and permeability ranges and the intersection points are scattered. Such a classification method can classify many petrophysical facies, but the correlations between the petrophysical facies and logging responses are poor. The classification scheme proposed herein considers a small layer identifiable by well logging as the smallest rock unit. First, the capillary pressure curve, porosity, and permeability of each small layer are coarsened. Then, the roughened capillary pressure curves and pore–permeability intersection features are classified, where the detailed classification process is shown in Figure 4. During classification, rocks with similar capillary pressure curves but having large differences in the pore–permeability intersection characteristics should be categorized into different petrophysical facies because the pore types measured by the two methods are different.
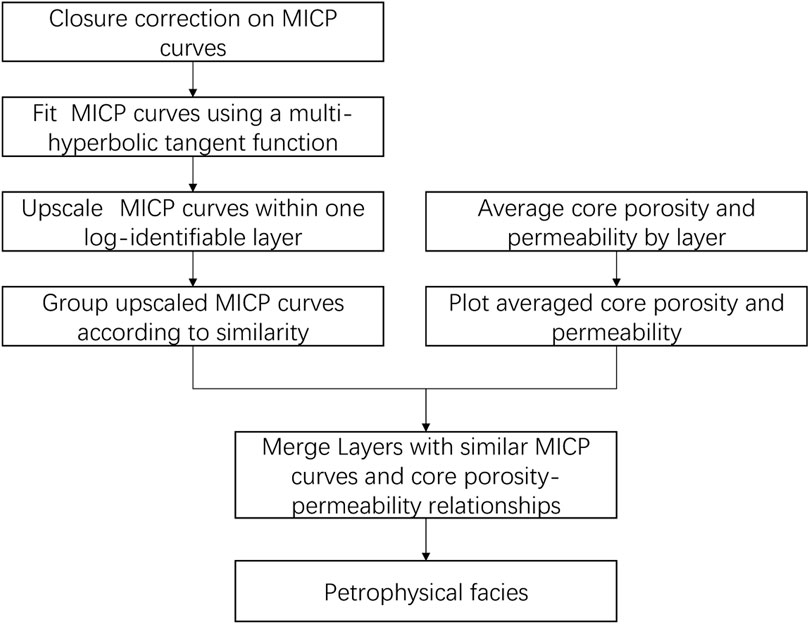
Figure 4. Petrophysical facies division flow diagram.
4 Results
4.1 Lithofacies
Based on observations of the cores and thin sections, the lithofacies characteristics of the Khasib Formation were analyzed. According to the classification by Dunham (1962), lithofacies are divided into eight types according to grain type, sedimentary structure, and logging well: argillaceous bioclastic wackestone, planktic foraminiferium wackestone, lamellar bioclastic wackestone, intraclastic-bioclastic packstone, patchy green algae packstone, green algae and pelletoid packstone, benthic foraminiferium-bioclastic packstone, and intraclastic grainstone (Figure 5).
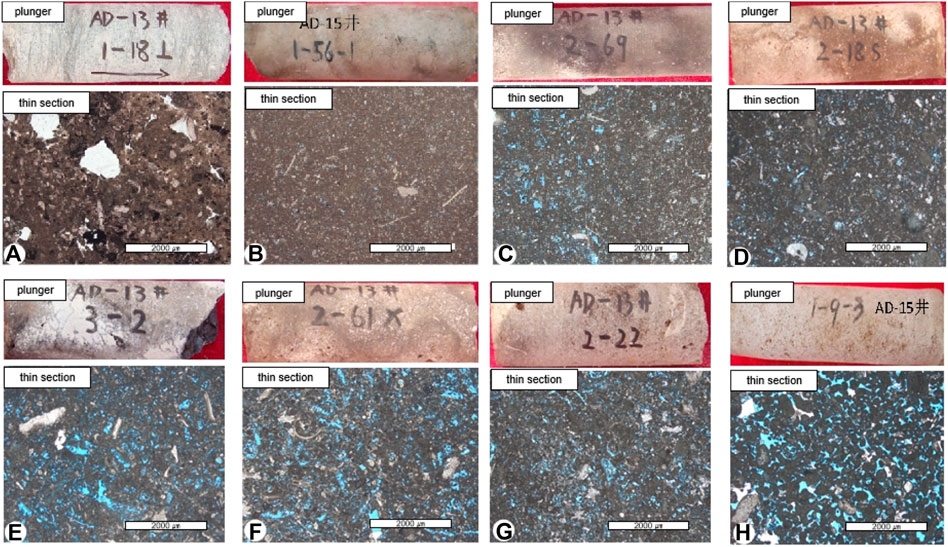
Figure 5. Core and thin-section characteristics of the eight types of lithofacies: (A) argillaceous bioclastic wackestone; (B) planktic foraminiferium wackestone; (C) lamellar bioclastic wackestone; (D) intraclastic-bioclastic packstone; (E) patchy green algae packstone; (F) green algae and pelletoid packstone; (G) benthic foraminiferium-bioclastic packstone; (H) intraclastic grainstone.
The argillaceous bioclastic wackestone is dark gray under sunlight as well as tight and massive with dark argillaceous strips. It has a matrix-supported structure containing some fossils. The pores of this lithofacies are poorly developed (Figure 5A). The well logging response is characterized by slightly higher natural gamma (between 20 and 26 API), relatively high resistivity, low acoustic transit time, high density, and low neutron porosity.
The planktic foraminiferium wackestone has a matrix-supported structure containing mainly coccidioides and a small quantity of biological debris. The core of this lithofacies is gray-white under sunlight, and the lithofacies partially bears oil. The coelomopores of planktic foraminiferium are well developed (Figure 5B). The well logging response of this lithofacies is characterized by low natural gamma value (less than 20 API), low resistivity value of less than 2 Ωm, high sonic time difference, low density, and high neutron porosity.
Lamellar bioclastic wackestone has a matrix-supported structure containing green algae and coccidioides along with a small quantity of biological debris. The core of this lithofacies is light brown to gray under sunlight, with dark strips. The pores are relatively well developed than those of the two lithofacies mentioned above (Figure 5C). The well logging response is characterized by a low gamma value of less than 20 API, low resistivity, high acoustic transit time, low density, and high neutron porosity.
The intraclastic-bioclastic packstone has a particle-supported structure containing mainly biological debris and intraclasts, along with a small quantity of green algae (Figure 5D). The pores of this lithofacies are well developed (Figure 5D). The well logging response is characterized by a low natural gamma value, and the resistivity curve decreases gradually with a bell shape. The curves of the three types of porosities increase gradually with bell shapes.
The patchy green algae packstone has a particle-supported structure containing mainly green algae along with small quantities of echinodermata and biological debris. The green algae mostly dissolves to form moldic pores, along with dissolved calcium carbonate precipitation nearby; hence, this lithofacies is called as patchy green algae packstone. The white patchy cements are unevenly distributed, and the pores of this lithofacies are well developed (Figure 5E). The well logging response of this lithofacies is characterized by a high natural gamma value, relatively high resistivity, high acoustic transit time, low density, and high neutron porosity.
The green algal and pelletoid packstone has a particle-supported structure containing mainly pelletoid and green algae along with a small quantity of biological debris. The green algae mostly dissolve to form moldic pores, partly with patchy cements on the core. The pores of the lithofacies are well developed (Figure 5F). The well logging response is characterized by a low gamma value of less than 20 API, relatively low resistivity, high acoustic transit time, low density, and high neutron porosity.
The benthic foraminiferium-bioclastic packstone has a particle-supported structure containing mainly biological debris and benthic foraminiferium. The coelomopores of the benthic foraminiferium and dissolved pores of the biological debris are moderately developed in this lithofacies (Figure 5G). The well logging response of this lithofacies is characterized by a low gamma ray value, relatively high resistivity, slightly lower acoustic transit time and neutron porosity, and slightly higher density.
The intraclastic grainstone has a particle-supported structure containing mainly intraclasts with small quantities of green algae and bioclasts. This lithofacies is partially cemented by sparry calcite between the intraclasts and has well-developed and well-connected pores (Figure 5H). The well logging response of this lithofacies is characterized by a low natural gamma value, high resistivity, and low values of the three types of porosities.
4.2 Types and compositions of reservoir pores
4.2.1 Type of pores
Based on the descriptions and observations of the core and thin sections of the Kh2 member from wells A8, A12, and A13, it was found that the reservoir spaces of the Kh2 member in the study area are dominated by pores, with few vugs and fractures. The different reservoir pores types are shown in Table 1. Based on the pore size and frequency of occurrence, the pores can be divided into four types: intragranular, intergranular, intercrystalline, and dissolved pores. The intragranular pores in the Kh2 member reservoirs mainly include coelomopores, algal moldic pores, grain moldic pores, and shell dissolved pores, among others (Figure 6). Among these, the coelomopores are widely distributed, mostly in the globigerina and foraminiferal limestones. Algal moldic pores are mainly distributed in the bioclastic packstones and patchy green algal packstone.

Table 1. Reservoir void space type classifications of the Kh2 member in the A oilfield; there are three types of spaces, namely pores, vugs, and fractures.
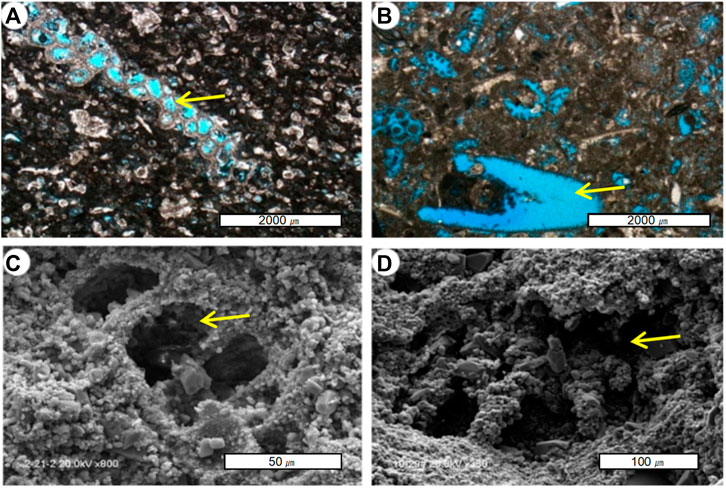
Figure 6. Photos of the intragranular pores in the Kh2 layer of the Khasib Formation: (A) A13, 2633.6 m, coelomopores; (B) A12, 2821.42 m, algal moldic pores; (C) A8, 2653.85 m, SEM image of coelomopores; (D) A13, 3100.3 m, SEM image of coelomopores.
Intergranular pores are the most important type of pores in the Kh2 member reservoirs, with good connectivity that mostly contributes to the production of oil and gas. The intergranular type of pores includes intergranular dissolved pores and intergranular remaining pores (Figure 7). Among these, the intergranular dissolved pores are the most widely distributed type, with greater distributions in intraclastic grainstone and bioclastic packstone. Intercrystalline pores are also an important pore type in Cretaceous carbonate reservoirs, where the distribution of intercrystalline micropores is rather extensive (Figure 8). Intercrystalline pores are mostly distributed in coccidioid and micrite limestones, which are generally dense limestones with poor physical properties. Intercrystalline dissolved pores are mainly distributed in dolomitic limestone.
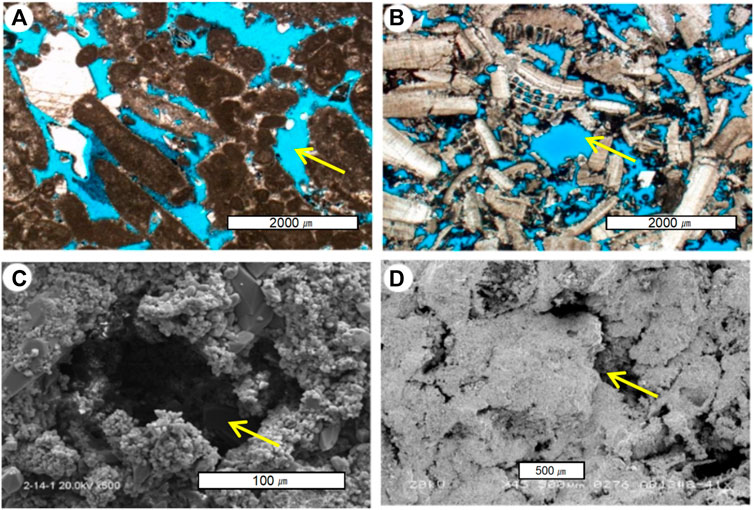
Figure 7. Photographs of the intergranular pores in the Kh2 layer of the Khasib Formation: (A) A13, 2617.02 m, intergranular dissolved pores; (B) A13, 2985.88 m, intergranular pores; (C) A8, 2651.71 m, SEM image of intergranular pores; (D) A13, 2985.24 m, SEM image of intergranular dissolved pores.
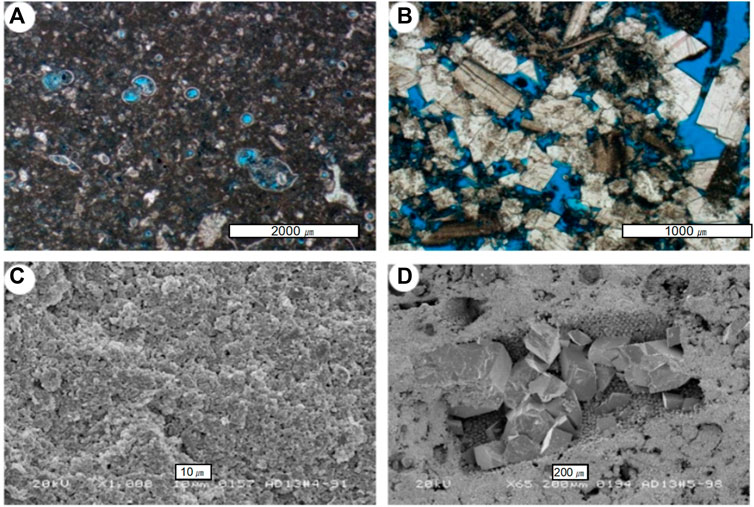
Figure 8. Photographs of the intercrystalline pores in the Kh2 layer of the Khasib Formation: (A) A8, 2663.51 m, intercrystalline micropores, coelomopores; (B) A13, 2987.89 m, intercrystalline dissolution pores; (C) A13, 2655.02 m, SEM image of intercrystalline micropores; (D) A13, 2929.43 m, SEM image of intercrystalline dissolution pores.
Core and imaging logging data show that vugs are developed in the Kh2 layer of the A oilfield. It is also seen from the results of the CT scanning experiments that the dissolved pores are developed at 2648.59–2648.78 m in the Kh2 layer of Well A13, with a maximum size of 15×35 mm, minimum size of 2×2 mm, and average size of 3×4 mm (Figure 9).
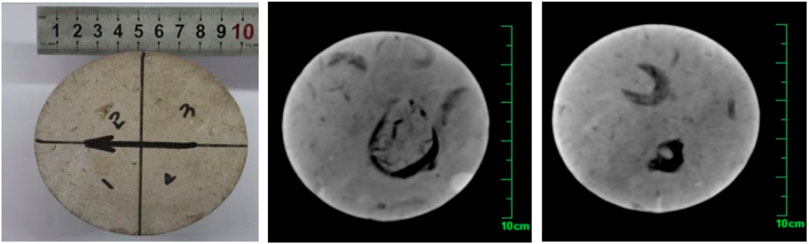
Figure 9. Photographs of vugs in the Kh2 layer of the Khasib Formation (A13, 2648.59–2648.78 m).
4.2.2 Proportion of void space types
Among the 250 thin casting sections of the Kh2 layer from wells A8, A12, and A13 in A oilfield, 242 thin sections developed pores, accounting for 96.8% of the total thin sections. The main types of pores are coelomopores, followed by intergranular dissolved pores and intercrystalline micropores. The proportions of the various types of pores are shown in Table 2.
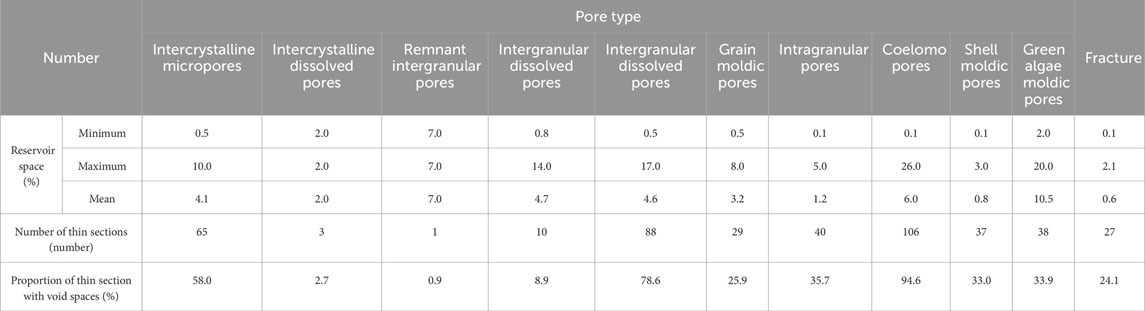
Table 2. Proportions of different reservoir void space types accounting for the total areal porosity of the Kh2 layer.
A comparative analysis was conducted on the percentage of main pore types in the 242 porous thin sections and the percentage of the reservoir void space in the total pore surface area. The analysis results show that green algae moldic pores, intergranular dissolved pores, and coelomopores and shell moldic pores have the largest proportions, with contributions of 21.1%, 20.8%, and 16.7% to the void space, respectively, followed by intergranular micropores (14.0%). It can be seen that the main void space of the Kh2 layer contains intergranular dissolved pores, green algal moldic pores, and coelomopores. Although the intercrystalline micropores constitute 62.0% of the total areal porosity, because of their small pores sizes of 0.01–0.05 mm, their contribution to the pore space is low (14.0%); the void space contributions of other types of pores are shown in Figure 10. Based on the core descriptions, the vugs were analyzed statistically, and the results show that the vugs in the Kh2 layer were relatively developed. Most of them are distributed in the middle and upper parts of the layer, and the vug sizes are generally 2–10 mm. Furthermore, most of the vugs are unfilled, so that dissolution occurs along the biological pores with minor calcite and asphalt fillings.
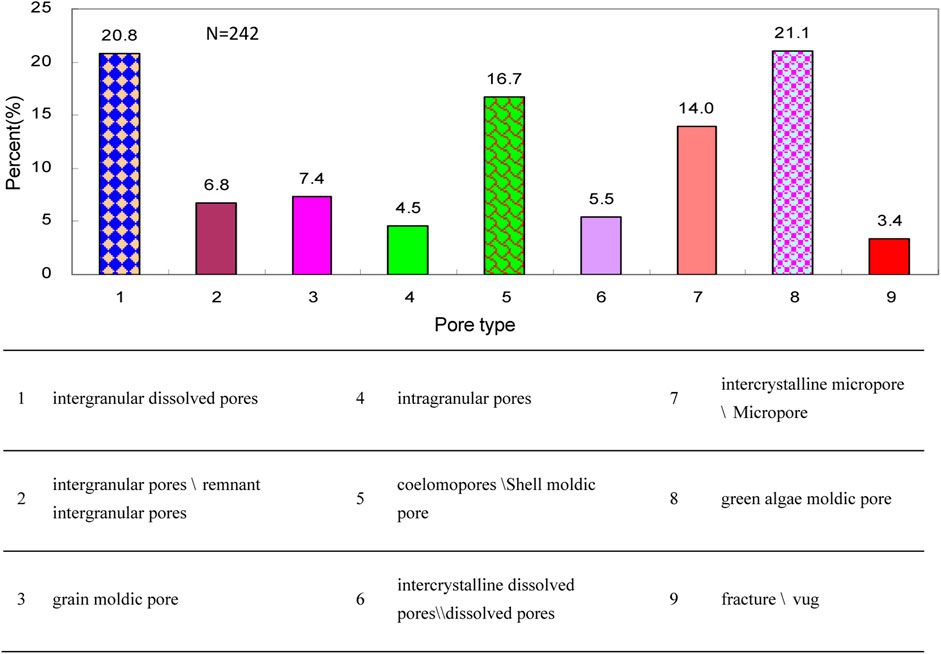
Figure 10. Contributions of different types of void spaces, showing relatively high proportions of intergranular dissolved pores, shell moldic pores, and green algae moldic pores.
4.3 Pore and throat features
4.3.1 Throat types
The throat size (median throat width Rc50 of saturation in the mercury intrusion experiment) was used for classification as follows: large throat > 2 μm; middle throat 2–0.5 μm; small throat 0.5–0.04 μm; microthroat <0.04 μm. Based on the cast thin sections and scanning electron microscopy (SEM) observations, the matrix pores are mainly connected by the throat. There are two main types of reservoir throats: 1) Tubular throats with slender pipes connecting the pores that have a cross section close to a circle, generally with a throat diameter of 2–50 μm, good throat connectivity, and high permeability (Figure 11A). In this well, the throat is mainly developed between the algal moldic pores and intergranular dissolved pores. 2) Lamellar throats that are mainly developed between the crystals, with many connecting the intercrystalline pores to the coelomopores. The throat diameter is generally 0.1–2 μm (Figure 11B), and the connectivity among the pores is poor; this type of throat is mainly developed between the intercrystalline micropores and coelomopores.
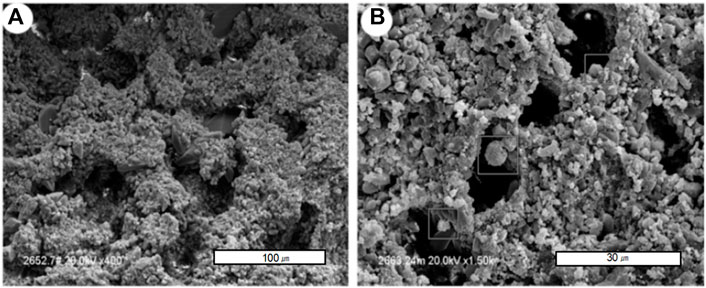
Figure 11. Photographs of tubular and lamellar throats among the pores: (A) tubular throat, A8, 2653.5 m; (B) lamellar throat, A8, 2664.04 m.
4.3.2 Pore and throat features
Most of the capillary pressure curves are relatively smooth and regular, reflecting the characteristics of reservoirs with pores as the main void spaces. Based on the morphological characteristics, the curves can be divided into three types (Figure 12) as classes I, II, and III, for which the microscopic pore structure of the limestone reservoir deteriorates in that order.
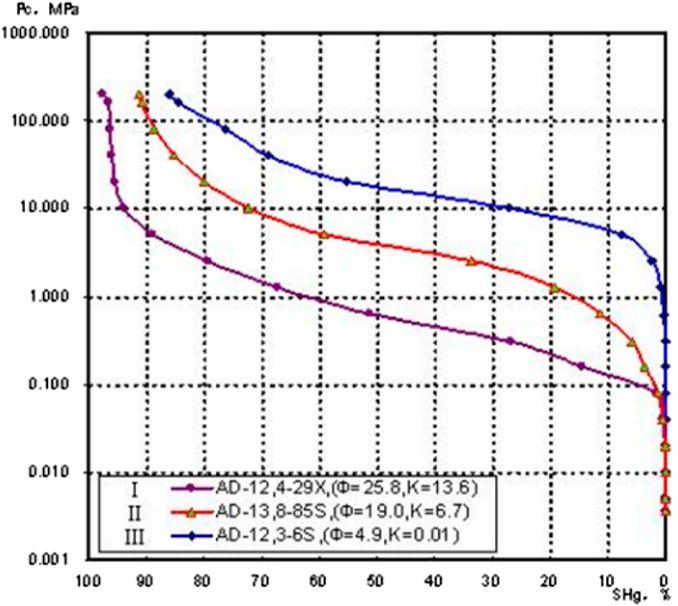
Figure 12. Typical mercury intrusion curve of the Kh2 layer showing three different shapes of the capillary pressure curves.
Class I (such as sample A12, 4-29X) has very low displacement pressure (Pc10) and median pressure (Pc50), with average values of 0.26 MPa and 1.79 MPa, respectively. The average median radius (Rc50) is 0.53 μm. The maximum mercury saturation (SmaxHg) can reach more than 93.14%, and the average mercury removal efficiency is 42.33%, showing medium-fine skewness. The porosity of this class is generally greater than 20%, and the storage capacity and permeability performance are good.
Class II (such as samples A13, 8-85S) has low displacement pressure (Pc10) and median pressure (Pc50), with average values of 0.40 MPa and 2.41 MPa, respectively. The average median radius (Rc50) is 0.48 μm. The maximum mercury saturation (SmaxHg) can reach about 90.0%, and the pore structure is fine and skewed; furthermore, the storage capacity and permeability performance are slightly worse than those of class I.
Class III (such as sample A12, 3-6S) has significantly higher displacement pressure (Pc10) and median pressure (Pc50) than those of classes I and II, with average values of 1.40 MPa and 4.90 MPa, respectively. The median radius (Rc50) is also smaller than those of classes I and class II, with an average value of 0.20 μm, showing fine skewness with fine pores and a microthroat structure.
5 Discussion
5.1 Capillary pressure curve coarsening and classification
In this study, 25 samples from four coring wells were selected for mercury injection experiments, and the capillary pressure curves of a total of 159 samples were obtained (Figure 13A). First, closure correction and curve fitting were performed on the original capillary pressure curves, and these results are shown in Figure 13B. It can be seen from the figure that the curve shapes are diverse, reflecting the strong heterogeneity of the rock. Owing to non-uniform sample distribution, there may be multiple capillary pressure curves with large morphological differences for the same layer. Therefore, the curves must be coarsened according to the layer, so that each layer has a representative capillary pressure curve; this method is used to classify the coarsened capillary pressure curves, producing a total of 14 different categories. Finally, the capillary pressure curves belonging to the same category are coarsened again to obtain the representative curve of each category, as shown in Figure 13C. Figure 13D shows the overlap between the original capillary pressure curve (black) and the 14 representative capillary pressure curves (red); it can be seen that the representative curves reflect the characteristics of the capillary pressure curve of the entire Kh2 layer reservoir.
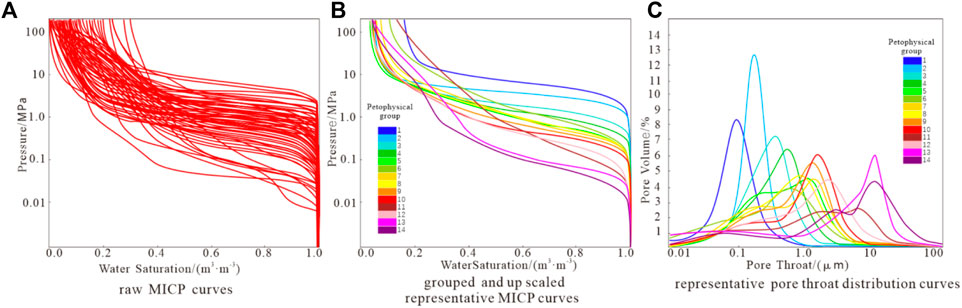
Figure 13. Capillary pressure curve fitting, upscaling, and classification results; a total of 14 categories of capillary pressure curves are derived after coarsening. Note that these 14 colors represent 14 petrophysical facies.
5.2 Porosity–permeability intersection features
The mercury intrusion capillary pressure curves reflect the size distributions of the rock throats, and the porosity–permeability intersection feature are related to not only the throat sizes but also the pore types. Therefore, the division of the petrophysical facies must be combined with the porosity–permeability intersection characteristics to ensure that the same petrophysical facies has similar porosity–permeability intersection trends and smaller pore-permeability distribution ranges.
A total of 1,589 core plug samples from the Kh2 layer were analyzed for porosity and permeability; these samples were selected to ensure that the permeability analysis results were not affected by core breakage and fractures, and the original porosity–permeability intersection characteristics are shown in Figure 14A. It is seen from the figure that the Kh2 layer has strong heterogeneity and large variations in the porosity and permeability ranges. To reduce the influence of the heterogeneities, the average pore and permeability values of each layer were calculated separately, and the results are shown in Figure 14B. Figures 14A,B are then superimposed to obtain the diagram in Figure 14C; it can be seen from this figure that the dispersion of the intersection point of the average porosity and permeability of the small layer is significantly reduced, which is more conducive to the classification of the intersection point.
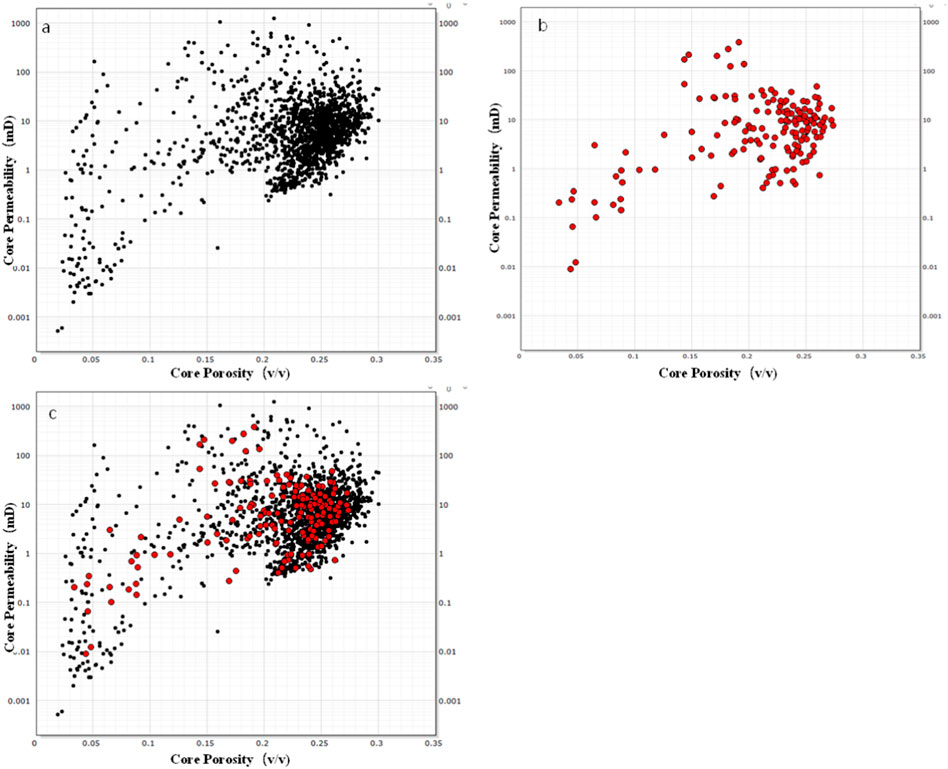
Figure 14. Cross plots of porosity–permeability intersections for the cores from the Khasib Formation: (A) original porosity–permeability crossplot; (B) average values of the pores and permeabilities of each layer; (C) superimposed diagram of the original and average values.
The pore types and relative content of each layer can be determined using image processing to analyze the core and casting thin section photos. Finally, from the classification results of the capillary pressure curves along with the porosity–permeability intersection characteristics and pore type distributions, the capillary pressure curves belonging to the same category as well as layers with similar porosity–permeability intersection characteristics and pore types can be categorized into the same petrophysical facies and sequentially numbered (Figure 15). A total of 14 petrophysical facies were obtained from the seven coring wells in the Kh2 layer, and these are numbered from 1 to 14. The physical properties gradually improve along the sequence, with the overall physical properties of petrophysical facies 1 being the worst and those of 14 being the best.
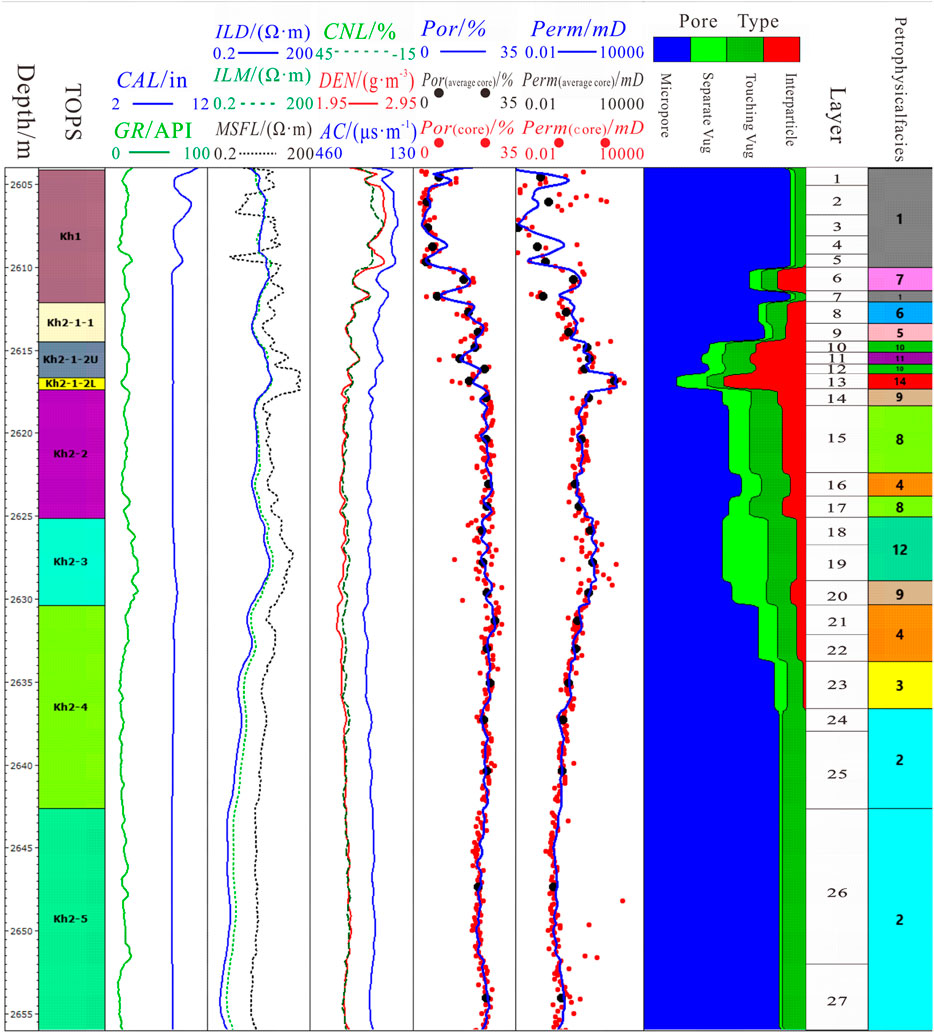
Figure 15. Results of the pore-type and petrophysical facies divisions showing the 14 categories of petrophysical facies. The layers with similar porosity–permeability intersection characteristics and pore types are classified into the same petrophysical facies and numbered sequentially.
6 Application of rock-type classification
Similar rock types should have similar lithofacies and petrophysical facies because these rock types emphasize the similarities of the depositional environment and diagenesis at the same time. Owing to the differences in the petrophysical properties of the same lithofacies, many rock types are derived. Correspondingly, different lithofacies with similar petrophysical properties should be classified into different rock types (Figure 16).
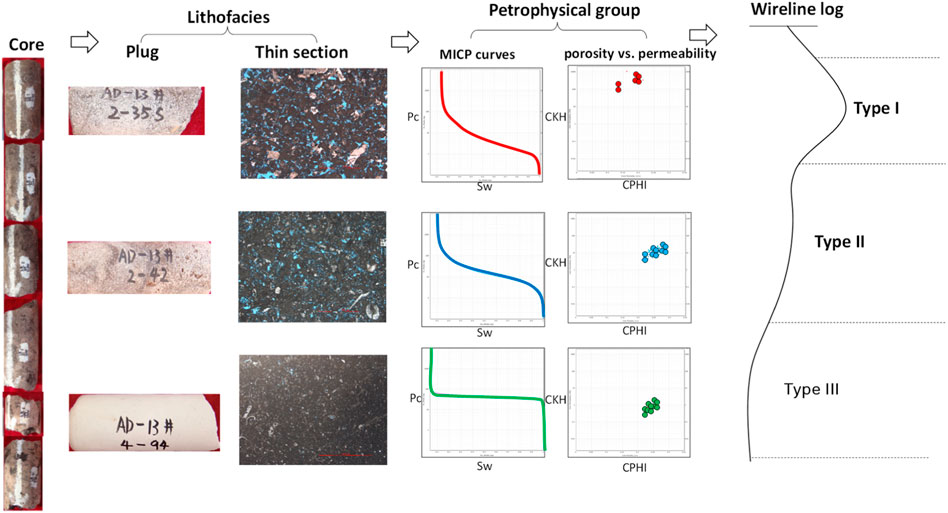
Figure 16. Rock-type classification strategy. Based on the descriptions of the cores, the lithofacies divisions are derived using thin sections. Then, the petrophysical facies are divided using mercury intrusion capillary pressure curves along with porosity vs permeability data. The rock types are classified by lithofacies and petrophysical facies, along with the special wireline log.
The logging response characteristics of each lithofacies and petrophysical facies in the vertical wells are obvious and can be divided into finer rock types. However, considering that the logging response characteristics of horizontal wells are not as obvious as those of vertical wells, thinner rock types cannot be identified; therefore, the rock types were appropriately combined in this study and finally divided into 13 types for the Kh2 layer reservoir (Figure 17). The physical properties gradually improve along the sequential numbering, with the overall physical properties of rock types RT1-1-1 being the worst and those of rock types RT1-8-14 being the best. Considering the crucial coring wells as the standard, the rock types can be classified for all uncored wells in the oilfield based on the method of logging curve comparison.
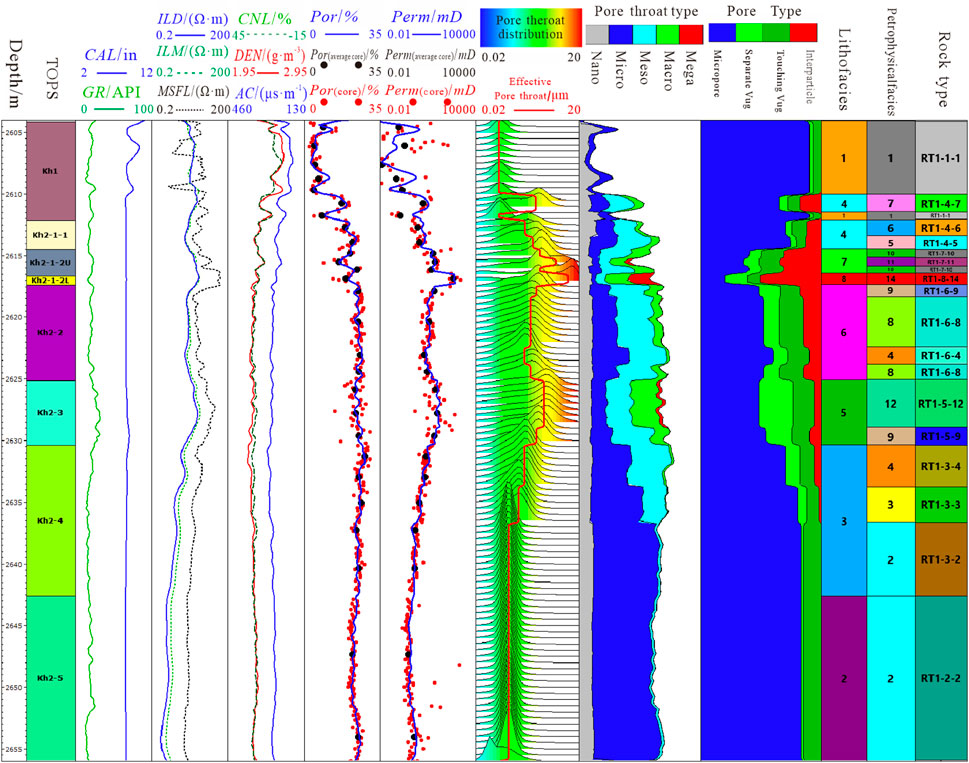
Figure 17. Results of rock-type classifications of the Kh2 layer showing 13 rock types with different pore structures and geological origins.
The rock types have good transverse continuity and strong comparability in the study area. For the main horizontal segment, the thickness of the Kh2 layer is high, which is conducive for comparing the heterogeneity distribution laterally. As an improved method of rock-type classification, coarsening of the rock physical characteristics is used herein to obtain geological similarity information, which emphasizes the classification of the carbonate reservoir based on its geological origin, thereby improving the accuracy of carbonate reservoir evaluation in the future.
7 Conclusion
Based on core observations, casting thin section identification, and quantitative analyses of the mercury capillary pressure curves, the rock types of porous limestone reservoirs were classified on the basis of petrographical and petrophysical characteristics.
(1) Based on the lithology and particle types, there are eight lithofacies: argillaceous bioclastic wackestone, planktic foraminiferium wackestone, lamellar bioclastic wackestone, intraclastic-bioclastic packstone, patchy green algae packstone, green algae and pelletoid packstone, benthic foraminiferium-bioclastic packstone, and intraclastic grainstone.
(2) Based on the classification results of the capillary pressure curves and by combining the pore–permeability crossplot features with the pore-type distributions, 14 petrophysical facies were identified from the seven coring wells in the Kh2 layer. The physical properties of the 14 petrophysical facies improve gradually, with the overall physical properties of petrophysical facies 1 being the worst and those of 14 being the best.
(3) Based on the logging response characteristics of each lithofacies and petrophysical facies, there are 13 rock types with different pore structures and geological origins in the Kh2 layer reservoir. The physical properties of these 13 rock types improve gradually, with those of rock type RT1-8-14 being the best.
Data availability statement
The datasets presented in this study can be found in online repositories. The names of the repository/repositories and accession number(s) can be found in the article/Supplementary material.
Author contributions
TH: conceptualization and writing–original draft. MC: conceptualization and writing–review and editing. XW: methodology, software, and writing–original draft. GD: formal analysis, visualization, and writing–original draft. MF: supervision and writing–review and editing.
Funding
The author(s) declare financial support was received for the research, authorship, and/or publication of this article. This research was funded by National Science and Technology Major Special Project “Development of Large Oil and Gas Fields and Coalbed Methane” (Project No. 2017ZX05030-001)
Acknowledgments
The authors thank all those who helped with the writing of the article. The authors also acknowledge the State Key Laboratory of Oil and Gas Reservoir Geology and Exploitation (Chengdu University of Technology) for assistance with the experimental research.
Conflict of interest
Authors TH and MC were employed by CNPC Chuanqing Drilling Engineering Co., Ltd.
The remaining authors declare that the research was conducted in the absence of any commercial or financial relationships that could be construed as a potential conflict of interest.
Publisher’s note
All claims expressed in this article are solely those of the authors and do not necessarily represent those of their affiliated organizations, or those of the publisher, the editors, and the reviewers. Any product that may be evaluated in this article, or claim that may be made by its manufacturer, is not guaranteed or endorsed by the publisher.
References
Abdel-Fattah, M. I., Mahdi, A. Q., Theyab, M. A., Pigott, J. D., Abd-Allah, Z. M., and Radwan, A. E. (2022). Lithofacies classification and sequence stratigraphic description as a guide for the prediction and distribution of carbonate reservoir quality: a case study of the Upper Cretaceous Khasib Formation (East Baghdad oilfield, central Iraq). J. Pet. Sci.Eng. 209, 109835. doi:10.1016/J.PETROL.2021.109835
Al-Qayim, B. (2010). Sequence stratigraphy and reservoir characteristics of the turonian-coniacian khasib formation in central Iraq. J. Pet. Geol. 33, 387–403. doi:10.1111/j.1747-5457.2010.00486.x
Aqrawi, A. A. M. (1997). The nature and preservation of organic matter in holocene lacustrine/deltaic sediments of lower mesopotamia, se Iraq. J. Pet. Geol.20, 69–90. doi:10.1111/j.1747-5457.1997.tb00756.x
Aqrawi, A. A. M., Goff, J. C., Horbury, A. A., and Sadooni, F. (2010). The petroleum geology of Iraq. Bucks, UK: Scientific Press Ltd., 1–451.
Aqrawi, A. A. M., Thehni, G. A., Sherwani, G. H., and Kareem, B. A. (1998). Mid-Cretaceous rudist-bearing carbonates of the Mishrif formation: an important reservoir sequence in the Mesopotamian Basin, Iraq. J. Petroleum Geol., 21(1): 57–82. doi:10.1306/bf9ab79e0eb6-11d7-8643000102c1865d
Ausbrooks, R. (1999). “Pore-size distributions in vuggy carbonates from core images. NMR and capillary pressure,” in The 1999 SPE annual technical conference and exhibition (Houston: SPE), 1–14.
Burrowes, A. M., Moss, A. K., Sirju, C., and Tim, P. (2010). Improved permeability prediction in heterogenous carbonate formations. in SPE EUROPEC/EAGE annual conference and exhibition. Barcelona,Spain: Society of Petroleum Engineers. doi:10.2118/131606-MS
Chen, P. Y., and Guo, L. N. (2020). Carbonate reservoir characteristics and its effects on water flooding development of the M formation in B oilfield, Iraq. Xi ’an shiyou university, chengdu university of technology. Shaanxi Petroleum Soc. Proc. 2020 Int. Conf. Oil Gas Explor. Dev. 2020, 11. doi:10.26914/c.cnkihy.2020.042259
Clerke, E. A. (2003). Beyond porosity-permeability relationships—determining pore network parameters for the Ghawar Arab-D using the Thomeer method. Geofrontier (Dhahran, Saudi Arabia) 1 (3), 12–17.
Dunham, G. R.(1962). Clas sification of carbonate rocks according to depositional texture [ J]. Mem. . Am. . Assoc. Pet. Geol. , 1: 108- 121.
Embry, A., and Klovan, J. E. (1971). A late devonian reef tract on northeastern banks island, northwest territories. Bull. Can. Pet. Geol. 19, 730-781. doi:10.35767/gscpgbull.19.4.730
Folk, R. L. (1959). Practical petrographic classification of limestones. Bull. Am. Assoc. Pet. Geol. 43, 1–8. doi:10.1306/0bda5c36-16bd-11d7-8645000102c1865d
Frank, S., Narayanan, R., Hansen, P., Allen, D. F., Albrechtsen, T., Steinhardt, H., et al. (2005). Carbonate rock typing using NMR data: a case study from al Shaheen field, offshore Qatar. in International Petroleum technology conference. Doha,Qatar: international Petroleum technology conference. doi:10.2523/IPTC-10889-MS
Gunter, G. W., Spain, D. R., Viro, E. J., Thomas, J. B., Potter, G., and Williams, J. (2014). Winland pore throat prediction method-a proper retrospect: new examples from carbonates and complex systems. in SPWLA 55th annual logging symposium. Abu Dhabi, United Arab Emirates: Society of Petrophysicists and Well-Log Analysts.
Guo, R., Fu, M. Y., Zhao, L. M., Duan, T. X., Han, H. Y., Huang, T. T., et al. (2014). Sediment facies of khasib formation in ahdeb oil field and its controlling effects on carbonate reservoir development. J. Mineral. Petrol. (01), 95–103. doi:10.19719/j.cnki.1001-6872.2014.01.014
Han, H. Y., Mu, L. X., Guo, R., Zhao, L. M., and Su, H. Y. (2014). Characteristics and controlling factors of cretaceous bioclastic limestone reservoirs in ahdeb oil field. Iraq. Mar. Orig. Pet. Geol. (02), 54–63. doi:10.3969/j.issn.1672-9854.2014.02.008
Jiang, J. W., Zhu, Y. Q., Xu, X., Zhao, Y. H., Xue, Y. J., and Hu, Y. L. (2015). Pore structure characteristics of the carbonate reservoir and their influence onelectric properties in H oilfield,Iraq. Prog. Geophys. 30 (1), 203–209. doi:10.6038/pg20150131
Kharrat, R., Mahdavi, R., and Bagherpour, M. H. (2009). “Rock type and permeability prediction of a heterogeneous carbonate reservoir using artificial neural networks based on flow zone index approach,” in SPE Middle East oil and gas show and conference (Manama, Bahrain: Society of Petroleum Engineers). doi:10.2118/120166-MS
Lalanne, B., and Rebelle, M. (2014). A review of alternative methods to classify rock-types from capillary pressure measurements. in International Petroleum technology conference. Doha, Qatar: international Petroleum technology conference. doi:10.2523/IPTC-17631-MS
Ling, C., Zhang, X. R., Fu, M. Y., Huang, T. T., Duan, G. H., and Gao, S. M. (2024). The geological controlling factors of the heterogeneity of a bioclastic limestone reservoir—a case study of the Cretaceous Kh2 layer in A oilfield, Iraq. Front. Energy Res. 11. doi:10.3389/fenrg.2023.1296584
Liu, H. Y., Shi, K. B., Liu, B., Song, X. M., Guo, R., Li, Y., et al. (2019). Characterization and identification of bioturbation-associated high permeability zones in carbonate reservoirs of Upper Cretaceous Khasib Formation, AD oilfield, central Mesopotamian Basin, Iraq. Pet. Geol. 110, 747–767. doi:10.1016/j.marpetgeo.2019.07.049
Liu, T. D., Zhao, T. P., Li, G. R., and Shi, Y. J. (2012). An improved method to evaluate pore size distribution of tight sandstone reservoir using NMR. Well Logging Technol. 36 (02), 119–123. doi:10.16489/j.issn.1004-1338.2012.02.003
Lucia, F. J. (1995). Rock - fabric/petro physical classification of carbonate porespace for reservoir characterization. AAPG Bull. 79 (9), 1275–1300. doi:10.1306/7834d4a4-1721-11d7-8645000102c1865d
Mohammed, A., Dhaidan, M., Al-Hazaa, S. H., and Al-Kahtany, K. (2022). Reservoir characterization of the upper Turonian – lower Coniacian Khasib formation, South Iraq: implications from electrofacies analysis and a sequence stratigraphic framework. J. Afr. Earth Sci. 186, 104431. doi:10.1016/j.jafrearsci.2021.104431
Moradi, M., Moussavi-Harami, R., Mahboubi, A., Khanehbad, M., and Ghabeishavi, A.(2017). Rock typing using geological and petrophysical data in the Asmari reservoir, Aghajari Oilfield, SW Iran[J] . J. Petroleum Sci. Eng.,152: 523–537. doi:10.1016/j.petrol.2017.01.050
Nabawy, B. S., Abd El Aziz, E. A., Ramadan, M., and Shehata, A. A. (2023). Implication of the micro- and lithofacies types on the quality of a gas-bearing deltaic reservoir in the Nile Delta, Egypt. Sci. Rep. 13, 8873. doi:10.1038/s41598-023-35660-0
Radwan, A. E., Husinec, A., Benjumea, B., Kassem, A. A., Abd El Aal, A. K., Hakimi, M. H., et al. (2022). Diagenetic overprint on porosity and permeability of a combined conventional-unconventional reservoir: insights from the Eocene pelagic limestones, Gulf of Suez, Egypt. Mar. Pet. Geol. 146, 105967. doi:10.1016/j.marpetgeo.2022.105967
Radwan, A. E., Nabawy, B. S., Kassem, A. A., and Hussein, W. S. (2021). Implementation of rock typing on waterflooding process during secondary recovery in oil reservoirs: a case study,El morgan oil field, Gulf of suez, Egypt. Nat.Resour. Res. 452, 1667–1696. doi:10.1007/s11053-020-09806-0
Ross, C. M., Callender, C. A., and Turbeville, J. B. (1995). Winland pore throat prediction method-a proper retrospect: new examples from carbonates and complex systems. in Annual meeting of the society of Petroleum engineers. Dallas, TX: Society of Petroleum Engineers.
Saneifar, M., Roy, C., Clotilde, C., Heidari, Z., and Pope, M. C. (2015). Integrated rock classification in carbonate formations based on elastic and petrophysical properties estimated from conventional well logs. AAPG Bull., 99(7), 1261–1280. doi:10.1306/02091514167
Sharifi-Yazdi, M., Rahimpour-Bonab, H., Nazemi, M., Tavakoli, V., and Gharechelou, S. (2020). Diagenetic impacts on hydraulic flow unit properties: insight from the Jurassic carbonate Upper Arab Formation in the Persian Gulf. J. Pet. Explor. Prod.Technol. 10 (5), 1783–1802. doi:10.1007/s13202-020-00884-7
Sharland, P. R., Archer, R., Casey, D. M., Davies, R. B., Hall, S. H., Heward, A. P., et al. (2001). Arabian Plate sequence stratigraphy. GeoArabia Spec. Publ. 2, 371.
Sherwani, G. H. M., and Aqrawi, A. A. M. (1987). Lithostratigraphy and environmental considerations of cenomanian-early turonian shelf carbonates (rumaila and mishrif formations) of mesopotamian basin, middle and southern Iraq. Aapg Bull. doi:10.1306/948876ef-1704-11d7-8645000102c1865d
Sun, F. T. (2020). Characteristics and controlling factors of dolomite reservoir in A oilfield, southeast Iraq. Petrochem. Ind. Appl. 39 (12), 101–107. doi:10.3969/j.issn.1673-5285.2020.12.022
Tan, X. Q., Lian, P. Q., Qiu, M. J., Li, Y. H., and Dong, G. W. (2013). Rock type-constrained geological modeling of carbonate reservoirs: a case study of carbonate reservoir A in the ’Zagros Basin. Oil Gas Geol. 34 (4), 558–563. doi:10.11743/ogg20130419
Wang, G. J., Song, X. M., Liu, B., and Shi, K. B. (2022). Effect of bioturbation on reservoir heterogeneity of the upper cretaceous khasib Formation in AD oilfield. Iraq.Mar. Orig. Pet. Geol. (01), 11–20. doi:10.3969/j.issn.1672-9854.2022.01.002
Wang, Q., Wen, T., Li, H. X., Zeng, X. Y., Wang, X. Z., Xin, J., et al. (2022). Influence of heterogeneity on fluid property variations in carbonate reservoirs with multistage hydrocarbon accumulation: a case study of the Khasib formation, Cretaceous, AB oilfield, southern Iraq. Open Geosci. 14 (1), 663–674. doi:10.1515/GEO-2022-0363
Xiao, L. Z. (1995). Nuclear magnetic resonance imaging of rock. Geophysical Society of China. in Proceedings of the 11th annual conference of the Chinese geophysical society, 267.
Zhang, W. Q., Liu, D. W., Zhang, L. F., Deng, Y., Xu, J. C., and Wang, Y. N. (2023). Characteristics and genetic mechanism of marine nodular limestone reservoirs of Khasib Formation in Iraq A Oilfield, Middle East. Mar. Orig. Pet. Geol. (01), 33–44. doi:10.3969/j.issn.1672-9854.2023.01.004
Keywords: Iraq, limestone, pore and throat features, petrophysical facies, rock type
Citation: Huang T, Chen M, Wang X, Duan G and Fu M (2024) Classification of rock types of porous limestone reservoirs: case study of the A oilfield. Front. Earth Sci. 12:1337588. doi: 10.3389/feart.2024.1337588
Received: 13 November 2023; Accepted: 13 May 2024;
Published: 08 July 2024.
Edited by:
Mehdi Ostadhassan, Northeast Petroleum University, ChinaReviewed by:
Amer A. Shehata, Texas A&M University Corpus Christi, United StatesAbid Ali, University of the Punjab, Pakistan
Copyright © 2024 Huang, Chen, Wang, Duan and Fu. This is an open-access article distributed under the terms of the Creative Commons Attribution License (CC BY). The use, distribution or reproduction in other forums is permitted, provided the original author(s) and the copyright owner(s) are credited and that the original publication in this journal is cited, in accordance with accepted academic practice. No use, distribution or reproduction is permitted which does not comply with these terms.
*Correspondence: Meiyan Fu, fumeiyan08@cdut.cn