 Rui Yang1
 Wenli Liang
 Pinglang Kou
95% of researchers rate our articles as excellent or good
Learn more about the work of our research integrity team to safeguard the quality of each article we publish.
Find out more
ORIGINAL RESEARCH article
Front. Earth Sci. , 16 February 2024
Sec. Geohazards and Georisks
Volume 12 - 2024 | https://doi.org/10.3389/feart.2024.1337209
This article is part of the Research Topic Advances and Applications in Modeling, Assessment, and Mitigation of Landslide Disasters View all 7 articles
In the Three Gorges Reservoir area, landslide disasters occur frequently, making scientific monitoring and risk prediction crucial for disaster prevention and mitigation. However, most previous studies have been constrained by analysis of singular influencing factors. In this study, we employed multi-temporal InSAR techniques coupled with multivariate geospatial statistical analysis to monitor and analyze the dynamic evolution of the Muyuba landslide in Zigui County, Hubei Province, China from 2016 to 2023. The findings indicate that the Muyuba landslide was predominantly characterized by continuous, gradual subsidence. Key factors inducing deformation included well-developed drainage networks, gentle slopes of 15–30°, and the orientation of rock strata. Deformation rates in residential areas and along roadways exceeded background levels, implicating anthropogenic activities in the heightened landslide risk. A significant correlation was observed between landslide deformation and reservoir water level fluctuations, as opposed to rainfall patterns, highlighting reservoir regulation disturbances as a critical landslide triggering factor.
The Landslide is one of the most ruinous geological hazards in mountainous terrains worldwide. They can cause catastrophic losses of lives and properties and substantially impact the environmental and socioeconomic tolls. In recent years, with the increasing frequency of extreme weather events under climate change, aligned with burgeoning anthropogenic activities in vulnerable areas, landslide disasters have shown an increasing trend, posing a severe threat to the safety of lives and properties of local communities (Zhang et al., 2021; He et al., 2023). Various additional factors can also contribute to landslide hazards, such as pollutant transport which can impact slope stability by altering soil characteristics (Bai B et al., 2020), as well as hydrological and hydrogeological processes that affect subsurface water flows (Bai et al., 2017). These complex and interlinking factors underline the importance of scientific monitoring, analysis, and prediction of landslide risks across spatial and temporal scales.
The Three Gorges Reservoir area in China, located in the middle Yangtze River, is predisposed to landslide hazards due to its active tectonic movements, concentrated precipitation, steep terrain, and alterations by reservoir impoundment (Xia et al., 2013; Tang et al., 2015). Numerous landslides have occurred since the commencement of water level oscillations of the Three Gorges Reservoir, causing severe casualties and property losses (Huang et al., 2013). The Muyubao landslide, located in the mountainous Zigui County, Hubei Province, is typical in the reservoir area. It is situated in a region with complex geological structures and active landform dynamics, exhibiting significant instability (Zhou et al., 2020). The area has experienced frequent landslide disasters in history. With the filling of the Three Gorges Reservoir and increasing human activities in recent years, this area is facing growing risks of reactivation and acceleration of landslides, calling for scientific monitoring and prediction of its dynamic evolutionary characteristics (Sun et al., 2016).
Conventional techniques for landslide monitoring such as ground-based surveying and GPS measurements are often limited by sparse spatial sampling, high cost, and low efficiency when applied to large areas. In recent years, Interferometric Synthetic Aperture Radar (InSAR) has become an effective technique for monitoring ground surface deformation over large areas with high spatial resolution (Zhang et al., 2018). The Small Baseline Subset (SBAS) InSAR method can effectively process multi-temporal radar data to generate time-series deformation maps, capturing landslide displacement behaviors with millimeter to centimeter accuracy (Intrieri et al., 2011). By integrating InSAR results with topographic, geologic, and hydrologic data, we can conduct statistical analysis to reveal the kinematic behaviors of landslides and quantify the effects of various natural and anthropogenic factors on their activities (Intrieri et al., 2011; Bai Y J et al., 2020). Such knowledge is essential for hazard assessment, early warning, and risk mitigation.
In this study, we carry out SBAS InSAR analysis using Sentinel-1A radar imagery between 2016 and 2023 to characterize the spatiotemporal deformation patterns of the Muyubao landslide over seasons and years. We further examine the effects of drainage levels, slope gradients, lithology, and human factors like residential areas and roads on the measured displacements through spatial statistical models. The impacts of reservoir water level fluctuations and precipitation on periodic deformation behaviors are also evaluated by correlation analysis (Tang et al., 2015; Sun et al., 2016). We integrated multiple data sources to capture and analyze landslide dynamics from multiple perspectives. Our study examined the effects of natural factors on landslide behavior, and also focused on the role of human activities, such as residential construction and road layout, providing a comprehensive view for understanding and predicting landslide activity. The main objectives are 1) to delineate the deformation characteristics of the Muyubao landslide; 2) to analyze the influence of topographic, geologic, and hydrologic factors on landslide kinematics; and 3) to reveal the deformation mechanisms and instability drivers, to provide scientific basis for early warning and hazard mitigation in the Three Gorges Reservoir area. This study can also offer a methodological reference for the monitoring, modeling, and risk management of landslides in other regions worldwide.
The Muyubao landslide, situated within the mountainous terrain of Zigui County in Yichang City (Figure 1), Hubei Province, embodied the geologically complex and topographically vigorous character of the Three Gorges Reservoir area, with its west-to-east descending relief. The region, under the influence of a temperate continental monsoon climate, exhibited pronounced seasonal variability and intricate meteorological patterns. Here, annual temperatures averaged between 16°C–18°C, with warm, moist summers pushing averages to 28°C–30°C and peak extremes over 40°C, while winters were cold and dry, averaging 4°C–6°C, dipping below −10°C. Precipitation ranged from 1,100 to 1,400 mm annually, peaking in July and August with monthly tallies of 200–250 mm, and humidity held at a 70%–80% yearly mean.
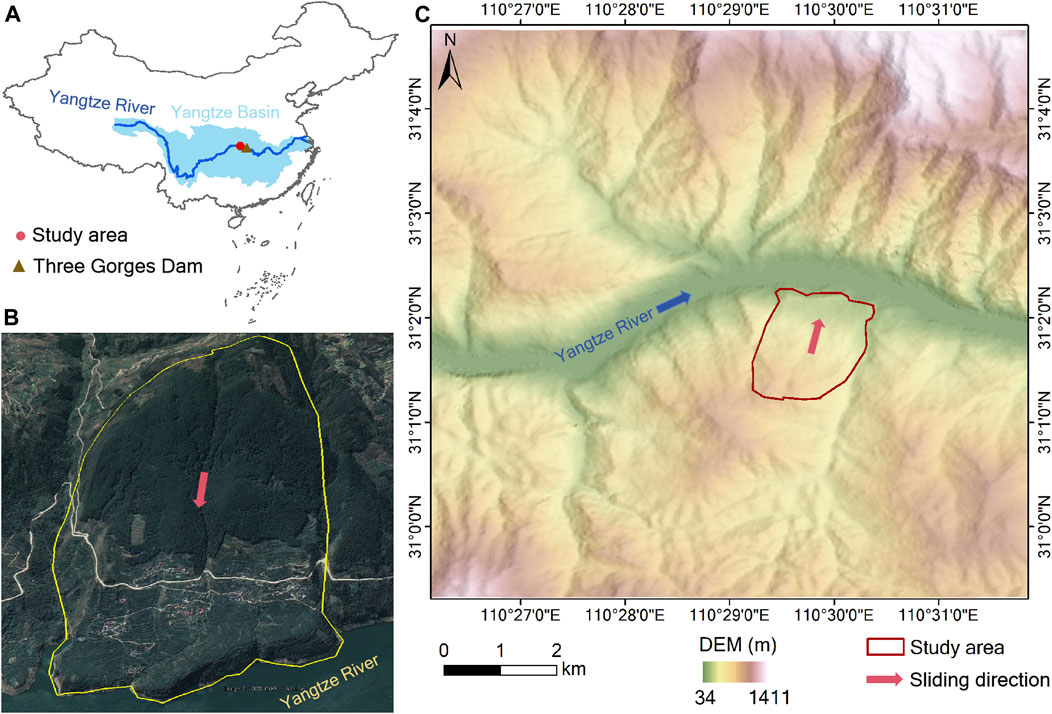
FIGURE 1. Location map of the study area. (A) Location of the study area in China. (B) Extent and DEM of Muyubao landslide. (C) Google image of Muyubao landslide.
The Muyubao area’s geological instability was evident, and its landslide susceptibility was intensified by geological processes, hydrological impacts, and human activities. The Muyubao landslide was located on the bank of the Yangtze River, about 56 km from the Three Gorges Dam. Its geological structure consisted mainly of Jurassic Xiangxi Group quartz sandstone and siltstone layers, which were inclined parallel to and in the same direction as the slope. The landslide-prone region’s geology primarily comprised mudstone, sandstone, and shale—materials susceptible to disintegration under weathering, fostering unstable slip surfaces. Hydrological complexity and abundant regional precipitation, particularly during the rainy season, exacerbated landslide triggers. Moreover, groundwater movement further undermined stability. Human interventions, escalating with the economic surge of the Three Gorges area, had altered land use and vegetation cover significantly, contributing to the instability of the landslide region. The upper part of the landslide exhibited a linear fracture surface with an inclination angle of about 25° and a thickness of 60–90 m. The front part was a bulging platform formed by shear sliding, with a thickness of 80–120 m and a stratum inclination angle of about 27°. These thickness values referred to the central part of the landslide and may have decreased towards the boundaries. The landslide was still active and had experienced multiple reactivation events in recent years (Zhou et al., 2020). Therefore, it was a priority case for monitoring, as a sudden destabilization of the landslide would endanger the lives and properties of 140 households (500 people) in the landslide area and threaten the road and shipping safety of the Yangtze River.
In this study, we applied the Small Baseline Subset (SBAS) approach of the Interferometric Synthetic Aperture Radar (InSAR) technique to analyze the temporal surface deformations of the Muyubao landslide. The SBAS InSAR method was selected for its efficacy in detecting and monitoring large-scale landslide deformations with high-resolution deformation mapping capabilities. This technique involved creating a series of interferograms from satellite images captured at different times, focusing on pairs with small temporal and spatial baselines to minimize atmospheric and decorrelation errors and enhance the accuracy of ground deformation measurements.
Our dataset comprised ascending interferometric observations captured at 90 epochs from 17 March 2016, to 13 September 2023. We processed the data using SARscape software, which included steps such as orbit correction, interferogram generation, phase unwrapping, and atmospheric and topographic correction. By analyzing the phase differences in the radar signals from different times, we measured the ground surface’s subtle displacements, essential for understanding the Muyubao landslide’s dynamics. The SBAS method enabled us to generate a time-series of deformation maps, offering critical insights into the landslide’s behavior over the 7-year observational period. The temporal cadence of acquisitions was approximately monthly, albeit with some variability.
Utilizing ENVI 5.6.2, preprocessing of the raw radar data was conducted to mitigate atmospheric disturbances, topographical effects, and other accuracy-impairing factors. Subsequent application of SBAS technology within SARscape software facilitated the generation of temporal-spatial and temporal-baseline plots (Figure 2), instrumental in evaluating data coherence and integrity. These plots ensured that subsequent analyses were underpinned by high-quality data, and also aided in identifying and excluding anomalous readings or errors that could compromise our findings. Specifically, the data points in the time-position plot were arranged periodically and had small overall errors (represented by vertical lines), which helped maintain high coherence and provide more accurate deformation measurements. This indicated that the SBAS InSAR results were good. Moreover, the baseline lengths in the time-baseline plot were generally small, which usually meant that the SBAS InSAR results were better (Figure 2). However, these plots only provided a qualitative assessment.

FIGURE 2. Temporal-spatial and temporal-baseline distributions for the study area. The data points are well-distributed across both dimensions, devoid of significant discontinuities or anomalies.
The construction of a series of small baseline interferograms enhanced spatiotemporal resolution and reduced phase ambiguities due to atmospheric variability and nonlinear ground motion. Post-interferogram generation and phase unwrapping yielded cumulative displacement information of the surface changes. The resulting time-series displacement data underwent further analysis, quantifying the characteristics and trends of surface deformation. To evaluate the accuracy of the InSAR results, we analyzed the frequency distribution of the root mean square error (RMSE), which is an attribute data of the points reported by the ENVI processing. We then compared the RMSE values of three types of land use data in the study area and examined the differential effects of land use on the accuracy of the results. Additionally, we validated the reliability of the InSAR deformation results by incorporating Global Navigation Satellite System (GNSS) data from other studies in the same research area (Zhou et al., 2020).
The drainage network levels reflected the complexity and intensity of water flow across the landslide area, which directly impacted the hydrological conditions within the landslide mass (He et al., 2023). Higher-order drainage networks indicated more extensive and interconnected water flow paths. To elucidate the relationship between landslide deformation rates and the hierarchical levels of drainage networks, we obtained high-resolution digital elevation model (DEM) data for the study area and extracted drainage networks of different levels based on watershed analysis methods. We classified the drainage networks into first-, second-, and third-order streams. This approach, based on the theory of hydrological connectivity, allows us to understand the influence of water flow patterns on landslide deformations. Drainage network levels were treated as categorical variables, while deformation rates served as the response variable. Boxplots were generated for each level of the drainage network to display the distribution of deformation rates at each hierarchical tier. Comparative analysis of these boxplots across drainage network levels allowed for the assessment of the correlation between deformation rates and the network hierarchy.
For the analysis of temporal trends in cumulative landslide deformation, we employed error bar charts. These charts depicted the mean cumulative deformation over time, with error bars representing the 95% confidence intervals to illustrate data variability. We first calculated the mean cumulative deformation and standard error at each time point for every drainage network level. Subsequently, error bar charts were plotted with the x-axis signifying time and the y-axis denoting cumulative deformation, where different lines represented varying levels of the drainage network hierarchy.
In our investigation, we probed the correlation between landslide deformation rates and slope gradients to pinpoint susceptibility intervals. The dataset, encompassing observations at 809 locales, detailed deformation velocities (mm/year) alongside slope angles (degrees). Employing box plots, we graphically articulated the distribution of deformation velocities across varying slope intervals. This method, grounded in descriptive statistics, offered insights into the central tendency and dispersion of data, crucial for understanding geomorphological influences. Slopes were segmented into deciles, spanning from 0° to 50°, in increments of 5°. For each interval, we computed mean deformation rates and their 95% confidence intervals. The box plots served to visualize velocity distributions within slope categories, with boxes delineating interquartile ranges, whiskers capturing variability, and outliers marked individually (García-Ruiz et al., 2010).
Complementing this analysis with detailed geological insights, we referenced the stratigraphic information from Zhou et al. (2020), which informed our analysis of the stratigraphic configuration within the landslide zones. Additionally, we generated new stratigraphic cross-section diagrams to vividly illustrate the potential linkages between geological structures and deformation. By overlaying landslide deformation rates and cumulative deformations onto these diagrams, we provided an enhanced visual representation of the stratigraphic influences on deformation and the underlying mechanisms of landslide occurrences.
To elucidate the spatial relationship between landslide deformation and human infrastructure, we compared deformation rates within residential zones, a 30-meter buffer surrounding roadways, and across the entire study area. We obtained the vector data of the study area from Google Earth software, and imported it into ArcGIS. We then used the Buffer tool to generate a 30-meter buffer around the roadways, and manually delineated the residential zones. We employed advanced visualization techniques, including boxplots and density plots, backed by statistical theories of data distribution and variability, to elucidate the characteristics of landslide deformation. These methods allowed for an in-depth analysis of how human activities influence landslide patterns. Boxplots served to identify principal trends, outliers, and potential anomalies in the data distribution, with quartiles and medians facilitating a rapid assessment of data centrality and dispersion. Density plots were instrumental in delineating the shape of data distribution, providing insight into the prevalence of data across varying ranges. Data processing and analysis were conducted within a Python framework, leveraging open-source libraries such as Pandas, Seaborn, and Matplotlib, ensuring the precision and integrity of our analysis. This synergistic application of analytical tools underpins the veracity of our results, offering robust data support for subsequent geological research and disaster mitigation efforts.
In an endeavor to decipher the interplay between precipitation, reservoir water levels, and landslide deformation trends from 2016 to 2023, our investigation meticulously harnessed daily mean water level and rainfall data from meteorological and water resource departments, complemented by approximately monthly intervals of landslide deformation records. The nearest rainfall station, located in Yichang, Hubei Province, China, had coordinates of 30.73°N, 111.367°E. The Muyubao landslide, 90 km northwest of the station, was influenced by the reservoir water level and precipitation. We obtained daily water level data of the Three Gorges Reservoir from the publicly available Hubei Province Common Hydrological Report website (http://113.57.190.228:8001/#!/web/Report/RiverReport), and matched them with rainfall data for the same period. A stringent data preprocessing regime was enforced—encompassing cleansing, standardization, imputation of missing values, outlier exclusion, and normalization—to ensure data integrity and uniformity. Specifically, linear interpolation was employed to infill gaps in the temporal landslide deformation dataset. Employing the Python programming language and the Matplotlib visualization library, we integrated the variables into a time-series graph, a methodological approach based on time-series analysis principles. This approach allowed us to observe patterns over time and understand the dynamic relationship between environmental factors and landslide deformation, demarcated by distinct colors and line styles, and augmented with standard deviation bands of landslide deformation trends for an intuitive representation of their interrelations and data variability insights. Through the meticulous scrutiny of the resultant charts, a compendium of pivotal findings and insights was distilled. Our comprehensive methodology and interpretive analyses elucidated how reservoir water levels and rainfall synergistically impact landslide deformation, thereby unveiling the underlying mechanisms and their implications.
In our investigation, we scrutinized the impact of precipitation and reservoir water levels on landslide displacement, quantified by the negative values of landslide deformation trends. Our study harnessed observational data spanning from 2016 to 2023, employing correlation coefficients to quantify inter-variable relationships. Preliminary data processing involved rectifying missing entries, standardizing date formats, and resolving inconsistencies. Notably, we navigated through three distinct date columns corresponding to observations of rainfall, reservoir levels, and landslide deformation trends. A harmonization process was applied to the dates associated with rainfall and reservoir levels, while the landslide deformation trend dates underwent separate analysis. Post-cleansing, we computed a correlation matrix, a statistical tool based on correlation theory, to measure the strength and direction of the relationship between variables. The visualization through heatmaps provides an intuitive understanding of these relationships, enhancing the interpretability of our findings. The computation of correlation coefficients, based on Pearson’s metric, ranged from −1, signifying a perfect inverse relationship, to +1, denoting absolute positive correlation, with 0 indicating no correlation.
Landslide deformation was characterized as a persistent subsidence process, with high deformation zones displaying spatial clustering (Figure 3). Deformation values predominantly ranged from −100 to 0 mm, exhibiting a distinct left-skewed distribution (Figure 4A), indicative of prevalent subsidence throughout the observation period. The frequency of deformation values escalated with decreasing magnitude, particularly dense within the −50 to 0 mm interval (Figure 4A), suggesting that minor to moderate subsidence events were more common within the landslide region. Mean deformation values fluctuated notably, oscillating approximately between −20 and 0 mm. Similarly, the standard deviation trends mirrored these fluctuations, underscoring the variability of deformation over time. Overall, the mean deformation throughout the observation period stood at −9.27 ± 14.43 mm, confirming the landslide’s dominant subsidence behavior with relatively significant fluctuations in deformation values.
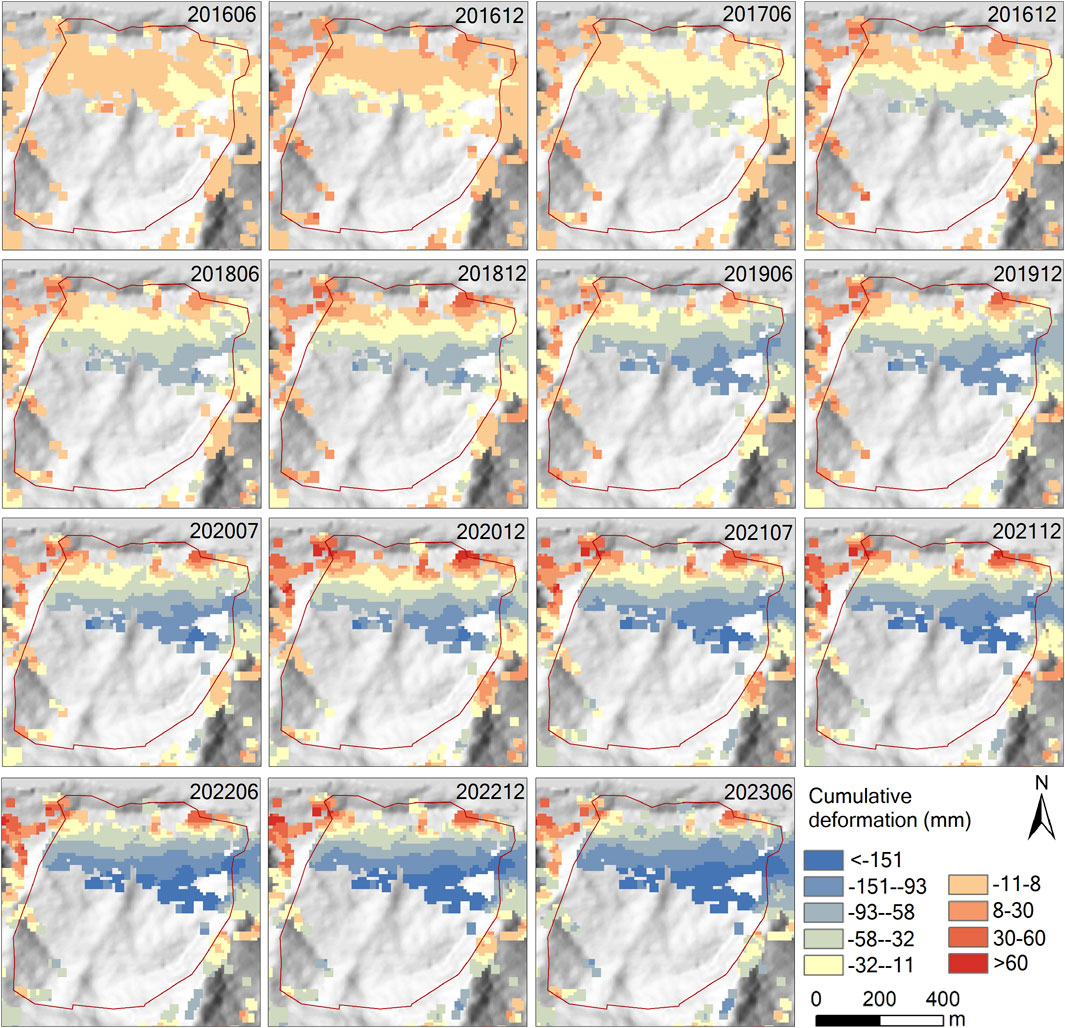
FIGURE 3. Time-series InSAR deformation in the study area during the survey period. For the sake of brevity, only the data for June and December of each year are shown.
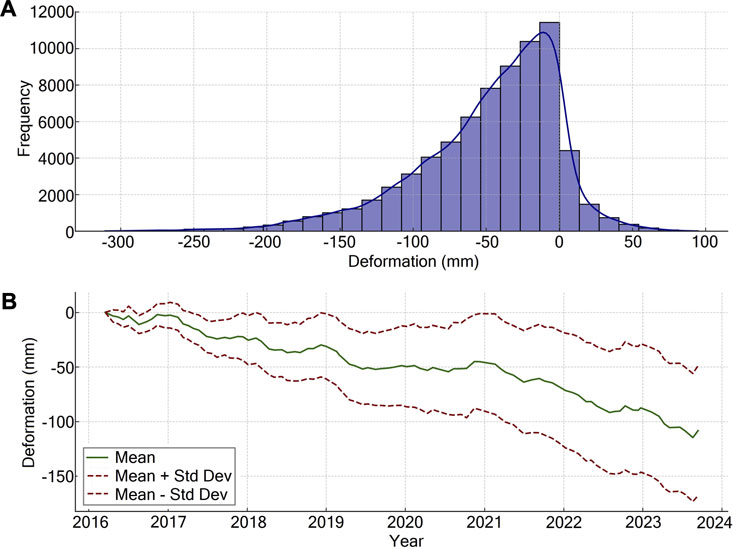
FIGURE 4. Time-series InSAR deformation analysis of the investigated landslides. (A) Frequency distribution of deformation at all deformation points. (B) Error bar graph of deformation trends, with error bars indicating one standard deviation.
Analysis of the drainage network hierarchy revealed that landslides at level 5 exhibited the most pronounced deformation rates, averaging −17.01 ± 3.65 mm/yr as shown in Figure 5B. Landslides within the first and second hierarchy levels displayed comparable rates of deformation, measuring −12.79 ± 0.97 and −12.05 ± 1.48 mm/yr, respectively. The least deformation was observed at level 3, with an average rate of −7.60 ± 1.75 mm/yr. Moreover, during the study period, cumulative deformation in areas of drainage network level 5 reached a striking −139.77 mm. In comparison, cumulative deformations for levels 1 and 2 were closely matched at −106.58 mm and −100.88 mm, respectively, while level 3 registered a cumulative shift of −67.06 mm. These disparities are likely attributable to the region’s inferior geological conditions and anthropogenic activities. The findings indicate a consistent rise in cumulative landslide deformation across all levels of drainage networks, with the rate of increase being significant over time. Despite the generally similar upward trend across different levels, variations were noted, particularly highlighting the positive correlation between higher drainage network levels and enhanced landslide deformation.
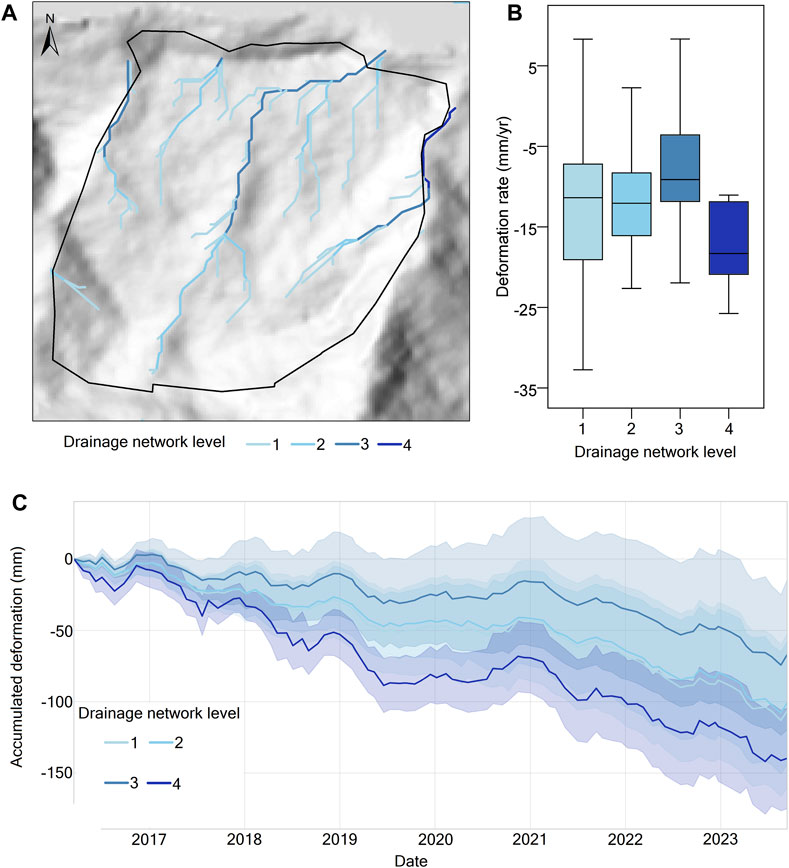
FIGURE 5. Drainage network and deformation. (A) Drainage network generated using a Digital Elevation Model (DEM). (B) Deformation rates of different hierarchical levels of the drainage network. (C) Temporal deformation of different network levels during the survey period. The data represent mean values ±95% confidence intervals.
Within the more modest incline brackets (0°–5° and 5°–10°), landslide deformation rates were lower and exhibited a concentrated distribution. For slopes ranging from 15° to 30°, deformation rates of landslides spanned a broader spectrum, with a notable incidence of extreme values, indicating increased susceptibility to deformation in these segments. Conversely, on steeper slopes (40°–45° and 45°–50°), landslide deformation rates remained comparatively consistent and were predominantly clustered around lower values.
The Muyu Fort landslide was situated within a geological stratum that not only paralleled but also inclined in the same direction as the slope. This stratum comprised alternating layers of Jurassic Xiangxi Group quartz sandstone and siltstone, as depicted in Figure 7A. The sliding plane, mainly identified in the mudstone with an approximate dip of 27°, was overlain by a loose sediment structure of colluvial soils and collapsed boulders. Below, the plane was predominantly constituted by layered quartz sandstone. At the landslide’s forefront, a raised platform had formed, resulting from shear sliding, characterized by persistent undulatory uplifts as shown in Figure 7C. In contrast, the central region of the slide displayed continuous subsidence. During the period of investigation, the cumulative subsidence exceeded 200 mm, particularly in the mid-section of the landslide, where rates surpassed 30 mm/yr. The intrinsic stratification of the rock formations compounded the potential for landslide disasters in this region.
Landslide deformation rates exhibited a differential distribution (Figures 8A, B), with residential and road areas experiencing average rates of −10.18 and −14.09 mm/yr, respectively. The overall deformation rates in road areas outpaced those in residential zones, largely due to significantly faster deformation at certain localities (Figure 8A). Density plots further elucidated the probability density distribution of the data, revealing a more dispersed distribution in residential areas and a sharper, more concentrated distribution within a 30-m buffer zone of roads, with a more gentle distribution across the entire region. This indicates that road areas were subject to greater deformation impacts, followed by residential areas.
Landslide deformation exhibited cyclic fluctuations correlated with variations in precipitation and reservoir water levels. During non-flood seasons, reservoirs were typically filled to normal storage levels to conserve water resources. Approaching the flood season, levels were methodically reduced below flood prevention thresholds to free up flood storage capacity in anticipation of potential floods (Figure 9). During the rainy seasons, an increased settlement was observed, while during water storage periods, landslide deformation stabilized, with instances of slight uplift. The settlement fluctuations in the rapid deformation zones of landslides paralleled the overall deformation trends but were of a greater magnitude, indicating a pervasive influence of rainfall and reservoir water levels on landslide deformation.
The correlation between rainfall and landslide settlement was notably weak (correlation coefficient of −0.03) (Figure 10A), indicating a minimal impact of rainfall on landslide settlement. Likewise, the correlation between reservoir water levels and landslide settlement was minimal (correlation coefficient of 0.16) (Figure 10A). When the analysis was focused on rapid deformation zones, there was almost no correlation between rainfall and rapid landslide settlement (correlation coefficient of −0.03), and only a marginal increase in correlation with reservoir water levels (correlation coefficient of 0.16) (Figure 10B). These findings suggested that significant deformations within landslides were more responsive to reservoir water levels. The overall weak correlations pointed to the possibility that landslide settlement was the result of a complex interplay of multiple factors, which required further investigation to uncover the underlying mechanisms.
The findings of this study underscore that the Muyubao landslide is an ongoing subsidence process, exhibiting pronounced spatial and temporal deformation disparities (Figure 3). Enhanced deformation rates and cumulative deformation values (Figure 5) are correlated with higher drainage network orders, suggesting a contributory role of drainage network grading in landslide deformation. Particularly, increased deformation rates in downstream drainage networks are observed, which is generally associated with the augmentation of internal pore water pressure due to water convergence, thereby diminishing the shear strength and stability of the landslide mass, a precursor to landslide initiation or acceleration (Zhang et al., 2021). Accumulation of water adds to the weight of the slope (Pearce and O’Loughlin, 1985), potentially increasing the driving force of landslides, especially in poorly consolidated or loose materials characteristic of our study area. Moreover, the confluence of watercourses elevates the moisture saturation and pore water pressure within the landslide body, undermining its stability. Sliding at the landslide’s tail induces reactivation and downslope movement in the central and frontal portions, thus creating a positive feedback loop encompassing water accumulation, pressure escalation, deformation transfer, rock failure, and slippage (He et al., 2023), perpetuating the landslide’s reactivation and acceleration. Zhou et al. (2020) analyzed the deformation rate and spatial distribution of the Muyubao landslide and found that the upper part of the eastern side deformed most significantly, while the western side deformed relatively less, consistent with our findings. Moreover, Deng et al. (2023) used various monitoring methods, including meteorological, hydrological, GNSS monitoring, and field inspection, and found that although the Muyubao landslide continued to deform, its movement rate gradually slowed down, indicating a low possibility of large-scale sliding, but requiring continuous monitoring and further research.
Vegetation affects soil hydraulic properties and hydrological response through soil structure development, thus delaying landslide initiation (Fan et al., 2022). Indeed, vegetation stabilizes slopes by increasing soil shear strength and reducing rainfall infiltration. However, in our study area, vegetation covered the upper and middle parts of the landslide deformation zone (Figure 8B), and the radar signal here was incoherent and the deformation result was inaccurate (Li M et al., 2021). However, based on the significant deformation under the vegetation, we infer that different degrees of sliding exist here. Notably, vegetation also increases soil weight and moisture content, thereby increasing landslide driving force. Moreover, vegetation alters soil physical properties, such as porosity, permeability, and soil saturation, which facilitate landslide deformation (Li M et al., 2021). Additionally, vegetation type and distribution have important effects on soil stability. Deep-rooted plants usually enhance soil stability more effectively, while shallow-rooted plants may provide less support under gravity (Jiang et al., 2023). Overall, although the artificially planted trees in our study area mitigate landslide deformation, some extreme rainfall events increase gravity by preventing rapid drainage of water from the landslide mass, which further aggravates landslide hazard risk. Therefore, we argue that the influence of water flow on landslides depends on whether it can be smoothly and quickly drained from the landslide mass. On the other hand, previous studies have shown that faults and fractures in the landslide zone allow reservoir water to infiltrate deeply into the rock mass, exacerbating the effect of water level fluctuations on landslide stability (Zhou et al., 2020). This indicates that the influence of water on landslide deformation is complex.
Slope angle also influences landslide deformation, with the 15°–30° range being relatively more unstable and susceptible to deformation. Studies suggest steeper slopes bear a larger component of gravitational force on the materials, fostering their downslope motion (Bai B et al., 2020). However, slope steepness modulates water flow and drainage on slopes; steeper regions typically exhibit superior drainage, whereas gentler slopes may engender water retention, increasing landslide risk. Our survey pinpointed continuous gentle slopes as areas corresponding to significant landslide subsidence (Figure 6A). Similarly, García-Ruiz et al. (2010) identified the 15°–30° slope range as highly prone to landslide deformation, proposing that soil stability decreases dramatically above 30°, prone to sliding even under dry conditions, while below 15°, soils remain stable even when saturated.
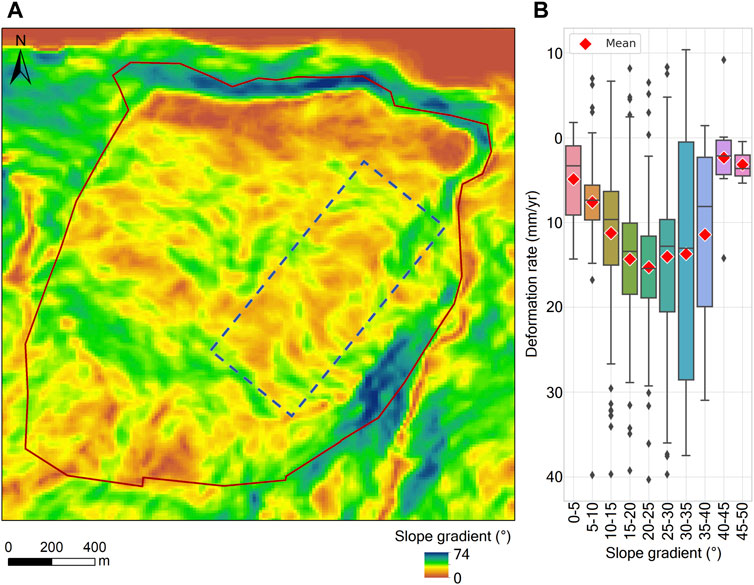
FIGURE 6. Slope gradient and deformation. (A) Slope gradient map, the dashed rectangular area is a continuous gentle slope on the slope. (B) Deformation rates of different classes of drainage networks.
At the micro-scale, the sandy mudstone layer has higher clay and moisture content compared to the overlying quartz sandstone layer. The increased moisture weakens the intermolecular bonds between clay particles in the muddy sandstone, causing clay aggregation, pore water pressure build up, and reduction of effective stress (Hu et al., 2018). This leads to the development of a micro-scale slip surface along the sandy mudstone layer. Additionally, the differential hardness and brittleness between the quartz sandstone and underlying sandy mudstone results in a discrepancy in strain response and shear strength under gravitational loading. The brittle sandstone layer accumulates elastic strain energy and undergoes fracturing, while the softer sandy mudstone layer deforms plastically via particle rearrangement and sliding (Petley et al., 2005). This mismatch in elastic-plastic response generates shear stress concentrations along the interface, further propagating the slip surface (Pearce and O’Loughlin, 1985). At the pore-scale, moisture infiltration into the sandy mudstone elevates matric suction and pore water pressure (Urciuoli et al., 2016). This reduces the effective normal stress across potential shear planes per the principle of effective stress. Moreover, wetting induces physicochemical changes in clay minerals within the mudstone, especially montmorillonite. The hydration of interlayer cations causes swelling and softening (Pötzl et al., 2018), degrading the shear strength. Furthermore, cycles of wetting and drying can gradually alter the mudstone fabric and macro-porosity (Hu et al., 2018), enhancing deformability. Moreover, after the landslide sliding, the high-water-content mudstone remaining in the landslide body continued to soften and weaken, resulting in the landslide body not stabilizing quickly, but rather slowly sliding and expanding (Zhang et al., 2017). This implies that the landslide will persist unless the frictional force inside the mudstone reaches a new equilibrium. These factors exacerbate the shear stress disparity across the slip surface, diminishing landslide stability. Furthermore, moisture influences the internal stress distribution and deformation characteristics of the landslide body, as evidenced by the observed frontal uplift and sustained central subsidence in the landslide mass (Figure 7), likely attributable to variable lubrication or expansion effects induced by moisture in different areas.
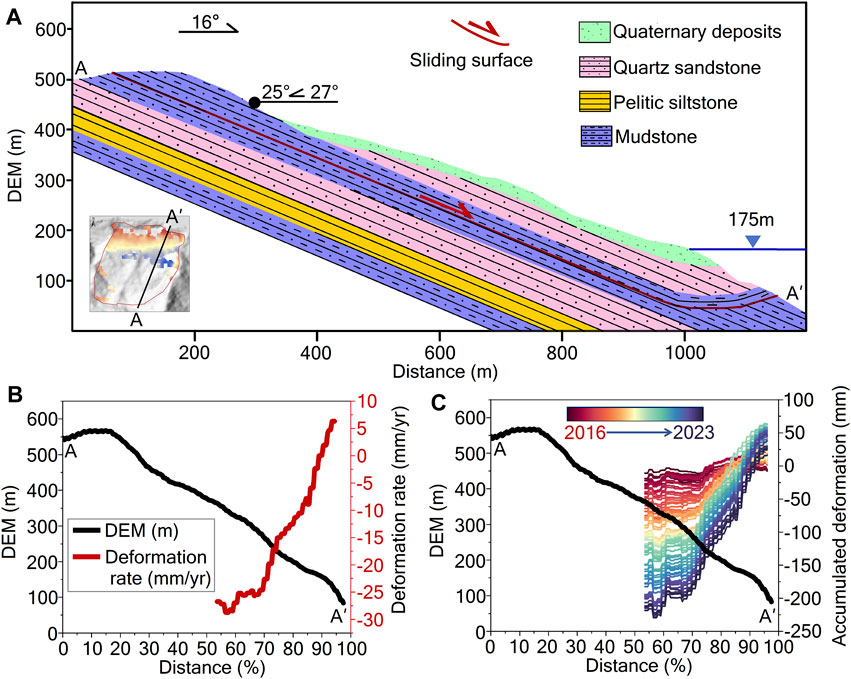
FIGURE 7. Stratigraphic and geomorphic differentiation of landslide deformation. (A) Stratigraphic information along the profile. (B) DEM and landslide deformation rate. (C) DEM and cumulative deformation. Note that in segments (B) and (C), “x” axis denotes the percentage distance along the A-A′ transect.
Human activities, by altering land use and disrupting vegetation cover, exacerbate slope erosion and denudation, thereby diminishing the stability of landslide masses and augmenting the likelihood of landslide reactivation (Peng et al., 2016; Jiang et al., 2022). In the present study, we meticulously compared deformation rates within a 30-m buffer zone encompassing residential areas and roads in a landslide-prone region. Road construction has been implicated in altering the natural flow of water, potentially leading to an aggregation of moisture in certain areas and thereby increasing landslide susceptibility (Li SH et al., 2021). Wu et al. (2001) showed that road and tunnel construction altered the mountain structure, hydrological conditions, and stability state, accelerating and triggering landslides in the Three Gorges Reservoir area (Li et al., 2019). Moreover, road and tunnel construction increased the upper load and disturbed the original vegetation, weakening the shear strength of the mountain, which is a key factor for inducing landslides (Tang et al., 2019). Li et al. (2019) analyzed the correlation between road density and landslide occurrence frequency in our study area and found that areas with higher road density had significantly higher landslide occurrence frequency. However, residential zones lack the convergent water flow characteristic of roadways, contributing to the observed discrepancy in deformation rates—roads exhibited a significant increase in deformation speed (−14.09 mm/yr) compared to residential areas (−10.18 mm/yr), particularly around certain localized sections of the roadway (Figures 8A, B). Moreover, road construction often entails the cutting of platforms at the base of a landslide, which can heighten shear stress within the landslide mass (Li et al., 2020). On the other hand, the construction of numerous new dwellings on the landslide mass (Figure 8A) has augmented the gravitational load, thereby decreasing shear strength and triggering the formation and movement of new landslide bodies.
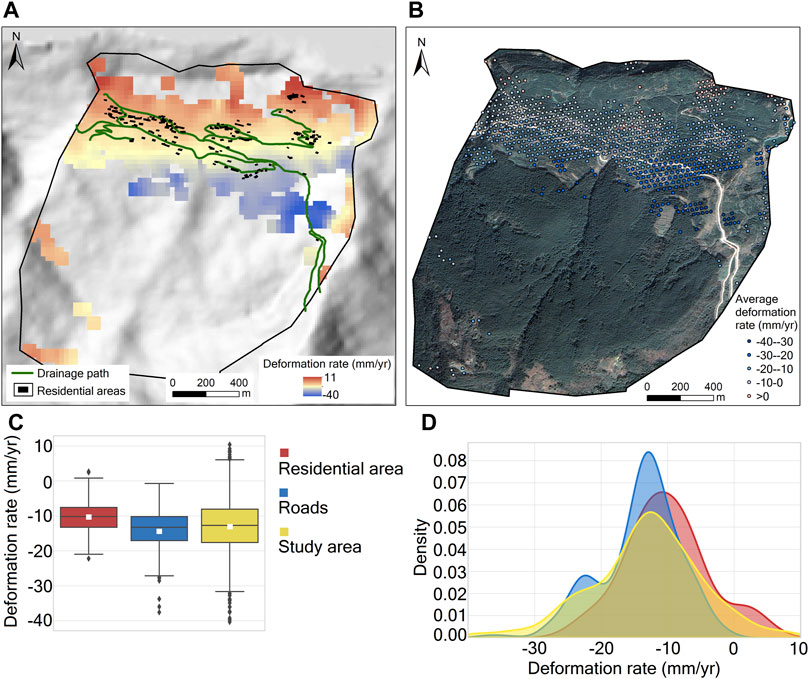
FIGURE 8. Comparison of landslide deformation rates within 30 m of road buffers and residential areas. (A) Residential areas and roads in the study area with deformation rate maps and digital surface model (DSM) in the background. (B) Deformation rate map with Google imagery in the background. (C) and (D) Boxplots and density plots of deformation rates in residential areas, landslide deformation rates within 30 m of the road buffer versus deformation rates for the entire study area, respectively, with boxplots showing the median (horizontal line) mean (white rectangle), quartiles, and outliers (black dots) of the data.
By examining the relationship between landslide deformation, precipitation, and reservoir water levels, we discerned a pronounced cyclical fluctuation in landslide deformation (Figure 9), consistent with the variations in reservoir water levels, while precipitation showed no significant correlation (Figure 10). Previous research suggests that rapid declines in reservoir water levels can precipitate marked “jumps” in deformation rates (Tang et al., 2015). This is attributed to the impact of reservoir level fluctuations on the permeation pressure and effective stress in the surrounding rock, diminishing shear strength, and inducing changes in the internal seepage and stress on slip surfaces. Consequently, higher reservoir levels are associated with greater deformation rates (Sun et al., 2016). Our findings, however, do not corroborate this, as we observed that rising reservoir levels corresponded with a stabilization or even uplift phase in landslide deformation (Figure 9). The increase in water levels could enhance the support pressure at the base of the slide, augmenting the overall stabilizing torque, and potentially providing a degree of support to the landslide mass. With rising water levels, internal seepage direction shifts from downward to upward, increasing pore water pressure at the upper portion of the slip surface while reducing it at the lower portion. Conversely, a decrease in water levels reverses this seepage direction, with the accompanying stress redistribution potentially exacerbating the differential shear stress across the slip surface, thereby promoting deformation (Xia et al., 2013). However, it is generally accepted that an increase in reservoir water levels also intensifies the permeation pressure on the surrounding rock, undermines shear strength, and increases sliding forces (Ye and Ghassemi, 2018), indicating that the impact of water levels on landslide deformation is multifaceted.
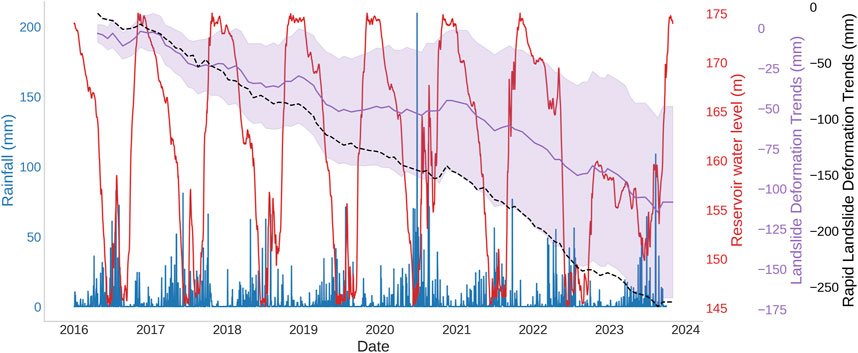
FIGURE 9. The relationship between rainfall, reservoir water levels, and landslide deformation. The blue bar chart represents daily rainfall, the red line graph indicates the daily water levels in the reservoir, the black dashed line shows the cumulative deformation of landslide points that exceed 30 mm/yr, and the purple line represents the average cumulative landslide deformation. The cumulative deformation of the landslide is presented as the mean ± standard deviation.
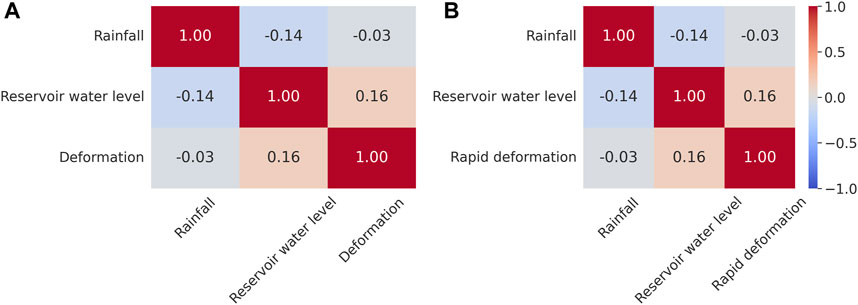
FIGURE 10. The correlation between rainfall, reservoir water levels, and the magnitude of landslide deformation. (A) the relationship of rainfall and reservoir water levels with the overall landslide deformation. (B) the relationship with landslide deformation in areas of rapid deformation, which are defined by average settlement rates exceeding 30 mm/yr.
Numerous studies have confirmed that precipitation promotes landsliding, for instance, Iverson and Major (1987) noted that rainwater infiltration, contributing to subterranean water flow, enhances the lubrication and loading of the landslide mass, thus inducing outward movement. During dry seasons, the reduction in groundwater flow arrests this movement, with the mountain’s gravitational pull inducing inward contraction. Furthermore, greater precipitation intensity accelerates the increase in underground water pressure, leading to more active deformation (Hong et al., 2005). Nevertheless, our findings regarding precipitation and landslide deformation do not fully support this view. We hypothesize that the primary reason for the lack of coherence may be the inverse rhythm of reservoir water levels compared to rainfall patterns. Yang et al. (2017) also contend that both rainfall and the lowering of water levels in the Three Gorges Reservoir contribute to the accelerated deformation of landslides. On the other hand, temperature and humidity are important factors affecting landslide stability, especially in complex geological environments such as the Three Gorges Reservoir area. High temperature may cause water evaporation in rocks and soils, altering the hydrological conditions of the landslide mass (Bai Y J et al., 2020), while high humidity may increase the weight and reduce the friction of the landslide mass (Hong et al., 2005). Moreover, temperature and humidity changes may affect the growth of surface vegetation (Arnone et al., 2016), which in turn may indirectly influence landslide stability.
Leveraging time-series InSAR technology, our study has tracked the dynamic subsidence of the Muyubao landslide from 2016 to 2023, attempting to unravel the composite influence mechanisms behind deformation through statistical correlation with topographic and geologic factors (Zhang et al., 2018). Nonetheless, our study was subject to considerable uncertainty. For instance, the resolution limits of InSAR in detecting surface deformation (Intrieri et al., 2011), and the constrained sampling of deformation points which may not reflect the entire landslide region (Handwerger et al., 2016), this was mainly because vegetation-induced decorrelation of the radar signal resulted in data gaps in large areas of the landslide head and body. Moreover, the RMSE of Forest was 1.45 times higher than that of Cropland, indicating the interference of vegetation cover on the results (Figure 11C). Another extreme case was water bodies, which caused signal loss and extreme errors by specular reflection and absorption of radar waves (Figure 11C). Numerous studies have also demonstrated the interference of vegetation and water bodies on the accuracy of InSAR results (e.g., Li M et al., 2021). Overall, all InSAR results showed small errors (Figures 11A, B). Hence, we can conduct a partial assessment of the landslide deformation using the available data. Furthermore, potential discrepancies in rainfall boundary conditions due to the remote location of meteorological stations, and the opaque interconnections between influencing factors that complicate the determination of causative relationships—all these factors introduce varying degrees of imprecision to our findings and the reliability of our conclusions.
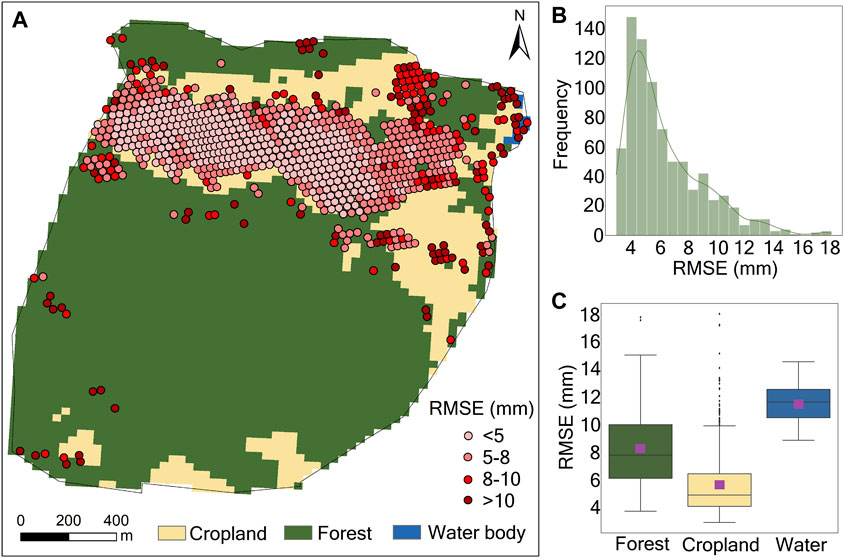
FIGURE 11. Root Mean Square Error (RMSE) of InSAR results. (A) Spatial distribution of RMSE, with land use types as the base map. (B) Frequency distribution of RMSE. (C) RMSE for different land use types. The data represent mean values ±95% confidence intervals.
To mitigate these uncertainties, future research must expand the scope of deformation monitoring through additional InSAR analysis with higher resolution sensors and multi-platform data fusion. More extensive field investigations should be conducted to augment the spatial sampling of deformation measurements, especially in vegetated sectors through terrestrial laser scanning. Process-based hydro-mechanical models should be developed to simulate seepage, pore pressure and stability conditions within the landslide mass under dynamic external forcing. Such numerical modeling calibrated by field data can help quantify the relative contributions of individual factors and predictive landslide acceleration. Furthermore, a denser network of meteorological and hydrological monitoring stations is imperative for reducing uncertainties in environmental boundary conditions. Integrating these advanced monitoring, modeling and analytical techniques can significantly bolster the reliability of findings and underpin quantitative landslide forecasting and early warning. Although our study has limitations, it provides a methodological foundation and first-order insights to guide follow-up investigations on unraveling landslide mechanisms in the Three Gorges Reservoir area.
To validate our InSAR results, we incorporated the GNSS data from June 2016 to September 2017. This inclusion offers a more robust, multi-modal approach to landslide deformation analysis. The Global GNSS data, sourced from Zhou et al. (2020), provide a continuous time series for the Muyubao landslide. The displacement data measured by InSAR and GNSS are generally consistent (Figure 12), indicating that the InSAR results are effective in reflecting the surface deformation trends. Although at some time points, the InSAR data show slightly larger displacements than the GNSS, this consistency suggests that the two techniques are complementary in monitoring landslide deformation, despite their differences in principles and measurements.
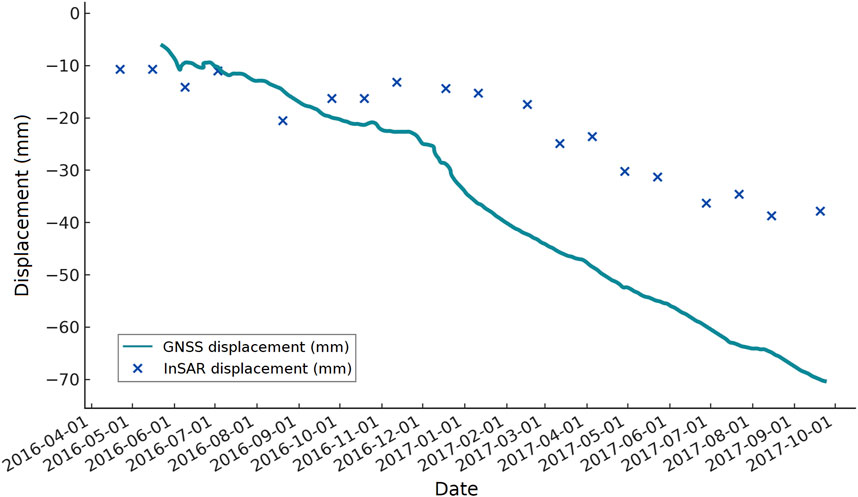
FIGURE 12. Comparative analysis of InSAR deformation and GNSS data.
This research represents a landslide deformation analysis through its integrated use of time-series InSAR techniques and multi-source geospatial statistical analysis, a approach for comprehensively monitoring and understanding the dynamics of the Muyubao landslide over an extended period (2016–2023). Key innovations of this study include the detailed characterization of spatio-temporal landslide deformation, the identification of the specific impact of factors such as drainage networks, slope gradients, geological structures, human activities, and reservoir water level changes, and the unique correlation of these factors with landslide behavior. Notably, this research highlights the predominant influence of human activities and reservoir operations on landslide deformation, challenging the traditional emphasis on natural factors alone. The study’s findings pave the way for future research directions, including the need for high-resolution InSAR data analysis, enhanced field measurements, and development of predictive models for landslide behavior. Furthermore, there is a need to explore the role of vegetation and land use changes in landslide dynamics. Extending the application of this methodological approach to other landslide-prone regions is vital for improving disaster prediction and management strategies globally. This study’s methodological advancements offer a transformative approach to landslide risk assessment and mitigation.
The raw data supporting the conclusion of this article will be made available by the authors, without undue reservation.
RY: Conceptualization, Methodology, Project administration, Writing–review and editing, Software, Supervision, Writing–original draft. WL: Writing–review and editing, Visualization, Methodology, Software. CY: Investigation, Writing–review and editing, Formal Analysis, Methodology. PK: Formal Analysis, Funding acquisition, Writing–original draft, Writing–review and editing, Methodology, Supervision.
The author(s) declare financial support was received for the research, authorship, and/or publication of this article. This work was supported by the Scientific and Technological Research Program of Chongqing Municipal Education Commission (KJQN202100624), the Construction of Doctoral Degree Authorization Discipline System (a sub-project of the Civil Aviation Development Fund Project) (MHJY2023022), the Construction of Civil Aviation Characteristic Discipline System (a special project for building world-class universities and disciplines and characteristic development guidance of central universities) (D202202), and the Construction of Innovative Team of Advantageous and Characteristic Disciplines (BSJ 2021-2).
Author CY was employed by CNPC Bohai Drilling Engineering Co. Ltd.
The remaining authors declare that the research was conducted in the absence of any commercial or financial relationships that could be construed as a potential conflict of interest.
All claims expressed in this article are solely those of the authors and do not necessarily represent those of their affiliated organizations, or those of the publisher, the editors and the reviewers. Any product that may be evaluated in this article, or claim that may be made by its manufacturer, is not guaranteed or endorsed by the publisher.
Arnone, E., Dialynas, Y. G., Noto, L. V., and Bras, R. L. (2016). Accounting for soil parameter uncertainty in a physically based and distributed approach for rainfall-triggered landslides. Hydrol. Process. 30 (6), 927–944. doi:10.1002/hyp.10609
Bai, B., Wang, J., Zhai, Z., and Xu, T. (2017). The penetration processes of red mud filtrate in a porous medium by seepage. Transp. Porous Media 117, 207–227. doi:10.1007/s11242-017-0829-9
Bai, B., Xu, T., Nie, Q., and Li, P. (2020). Temperature-driven migration of heavy metal Pb2+ along with moisture movement in unsaturated soils. Int. J. Heat. Mass Transf. 153, 119573. doi:10.1016/j.ijheatmasstransfer.2020.119573
Bai, Y. J., Wang, Y. S., Ge, H., and Tie, Y. b. (2020). Slope structures and formation of rock-soil aggregate landslides in deeply incised valleys. J. Mt. Sci. 17, 316–328. doi:10.1007/s11629-019-5623-4
Deng, M., Huang, X., Yi, Q., Liu, Y., Yi, W., and Huang, H. (2023). Fifteen-year professional monitoring and deformation mechanism analysis of a large ancient landslide in the Three Gorges Reservoir Area, China. Bull. Eng. Geol. Environ. 82 (7), 243. doi:10.1007/s10064-023-03262-9
Fan, L., Lehmann, P., Zheng, C., and Or, D. (2022). Vegetation-promoted soil structure inhibits hydrologic landslide triggering and alters carbon fluxes. Geophys. Res. Lett. 49 (18), e2022GL100389. doi:10.1029/2022gl100389
García-Ruiz, J. M., Beguería, S., Alatorre, L. C., and Puigdefábregas, J. (2010). Land cover changes and shallow landsliding in the flysch sector of the Spanish Pyrenees. Geomorphology 124 (3-4), 250–259. doi:10.1016/j.geomorph.2010.03.036
Handwerger, A. L., Fielding, E. J., Huang, M. H., Bennett, G. L., Liang, C., Schulz, W. H., et al. (2016). Monitoring activity at the Daguangbao mega-landslide (China) using Sentinel-1 TOPS time series interferometry. Remote Sens. Environ. 186, 501–513. doi:10.1016/j.rse.2016.09.009
He, Q., Guo, F., Li, R., Wang, L., Wang, W., Zhang, N., et al. (2023). Characteristics, mobility and dynamic of the Yahuokou flow-like landslide in Zhouqu, Gansu, China. Landslides 20, 629–643. doi:10.1007/s10346-022-02000-8
Hong, Y., Hiura, H., Shino, K., Sassa, K., Suemine, A., Fukuoka, H., et al. (2005). The influence of intense rainfall on the activity of large-scale crystalline schist landslides in Shikoku Island, Japan. Landslides 2, 97–105. doi:10.1007/s10346-004-0043-z
Hu, W., Scaringi, G., Xu, Q., Van Asch, T. W., Huang, R., and Han, W. (2018). Suction and rate-dependent behaviour of a shear-zone soil from a landslide in a gently-inclined mudstone-sandstone sequence in the Sichuan basin, China. China. Eng. Geol. 237, 1–11. doi:10.1016/j.enggeo.2018.02.005
Huang, R., Zhao, J., Ju, N., Li, G., Lee, M. L., and Li, Y. (2013). Analysis of an anti-dip landslide triggered by the 2008 Wenchuan earthquake in China. Nat. Hazards 68, 1021–1039. doi:10.1007/s11069-013-0671-5
Intrieri, E., Raspini, F., Fumagalli, A., Lu, P., Del Conte, S., Farina, P., et al. (2011). Using advanced InSAR time series techniques to monitor landslide movements in Badong of the Three Gorges region, China. Int. J. Remote Sens. 32 (11), 3303–3320. doi:10.1016/j.jag.2011.10.010
Iverson, R. M., and Major, J. J. (1987). Rainfall, ground-water flow, and seasonal movement at Minor Creek landslide, northwestern California: physical interpretation of empirical relations. Geol. Soc. Am. Bull. 99 (4), 579–594. doi:10.1130/0016-7606(1987)99<579:rgfasm>2.0.co;2
Jiang, H., Zou, Q., Zhou, B., Jiang, Y., Cui, J., Yao, H., et al. (2023). Estimation of shallow landslide susceptibility incorporating the impacts of vegetation on slope stability. Int. J. Disaster Risk Sci. 1, 618–635. doi:10.1007/s13753-023-00507-9
Jiang, W., Chen, G., Meng, X., Jin, J., Zhao, Y., Lin, L., et al. (2022). Probabilistic rainfall threshold of landslides in Data-Scarce mountainous Areas: a case study of the Bailong River Basin, China. Catena 213, 106190. doi:10.1016/j.catena.2022.106190
Leng, Y., Peng, J., Wang, Q., Meng, Z., and Huang, W. (2018). A fluidized landslide occurred in the Loess Plateau: a study on loess landslide in South Jingyang tableland. Eng. Geol. 236, 129–136. doi:10.1016/j.enggeo.2017.05.006
Li, C., Fu, Z., Wang, Y., Tang, H., Yan, J., Gong, W., et al. (2019). Susceptibility of reservoir-induced landslides and strategies for increasing the slope stability in the Three Gorges Reservoir Area: Zigui Basin as an example. Eng. Geol. 261, 105279. doi:10.1016/j.enggeo.2019.105279
Li, M., Ma, C., Du, C., Yang, W., Lyu, L., and Wang, X. (2021). Landslide response to vegetation by example of July 25–26, 2013, extreme rainstorm, Tianshui, Gansu Province, China. Bull. Eng. Geol. Environ. 80, 751–764. doi:10.1007/s10064-020-02000-9
Li, S. H., Luo, X. H., and Wu, L. Z. (2021). A new method for calculating failure probability of landslide based on ANN and a convex set model. Landslides 18 (8), 2855–2867. doi:10.1007/s10346-021-01652-2
Li, W., Zhao, B., Xu, Q., Yang, F., Fu, H., Dai, C., et al. (2020). Deformation characteristics and failure mechanism of a reactivated landslide in Leidashi, Sichuan, China, on August 6, 2019: an emergency investigation report. Landslides 17, 1405–1413. doi:10.1007/s10346-020-01367-w
Pearce, A. J., and O’Loughlin, C. L. (1985). Landsliding during a M 7.7 earthquake: influence of geology and topography. Geology 13 (12), 855–858. doi:10.1130/0091-7613(1985)13<855:ldamei>2.0.co;2
Peng, D., Xu, Q., Qi, X., Fan, X., Dong, X., Li, S., et al. (2016). Study on early recognition of loess landslides based on field investigation. Int. J. Georesour. Environ.-IJGE Former. Int'l J Geohazards Environ. 2 (2), 35–52. doi:10.15273/ijge.2016.02.006
Petley, D. N., Mantovani, F., Bulmer, M. H., and Zannoni, A. (2005). The use of surface monitoring data for the interpretation of landslide movement patterns. Geomorphology 66 (1-4), 133–147. doi:10.1016/j.geomorph.2004.09.011
Pötzl, C., Dohrmann, R., and Siegesmund, S. (2018). Clay swelling mechanism in tuff stones: an example of the Hilbersdorf Tuff from Chemnitz, Germany. Environ. Earth Sci. 77 (5), 188. doi:10.1007/s12665-018-7345-2
Sun, G., Zheng, H., Huang, Y., and Li, C. (2016). Parameter inversion and deformation mechanism of Sanmendong landslide in the Three Gorges Reservoir region under the combined effect of reservoir water level fluctuation and rainfall. Eng. Geol. 205, 133–145. doi:10.1016/j.enggeo.2015.10.014
Tang, H., Li, C., Hu, X., Wang, L., Criss, R., Su, A., et al. (2015). Deformation response of the Huangtupo landslide to rainfall and the changing levels of the Three Gorges Reservoir. Bull. Eng. Geol. Environ. 74, 933–942. doi:10.1007/s10064-014-0671-z
Tang, H., Wasowski, J., and Juang, C. H. (2019). Geohazards in the three Gorges reservoir area, China–lessons learned from decades of research. Eng. Geol. 261, 105267. doi:10.1016/j.enggeo.2019.105267
Urciuoli, G., Pirone, M., Comegna, L., and Picarelli, L. (2016). Long-term investigations on the pore pressure regime in saturated and unsaturated sloping soils. Eng. Geol. 212, 98–119. doi:10.1016/j.enggeo.2016.07.018
Wu, S., Shi, L., Wang, R., Tan, C., Hu, D., Mei, Y., et al. (2001). Zonation of the landslide hazards in the forereservoir region of the three Gorges project on the Yangtze River. Eng. Geol. 59 (1-2), 51–58. doi:10.1016/s0013-7952(00)00061-2
Xia, M., Ren, G. M., and Ma, X. L. (2013). Deformation and mechanism of landslide influenced by the effects of reservoir water and rainfall, Three Gorges, China. Nat. Hazards 68, 467–482. doi:10.1007/s11069-013-0634-x
Yang, B., Yin, K., Xiao, T., Chen, L., and Du, J. (2017). Annual variation of landslide stability under the effect of water level fluctuation and rainfall in the Three Gorges Reservoir, China. Environ. Earth Sci. 76, 564–617. doi:10.1007/s12665-017-6898-9
Ye, Z., and Ghassemi, A. (2018). Injection-induced shear slip and permeability enhancement in granite fractures. J. Geophys. Res. Solid Earth 123 (10), 9009–9032. doi:10.1029/2018jb016045
Zhang, L., Ding, X., Lu, Z., Yang, C., and Kim, J. W. (2018). Investigating slow-moving landslides in the Zhouqu region of China using InSAR time series. Landslides 15 (2), 233–246. doi:10.1007/s10346-018-0954-8
Zhang, Y. G., Tang, J., Liao, R. P., Zhang, M. F., Zhang, Y., Wang, X. M., and Su, Z. Y. (2021). Application of an enhanced BP neural network model with water cycle algorithm on landslide prediction. Stoch. Environ. Res. Risk Assess. 35, 1273–1291. doi:10.1007/s00477-020-01920-y
Zhang, Z., Wang, T., Wu, S., Tang, H., and Liang, C. (2017). The role of seismic triggering in a deep-seated mudstone landslide, China: historical reconstruction and mechanism analysis. Eng. Geol. 226, 122–135. doi:10.1016/j.enggeo.2017.06.001
Keywords: time-series InSAR, Muyuba landslide, deformation monitoring, multisource statistical analysis, Zigui county
Citation: Yang R, Liang W, Yu C and Kou P (2024) Elucidating the complex interplay between natural and anthropogenic factors in the deformation of the Muyubao landslide through time-series InSAR analysis. Front. Earth Sci. 12:1337209. doi: 10.3389/feart.2024.1337209
Received: 12 November 2023; Accepted: 31 January 2024;
Published: 16 February 2024.
Edited by:
Zhuo Chen, Sichuan Agricultural University, ChinaReviewed by:
Bo Zhao, Chinese Academy of Sciences (CAS), ChinaCopyright © 2024 Yang, Liang, Yu and Kou. This is an open-access article distributed under the terms of the Creative Commons Attribution License (CC BY). The use, distribution or reproduction in other forums is permitted, provided the original author(s) and the copyright owner(s) are credited and that the original publication in this journal is cited, in accordance with accepted academic practice. No use, distribution or reproduction is permitted which does not comply with these terms.
*Correspondence: Pinglang Kou, cGluZ2xhbmdrb3VAMTYzLmNvbQ==
Disclaimer: All claims expressed in this article are solely those of the authors and do not necessarily represent those of their affiliated organizations, or those of the publisher, the editors and the reviewers. Any product that may be evaluated in this article or claim that may be made by its manufacturer is not guaranteed or endorsed by the publisher.
Research integrity at Frontiers
Learn more about the work of our research integrity team to safeguard the quality of each article we publish.