 Qi Fan
 Tailiang Fan2
 Zhenyu Zhu
- 1State Key Laboratory of Gas Hydrates, CNOOC Research Institute, Beijing, China
- 2Department of Energy, China University of Geosciences, Beijing, China
The Cambrian Terreneuvian Yuertusi Formation of the Tarim Basin, regarded as a potential hydrocarbon source rock (TOCmax = 29.8 wt%), preserves the record of the Ediacaran to Cambrian Series 2 transition. This study presents a high-resolution multi-proxy investigation of the Sugaitebulake and Yutixi sections of the NW Tarim Basin. Evidence of hydrothermal activity and euxinic conditions in the earliest Cambrian has been delineated by samples from the lower part of the Yuertusi Formation group A, featured by weakly positive Ce anomalies (Ce/Ce*avg. = 0.46), extremely positive Eu anomalies (Eu/Eu*avg. = 26.39), Y/Ho ratios (Y/Hoavg. = 40.48) and several barite layers. Mo and U covariation suggests that the Yuertusi Formation group A and Xiaoerbulake Formation were deposited under sulfidic conditions, whereas the Ediacaran Qigebulake Formation, and Yuertusi Formation groups B and C and D accumulated under suboxic to anoxic conditions. The basin has been weakly restricted and characterized by elevated productivity (Ba-excessavg. = 6,410.42 ppm) during Terreneuvian time. Suboxic conditions in late Ediacaran time (Qigebulake Formation) became euxinic conditions in association with increased sea level and productivity sustained by hydrothermal activity and upwelling, which have been preserved in the organic-rich lower part of the Yuertusi Formation. Suboxic conditions were reestablished during the Cambrian Terreneuvian time as reflected in the geochemistry of the upper part of the Yuertusi Formation. Euxinic conditions were once again established early in Cambrian Series 2 Xiaoerbulake Formation. Euxinic conditions were coincident with transgressions of the South Tianshan Ocean during that interval. The accumulation and preservation of organic matter of the Early Cambrian northern Tarim Platform reflect the interaction of hydrothermal activity, coastal upwelling, and sea level change.
Highlights
• Redox conditions changes were revealed by multiple redox proxies.
• Episodic hydrothermal activity of the earliest Cambrian was confirmed by REEs and Eu anomalies.
• Elevated productivity in the early Cambrian was evinced by excess-Ba and TOC contents.
• Weakly restricted hydrology during the Ediacaran-Cambrian interval is indicated by Mo-U covariation.
• Accumulation of organic matters was characterized by favorable preservation, hydrothermal events and costal upwelling.
1 Introduction
The critical Ediacaran-Cambrian transition (635–514 Ma) has witnessed numerous fundamental events of Earth history, including the melting of the snowball Earth, the break-up of Rodinia, and the Ediacaran bio-explosion (Cowie and Glaessner, 1975; Gao et al., 1981; Kimura and Watanabe, 2001; Tyson, 2005; Jiang et al., 2007; Yao et al., 2014a; Yao et al., 2014b). Moreover, triggered by the transition from glacial period to interglacial period, the Cambrian transgression during that interval has laid a foundation of oil-bearing basins with deposits of marine facie, such as Al Noor Oilfield of Oman, Kovykta Oilfield of East Siberia, Anyue Gasfiled of Sichuan, and Tarim Oilfield (Yao et al., 2014a; Gao et al., 2022; Zhu et al., 2017). It also resulted in fundamental geological events that closely linked to the hydrocarbon source rocks from the Sinian to Cambrian. These significant geological events are recorded in the Cambrian Meishucun Formation of the Yangtze Platform, which includes the Yuertusi Formation (Cambrian Terreneuvian) of the Tarim Platform (Wang et al., 1985; Li et al., 1992; Jiang et al., 2007; Zhang et al., 2017). The Yuertusi Formation, a potential hydrocarbon source rock, is accumulated in an open-marine shelf environment (Zhu et al., 2017; Wang et al., 2022). In contrast with the Yangtze Platform, little research has been devoted to assessing organic matter accumulation and preservation during the Ediacaran to Cambrian interval of the Tarim Platform (Yu et al., 2005; 2009; Yao et al., 2014b; Zhang et al., 2016; Yang et al., 2017; Zhang et al., 2017; Wang et al., 2022).
Ancient marine carbonate and fine-grained deposits are repositories of geochemical and isotopic data that can elucidate bottom water redox conditions (McLennan, 1989; Calvert and Pedersen, 1993; 1996; Jones and Manning, 1994; Bau and Dulski, 1996; Holser, 1997). Based on the deep-layer exploration project, Yu et al. (2003), Yu et al. (2005), and Yu et al. (2009) have reported rare earth elements (REEs) concentrations, Re-Os dating, and Nd isotope data from chert of the basal Yuertusi Formation of the Penglaiba section. Recently, several researchers have focused on petrologic classifications of cherts and their hydrocarbon potential (Gao et al., 2022; Yao et al., 2014a; Yang et al., 2017; Zhu et al., 2017).
This study presents a high-resolution geochemical stratigraphic analysis spanning, in ascending order, the Qigebulake Formation Late Ediacaran, the Yuertusi (Cambrian Terreneuvian), and the Xiaoerbulake formations (early Cambrian Series 2) of the Sugaitebulake and Yutixi sections. This study elucidates changing paleo-redox conditions recorded by this succession in the northern Tarim Platform with emphasis on the accumulation and preservation of organic matter in the Yuertusi Formation.
2 Study sections
2.1 Paleogeographic reconstruction
The Tarim Basin, the largest oil-bearing intra-continental basin in China, is located in the south of Xinjiang Uygur Autonomous Region, Northwest China. During the Ediacaran-Cambrian transition, the Tarim Platform, was surrounded by the north Tianshan Ocean, by the Kuman Aulacogen to the northeast, and the Kunlun Paleocean to the south, lying in a low latitude position along within the Yangtze Platform (Figure 1). The Tianshan and Kunlun oceans evolved to passive continental margins following Keping rifting (Li et al., 1992; Feng, 2005; Yu et al., 2009; Li, 2010).
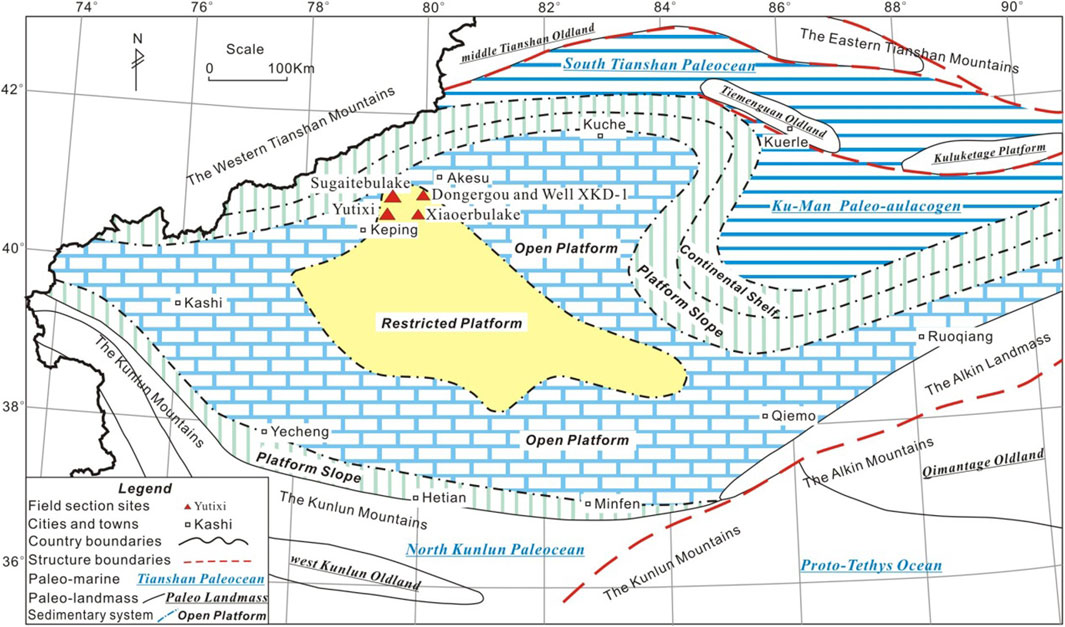
Figure 1. Tectonic paleogeography of the Tarim Platform during the Cambrian Terreneuvian to Series 2 transition (modified from Xu et al., 2010).
Basement rocks drilled in the northern Tarim Basin are dated around pre-Sinian and consist of moyite, quartz monzonlite, granodiorite and gabbro (Yu et al., 2005; 2009). U-Pb ages of the basement span from 1791 ± 1 Ma to 1848 ± 7 Ma (Yang X. et al., 2017). The basement has been generated in association with Tarim Movement in the middle Neoproterozoic (time equivalent to the Jinning Movement of South China), which resulted in the separation of the Tarim and South China plates (Figure 1; Gao et al., 2022; Feng, 2005; Li, 2010).
During Ediacaran time, most of the northern platform was covered by offshore facies and subordinate rift deposits. By the Cambrian Terreneuvian—Series 2 transition, the western region of the platform was dominated by restricted and open platform facies, while the northern platform experienced the accumulation of shelf and slope deposits, and northwest and northeast regions of the platform accumulated deep marine facies (Figure 1; Feng, 2005; Li et al., 1992; Li, 2010; Gao et al., 1981; Wang et al., 1985; Yao et al., 2014a; Yao et al., 2014b).
2.2 Samples
2.2.1 Sugaitebulake section
The Sugaitebulake section is located in Akesu area of Xinjiang Uygur Autonomous Region, ∼50 km away from Keping County (79°2.871′E, 40°30.374′N), the northwest region of the Tarim Basin (Figures 1, 2A). The section provides a largely conformable record of the Ediacaran-Cambrian Series 2 transition (Figure 3). The upper Qigebulake Formation comprises about 7 m of karstified algal dolomite (Figures 2A,B). The overlying 18-m thick Yuertusi Formation is composed of about 3 m of gray-black phosphorus chert (Figures 2C, 4A) and shale (Figure 4B) overlain by approximately 7 m of thick bedded coarse-grained dolomite interbedded with medium-bedded shale and thin-bedded marlstone (Figure 2D), and barite layers (Figures 2F, 4D) that pass upward into medium-bedded dolomite in the upper part. The basal Xiaoerbulake Formation consists of thin-bedded cherts and dolomite (Figure 2E). The Yuertusi and Xiaoerbulake formations contain a small shelly fauna, trilobites, and diverse acritarch assemblages. Forty samples were collected spanning a 20.8-m thick section for geochemical analysis (Figure 3).
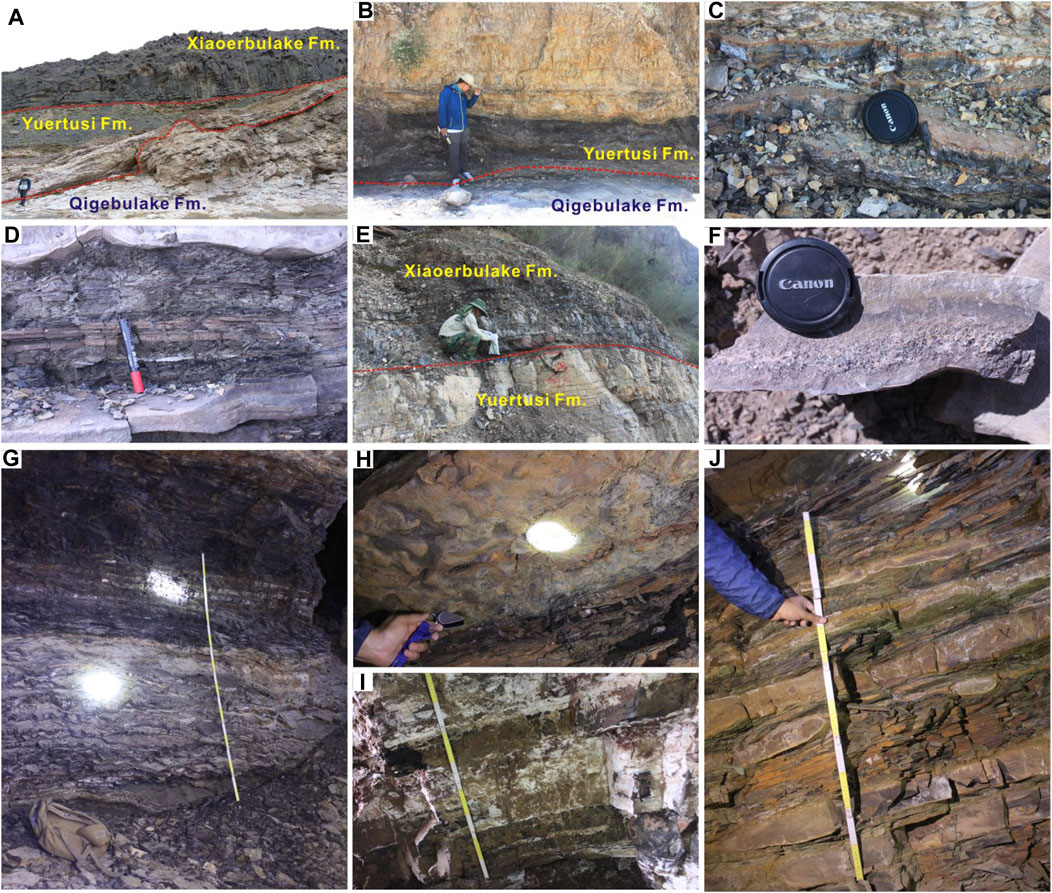
Figure 2. Outcrop photos of the Sugaitebulake and Yutixi sections, NW Tarim Basin: (A) Lingkuang section nearby; (B) The Ediacaran Cambrian boundary of the Sugaitebulake section; (C) Bedded chert; (D) Marlstone interbedded with shale; (E) The Yuertusi Fm. Xiaoerbulake Fm. boundary; (F) Barite in limestone; (G) Chert interbedded with P, C, and Si enriched shale; (H) Chert of basal Xiaoerbulake Fm.; and (I) Marlstone to grainstone interbedded with shale and P-nodule.
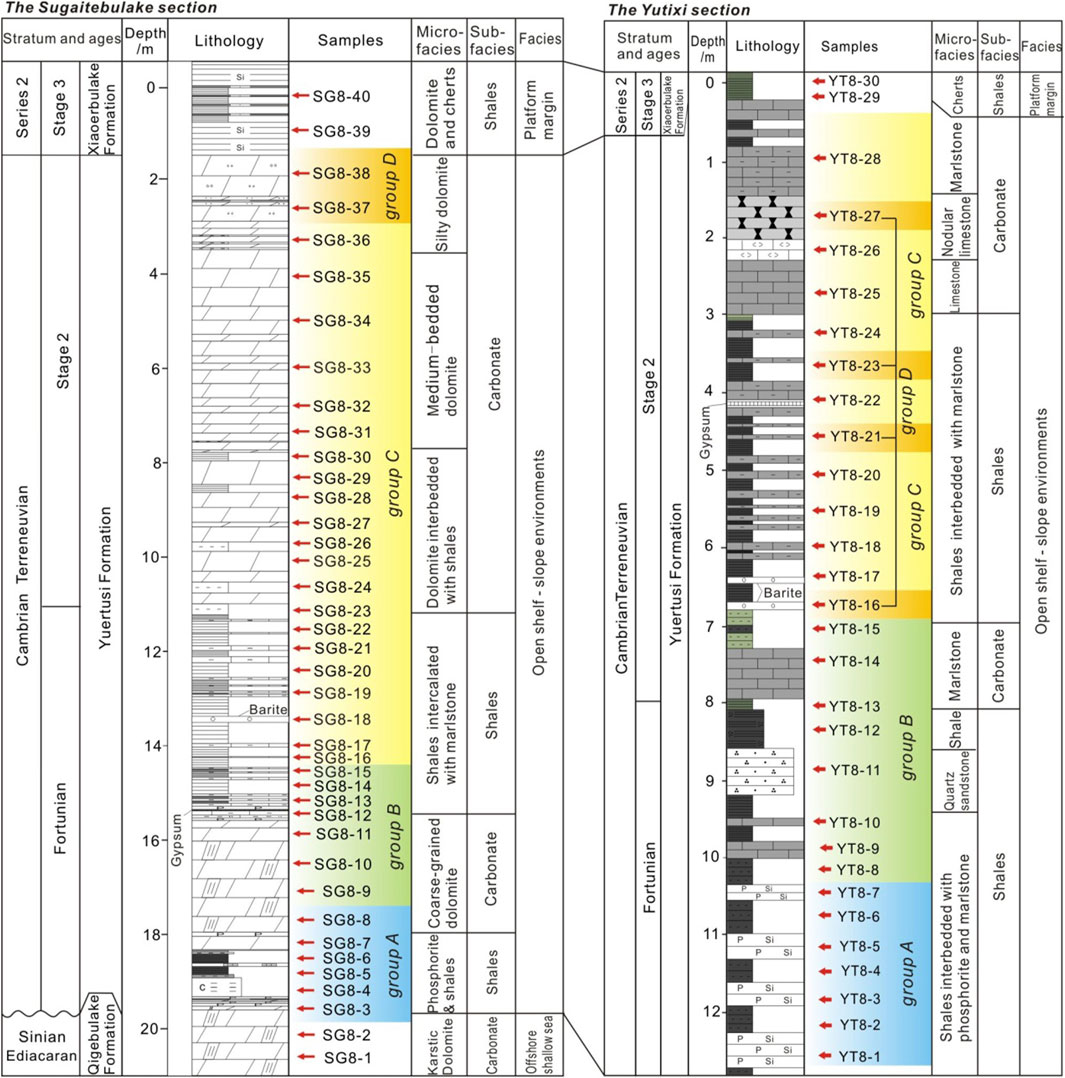
Figure 3. Lithological profiles and sampling sites of the Sugaitebulake and Yutixi sections, NW Tarim, China.
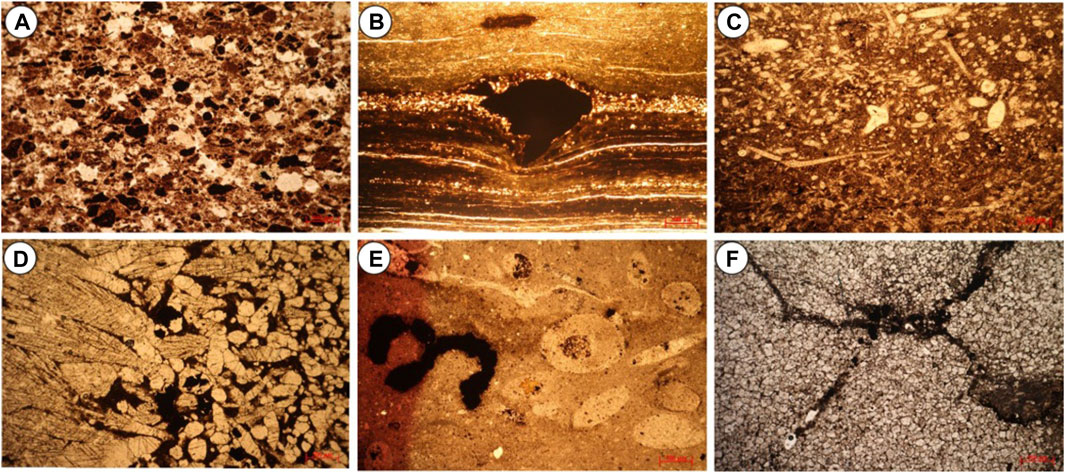
Figure 4. Plane-polarized micrographs of samples of the Qigebulake, Yuertusi, and Xiaoerbulake formations: (A) Phosphorite; (B) Shale; (C) Bioclast limestone; (D) Barite; (E) Marlstone; and (F) Dolomite with fractures.
2.2.2 Yutixi section
The Yutixi section is located in the Akesu area as well, ∼75 km from Akesu City (80°15.774′E, 41°10.276′N) in newly discovered abandoned phosphorite ore mine (Figures 2, 3). The 12-m thick Yuertusi Formation is comprised of black shale interbedded with phosphorite and marlstone in the lower part (Figure 2G). These deposits are interbedded with siltstone, shales, and bio-clastic limestone (Figure 4C), marl (Figures 2H, 4E), and barite. The upper Yuertusi Formation displays marlstone and limestone intercalated with shale (Figure 2J). The basal Xiaoerbulake Formation consists of finely-crystalline dolomite and shale (Figures 2I, 4F). Thirty samples were collected over a 13.2-m thick succession from the Yutixi section, for geochemical analysis (Figure 3).
3 Materials and methods
All geochemical analyses, including major and trace elements, REE, and total organic carbon (TOC) were carried out at the Analytical Laboratory of the CNNC Beijing Research Institute of Uranium Industry (BRIUI). Thin-sections were analysed using a polarizing microscope (Zeiss Axioscope-40) at the Microscope Analytical Laboratory of China University of Geosciences (CUG-Beijing).
Major oxides concentrations were obtained by X-ray fluorescence of fused glass disks using an X-ray fluorescence spectrophotometer (Zetium AB104L/AL104). Loss-on-ignition (LOI) was measured by the weight loss of sample after heating to 1,000°C in porcelain crucibles for 1 hour. Powdered samples (1 G per sample), were fused with 6 g of Li2B4O7/LiBO2 at 1,050°C for 1 hour. The analytical accuracy exceeded 2.00%, monitored by use of Chinese national standards GB/T 14,506.14-2010 and GB/T 14,506.28-2010.
Trace element and REE concentrations were determined by an Inductively Coupled Plasma Mass Spectrometry (ICP-MS) (NexION 300D). Samples were milled to a grain size smaller than 200 mesh. Powdered samples were digested with 2N HCL to remove carbonate and calcium minerals. Following this, 75.0 mg of each residue was dissolved in a tight Teflon screw-cap beaker using a 6 mL mixture of 6N HF and 6N HNO3 (1:2) at ∼180°C for 2 days after which the liquid was evaporated. Samples initially diluted with 1.00% HNO3 were further diluted with 100 mL ultrapure water containing 20 ppb In. Analytical precision and accuracy were enhanced by running duplicate analyses of samples and two international reference standards (BHVO-1 and AGV-1). Analytical accuracy was better than 5.00% and was monitored by use of the Chinese national standard GB/T 14,506.30-2010.
Enrichment Factors (EFs) are used to assess the degree of enrichment of authigenic precipitates relative to upper continental crust values. EFs were calculated as per the following equation: EF = (Element/Al)sample/(Element/Al)UCC, where the (Element/Al)UCC is the ratio of the upper continental crust (UCC) value of Al and the element of interest (Taylor and McLennan, 1985; McLennan, 2001).
Rare Earth Elements were normalized against Post-Archean Australian Shale (PAAS) (Taylor and McLennan, 1985; McLennan, 1989; 2001). Eu anomalies were calculated using the equation described by Dulski (1994): Eu/Eu*=3 × EuN/(2 × SmN + TbN) (Bau and Dulski, 1996). This approach was adopted to mitigate potential errors during ICP-MS analysis induced by the presence of barium compounds in the samples (Nance and Taylor, 1976; Taylor and McLennan, 1985).
Ce anomalies, Y anomalies and Pr anomalies were calculated from the following equations as following:
“N” refers to elemental concentrations normalized against PAAS.
In the study, Ba-excess was assumed to represent biogenic-Ba, and was calculated as follows: ex-Ba = Ba total-(Ba/Al)detr × Al sample (Schoepfera et al., 2015). Average UCC values were used for detrital Ba and Al concentrations.
4 Results
4.1 Major and trace elements
Major element concentrations of the analyzed samples display great variations (Table 1). SiO2 contents of Qigebulake Formation vary from 6.07% to 4.51% (average=5.29%). SiO2 contents of Yuertusi Formation vary from 3.23% to 92.38% (average=29.95%). SiO2 of Xiaoerbulake Formation varies from 3.02% to 53.54% (average=27.53%). The Al2O3 contents of Qigebulake Formation vary from 0.678% to 0.848% (average=0.763%). Al2O3 of Yuertusi Formation ranges from 0.55% to 19.03 (average=6.24%). Al2O3 of Xiaoerbulake Formation varies from 0.05% to 12.86% (average=3.88%).
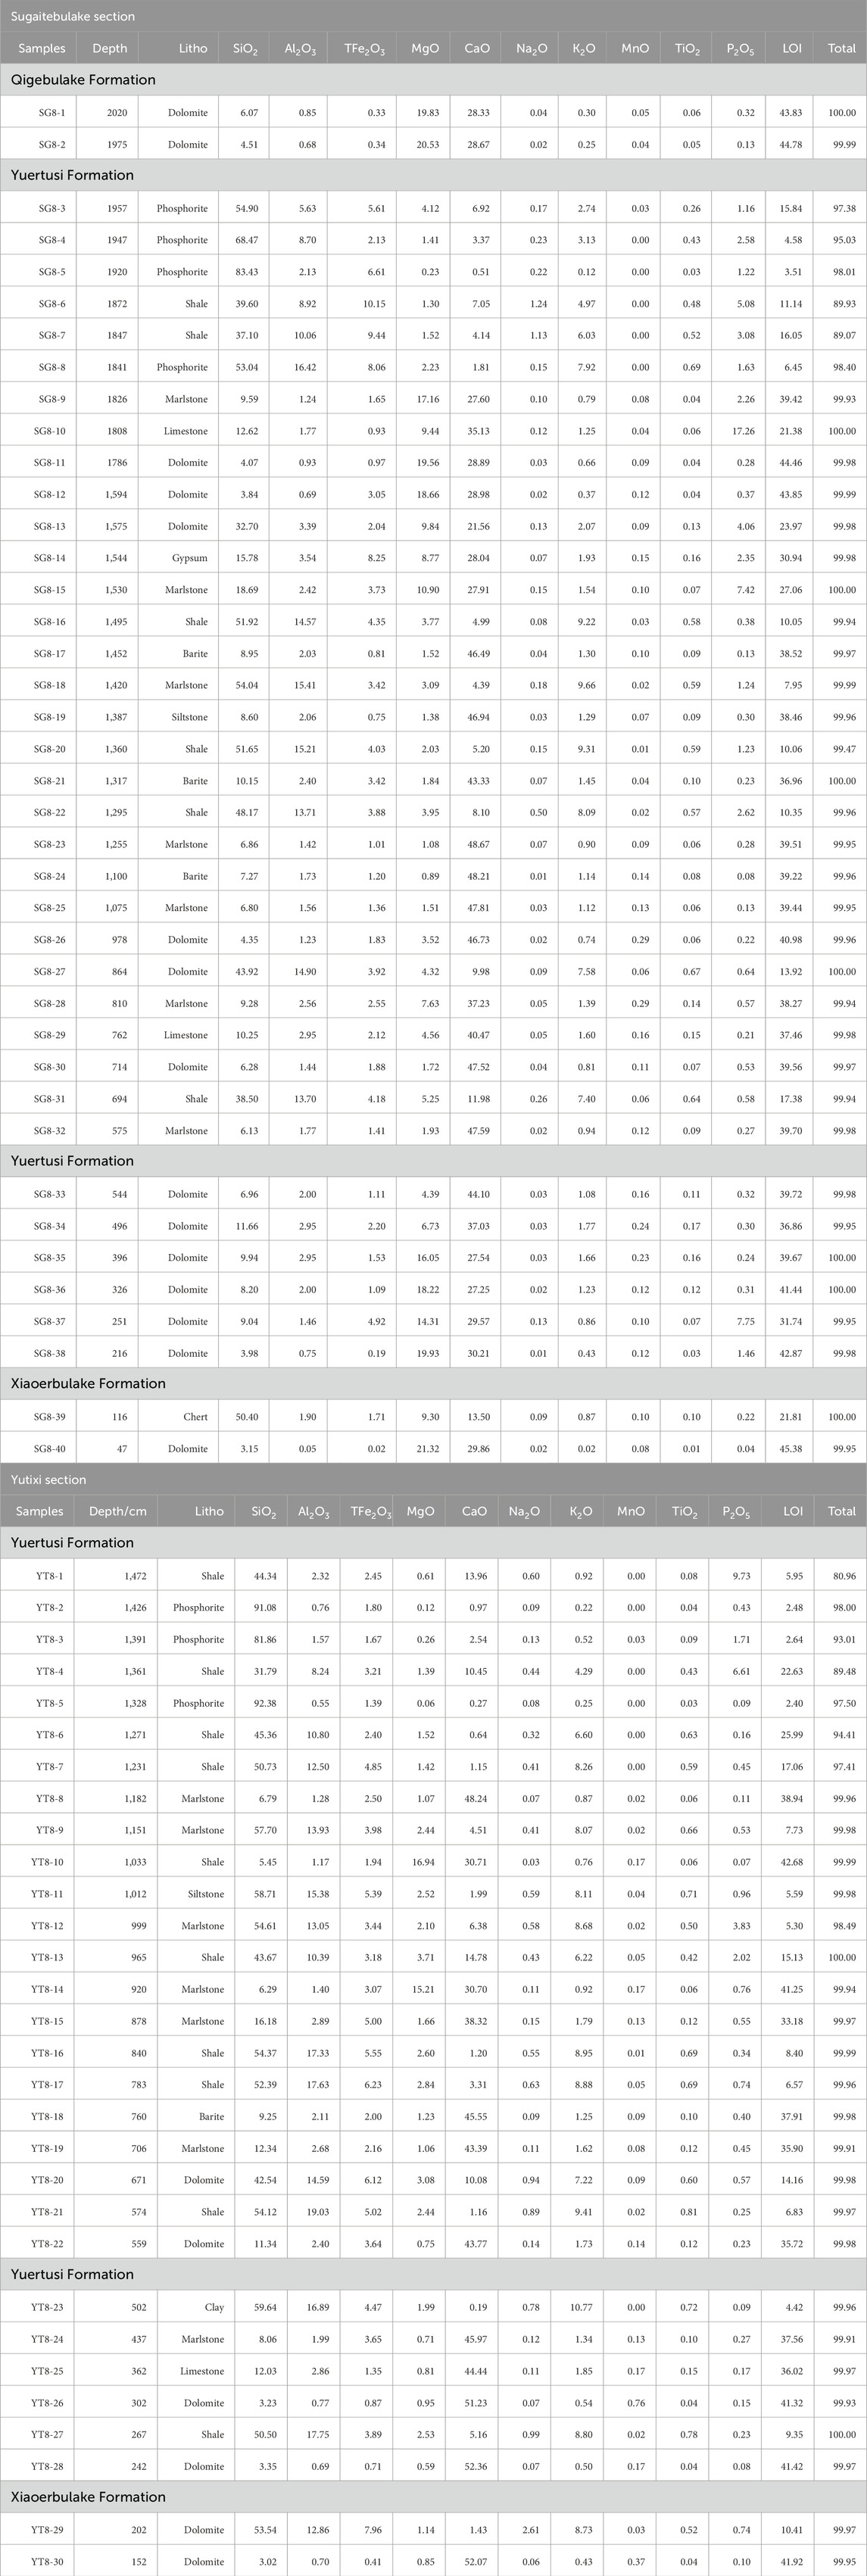
Table 1. Major element concentrations (wt%) for samples of the Qigebulake Fm., Yuertusi Fm., and Xiaoerbulake Fm.
Trace elements results of the Sugaitebulake and Yutixi sections are provided in Table 2. Samples of the two sections were classified into totally ten groups, according to their lithology and stratum units (Figure 5). Most of the samples of Yuertusi Formation are strongly enriched in metal trace elements. Enrichments of trace elements are described below:
(1) Sugaitebulake section: As shown in Figure 5A, samples of Qigebulake Formation display the abundances of trace elements with obvious enrichments of Ni (ppm)>Zn (ppm)>U (ppm)>Cr (ppm)>Mo (ppm)>V (ppm)>Cu (ppm)>Li (ppm). Samples of different lithological facies show analogous abundances of trace elements with enrichments of Mo (ppm)>U (ppm)>Ba (ppm)>Zn (ppm)>V (ppm)>Sr (ppm)>Cu (ppm)>Cr (ppm) for phosphorite and shales of lower Yuertusi Formation (Figure 5B), Ba (ppm)>U (ppm)>Mo (ppm)>Ni (ppm)>Zn (ppm)>V (ppm)>Cr (ppm) for dolomite and marlstone of middle Yuertusi Formation (Figure 5C), U (ppm)>Mo (ppm)>V (ppm)>Cs (ppm)>Li (ppm)>Th (ppm)>Cu (ppm) for shales of middle Yuertusi Formation (Figure 5D), Mo (ppm)>Ni (ppm)>U (ppm)>Sr (ppm)>V (ppm)>Cr (ppm)>Ba (ppm) for marlstone and dolomite of upper Yuertusi Formation (Figure 5E). Enrichment magnitudes of the Xiaoerbulake Formation are Mo (ppm)>U (ppm)>Ni (ppm)>V (ppm)>Cr (ppm)>Zn (ppm).
(2) Yutixi section: Samples of different lithological facies show similar abundances of trace elements compared with that of the Sugaitebulake section, and with enrichments of Ba (ppm)>Mo (ppm)>Sr (ppm)>V (ppm)>U (ppm)>Cu (ppm)>Pb (ppm)>Cr (ppm) for shales and phosphorite of lower Yuertusi Formation (Figure 5G), Mo (ppm)>Ba (ppm)>U (ppm)>Ni (ppm)>Sr (ppm)>V (ppm)>Cr (ppm)>Co (ppm) for marlstone and limestone of upper Yuertusi Formation (Figure 5H), Mo (ppm)>Ba (ppm)>U (ppm)>V (ppm)>Li (ppm)>Cr (ppm) for shale of upper Yuertusi Formation (Figure 5I). As shown in Figure 5J, samples of Xiaoerbulake Formation display the abundances of trace elements with enrichments of Mo (ppm)>U (ppm)>V (ppm)>Ni (ppm)>Sr (ppm)>Cr (ppm)>Pb (ppm).
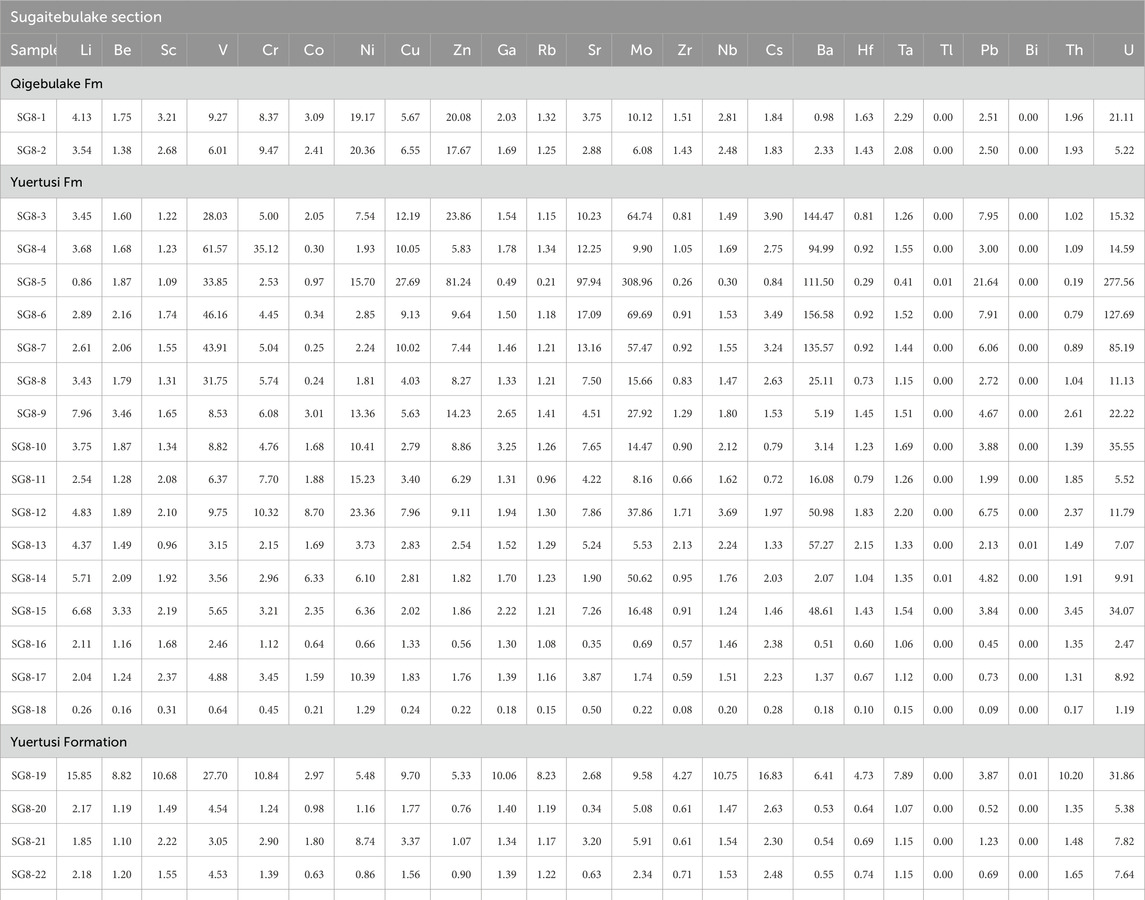
Table 2. Trace element concentrations (ppm) for samples of the Qigebulake Fm., Yuertusi Fm., and Xiaoerbulake Fm.
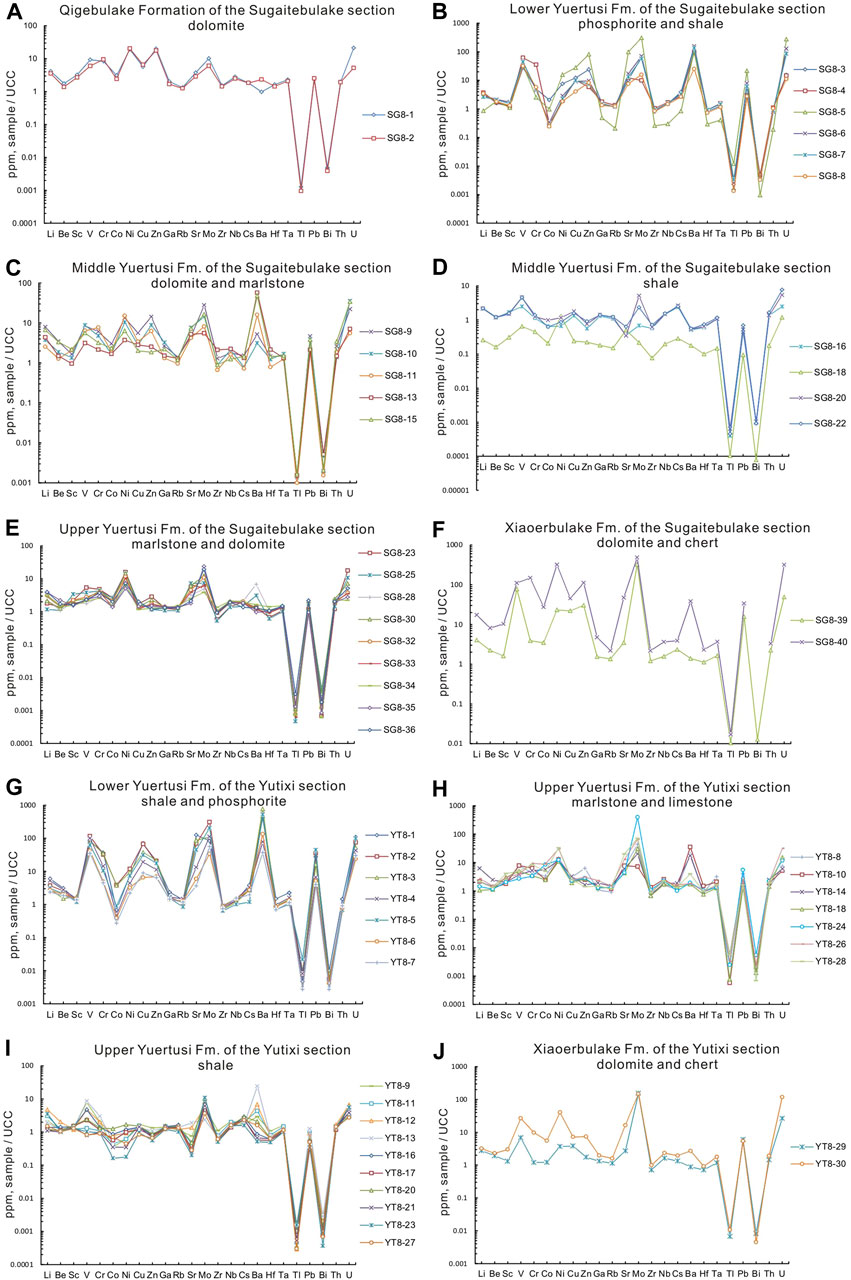
Figure 5. Trace element Enrichment Factors (EFs) relative to Upper Continental Crust (UCC) for samples of the Qigebulake Fm, Yuertusi Fm and Xiaoerbulake Fm (classified by different litho-facies).
In summary, abundances of trace elements for the samples of the Sugaitebulake and Yutixi sections show significantly enrichments of Mo (ppm)>U (ppm)>V (ppm)>Ba (ppm)>Cr (ppm)>Ni (ppm)>Cu (ppm)>Zn (ppm).
4.2 Rare earth elements
Rare earth element concentrations of the Sugaitebulake and Yutixi sections sample suites are presented in Table 3. Total concentrations of rare earth elements range from 7.94 ppm to 653.14 ppm. Mean values of total REEs are 40.63 ppm, 200.78 ppm and 94.62 ppm for the Qigebulake Formation, Yuertusi Formation and Xiaoerbulake Formation, respectively. Average concentrations of rare earth elements of Post-Archean Australian Shale (PAAS) were used to normalize REEs of the studied samples. As a result, the samples were divided into eleven groups according to their different REEs patterns. Similar REEs patterns are observed for samples of the two sections, and details are described as following.
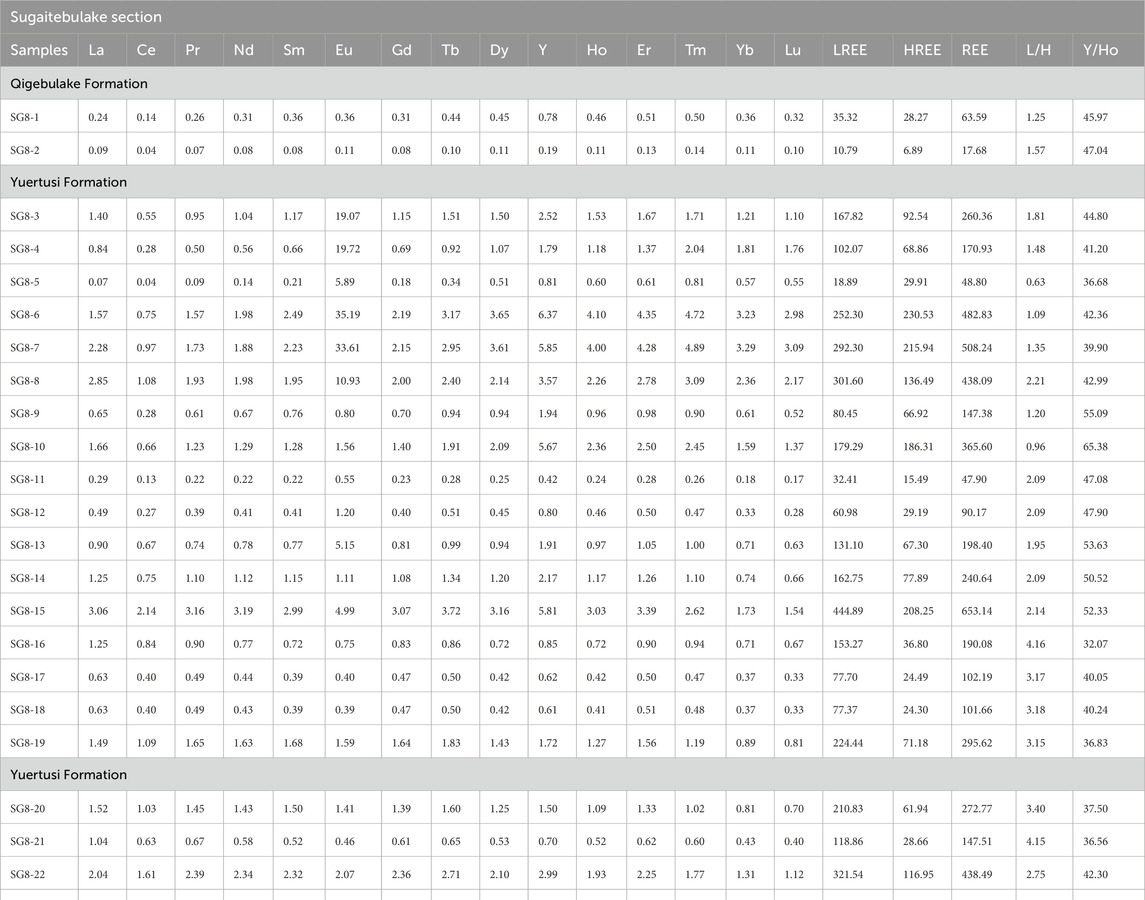
Table 3. Rare earth element concentrations (ppm) for samples of the Qigebulake Fm., Yuertusi Fm., and Xiaoerbulake Fm.
4.2.1 Sugaitebulake section
Samples from the Qigebulake Formation display a subtle increase in the concentration of heavier elements (LaN/YbN: 0.68 to 0.82; average=0.75), weakly negative Ce anomalies (Ce/Ce*avg. = 0.55 ± 0.01; n = 2), and moderately positive Y anomalies (Y/Y*avg. = 1.73 ± 0.04; n = 2). Only sample SGT8-2 shows a moderate Eu anomalies (Eu/Eu* = 1.20) (Figure 6A). Samples of the Yuertusi Formation group A exhibit obvious increases of heavier elements concentrations (LaN/YbN: 0.13 to 1.21; average = 0.69), enriched heavy rare earth elements (HREEs) weakly negative Ce anomalies (Ce/Ce*avg.=0.46 ± 0.03; n = 6), strongly positive Eu anomalies (Eu/Eu*avg. = 15.98 ± 7.58, n = 6) and moderately positive Y anomalies (Y/Y*avg. = 1.59 ± 0.07, n = 6) (Figure 6B). Yuertusi Formation group B samples display increasing concentrations of heavier REEs (LaN/YbN: 1.04 to 1.77; average = 1.42), weakly negative Ce anomalies (Ce/Ce*avg. = 0.60 ± 0.14, n = 7), weakly to moderately positive Eu anomalies (Eu/Eu*avg. = 2.23 ± 1.84; n = 7) and moderately positive Y anomalies (Y/Y*avg. = 1.97 ± 0.28, n = 7). By contrast, samples of the Yuertusi Formation group C are characterized as generally flat REEs patterns (LaN/YbN: 1.36 to 2.42; average = 1.82), weakly negative Ce anomalies (Ce/Ce*avg. = 0.77 ± 0.06; n = 21), and moderately positive Y anomalies (Y/Y*avg.=1.34 ± 0.11; n = 21), while only three samples (SG8-27, SG8-28 and SG8-31) display moderately positive Eu anomalies (Eu/Eu*avg. = 1.35; n = 3) (Figure 6D). Samples of Yuertusi Formation group D also exhibit flat REEs patterns (LaN/YbN = 1.01 to 1.13; average = 1.07), weakly negative anomalies Ce anomalies (Ce/Ce*avg. = 0.92 ± 0.04; n = 2), and moderately positive Y anomalies (Y/Y*avg. = 1.36 ± 0.04, n = 2). However, group D samples show no Eu anomalies (Figure 6D). Samples of the Xiaoerbulake Formation present flat REEs patterns (LaN/YbN = 0.73 to 1.39; average = 1.06), moderately positive Y anomalies (Y/Y*avg. = 1.56 ± 0.22, n = 2) and weakly negative Ce anomalies (Ce/Ce*avg. = 0.80 ± 0.08; n = 2) (Figure 6J). Only one sample (SG8-40) display a weakly positive Eu anomalies (Eu/Eu* = 1.92) (Figure 6J).
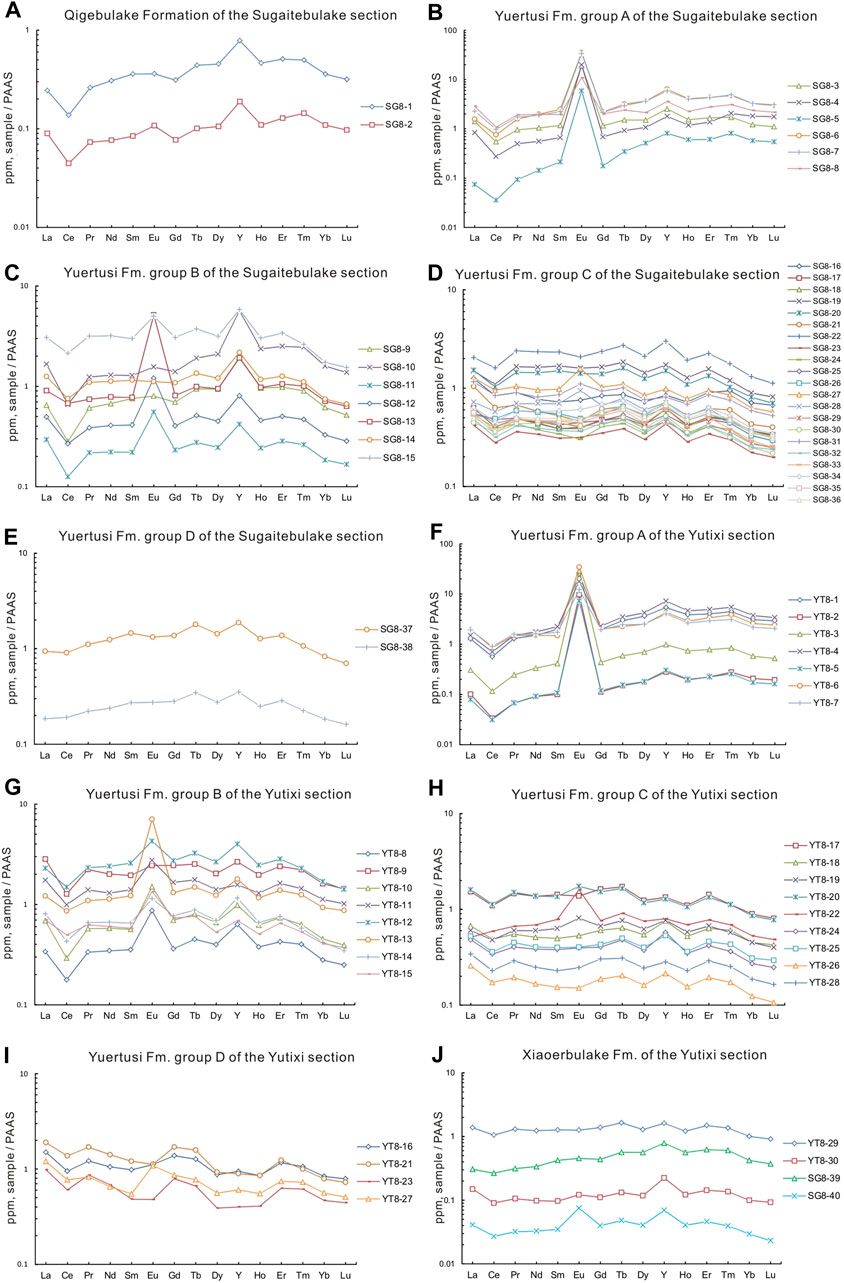
Figure 6. PAAS-normalized REEs patterns for samples of the Qigebulake Fm, Yuertusi Fm and Xiaoerbulake Fm (sorted by enrichment features of REEs and stratum units).
4.2.2 Yutixi section
REE enrichment patterns of samples of the Yutixi section are similar to those of the Sugaitebulake section. Samples of Yuertusi Formation group A of the Yutixi section exhibit increasing concentrations of heavier REEs (LaN/YbN=0.40 to 0.88; average = 0.56), weakly negative Ce anomalies (Ce/Ce*avg. = 0.46 ± 0.04; n = 7), strongly positive Eu anomalies (Eu/Eu*avg. = 35.32 ± 31.68; n = 7) and moderately positive Y anomalies (Y/Y*avg. = 1.53 ± 0.09; n = 7). These trends are similar to those of group A of the Sugaitebulake section (Figures 6A, F). Samples of the Yuertusi Formation group B display increasing abundances of heavier REEs (LaN/YbN = 1.21 to 1.92; average = 1.54), weakly negative Ce anomalies (Ce/Ce*avg. = 0.61 ± 0.11, n = 8), moderately positive Eu anomalies except for sample YT8-9 (Eu/Eu*avg. = 2.27 ± 1.33; n = 8), and weakly to moderately positive Y anomalies (Y/Y*avg. = 1.47 ± 0.18, n = 8). In contrast, samples of Yuertusi Formation group C are characterized by generally constant REE values (LaN/YbN = 0.97 to 2.08; average = 1.641), weakly negative Ce anomalies (Ce/Ce*avg. = 0.79 ± 0.09; n = 9), and weakly positive Y anomalies (Y/Y*avg. = 1.29 ± 0.16, n = 9). Notably, only one sample (YT8-22) displays a moderately positive Eu anomalies (Eu/Eu* = 1.93) (Figure 6H). Samples of group D display flat REEs patterns (LaN/YbN = 1.79 to 2.40; average = 2.11), whereas slight right-leaning REEs patterns are observed in Figure 6I, with weakly negative Ce anomalies (Ce/Ce*avg. = 0.72 ± 0.05; n = 4); though one sample (YT8-27) exhibits a positive Eu anomalies (Eu/Eu* = 1.74). Samples of the Xiaoerbulake Formation are characterized by essentially flat REE trend (LaN/YbN = 1.37 to 1.50; average = 1.44), weakly negative Ce anomalies (Ce/Ce*avg. = 0.75 ± 0.05, n = 2), and moderately positive Y anomalies (Y/Y*avg. = 1.58 ± 0.05, n = 2).
4.3 Total organic carbon (TOC)
Total organic carbon (wt%) contents of samples of the Sugaitebulake and Yutixi sections are presented in Table 4. TOC of the Sugaitebulake section (0.019–3.7; average = 0.45) is less than that of Yutixi section (0.119–17.2; average = 1.68). The average TOC of all samples is 0.97. However, TOC contents of Yuertusi group A samples (TOCavg. = 3.58 wt%) of both sections are relatively high and coincide with the elevated concentrations of Ba (28,877.55 ppm).
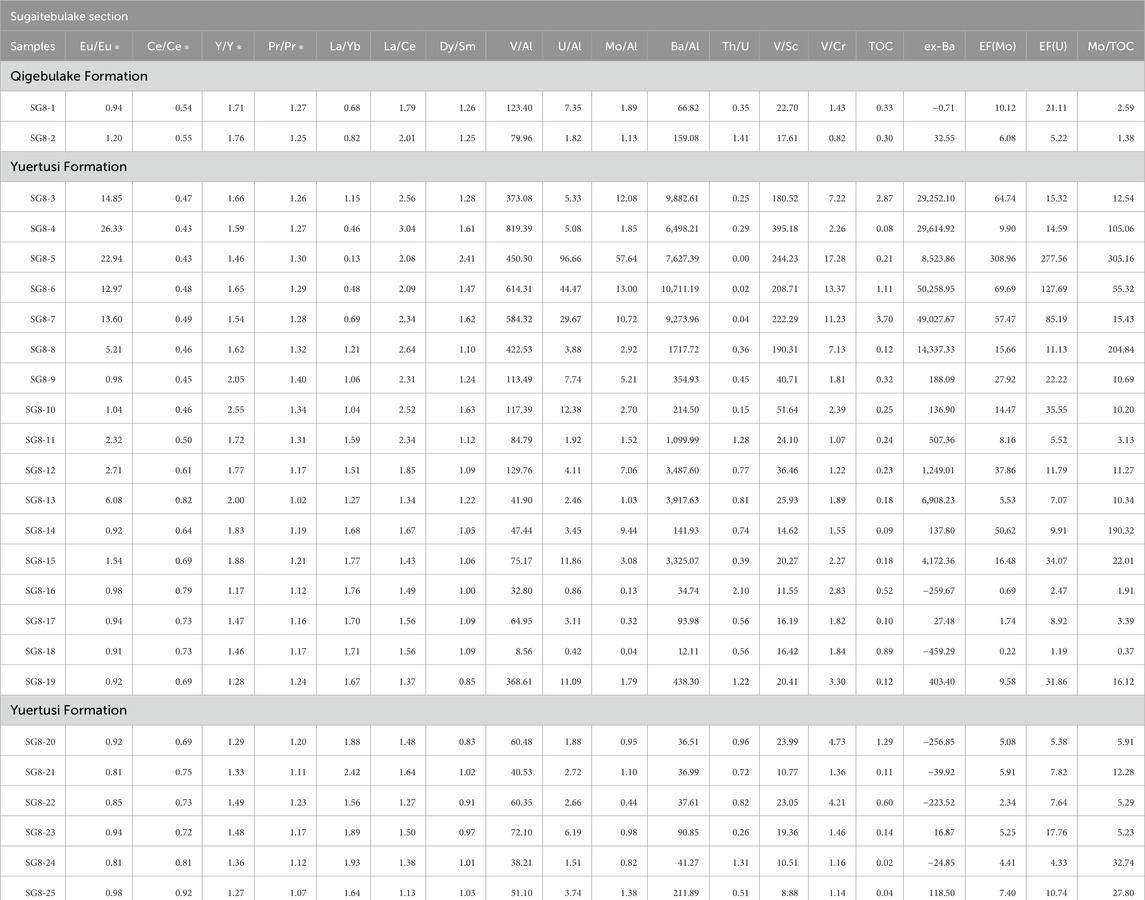
Table 4. Selected geochemical proxies for samples of the Qigebulake Fm., Yuertusi Fm., and Xiaoerbulake Fm.
5 Discussion
5.1 REEs patterns and Ce anomalies
REE concentrations document contributions from seawater, hydrothermal sources, and terrestrial sources (Mclennan, 1989; Murray et al., 1991; Murray et al., 1992; Murray, 1994; Mclennan, 2001). They are commonly used as proxies for water column chemistry (Adachi et al., 1986; Mills and Elderfield, 1995; Holser, 1997; Nothdurft et al., 2004). Debris derived from continents generally displays minimal or no fractionation of LREEs compared with HREEs. In contrast, seawater generally displays enriched HREE contents, negative Ce anomalies, and positive Y anomalies (Bau and Dulski, 1996; Cao et al., 2012; Ganai and Rashid, 2015).
REE patterns of the Sugaitebulake and Yutixi sections share similar enrichment trends and can be classified into two categories according to their REE contents normalized to PAAS. The first category is characterized by flat REEs patterns, weakly to moderately negative Ce anomalies, moderately positive Y anomalies, and slight Eu anomalies (Nothdurft et a., 2004; Shields and Stille, 2001; Murray et al., 1991). This category reflects contributions from terrigenous and seawater sources and includes samples of the Yuertusi Formation groups C and D and the Xiaoerbulake Formation of both sections (Figures 6D, E, H–J). The second category displays increasing enrichments of heavier REEs, enrichments of HREEs, weakly to moderately negative Ce anomalies, moderately positive Y anomalies, and moderately to extremely positive Eu anomalies (Bau and Dulski, 1996; Cao et al., 2012; Ganai and Rashid, 2015). The latter suggests a hydrothermal contribution and includes samples from the Qigebulake Formation of Sugaitebulake section and the Yuertusi Formation groups A and B (Figures 6A–C, F, G; Holser, 1997; Adachi et al., 1986; Mills and Elderfield, 1995; Nothdurft et al., 2004).
Therefore, vast paleo-ocean geochemical information has been recorded in most of the studied samples. REE patterns of samples of the Yuertusi Formation group A of both sections suggest a hydrothermal signature. The Y/Ho ratios provide useful information regarding seawater chemistry and paleo-redox conditions (Bau and Dulski, 1996; Morford and Emerson, 1999; Algeo and Rowe, 2012). Modern seawater is generally characterized by higher Y/Ho ratios (∼45), compared with lower Y/Ho ratios (∼28) of terrigenous debris (Jacobs et al., 1987; Owen and Armstrong, 1999). Relatively high Y/Ho ratios of samples of the Qigebulake Formation (Y/Hoavg. = 46.50), Yuertusi Formation group A (Y/Hoavg. = 40.48), group B (Y/Hoavg. = 46.75), and the Xiaoerbulake Formation (Y/Hoavg. = 42.70) from both sections are consistent with modern seawater compositions. In contrast, samples of the Yuertusi Formation group C (Y/Hoavg. = 37.46) and group D (Y/Hoavg. = 32.27) exhibit lower Y/Ho ratios, which suggests certain influence of terrestrial sediment flux. The Sugaitebulake section may reflect a diminished terrestrial input as suggested by the lower Y/Ho ratio (average = 41.78 for total samples) relative to that of the Yutixi section (average = 37.92 for total samples), during the Ediacaran Qigebulake Formation to early Cambrian Series 2 Xiaoerbulake Formation (Table 3).
Ce anomalies are commonly used to elucidate paleo-redox conditions (Wu and Ouyang, 1992; Wilde, 1996; Holser, 1997) assuming that diagenesis hasn’t altered REE abundances (Shields and Stille, 2001). Generally, negative Ce anomalies could be influenced by the arching effect of mid rare earth elements (MREEs) and hydrothermal alteration (Rangin et al., 1981; Ogihara, 1999). The coefficient of determination (R2=0.53) of Ce/Ce* versus Dy/Sm and that R2 (0.28 of Ce/Ce* versus Eu/Eu* (Figures 7A, D) suggest a weak arching effect recorded in the studied samples. Moreover, the possible scavenging effect of REEs during post-depositional alteration is ruled out because of no correlation between Ce/Ce* and bulk REEs (R2 = 0.08) for samples of the Yuertusi Formation (Figure 7B) (Murray et al., 1991; Shields and Stille, 2001; Murray, 1990). Positive La anomalies may trigger negative Ce anomalies in those cases where Pr anomalies range from 0.95 to 1.05. As shown in Figure 7C, only four samples plot in that field and only one sample with no La anomalies (SG8-13; Figure 6C) might be affected by Pr anomalies. In summary, Ce anomalies in the studied samples can be used in our analysis of paleo-marine environments.
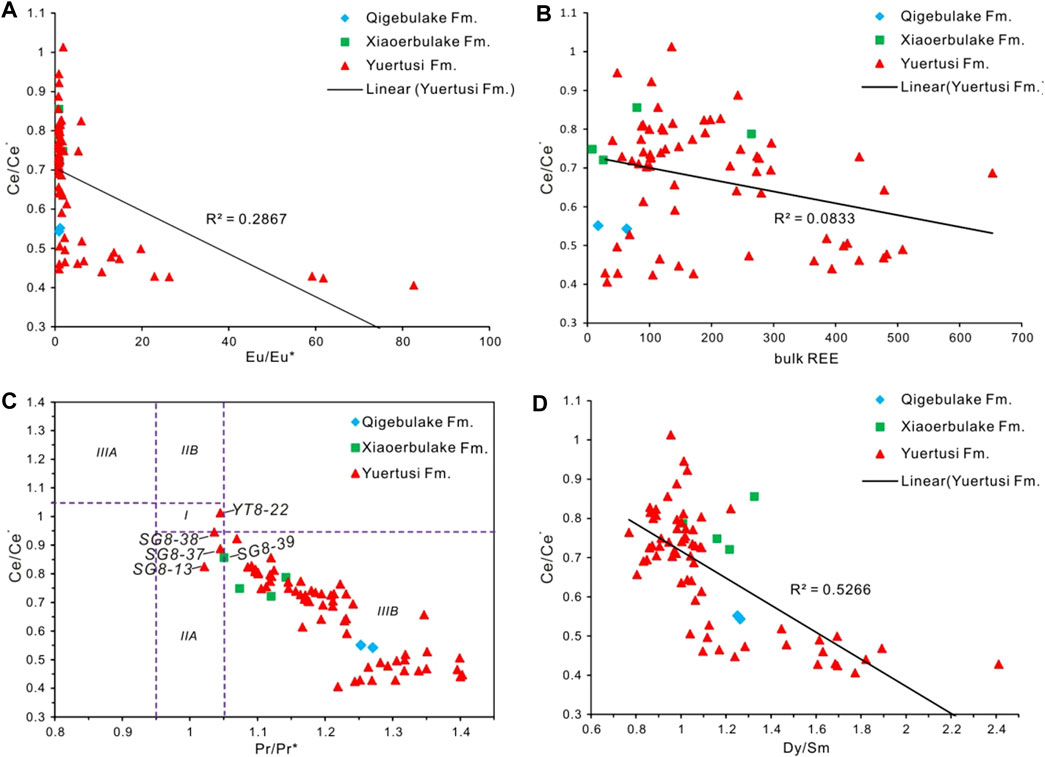
Figure 7. Crossplots of Ce/Ce* versus (A) Eu/Eu*, (B) bulk REE, (C) Pr/Pr*, and (D) Dy/Sm.
Ce anomalies of seawater is a reflection of dissolved Ce(Ⅲ) versus undissolved Ce(Ⅳ). Negative Ce anomalies are most common in sediments deposited under anoxic bottom water conditions where insoluble Ce(Ⅳ) easily precipitates as metal complexation particles (Sholkovitz, 1990; Wilde, 1996; Ganai and Rashid, 2015). By contrast, Ce(Ⅳ) is reduced to Ce(Ⅲ) under oxic to suboxic conditions, thus resulting in positive Ce anomalies (Ganeshram, et al., 2002). Anoxic basin and shelf regions are generally delineated by weakly negative to moderately positive Ce anomalies, whereas oxic conditions are generally manifested by moderately to strongly negative Ce anomalies (Holser, 1997). However, it is important to bear in mind that negative Ce anomalies may be affected by redox variations, sea level fluctuations and pH of the watermass (Wu and Ouyang, 1992; Wilde, 1996). A previous study (Yao et al., 2014a) and weakly negative Ce anomalies (Ce/Ce*avg. = 0.67) of the present study suggest that the oxygen-deficient bottom water was overlain by oxygenated water during the Ediacaran-Cambrian transition.
Samples of the Qigebulake Formation (Sugaitebulake section) exhibit weakly negative Ce anomalies (0.543 to 0.551; average = 0.55). Such values are generally associated with organic matter that accumulated under oxygen-depleted conditions extending into the euphotic zone (Thomson et al., 1995; Kidder et al., 2003; Ganai and Rashid, 2015). However, low TOC contents imply episodically oxic or suboxic conditions during Late Ediacaran time. In contrast, weak Ce anomalies documented in both sections of the Yuertusi Formation group A (0.406 to 0.518; average = 0.46) suggest the existence of anoxic conditions during Early Cambrian Terreneuvian time accounting for organic matter enrichment (TOCavg. = 3.58 wt%, Table 4). Moderate Ce anomalies (Table 4) in both sections of the Yuertusi Formation group B (0.45 to 0.82; average=0.62) and corresponding low TOC contents (0.09 to 0.60 wt%; average. = 0.28 wt%) indicate suboxic conditions. However, anoxic conditions were re-established in Early Cambrian Series 2 as suggested by moderate Ce anomalies (0.72 to 0.86; average=0.78) and higher concentrations of TOC (0.55 to 2.04 wt%; average=1.05 wt%) documented from samples of the Xiaoerbulake Formation of both sections (Figure 10).
5.2 Eu anomalies and hydrothermal activities
Europium (Eu) is a useful proxy for the recognition of hydrothermally influenced marine sediment (Owen and Olivarez, 1988; Owen and Armstrong, 1999). Positive Eu anomalies generally indicate hydrothermal activity during sedimentation (Murray, 1990, Murray et al., 1991; Murray, 1994; Ganai and Rashid, 2015; Klinkhammer et al., 1994). Such anomalies commonly reflect high temperature conditions (>250°C) in which the europium redox potential is reduced from Eu(Ⅱ) to Eu(Ⅲ). Eu(Ⅱ) remains stable in strongly alkaline anoxic water under low temperature (∼25°C), including pore-water of anoxic marine deposits. Macrae et al. (1992) and Klinkhammer et al. (1994) postulated that most Eu(Ⅱ) was produced via high-temperature alteration of plagioclase feldspar in submarine basalt (MacRae et al., 1992; Klinkhammer et al., 1994). Positive Eu anomalies are commonly observed in deposits adjacent to hydrothermal vents, yet positive Eu anomalies may be found in sediment as far as ∼10 km from hydrothermal vents due to mixing of seawater. However, the presence of barium compounds [e.g., BaO or Ba(OH)2] in samples can yield misleading results (Ogihara, 1999; Kidder et al., 2003; Kamber et al., 2004; Nothdurft et al., 2004). Similarly, deposition under strongly reducing conditions and elevated terrigenous detrital flux may lead to inaccurate Eu anomalies. Therefore, it is essential to consider the relationship of Ba versus Eu/Eu* by use of the equation presented by Dulski (1994). The relatively low R2 (0.256) of Eu/Eu* versus Ba for samples of the Yuertusi Formation (Figure 8C) and the Qigebulake and Xiaoerbulake formations (R2=0.106) (Figure 8D) suggest some degree of alteration of Eu/Eu* by barium compounds. However, weak correlations (R2 = 0.024) between Eu/Eu* and Al2O3 for samples of the Yuertusi Formation and the Xiaoerbulake and Qigebulake formations (R2 = 0.184) suggest that positive Eu anomalies were not affected by terrigenous sediment flux (Figure 8B).
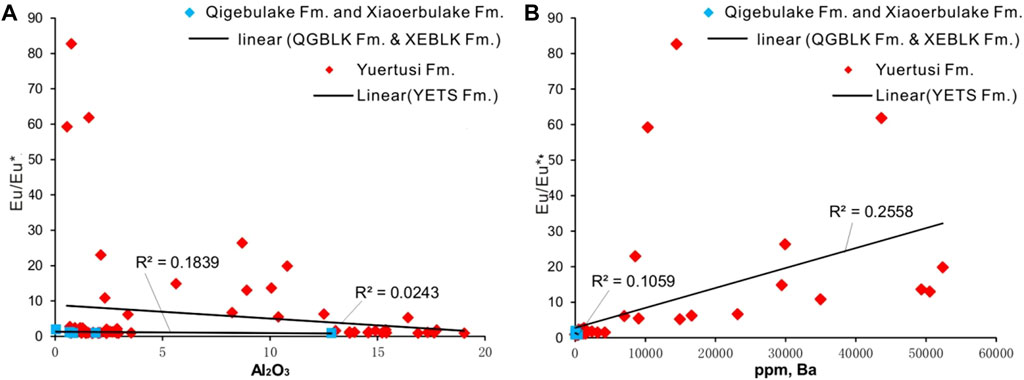
Figure 8. Crossplots of Eu/Eu* versus (A) Al2O3 (wt%) of the Yuertusi, Qigebulake, and Xiaoerbulake formations; (B) Ba (ppm) of the Yuertusi, Qigebulake and Xiaoerbulake formations.
Samples of the Qigebulake Formation and Yuertusi Formation groups A and B exhibit increasing enrichment of heavier REEs, strong enrichment of HREEs, moderately to extremely positive Eu anomalies, weakly to moderately negative Ce anomalies, and positive Y anomalies. These patterns suggest a strong hydrothermal influence during the Ediacaran-Cambrian transition (Figures 6, 10). In particular, samples of Yuertusi Formation group A of both sections display increasing heavier left-leaning REE enrichment, extremely elevated Eu anomalies (5.21–82.66; average = 26.39), moderate Y anomalies (1.37–1.66; average = 1.55), and field features including barite layers (Figure 4D), and siliceous bands within marlstone, all consistent with deposition in association with hydrothermal activity during the Early Cambrian Terreneuvian (Figure 10; Gao et al., 2022; Zhu et al., 2016; Kimura and Watanabe, 2001). However, the weak Eu anomalies (Eu/Eu*avg. = 1.01) displayed by groups C and D of the Yuertusi Formation and Xiaoerbulake Formation (Eu/Eu*avg. = 0.99) may reflect hypoactive hydrothermal activity and degradation of organic matter (Gao et al., 2022). Instead, heterogeneous distributions of Eu anomalies in vertical direction (with peak value of Eu/Eu* at SG8-4, and YT8-2) and significantly enrichments of platinum group elements (PGEs) in the basal Yuertusi Formation (Figure 10) both illustrate episodic hydrothermal activity.
In summary, Early Cambrian Terreneuvian has witnessed several hydrothermal events recorded by contemporaneous sediments, which may have been associated with rifting of the Tarim Platform and the South Tianshan Ocean. However, the geochemical signatures of hydrothermal activity appear to have varied spatially, perhaps reflecting of seawater dilution, migration, and upwelling.
5.3 Paleo-productivity
Paleo-productivity is a fundamental link in the global cycling of carbon, ecological dynamics and redox conditions. However, estimation of the role of productivity in the accumulation of ancient marine deposits is hindered by the reliability of dilutive effects of clastic flux and organic matter preservation. Geochemical proxies, including TOC and Ba-excess (or biogenic-Ba) are commonly used to evaluate marine productivity (Tribovillard et al., 2006; Calvert and Pedersen, 2007).
Organic carbon content is arguably the most direct proxy of productivity (Pedersen and Calvert, 1990). However, it is estimated that only ∼0.1%–10% of organic matter exported from the surface layer survives to accumulate on the seafloor. Much of the deposited organic matter is subsequently decomposed during bacterial sulfate reduction and de-nitrification. Thus, enriched TOC values (more than 10 wt%) in ancient sediments likely reflect the combination of enhanced productivity favorable preservation (euxinic to anoxic conditions), and diminished dilution related to clastic flux (Mansour et al., 2020; Tyson, 2005; Schoepfer, et al., 2014).
The relatively low TOC content of Yuertusi Formation samples may reflect the effects of weathering. Tao et al. (2016) studied Yuertusi samples from the Dongergou section and pointed out that weathering could have diminished as much as 95% TOC and chloroform asphalt A. Still, the presence of several samples with high TOC (e.g., 17.2 wt% of YT8-6, 9.58 wt% of YT8-7, and 9.24 wt% of YT8-4) suggests elevated productivity, favorable conditions for preservation, and little dilution in studied samples (Table 4; Figure 10). Indeed, the source rock potential of the Yuertusi Formation was confirmed by the measured TOC content of ∼29.8 wt% from well Xinkedi-1 in March 2018 (Zhu et al., 2016; Gao et al., 2022; Mansour and Wagreich, 2022).
Barium-excess (Ba-excess), generally regarded as a proxy for biogenic-barium (bio-Ba), can be used to reconstruct oceanic productivity based on the precipitation of barite in association with decomposing organic matter (Paytan and Griffith, 2007; Zhang et al., 2016). Barite remains insoluble under suboxic to oxic conditions. Ba enrichment can preserve the record of enhanced surface water productivity even under bottom water conditions unfavorable to organic matter preservation. Ba-excess ranges from 1,000 to 5,000 ppm in the sediment deposition beneath the highly productive equatorial Pacific (Murray and Leinen, 1993).
The influence of detrital flux on Ba enrichment is suggested by negative ex-Ba values of 14 samples (Table 4). On the contrary, the Yuertusi Formation group A displays strong enrichment of Ba-excess (∼10,000–52,000 ppm; average=28,877.55 ppm) (Figures 9A, B). Figure 9C also exhibits moderately to highly contents (∼1,000–9,000 ppm) of Ba-excess for samples of the Yuertusi group B. Yuertusi Formation groups C and D, and the Xiaoerbulake and Qigebulake formations display low Ba-excess concentrations (∼1,000–9,000 ppm) (Figure 10). Thus, the combination of extreme enrichment of Ba-excess and very high TOC contents provides compelling evidence of elevated productivity of the north Tarim Platform during the Early Cambrian Terreneuvian.
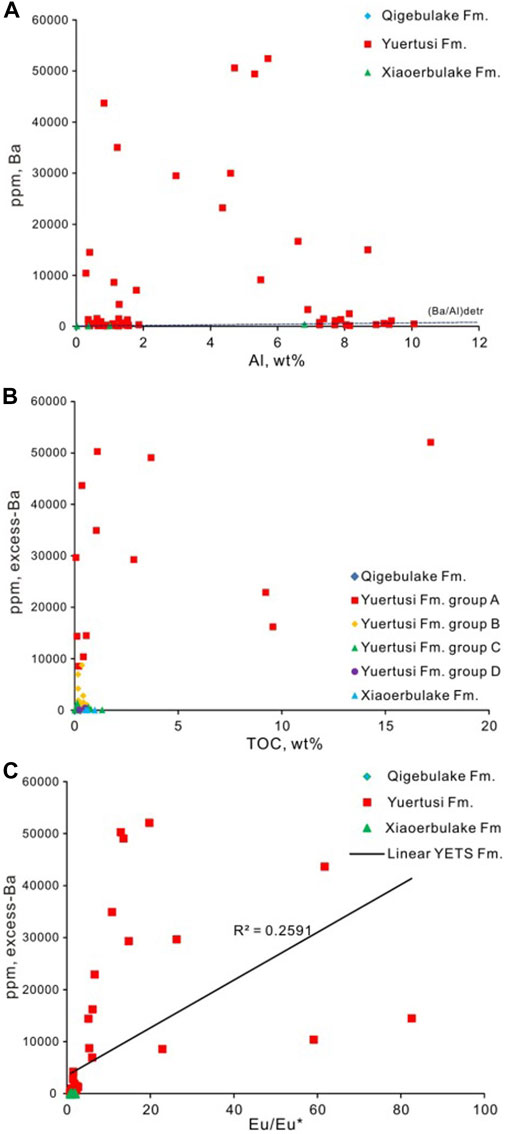
Figure 9. Crossplots of (A) Ba ppm vs. Al %; (B) excess-Ba ppm vs. TOC; (C) excess-Ba ppm vs. Eu/Eu*.
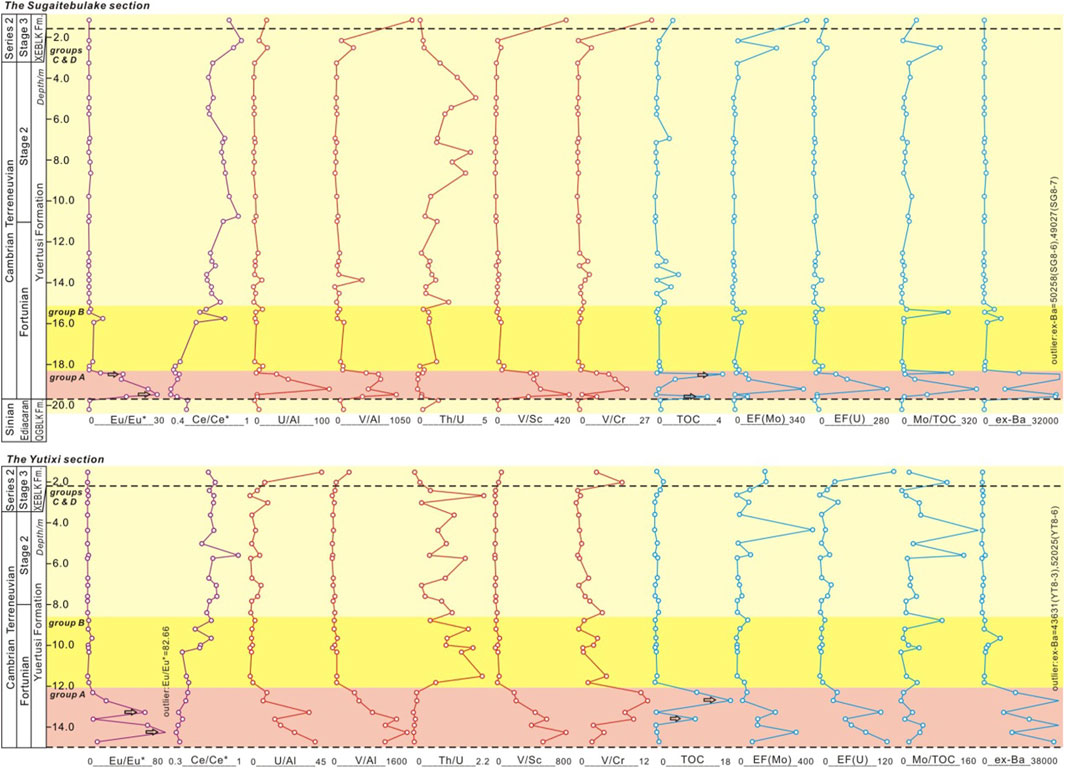
Figure 10. Vertical trends of selected geochemical proxies of the Sugaitebulake and Yutixi sections.
The relatively weakly correlation of TOC and Ba-excess (Figure 9C) suggests that one or both proxies were altered, perhaps by post-depositional oxidation. In addition, it is possible that enhanced productivity was sustained by hydrothermal activity, as suggested by the weak co-variance (R2 = 0.26) of Ba-excess and Eu/Eu* (Figure 9D).
5.4 Redox proxies and changes of redox conditions
Trace element compositions are dominated by terrigenous and authigenic material, though only the latter is modified by redox-related enrichment variations (Thomson et al., 1995; Tribovillard et al., 2006). For example, U, V, and Mo are especially sensitive to changing redox conditions, whereas Cr, and Co are also proxies for terrigenous clastic flux (Tribovillard et al., 2006). Assessment of the degree of the enrichment of authigenic species commonly involves Al-normalization which mitigates the dilutive effects of organic matter flux and the precipitation of authigenic constituents, notably biogenic carbonate (Lucinda et al., 1987; Thomson et al., 1995). However, the authigenic contribution may be under- or overestimated if the sources of the Al are Al-enriched or Al-deficient samples alternatively. Therefore, it is important to judge whether samples are derived from common silicate minerals, which is evaluated by the correlation of Al and detrital proxies such as Th, Sc, and Zr.
The studied samples display strong covariance of Sc and Al (R2 = 0.827), and Zr and Al (R2 = 0.765), which suggests sediments are derived from common silicate minerals. Low coefficients of determination of V, U, Cr, Mo, Ba, and Al (Figure 11) suggest that these elements are suitable redox proxies, whereas the strong covariance of Sc and Al suggests that Sc is a proxy for terrestrial contribution.
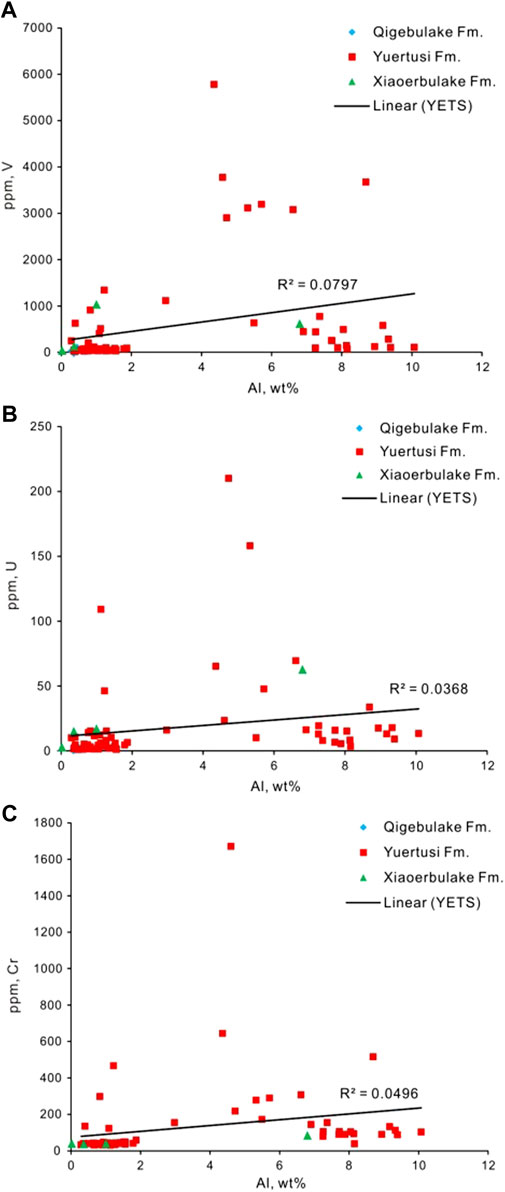
Figure 11. Crossplots of selected redox proxies (ppm) versus Al concentrations (wt%) of the Yuertusi Fm, Qigebulake Fm and Xiaoerbulake Fm (for judging signals contribution of terrigenous debris and seawater).
Uranium exists as U (VI) under oxic—suboxic conditions, complexes with carbonate ion forming uranium acyl, an intermediate form of aqueous UO2 (CO3)24- (Langmuir, 1978). U (VI) reduces to U (IV) under anoxic conditions ultimately precipitating as UO2 (Wignall and Hallam, 1996). Thiobacillus, an essential catalyst for reduction, is associated with TOC. Strong relationships of U and TOC are generally typical in sediment deposited under non-sulfidic conditions. The existence of sulfidic conditions is suggested by weak correlation of U and TOC (Algeo and Maynard, 2004; Tribovillard et al., 2006).
U/Al ratios of the studied samples range from 0.416 to 109.93 (Figure 10). Most samples are enriched in U relative to Post-Archean Australian Shale (PAAS) average (0.310). Average U/Al ratios of the Qigebulake Formation, Yuertusi Formation, and Xiaoerbulake Formation are 4.58, 8.67, and 44.38, respectively (Table 4; Figure 10). Samples of the Yuertusi Formation group A, and the Xiaoerbulake Formation are characterized by U/Al ratios of 3.88–96.66 (average = 26.76) and 9.24 to 109.93 (average = 44.38), respectively. These values are significantly enriched relative to euxinic deposits in the Black Sea (U/Al = 3.3). It is noteworthy that the rest samples of both studied sections display modest enrichment of U (average U/Al = 3.52) (Figure 10).
The Sugaitebulake and Yutixi sections display the bottom water redox variations associated with the Ediacaran to Cambrian transition. U abundances of the sections indicate that the ocean was weakly anoxic during the Late Ediacaran. However, conditions became euxinic during the early Cambrian Terreneuvian time as suggested by the weak correlation between U/Al and TOC for samples from the Yuertusi Formation group A (Figure 12B). Bottom conditions became weakly anoxic during the Late Cambrian Terreneuvian as oxygen levels increased. By the early Cambrian Series 2, the paleocean had once again become euxinic.
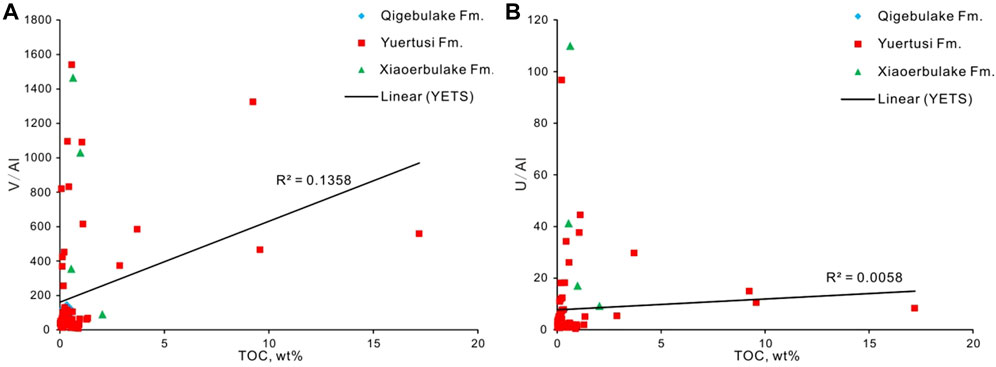
Figure 12. Crossplots of TOC versus (A) V/Al and (B) U/Al ratios respectively of the Yuertusi, Qigebulake, and Xiaoerbulake formations.
Thorium is generally present in seawater as Th(IV) in seawater and displays little response to changing redox conditions. The Th/U ratio has a long history of use as a redox proxy (Wignall and Twitchett, 1996; Algeo and Maynard, 2004; Cao et al., 2021). Generally, Th/U ratios ranging from 0 to 2 imply anoxic conditions, whereas ratios ranging from 2 to 7 indicate oxic conditions (Yao et al., 2014b). Average Th/U ratios of the Qigebulake Formation, Yuertusi Formation, and Xiaoerbulake Formation (Table 4) are 0.88, 0.95, and 0.12, respectively. More specifically, average Th/U ratios of the Yuertusi Formation groups A, B, C, and D are 0.11, 0.95, 1.31, and 0.77, respectively. Yet only eight samples (SG8-16, SG8-27, SG8-28, SG8-29, SG8-33, SG8-34, SG8-35, and YT8-27) of both sections exhibit higher Th/U ratios that ranging from 2.007 to 3.909, are consistent with oxic or suboxic deposits. In contrast, Th/U ratios of remaining samples range from 0.003 to 1.962 (average = 0.671) suggesting that each section was primarily deposited under anoxic conditions (Figure 10; Cao et al., 2021).
Variations of Th/U can be considered in terms of sea level fluctuations. The early Cambrian Terreneuvian Yuertusi Formation group A deposits and the initial Cambrian Series 2 Xiaoerbulake Formation accumulated matching with rising sea level, which likely contributed to the establishment of euxinic conditions. Each transgression was preceded by a regression accompanied by deposition of the Upper Ediacaran Qigebulake Formation and the Upper Cambrian Terreneuvian Yuertusi Formation groups B, C, and D. Moreover, 7/8 samples with higher Th/U ratios (>2; see Table 4) of the Sugaitebulake section may imply that depositional conditions of the section were more oxygenated than the Yutixi section.
Vanadium displays a strong predilection for anoxic sediments (Calvert and Pedersen, 1993; 1996; Tribovillard et al., 2006). V(V) is generally associated with hydrogen vanadate (HVO42− or H2VO41−) in oxic seawater and is readily adsorbed by ferromanganese hydroxides (Wanty et al., 1990). Non-sulfide anoxic and euxinic conditions favor the uptake of V from seawater to sediment (Morford and Emerson, 1999; Algeo and Maynard, 2004). Generally, humic acid is required to catalyze the reduction of V (V) to V (IV). Weak co-variance of V and TOC is consistent with accumulation of sediment under euxinic conditions (Calvert and Pedersen, 1993; 1996; Morford and Emerson, 1999; Algeo and Maynard, 2004; Tribovillard et al., 2006).
Significant variation of V/Al ratios of the studied samples (8.56–1,465.78; average = 234.63) demonstrate that most samples display enrichments of vanadium relative to PAAS (15.0). Indeed, average V/Al of the Qigebulake Formation, Yuertusi Formation, and Xiaoerbulake Formation are 101.68, 207.47, and 735.54, respectively, well exceeding the PAAS average. The Yuertusi Formation group A (V/Alavg. = 781.98) and the Xiaoerbulake Formation (V/Alavg. = 735.54) are especially rich in vanadium compared with Black Sea deposits (V/Alavg. = 28.8) (Li et al., 2016). By contrast, average V/Al of the reminder samples of Qigebulake Formation, Yuertusi Formation groups B, C, and D are 101.68, 81.21, 8.19, and 74.80, respectively. Furthermore, the low coefficient of determination of V/Al ratios versus TOC (R2 = 0.136) suggests that bottom conditions were euxinic during Early Cambrian Terreneuvian time (Figure 12A) as well as early Series 2 time. These intervals of euxinic may be linked to global transgression during the Ediacaran to Cambrian interval (Kimura and Watanabe, 2001). Similarly, defined by relatively low V/Al (Figure 10), the paleo-ocean was under suboxic conditions during the late Ediacaran and late Cambrian Terreneuvian intervals, which might be associated with periodical regressions.
The V/Sc ratio has been used as a redox proxy (Tribovillard et al., 2006; Algeo and Maynard, 2004; Yu et al., 2011; Li et al., 2016). V/Sc ratios in excess of 24 suggest euxinic conditions (Kimura and Watanabe, 2001; Jiang et al., 2007). Specifically, average V/Sc ratios of individual units are 20.16 (Qigebulake Formation), 340.51 (Yuertusi Formation group A), 29.78 (Yuertusi Formation group B), 11.45 (Yuertusi Formation group C), 15.85 (Yuertusi Formation group D), and 143.67 (Xiaoerbulake Formation), respectively (see Table 4; Figure 10). Variations of V/Sc (Figure 10) suggest the existence of euxinic conditions during the Early Cambrian Terreneuvian and initial Cambrian Series 2 times. However, bottom conditions appear to have been suboxic during the late Ediacaran and late Cambrian Terreneuvian intervals. Moreover, the Yutixi section (V/Scavg. = 426.48) may stay euxinic longer than the Sugaitebulake section (V/Scavg. = 240.21).
The V/Cr ratio is another proxy for assessing paleocean redox conditions (Yao et al., 2014a). Threshold V/Cr values that have been used to infer redox conditions include euxinic conditions (V/Cr>4.25), suboxic conditions (V/Cr: 2–4.25), and oxic conditions (V/Cr<2) (Jones and Manning, 1994; Jiang et al., 2007; Figure 10). Elevated V/Cr values of samples of the Yuertusi Formation group A (2.26–17.28; average = 8.22) and the Xiaoerbulake Formation (0.97–25.64; average = 9.35) are consistent with previously described proxies, which suggests that euxinic conditions existed in the basin during Early Cambrian Terreneuvian and initial Series 2 time. However, relatively low V/Cr ratios for samples the Qigebulake Formation (0.81–1.43; average=1.12), the Yuertusi Formation group B (0.93–4.99; average = 2.14), group C (0.55–4.73; average = 1.52), and group D (1.05–5.41; average = 2.40) suggest suboxic conditions in Late Ediacaran time and during the late Cambrian Terreneuvian.
Previous investigations of the Niutitang Formation of the Yangtze Platform have highlighted the role of hydrothermal activity in trace metal element enrichments, including Mo, U, and Ni. (Tribovillard et al., 2006; Jiang et al., 2007; Li et al., 2015; Gao et al., 2018). Moderate correlation (R2 = 0.63) of Eu/Eu* and V/Al of the studied samples (Figures 13A, B) suggests that hydrothermal activity during Early Cambrian Terreneuvian time (R2 = 0.03 for all samples exclusive of group A samples) contributed some amount of V in these deposits.
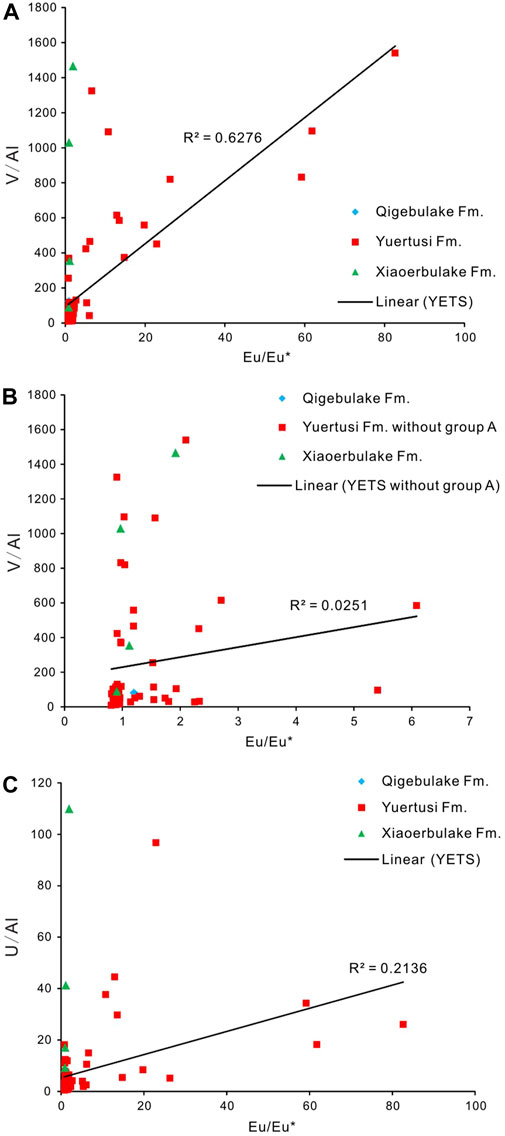
Figure 13. Crossplots of Eu/Eu* versus (A) V/Al of the Yuertusi, Qigebulake, and Xiaoerbulake formations; (B) detail of Figure 13A; (C) U/Al of the Yuertusi, Qigebulake, and Xiaoerbulake formations.
5.5 Mo-U covariation and paleo-hydrography
Mo-U covariation and Mo versus TOC are commonly used to define degrees of anoxia and watermass restriction (Algeo and Tribovillard, 2009, 2011; Algeo and Rowe, 2012; Tribovillard et al., 2012). The enrichment of Mo and U is influenced by these elements concentrations in seawater, redox conditions, and degrees of basin restriction (Algeo and Lyons, 2006). They present analogous concentrations in global seawater owing to their relatively long residence time (Mo = ∼78 ka; U = ∼45 ka). Molybdenum generally occurs as MoO42− (stable status) under oxygenated conditions but is reduced to Mo (IV) from Mo (VI) under anoxic and sulfidic conditions. Thiomolybdate (MoO4-xSx2− or MoSx) formed under sulfidic conditions (H2S or HS−) are captured by Mn-Fe-oxyhydroxides or are complexed with humic acid. By contrast, the uptake of U by sediment at redox boundaries, especially near the sediment-water interface, occurs in the absence of hydrogen sulfide. Therefore, the different behavior of Mo and U under oxygen depleted conditions permits the distinction of sediment that accumulated under anoxic versus euxinic conditions.
Mo/Al values of the studied samples range from 0.04 to 89.91 (average = 10.48), generally well in excess of the average value of upper continental crust (1.6) (Taylor and McLennan, 1985; Zhang et al., 2016) (Table 4; Figure 10). Samples of the Yuertusi group A and Xiaoerbulake Formation are especially enriched in Mo (Figure 10). By contrast, average Mo/Al ratios of the Qigebulake Formation and Yuertusi Formation groups B, C, and D display low Mo contents (Figure 10). Yuertusi Formation group A and Xiaoerbulake Formation cluster in the sulfidic field of the Mo-U crossplot (Figure 14A). Most of samples of the Qigebulake Formation, Yuertusi Formation groups B, C, and D are distributed between the suboxic to anoxic fields (Figure 14A). A few samples of Yuertusi group B, and C are scattered between anoxic and sulfidic conditions (Figure 14A). Thus, Mo-U covariation suggests that the paleocean was euxinic during Early Cambrian Terreneuvian and early Series 2 time, and it experienced suboxic conditions in Late Ediacaran time and during the early Cambrian Terreneuvian transitions, consistent with other redox proxies.
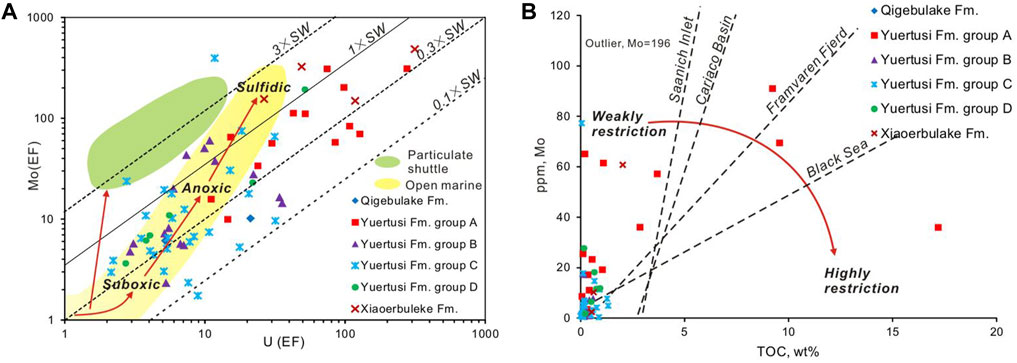
Figure 14. (A) Mo(EF) versus U(EF); (B) Mo (ppm) versus TOC of the Yuertusi Fm, Qigebulake Fm and Xiaoerbulake Fm (modified from Algeo and Tribovillard, 2006, 2009, 2011, 2012).
The Mo-TOC crossplot has been used to consider hydrographic aspects of ancient oceans (Algeo and Lyons, 2006; Algeo and Tribovillard, 2009). Such an analytical approach is especially useful for assessing circulation or restriction (Algeo and Lyons, 2006; Algeo and Tribovillard, 2009). Mo concentrations of the studied deposits comport with a well-mixed or open ocean (Figure 14B). Increasing basin restriction and consequent depletion of the elemental reservoir, which would be manifested by diminished Mo contents, could be misinterpreted as evidence of anoxic non-sulfidic conditions (Tribovillard et al., 2012). (Figure 14A) Consideration of Mo and U enrichment values suggests that the ocean during the Late Ediacaran - Cambrian Series 2 time interval was weakly restricted, and with quick circulation via upwelling. Strongly enriched Mo and U levels of the Yuertusi group A (Figure 10) further confirm that these deposits accumulated under anoxic to euxinic conditions, consistent with earlier described proxies. The fact that most of the studied samples plot between the 0.1 × SW and 1 × SW trend lines suggests that the seawater Mo/U ratio of the Tarim Platform during the Ediacaran-Cambrian transition was similar to that of the modern and most dissolved particulates of Mo and U were adsorbed by sediments.
5.6 Accumulation of organic matter
Significant global changes in Earth’s marine environment and biosphere that accompanied the Ediacaran-Cambrian transition are archived in the geochemical and isotopic record of contemporaneous sedimentary deposits. However, remaining controversies require further research (Cowie and Glaessner, 1975; Zhang et al., 2016). The Tarim Platform was in the Proto-Tethys domain during the Sinian to Cambrian (∼540 Ma) (Figure 1) and shared similar depositional settings with the Yangtze Platform. Interbedded shale and carbonate of the Yuertusi Formation appears to correlate with black shale of the Niutitang Formation of the Yangtze Platform (Yu et al., 2001). Moreover, hydrothermal activities have been responsible for polymetallic (Ni-Mo-V-Au) associated with the organic-rich rocks (Jiang et al., 2016).
By contrast, little detailed work has been devoted to understanding the potential role of changing marine redox conditions and hydrothermal activity on the Tarim Platform on accumulation of organic matter (Zhu et al., 2012). Hydrothermal fluids contain diverse trace metal elements, including biotic nutrients (e.g., Fe, P, K, and Si) that sustain productivity. Indeed, abundant inactive phosphate mines in Bachu and Keping counties, NW Tarim Basin, likely reflect a strong hydrothermal influence. Ophiolitic rocks dated between 590 and 600 Ma (Yu et al., 2009) in the South Tianshan Orogenic Belt suggest that the South Tianshan Ocean had matured before the Cambrian. Thus, hydrothermal activity may have been linked to displacement between north Tarim and the South Tianshan Ocean.
Organic carbon contents of pelagic deposits are commonly less than 0.5 wt%, whereas sediment deposited in association with costal upwelling may contain more than 3 wt% TOC (Sanders et al., 2014; Mansour and Wagreich, 2022). The combination of high TOC contents in studied Yuertusi Formation samples, including a value of 29 wt% measured from Well Xinkedi-1 (Figure 1), and phosphorite nodules distributed in basal Yuertusi Formation suggest that costal upwelling acting in concert with hydrothermal activity sustained robust productivity and accumulation of organic matter.
Integration of the described proxy data yields a depositional model for the Ediacaran to Cambrian transition of the Tarim Platform (Figure 15). Hydrothermal fluids advecting along faults mixed with seawater that was ultimately transported to the shelf by upwelling. Enhanced upwelling may have been associated with rising sea level at this time. The nutrient-rich fluids triggered increased primary productivity and supplied trace metals that were incorporated into accumulating sediment, including organic-rich deposits and phosphate nodules (Figure 15). The increased flux of organic matter depleted water column oxygen levels thus favoring the establishment of anoxic and euxinic conditions, which favored the preservation of accumulating organic matter.
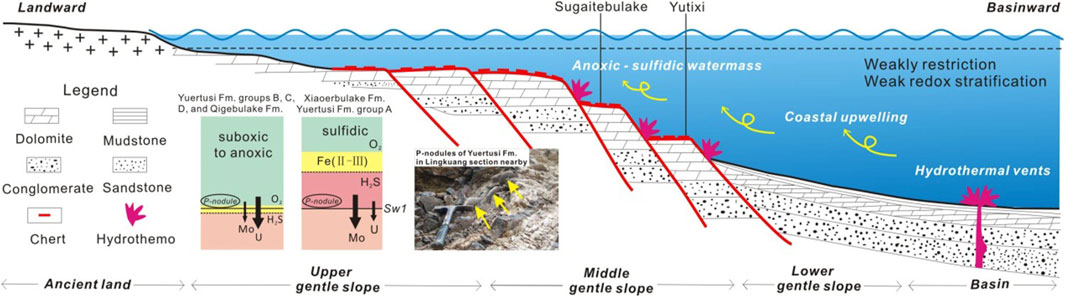
Figure 15. Paleocean environmental model of the northern Tarim Platform, China in the early Cambrian.
6 Summary and conclusion
Investigation of the Yuertusi Formation over the past decade has shed light on the record of changing paleo-environmental conditions spanning the Ediacaran—Cambrian boundary in the Tarim Basin. This study assesses the interplay of sea level change, variable levels of bio-productivity, hydrothermal activity, and organic matter accumulation and preservation in the Yuertusi Formation and immediately over and underlying deposits. Abundances of trace elements for the samples of the Sugaitebulake and Yutixi sections are of significantly enrichments of Mo (ppm)>U (ppm)>V (ppm)>Ba (ppm)>Cr (ppm)>Ni (ppm)>Cu (ppm)>Zn (ppm). Enrichment of heavier REEs of Yuertusi Formation group A samples, weakly positive Ce anomalies, extremely positive Eu anomalies, moderately positive Y anomalies, and enriched Ba indicate episodic hydrothermal activity contemporaneous with accumulation of the lower Yuertusi Formation in the north Tarim Platform during the Early Cambrian Terreneuvian.
The depositional site of the studied sections on the Tarim Platform was weakly restricted during Late Ediacaran - Series 2 transition. Suboxic conditions occurred during accumulation of the Qigebulake Formation in Late Ediacaran time. Increasing productivity, induced by hydrothermal activity and upwelling enhanced by rising sea level, resulted in the accumulation of the organic-rich lower part (group A especially) of the Yuertusi Formation. The consequent drawdown of dissolved oxygen resulted in the establishment of anoxic to euxinic conditions that favored preservation of the organic matter exported to the seafloor. Lowering sea level during the lower part of the Fortunian stage was accompanied by suboxic to oxic conditions and accumulation of Yuertusi groups B, C, and D deposits. However, euxinic conditions were again established in the early part of Cambrian Series 2 Xiaoerbulake Formation, perhaps in association with another transgression. Mo-U co-variations suggest that the basin was weakly restricted throughout most of the studied interval. The present investigation illustrates the significance of hydrothermal activity and upwelling in the accumulation and preservation of organic matter in the Tarim Basin during the Ediacaran-Cambrian transition.
Data availability statement
The original contributions presented in the study are included in the article/Supplementary material, further inquiries can be directed to the corresponding author.
Author contributions
QF: Conceptualization, Data curation, Formal Analysis, Funding acquisition, Investigation, Methodology, Project administration, Resources, Software, Supervision, Validation, Visualization, Writing–original draft, Writing–review and editing. TF: Conceptualization, Funding acquisition, Investigation, Methodology, Project administration, Resources, Supervision, Validation, Visualization, Writing–review and editing. ZZ: Data curation, Formal Analysis, Project administration, Resources, Software, Visualization, Writing–review and editing. QL: Funding acquisition, Resources, Supervision, Visualization, Writing–review and editing.
Funding
The author(s) declare that financial support was received for the research, authorship, and/or publication of this article. The research is sponsored by the National Science and Technology Major Projects of China (Grant Nos. 2017ZX05005002, and 2017ZX05009002), the Strategic Pilot Science and Technology Major Projects of Chinese Academy of Science (Grant No. XDA1401020102), and CNOOC Key Laboratory Director Fund (2024).
Acknowledgments
The authors wish to thank Junpeng Zhang (Nanjing Institute of Geology and Palaeontology, Chinese Academy of Sciences); Yaxuan Yuan, Yan Zhang, Duan Wei, Hehang Zhang, Congcong Li, Ziyi Wang and Yaxin Shang for field assistance and stimulating insights. Special thanks should be given to two reviewers, who have improved the manuscript thoroughly, and significantly.
Conflict of interest
The authors declare that the research was conducted in the absence of any commercial or financial relationships that could be construed as a potential conflict of interest.
Publisher’s note
All claims expressed in this article are solely those of the authors and do not necessarily represent those of their affiliated organizations, or those of the publisher, the editors and the reviewers. Any product that may be evaluated in this article, or claim that may be made by its manufacturer, is not guaranteed or endorsed by the publisher.
References
Adachi, M., Yamamoto, K., and Sugisaki, R. (1986). Hydrothermal chert and associated siliceous rocks from the northern Pacific their geological significance as indication od ocean ridge activity. Sediment. Geol. 47, 125–148. doi:10.1016/0037-0738(86)90075-8
Algeo, T. J., Hinnov, L., Moser, J., Maynard, J. B., Elswick, E., Kuwahara, K., et al. (2010). Changes in productivity and redox conditions in the Panthalassic Ocean during the latest Permian. Geology 38, 187–190. doi:10.1130/G30483.1
Algeo, T. J., and Lyons, T. W. (2006). Mo–total organic carbon covariation in modern anoxic marine environments: implications for analysis of paleoredox and paleohydrographic conditions. Paleoceanography 21, PA1016. doi:10.1029/2004PA001112
Algeo, T. J., and Maynard, J. B. (2004). Trace-element behavior and redox facies in core shales of Upper Pennsylvanian Kansas type cyclothems. Chem. Geol. 206, 289–318. doi:10.1016/j.chemgeo.2003.12.009
Algeo, T. J., Morford, J., and Cruse, A. (2012). Editorial: new applications of trace metals as proxies in marine paleoenvironments. Chem. Geol. 306-307, 160–164. doi:10.1016/j.chemgeo.2012.03.009
Algeo, T. J., and Rowe, H. (2012). Paleoceanographic applications of trace-metal concentration data. Chem. Geol. 324-325, 6–18. doi:10.1016/j.chemgeo.2011.09.002
Algeo, T. J., and Tribovillard, N. (2009). Environmental analysis of paleoceanographic systems based on molybdenum-uranium covariation. Chem. Geol. 268, 211–225. doi:10.1016/j.chemgeo.2009.09.001
Bau, M., and Dulski, P. (1996). Distribution of yttrium and rare-earth elements in the penge and kuruman iron-formations, transvaal supergroup, South Africa. Precambrian Res. 79, 37–55. doi:10.1016/0301-9268(95)00087-9
Calvert, S. E., and Pedersen, T. F. (1993). Geochemistry of Recent oxic and anoxic marine sediments: implications for the geological record. Mar. Geol. 113, 67–88. doi:10.1016/0025-3227(93)90150-t
Calvert, S. E., and Pedersen, T. F. (1996). Sedimentary geochemistry of manganese: implications for the environment of formation of manganiferous black shales. Econ. Geol. 91, 36–47. doi:10.2113/gsecongeo.91.1.36
Calvert, S. E., and Pedersen, T. F. (2007). Chapter fourteen elemental proxies for palaeoclimatic and palaeoceanographic variability in marine sediments: interpretation and application. Dev. Mar. Geol. 1, 567–644. doi:10.1016/s1572-5480(07)01019-6
Cao, L., Zhang, Z. H., Zhao, J. Z., Jin, X., Li, H., Li, J., et al. (2021). Discussion on the applicability of Th/U ratio for evaluating the paleoredox conditions of lacustrine basins. Int. J. Coal Geol. 248, 103868. doi:10.1016/j.coal.2021.103868
Cao, Z. M., Cao, H., Tao, C. H., Li, J., Yu, Z. H., and Shu, L. P. (2012). Rare earth element geochemistry of hydrothermal deposits from Southwest Indian Ridge. Acta Oceanol. Sin. 31, 62–69. doi:10.1007/s13131-012-0192-1
Cowie, J. W., and Glaessner, M. F. (1975). The Precambrian-Cambrian boundary: a symposium. Earth-Science Rev. 11, 209–251. doi:10.1016/0012-8252(75)90120-8
Dulski, P. (1994). Interferences of oxide, hydroxide and chloride analyte species in the determination of rare earth elements in geological samples by inductively coupled plasma-mass spectrometry. Anal. Bioanal. Chem. 350, 194–203. doi:10.1007/bf00322470
Feng, Z. Z. (2005). The lithological paleogeography of the Cambrian and the Ordovician in Tarim area. Beijing: Petroleum Industry Press, 1–97. (In Chinese).
Ganai, J. A., and Rashid, S. A. (2015). Rare earth element geochemistry of the Permo-Carboniferous clastic sedimentary rocks from the Spiti Region,Tethys Himalaya: significance of Eu and Ce anomalies. Chin. J. Geochem. 34, 252–264. doi:10.1007/s11631-015-0045-7
Ganeshram, R. S., Pedersen, T. F., Calvert, S., and Francois, R. (2002). Reduced nitrogen fixation in the glacial ocean inferred from changes in marine nitrogen and phosphorus inventories. Nature 415, 156–159. doi:10.1038/415156a
Gao, P., He, Z. L., Li, S. J., Lash, G. G., Li, B. Y., Huang, B. Y., et al. (2018). Volcanic and hydrothermal activities recorded in phosphate nodules from the Lower Cambrian Niutitang Formation black shales in South China. Palaeogeogr. Palaeoclimatol. Palaeoecol. 505, 381–397. doi:10.1016/j.palaeo.2018.06.019
Gao, Z. J., Wu, S. Z., Li, Y. G., and Qian, J. X. (1981). The stratigraphic study of the cambrian to the sinian in akesu-keping, Xinjiang. Chin. Sci. Bull. 12, 741–744.
Gao, Z. Q., Shi, J. Y., Lv, J. L., and Chang, Z. (2022). High-frequency sequences, geochemical characteristics, formations, and distribution predictions of the lower Cambrian Yuertusi Formation in the Tarim Basin. Mar. Petroleum Geol. 146, 105966. doi:10.1016/j.marpetgeo.2022.105966
Holser, W. T. (1997). Evaluation of the application of rare-earth elements to paleoceanography. Paleoclimatol., Palaeoecol. 132, 309–323. doi:10.1016/s0031-0182(97)00069-2
Jacobs, L., and EmersonHuested, S. S. S. (1987). Trace metal geochemistry in the cariaco trench. Deep Sea Res. Part I Oceanogr. Res. Pap. 34, 965–981. doi:10.1016/0198-0149(87)90048-3
Jiang, S. Y., Yang, J. H., Ling, H. F., Chen, Y. Q., Feng, H. Z., Zhao, K. D., et al. (2007). Extreme enrichment of polymetallic Ni–Mo–PGE–Au in Lower Cambrian black shales of South China: an Os isotope and PGE geochemical investigation. Palaeogeogr. Palaeoclimatol. Palaeoecol. 254, 217–228. doi:10.1016/j.palaeo.2007.03.024
Jones, B., and Manning, D. A. C. (1994). Comparison of geochemical indices used for the interpretation of palaeoredox conditions in ancient mudstones. Chem. Geol. 111, 111–129. doi:10.1016/0009-2541(94)90085-x
Kamber, B. S., Bolhar, R., and Webb, G. E. (2004). Geochemistry of late Archaean stromatolites from Zimbabwe: evidence for microbial life in restricted epicontinental seas. Precambrian Res. 132, 379–399. doi:10.1016/j.precamres.2004.03.006
Kidder, D. L., Krishnaswamy, R., and Mapes, R. H. (2003). Elemental mobility in phosphatic shales during concretion growth and implications for provenance analysis. Chem. Geol. 198, 335–353. doi:10.1016/s0009-2541(03)00036-6
Kimura, H., and Watanabe, Y. (2001). Oceanic anoxia at the precambrian cambrian boundary. Geology 29, 995–998. doi:10.1130/0091-7613(2001)029<0995:oaatpc>2.0.co;2
Klinkhammer, G. P., Elderfield, H., Edmond, J. M., and Mitra, A. (1994). Geochemical implications of rare earth element patterns in hydrothermal fluids from mid-ocean ridges. Geochimica Cosmochimica Acta 58, 5105–5113. doi:10.1016/0016-7037(94)90297-6
Langmuir, D. (1978). Uranium solution-mineral equilibria at low temperatures with applications to sedimentary ore deposits. Geochimica Cosmochimica Acta 42, 547–569. doi:10.1016/0016-7037(78)90001-7
Li, G. X., Wang, Z. Y., and Pan, G. E. (1992). The sedimentary facies of keping Xinjiang during the late sinian to the early permian. Beijing: Geology Press, 1–132. (In Chinese).
Li, P. L. (2010). Tectonic sedimentation and reservoir forming in the Tarim Basin. Beijing: Geological Publishing House, 1–258. (In Chinese).
Li, Y. F., Fan, T. L., Zhang, J. C., Zhang, J. P., Wei, X. J., Hu, X. L., et al. (2015). Geochemical changes in the Early Cambrian interval of the Yangtze Platform, South China: implications for hydrothermal influences and paleocean redox conditions. J. Asian Earth Sci. 109, 100–123. doi:10.1016/j.jseaes.2015.05.003
MacRae, N. D., Nesbitt, H. W., and Kronberg, B. I. (1992). Development of a positive Eu anomaly during diagenesis. Earth Planet. Sci. Lett. 109, 585–591. doi:10.1016/0012-821x(92)90116-d
Mansour, A., and Wagreich, M. (2022). Earth system changes during the cooling greenhouse phase of the Late Cretaceous: coniacian-Santonian OAE3 subevents and fundamental variations in organic carbon deposition. Earth-Science Rev. 229, 104022. doi:10.1016/j.earscirev.2022.104022
Mansour, A., Wagreich, M., Gentzis, T., Ocubalidet, S., Tahoun, S. S., and Elewa, A. M. (2020). Depositional and organic carbon-controlled regimes during the Coniacian-Santonian event: first results from the southern Tethys (Egypt). Mar. Petroleum Geol. 115, 104285. doi:10.1016/j.marpetgeo.2020.104285
McLennan, S. M. (1989). Rare earth elements in sedimentary rocks; influence of provenance and sedimentary processes. Rev. Mineralogy Geochem. 21, 170–182.
McLennan, S. M. (2001). Relationships between the trace element composition of sedimentary rocks and upper continental crust. Geochem. Geophys. Geosystems 2, 1021. doi:10.1029/2000gc000109
Mills, R. A., and Elderfield, H. (1995). Rare earth element geochemistry of hydrothermal deposits from the active TAG Mound, 26°N Mid-Atlantic Ridge. Geochimica Cosmochimica Acta 59, 3511–3524. doi:10.1016/0016-7037(95)00224-n
Morford, J. L., and Emerson, S. (1999). The geochemistry of redox sensitive trace metals in sediments. Geochimica Cosmochimica Acta 63, 1735–1750. doi:10.1016/s0016-7037(99)00126-x
Murray, R. W. (1994). Chemical criteria to identify the depositional environment of chert: general principles and applications. Sediment. Geol. 90, 213–232. doi:10.1016/0037-0738(94)90039-6
Murray, R. W., Buchholtz Ten Brink, M. R., David, C. G., Russ, G. P., and David, L. J. (1991). Rare earth, major, and trace elements in chert from the Franciscan Complex and Monterey Group, California: assessing REE sources to fine-grained marine sediments. Geochimica Cosmochimica Acta 55, 1875–1895. doi:10.1016/0016-7037(91)90030-9
Murray, R. W., Buchholtz Ten Brink, M. R., Gerlach, D. C., Russ, G. P., and Jones, D. L. (1992). Rare earth, major, and trace element composition of Monterey and DSDP chert and associated host sediment: assessing the influence of chemical fractionation during diagenesis. Geochimica Cosmochimica Acta 56, 2657–2671. doi:10.1016/0016-7037(92)90351-i
Nance, W. B., and Taylor, S. R. (1976). Rare earth element patterns and crustal evolution--I. Australian post-Archean sedimentary rocks. Geochimica Cosmochimica Acta 40, 1539–1551. doi:10.1016/0016-7037(76)90093-4
Nothdurft, L. D., Webb, G. E., and Kamber, B. S. (2004). Rare earth element geochemistry of Late Devonian reefal carbonates, canning basin, Western Australia: confirmation of a seawater REE proxy in ancient limestones. Geochimica Cosmochimica Acta 68, 263–283. doi:10.1016/s0016-7037(03)00422-8
Ogihara, S. (1999). Geochemical characteristics of phosphorite and carbonate nodules from the Miocene Funakawa Formation, western margin of the Yokote Basin, northeast Japan. Sediment. Geol. 125, 69–82. doi:10.1016/s0037-0738(98)00136-5
Owen, A. W., Armstrong, H. A., and Floyd, J. D. (1999). Rare earth element geochemistry of upper Ordovician cherts from the Southern Uplands of Scotland. J. Geol. Soc. 156, 191–204. doi:10.1144/gsjgs.156.1.0191
Owen, R. M., and Olivarez, A. M. (1988). Geochemistry of rare earth elements in pacific hydrothermal sediments. Mar. Chem. 25, 183–196. doi:10.1016/0304-4203(88)90063-1
Rangin, C., Steinberg, M., and Bonnot-Courtois, C. (1981). Geochemistry of the Mesozoic bedded cherts of Central Baja California (Vizcaino-Cedros-San Benito): implications for paleogeographic reconstruction of an old oceanic basin. Earth Planet. Sci. Lett. 54, 313–322. doi:10.1016/0012-821X(81)90014-5
Sanders, C. J., Caldeira, P. P., Smoak, J. M., Ketterer, M. E., Belem, A., Mendoza, U. M. N., et al. (2014). Recent organic carbon accumulation (∼100 years) along the Cabo Frio, Brazil upwelling region. Cont. Shelf Res. 75, 68–75. doi:10.1016/j.csr.2013.10.009
Schoepfera, S. D., Shen, J., Wei, H. Y., Tyson, R. V., Ingall, E., and Algeo, T. J. (2015). Total organic carbon, organic phosphorus, and biogenic barium fluxes as proxies for paleomarine productivity. Earth-Science Rev. 149, 23–52. doi:10.1016/j.earscirev.2014.08.017
Shields, G., and Stille, P. (2001). Diagenetic constraints on the use of cerium anomalies as palaeoseawater redox proxies: an isotopic and REE study of Cambrian phosphorites. Chem. Geol. 175, 29–48. doi:10.1016/s0009-2541(00)00362-4
Sholkovitz, E. R. (1990). Rare-earth elements in marine-sediments and geochemical standards. Chem. Geol. 88, 333–347. doi:10.1016/0009-2541(90)90097-q
Tao, G. L., Shen, B. J., Tenger, B., Ang, Y. F., Xu, E. S., and Pan, A. Y. (2016). Weathering effects on high maturity organic matter in a black rock series: a case study of the Yuertusi Formation in Kalpin area, Tarim Basin. Petroleum Geol. Exp. 38, 376–381. (In Chinese).
Taylor, S. R., and McLennan, S. M. (1985). The continental crust: its composition and evolution. Phys. Earth Planet. Interiors 42, 196–197. doi:10.1016/0031-9201(86)90093-2
Thomson, J., Higgs, N. C., Wilson, T. R. S., Croudace, I. W., Delange, G. J., and Vansantvoort, P. J. M. (1995). Redistribution and geochemical behaviour of redox-sensitive elements around S1, the most recent eastern Mediterranean sapropel. Geochimica Cosmochimica Acta 59, 3487–3501. doi:10.1016/0016-7037(95)00232-o
Tribovillard, N., Algeo, T. J., Baudin, F., and Riboulleau, A. (2012). Analysis of marine environmental conditions based on molybdenum-uranium covariation-applications to Mesozoic paleoceanography. Chem. Geol. 324, 46–58. doi:10.1016/j.chemgeo.2011.09.009
Tribovillard, N., Algeo, T. J., Lyons, T., and Riboulleau, A. (2006). Trace metals as paleoredox and paleoproductivity proxies: an update. Chem. Geol. 232, 12–32. doi:10.1016/j.chemgeo.2006.02.012
Tyson, R. V. (2005). The “productivity versus preservation” controversy: cause, flaws, and resolution. Spec. Publ. 82, 17–33.
Wang, W. Y., Xiao, B., Zhang, S. G., and Zhu, Z. L. (1985). The classification and correlation of the Cambrian in Akesu-Wushi area, Xinjiang. Xinjiang Geol. 4, 103–105. (In Chinese).
Wang, Y., Chen, J., Shen, W., and Li, M. (2022). Mechanism of organic matter accumulation in black shales of the Yuertusi Formation in the Tarim Basin: insights from paleoenvironmental variation during the early cambrian. Front. Earth Sci. 10, 879658. doi:10.3389/feart.2022.879658
Wanty, R. B., Goldhaber, M. B., and Northrop, H. R. (1990). Geochemistry of vanadium in an epigenetic, sandstone-hosted vanadium-uranium deposit, Henry Basin, Utah. Econ. Geol. 85, 270–284. doi:10.2113/gsecongeo.85.2.270
Wignall, P. B., and Hallam, A. (1996). Facies change and the end-Permian mass extinction in S.E. Sichuan, China. Palaios 11, 587–596. doi:10.2307/3515193
Wignall, P. B., and Twitchett, R. J. (1996). Oceanic anoxia and the end permian mass extinction. Science 272, 1155–1158. doi:10.1126/science.272.5265.1155
Wilde, P., Quinby-Hunt, M. S., and Erdtmann, B. D. (1996). The whole-rock cerium anomaly: a potential indicator of eustatic sea-level changes in shales of the anoxic facies. Sediment. Geol. 101, 43–53. doi:10.1016/0037-0738(95)00020-8
Wu, M. Q., and Ouyang, Z. Y. (1992). Ce anomaly-a chemical tracer for paleo-oceanic redox conditions. Chin. Sci. Bull. 15, 1293–1296.
Xu, Z. Q., Li, S. T., Jin, Z. J., and Yang, W. C. (2010). Prospective projects of marine facie exploration of the SINOPEC: dynamic evolution and prospect of oil and gas resources of the Tarim Basin and its peripheral orogenic belt, 47. Beijing: Chinese Academy of Geological Sciences CAGS.
Yang, X., Li, H. L., Zhang, P. Z., Chen, Q. L., Chen, Y., and Xiong, P. (2017a). Evolution of neoproterozoic Tarim Basin in northwestern China and tectonic background of the lower cambrian hydrocarbon source rocks. Acta Geol. Sin. 91, 1706–1719.
Yang, Z. Y., Luo, P., Liu, B., Zhou, C. M., and Ma, J. (2017b). The Depositional characteristics of earliest Cambrian hydrothermal fluid: a case study of siliceous rocks from Yurtus Formation in the Aksu area of Tarim Basin, Northwest China. Earth Sci. doi:10.3799/dqkx.2017.500
Yao, C. Y., Dong, Y. G., and Gao, W. H. (2014a). Paleoenvironment and origin of the sedimentary phosphorite of the yurtus formation (early cambrian, sugetbrak phosphorite deposit, Tarim Basin). Acta Geol. Sin. 88, 271–272. doi:10.1111/1755-6724.12370_13
Yao, C. Y., Ma, D. S., Ding, H. F., Zhang, X., and Huang, H. (2014b). Trace elements and stable isotopic geochemistry of an Early Cambrian chert-phosphorite unit from the lower Yurtus Formation of the Sugetbrak section in the Tarim Basin. Sci. China Earth Sci. 57, 454–464. doi:10.1007/s11430-013-4760-9
Yu, B. S., Chen, J. Q., and Lin, C. S. (2001). The sequence stratigraphy of the cambrian to the ordovician in Tarim and its correlations to the Yangtze platform and north China platform. Sci. China (Series D) 31, 17–26.
Yu, B. S., Chen, J. Q., and Lin, C. S. (2003). Geochemistry of black shale at the bottom of the Lower Cambrian in Tarim Basin and its significance for lithosphere evolution. Sci. China (Series D) 46, 498–507. doi:10.1360/03yd9043
Yu, B. S., Dong, H. L., Chen, H. Q., Li, X. W., and Lin, C. S. (2005). Characteristics of rare earth and trace element patterns in bedded cherts from the bottom of the lower Cambrian in the Northern Tarim Basin, Northwest China and their genetic significance. Acta Geol. Sin. 79, 215–224. doi:10.1111/j.1755-6724.2005.tb00884.x
Yu, B. S., Dong, H. L., Widom, E., Chen, J. Q., and Lin, C. S. (2009). Geochemistry of basal Cambrian black shales and cherts from the Northern Tarim Basin, Northwest China: implications for depositional setting and tectonic history. J. Asian Earth Sci. 34, 418–436. doi:10.1016/j.jseaes.2008.07.003
Zhang, J. P., Fan, T. L., Algeo, T. J., and Li, Y. (2016). Paleo-marine environments of the early cambrian Yangtze platform. Palaeogeogr. Palaeoclimatol. Palaeoecol. 443, 66–79. doi:10.1016/j.palaeo.2015.11.029
Zhang, J. P., Fan, T. L., Zhang, Y. D., Lash, G. G., Li, Y. F., and Wu, Y. (2017). Heterogenous oceanic redox conditions through the Ediacaran-Cambrian boundary limited the metazoan zonation. Sci. Rep. 7, 8550. doi:10.1038/s41598-017-07904-3
Keywords: Ediacaran-Cambrian transition, paleo-marine environments, Tarim, Western China, geochemical investigation
Citation: Fan Q, Fan T, Zhu Z and Li Q (2024) Reconstruction of the paleo-marine environment during the Ediacaran-Cambrian transition: new insights from geochemical proxies, northern Tarim Platform, Northwest China. Front. Earth Sci. 12:1331413. doi: 10.3389/feart.2024.1331413
Received: 01 November 2023; Accepted: 23 April 2024;
Published: 30 May 2024.
Edited by:
Kurt Eric Sundell, University of Arizona, United StatesReviewed by:
Ahmed Mansour, Southwest Petroleum University, ChinaVahid Tavakoli, University of Tehran, Iran
Copyright © 2024 Fan, Fan, Zhu and Li. This is an open-access article distributed under the terms of the Creative Commons Attribution License (CC BY). The use, distribution or reproduction in other forums is permitted, provided the original author(s) and the copyright owner(s) are credited and that the original publication in this journal is cited, in accordance with accepted academic practice. No use, distribution or reproduction is permitted which does not comply with these terms.
*Correspondence: Qi Fan, eGp1ZnFAc2luYS5jb20=