 Hualiang Zhu
 Wenjing Pang2†
 Fengjiao Chen
94% of researchers rate our articles as excellent or good
Learn more about the work of our research integrity team to safeguard the quality of each article we publish.
Find out more
ORIGINAL RESEARCH article
Front. Earth Sci., 06 March 2024
Sec. Atmospheric Science
Volume 12 - 2024 | https://doi.org/10.3389/feart.2024.1322908
In order to study the detection performance of the Advanced Direction Time Lightning Detection System (ADTD) over mainland China, the relationship between the detection efficiency (DE) and distance for ADTD sensor is analyzed using lightning location data by ADTD during 2014–2020, which fits well with the probability density function of the Gamma distribution. The DE and location accuracy of ADTD across China are hereafter evaluated according to the constructed probability density function. The results show that the DE of a single sensor first increases rapidly and then decreases slowly with the increase of the detection distance, and the model constructed based on the probability density function of Gamma distribution can explain this relationship well. In the regions with dense sensors such as central and eastern China, the DE of ADTD can reach 95%, with the majority of regions having lower location errors (less than 1,000 m). While, in the areas where sensors are sparse such as the Qinghai-Tibet Plateau and at the edge of ADTD, the DE of ADTD is less than 90% (in some areas it is even lower than 50%), and the location error greater than 1,000 m. In general, ADTD can accurately detect cloud-to-ground lightning events in most areas of China, but its accuracy is limited in some areas due to sparse sensors and instrument parameter settings.
In lightning monitoring and research work, the lightning monitoring devices include the National lightning detection network (NLDN) (Cummins and Murphy, 2009), lightning mapping array (Rison et al., 1999) in America, Advanced Direction Time Lightning Detection System (ADTD) (Zhang et al., 2018), Time-lagged three-dimensional positioning system (Qie et al., 2009; Zhang et al., 2010; Wang et al., 2016; Chen et al., 2019), Lightning interferometer system (Zhang et al., 2008; Sun et al., 2013; Sun et al., 2022), etc. in China. Among them, NLDN and ADTD, as relatively mature systems in operation, play an important role in the early warning and forecast of severe convective disastrous weather such as thunderstorm gale, tornado and hail, and provide basic data for the analysis of regional lightning characteristics and lightning protection design (Dementyeva et al., 2023; Iwasaki, 2016; Van Mai et al., 2022; Yair, 2018). In order to improve the reliability of lightning location data and better serve meteorological services such as severe convection monitoring, forecasting and warning, disaster prevention and reduction, it is critically important to evaluate and analyze the detection performance of lightning location network.
Detection efficiency (DE) and location accuracy are two important indicators to measure the detection performance of lightning location network, and they are also great concerns to lightning researchers and business personnel (Fan et al., 2018; Rodger et al., 2006; Rodger et al., 2009; Said and Murphy, 2016; Srivastava et al., 2017). At present, domestic and foreign scholars mainly evaluate the detection performance of lightning location network using artificially triggered lightning technique (Jerauld et al., 2005; Nag et al., 2011; Mallick et al., 2014; Shi et al., 2017), lightning strike monitoring of tall buildings (Hegde and Kumar, 2009; Hettiarachchi et al., 2018; Zhu et al., 2020), natural lightning observation (Biagi et al., 2007; Chen et al., 2012; Warner et al., 2012) and other test methods. For instance, based on the ground reality data set obtained by natural observation and artificially triggered lightning technique in Florida, (Zhu et al., 2022), evaluated and analyzed the detection performance of upgraded Earth Networks Total Lightning Network (ENTLN), and found that the location accuracy was significantly improved, and the median of location error was reduced from 215 m to 92 m; the number of detected strokes in all areas rose, and the DE of the strokes increased by 149%. However, due to the relatively weak current of artificially triggered lightning, the lightning outside the field of view cannot be observed, and the current channel of weak light intensity cannot be recorded. The validation experiment is only conducted during a specific period, therefore the sample size of the lightning data set is relatively small, and cannot represent all the lightning in a region. Moreover, the results of the validation experiment can only represent the detection performance of the local region, and cannot represent its performance in the whole detection region.
Multiple factors, including sensors, data acquisition methods, return waveform recognition, positioning algorithm, etc. can affect the detection performance of lightning location network (Bennett et al., 2011; Nag et al., 2015; Suzuki et al., 2016; Li et al., 2022), and it is difficult to evaluate each factor one by one. Chen et al. (Chen et al., 2013) proposed to use historical records of the lightning location data to evaluate the DE of lightning location network, and applied the method to the lightning location network in Yunnan Province. This method can ignore the influence of instrument setting, installation environment, terrain, and other factors, and get the distribution of DE closer to the real situation. However, the method must have enough historical data of lightning strokes to ensure statistical accuracy, and the DE of lightning location network cannot be calculated in the area with insufficient historical data.
Presently, ADTD is mainly used in China’s lightning monitoring in routine operations, and the detection performance of this lightning location network in the whole country is still unclear. In this paper, the DE of ADTD sensors with sufficient historical data of lightning strokes will be evaluated and analyzed by using the statistical method proposed by (Chen et al., 2013), and based on the Gamma distribution probability density function, the DE and detection distance model of the sensors will be established to obtain the DE and location accuracy of ADTD in China and provide a basis for the effective application of lightning location data in lightning monitoring and warning, risk assessment of lightning disaster and so forth.
ADTD, which is the second-generation cloud-to-ground lightning location system developed by the Space Science and Application Research Center, Chinese Academy of Sciences, works in the VLF/LF frequency band and adopts the combination of magnetic direction and time difference for lightning location (Wang et al., 2020a; Zhang et al., 2022). In 2010, nearly 300 ADTD sensors have been built in China, while a national lightning monitoring network has been initially formed and put into routine operations. By the end of 2020, more than 400 ADTD sensors have been deployed nationwide, further improving the nationwide lightning detection capability. Among them, ADTD sensors are networked with a 150 km baseline in central and eastern regions and with a 200 km baseline in western regions. Their specific distribution is shown in Figure 1. In 2021, a new type of sensors were added to the lightning location network, realizing the monitoring of some cloud-to-cloud lightning, and improving the ability to identify and monitor weak signals. To ensure the consistency of research data, more than 61.13 million data of return strokes located and recorded by ADTD from 2014 to 2020 are used for statistical analysis. For all the return strokes, the first stroke and the subsequent stroke are not distinguished, and each stroke data includes the occurrence time, latitude and longitude, current intensity, and other information of return strokes. Figure 1 shows the spatial distribution of return stroke data located and recorded by ADTD. It can be seen that lightning in China mostly occurs to the south of 32°N, especially in the coastal areas to the south of the middle and lower reaches. The lightning events is obviously less in the regions outside the lightning location network, i.e., over the oceans.
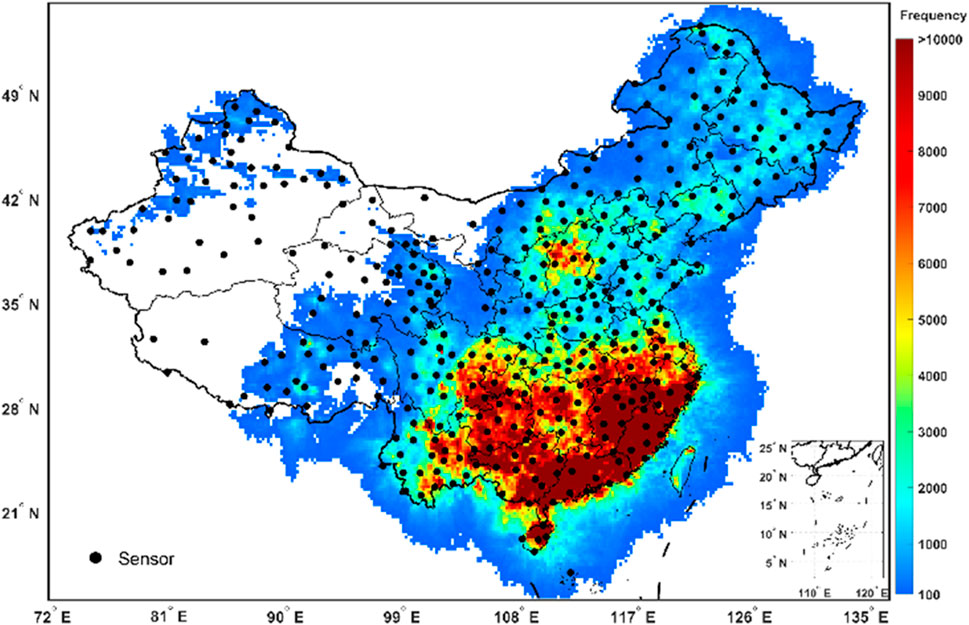
FIGURE 1. Spatial distribution of ADTD sensors and recorded data from 2014 to 2020.
The DE of each sensor can be affected by the hardware, working principle of the sensor, installation environment, terrain, and so on. For example, the waveform and amplitude received by the sensor can be influenced by the stimulated radiation of incident waves by ground objects, as well as the different propagation, scattering, and reflection of electromagnetic waves due to different ground conductivities. This will cause some lightning that originally met the waveform criteria and threshold requirements to become non-compliant, thereby reducing the actual DE of the sensor. In ADTD, the installation position of each sensor is different, making the terrain and environment different from each other. Therefore, the DE of each sensor is different. To reveal the DE of the whole lightning location network, the DE of each sensor is estimated first.
(Chen et al., 2013) proposed a statistical method to evaluate the DE of lightning location network on the basis of historical data. For a 3-sensor lightning location network, it is assumed that the DE of the ith sensor in a given region can be expressed as
Where N1,2,3 is the number of strokes reported by all the three sensors in that region simultaneously; N1,2 is the number of strokes reported by the 1 and 2 sensors in that region simultaneously; N1,3 is the number of strokes reported by the 1 and 3 sensors in that region simultaneously; N2,3 is the number of strokes reported by the 2 and 3 sensors in that region simultaneously. Therefore, the DE of each sensor in this region can be expressed as follows:
In the actual application process, a lightning location network is usually composed of many sensors (more than 3). In this study, the lightning location network is divided into several 3-sensor sub-networks, then many small cells are obtained for a lightning location network. The DE of each sensor in each cell can be obtained by repeating the above process for all the 3-sensor sub-networks in all cells over the entire coverage area of lightning location network. Therefore, for the layout of ADTD in China, the DE of a single sensor and the whole network can be calculated according to the following steps:
(1) The study area (15° N −55° N, 70° E −140° E) is divided into 200×350 cells, and each cell has a size of 0.2° (latitude)×0.2° (longitude) with an area of about 22 km × 22 km.
(2) The ADTD composed of 406 sensors is grouped into lots of 3-sensor sub-networks.
(3) According to the location information of the stroke data, more than 61.13 million data of strokes located and recorded by the ADTD during 2014–2020 are divided into different cells.
(4) For each sub-network and cell, the number of strokes reported simultaneously by all three sensors N1,2,3, by the 1 and 2 sensors N1,2, by the 1 and 3 sensors N1,3, and by the 2 and 3 sensors N2,3 are counted respectively.
(5) If N1,2,3 > 100, the DE of each sensor in the given cell in the given sub-network is calculated by Eq. 2. Otherwise, it is not calculated.
(6) Steps 4 and 5 are repeated for all sub-networks and cells.
(7) A given sensor can obtain several values of DE
(8) The DE profile of individual sensors can be obtained by repeating step 7 for all sensors.
(9) For a given cell, the DE
(10) The DE profile of the entire ADTD can be obtained by repeating step 9 for all cells.
In statistics, Gamma distribution is defined as a continuous probability distribution (Wilks, 1990; Zheng et al., 2007), and its probability density function is expressed as follows:
Where x is a random variable,
Where x is the distance between the location of lightning occurrence and the sensor, F is DE and
(1) Based on the statistical method of historical data in section 2.2.1, the DE of ADTD sensors at different distances are calculated, and a sequence (xi, yi)
(2) According to experience, the initial values of the parameters are set as follows:
(3) The residual sum of squares is calculated as follows:
Indicators such as goodness of fit (R2) and root mean square error (RMSE) are used to evaluate the effect of the fitting formula. The specific formula is shown in Eqs. 6, 7.
Where
To evaluate the location accuracy of ADTD for lightning location, we referred to the Monte Carlo simulation evaluation methods used by other lightning location networks (Gatta et al., 2012; Gatta et al., 2014; Gatta et al., 2016; Wang et al., 2016; Wang et al., 2020b; Ma et al., 2021) and selected a small-time error to simulate location accuracy of ADTD within its effective detection area. The simulation area (15° N −55° N, 70° E −140° E) is divided into a grid of 20 km × 20 km and obtained 70,000 grids. For the simulation of each grid, we assume that only sensors within 300 km can participate in lightning localization for that grid. On one hand, this is because the effective detection range of the sensor is 300 km, and the probability of detecting lightning beyond 300 km is very low. On the other hand, from the perspective of location error, the farther the signal is from the detection network, the larger the location error is. Due to the magnetic direction and time difference combined technology used by ADTD, at least two sensors are needed to locate a lightning stroke. Therefore, we followed these steps to evaluate the location accuracy:
(1) All sensors within a range of 300 km from the occurrence location of lightning are searched.
(2) The DE of all sensors (p) in step 1 at the location of lightning occurrence is calculated according to Eq. 5.
(3) In fact, each sensor cannot detect all cloud-ground strokes within their effective coverage, this means that the sensor will miss some strokes. Therefore, a random number rand that follows a uniform distribution of (0,1) is generated for each sensor. If rand≥1-p, the sensor has reported the stroke, otherwise, the sensor will miss this stroke.
(4) If the number of sensors that can report the stroke in step 3 is greater than 1, then proceed to step 5. Otherwise, proceed to step 9.
(5) We assumed that lightning occurred in the center of each grid, and the height of the lightning is uniformly set to 0 km. For the sensor that can report the stroke in step 3, we calculated the distance from the lightning to each site and the time that the signal travels to each site at the speed of light c.
(6) The time error caused by non-uniform media, terrain, and other factors during signal propagation must be considered. Therefore, similar to the work by Wang et al. (2016), the normal distribution random error with mean 0 and standard deviation 1μs is added to the arrival time calculated in step 5.
(7) The arrival time calculated in step 6 was brought into the ADTD location algorithm to solve the location where the lightning occurred.
(8) We compared the calculated position with the actual position to obtain the calculation error.
(9) We repeated the above steps 1,000 times to obtain the average location error of ADTD in each grid.
Owing to the limitation of the ADTD sensors, they can usually detect the lightning within a range of 300 km more accurately. Therefore, when sensors are grouped, each sensor only forms a 3-sensor sub-network with its surrounding sensors within 300 km. The 406-sensors in ADTD have formed a total of 16,541 sub-networks that could be used for statistics (hereinafter referred to as “effective sub-networks”), of which 32 sensors cannot form effective sub-networks, and they are mainly located in Xinjiang Uyghur Autonomous Region, Qinghai Province, Tibet Autonomous Region, Inner Mongolia Autonomous Region, and other regions. Because of the low frequency of lightning and sparse sensors in these regions, the number of strokes simultaneously reported by three sensors is less than 100, so that an effective sub-network could not be formed. The spatial distribution of the number of effective sub-networks of each sensor involved is shown in Figure 2. It can be seen from the figure that the number of effective sub-networks formed by sensors located in areas with low lightning frequency and at the edge of ADTD is small, and 24 sensors appeared in less than 3 effective sub-networks. There are more effective sub-networks in the central and eastern regions where the sensors are dense, and each sensor appeared in more than 50 effective sub-networks, among which the sensors in Jiujiang City, Jiangxi Province have the most effective sub-networks, appeared in 142 effective sub-networks.
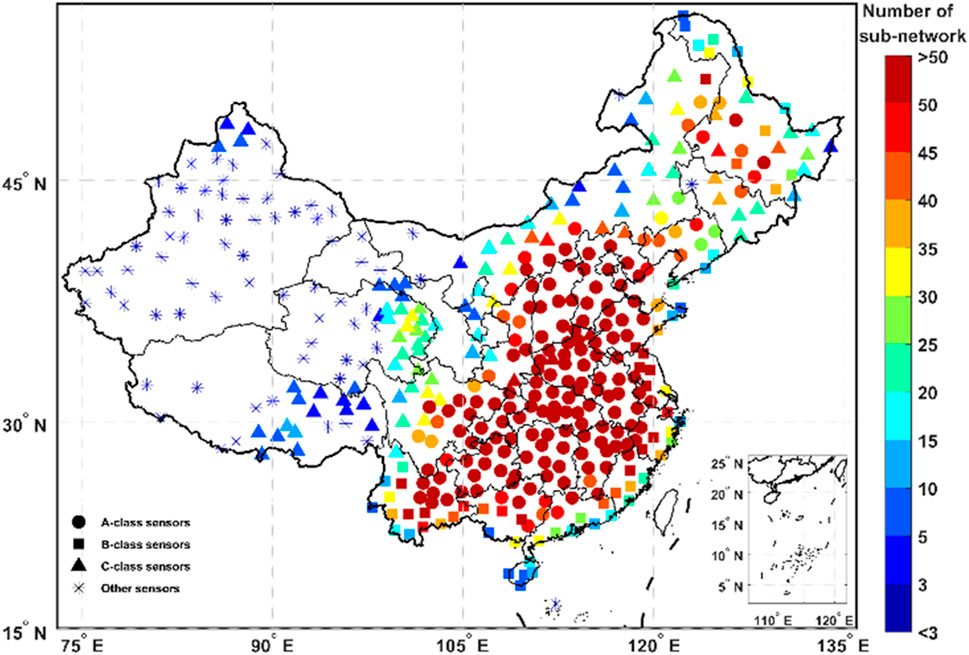
FIGURE 2. The spatial pattern of the class of each sensor and the number of effective sub-networks it involves.
Based on the statistical method of historical data in Section 2.2.1, the DE of 374 sensors forming effective sub-networks is evaluated. The analysis area of each sensor is 31 × 31 cells centered on the sensor, with an area of 680 km×680 km. Because a sensor belongs to many effective sub-networks, several DE values may be calculated in a given cell, and the average of these DE values is the DE of the sensor in the given cell. The SD of these DE values is used to show the consistency of these DE values. In the calculation process of DE, because of the limited lightning data, the sensors may not be able to calculate DE in some cells, or there is only one DE value without SD. In order to reduce the impact of errors, as the DE of a sensor in a given cell is calculated, it is required that the number of effective sub-networks formed by the sensor is 3 at least, otherwise, it will not be calculated.
Figure 3 shows the spatial distribution of DE and its SD for sensors No.0, No.94, and No.142. Sensor No.0 is located in Fuzhou City, Fujian Province, and there are eight sensors installed to the northwest of the sensor, while there is no sensor to the southeast of the sensor (the sea). The sensor is at the edge of ADTD and forms a total of 25 effective sub-networks. It can be clearly seen from the profile of DE in Figure 3A that the distribution of DE values is obviously different on the two sides of the coastline. On the northwest side formed by many sensors, DE has a semi-circular profile, and DE rises first and then reduces with the increase of the distance. On the southeast side, DE is distributed in patches, increasing first and then remaining unchanged with the increase of the distance. By comparing the two sides, it can be found that on the side composed of many sensors, namely, inside the lightning location network, the location of lightning is more accurate, while the location of lightning has a larger error outside the lightning location network. As can be seen from the distribution of SD in Figure 3B, the SD of DE values in most areas of the sensor is less than 20%, indicating that the DE calculated by this method has good consistency. Sensor No.94 is located in Jiujiang City, Jiangxi Province, and 21 sensors are evenly distributed around it, forming 142 effective detection sub-networks. DE has a circular profile centered on the sensor (Figure 3C). It rises firstly and then declines to 0 with the increase of the distance. The SD of DE values is all less than 20% (Figure 3D), showing that DE values have good consistency. Figure 3E also shows the DE values of sensor No.142 located in the ADTD. This sensor is located in Jiulong City, Sichuan Province, and there are only 10 sensors around it, forming a total of 36 effective sub-networks. Owing to the low frequency of lightning in this region, the number of lightning strokes detected in most cells is smaller than 100. Consequently, DE values can be calculated in only a part of the cells, and the overall DE profile of the sensor cannot be obtained. However, for the cells where DE can be calculated, SD is all less than 20% (Figure 3F), indicating that the calculation method of DE has a good consistency.
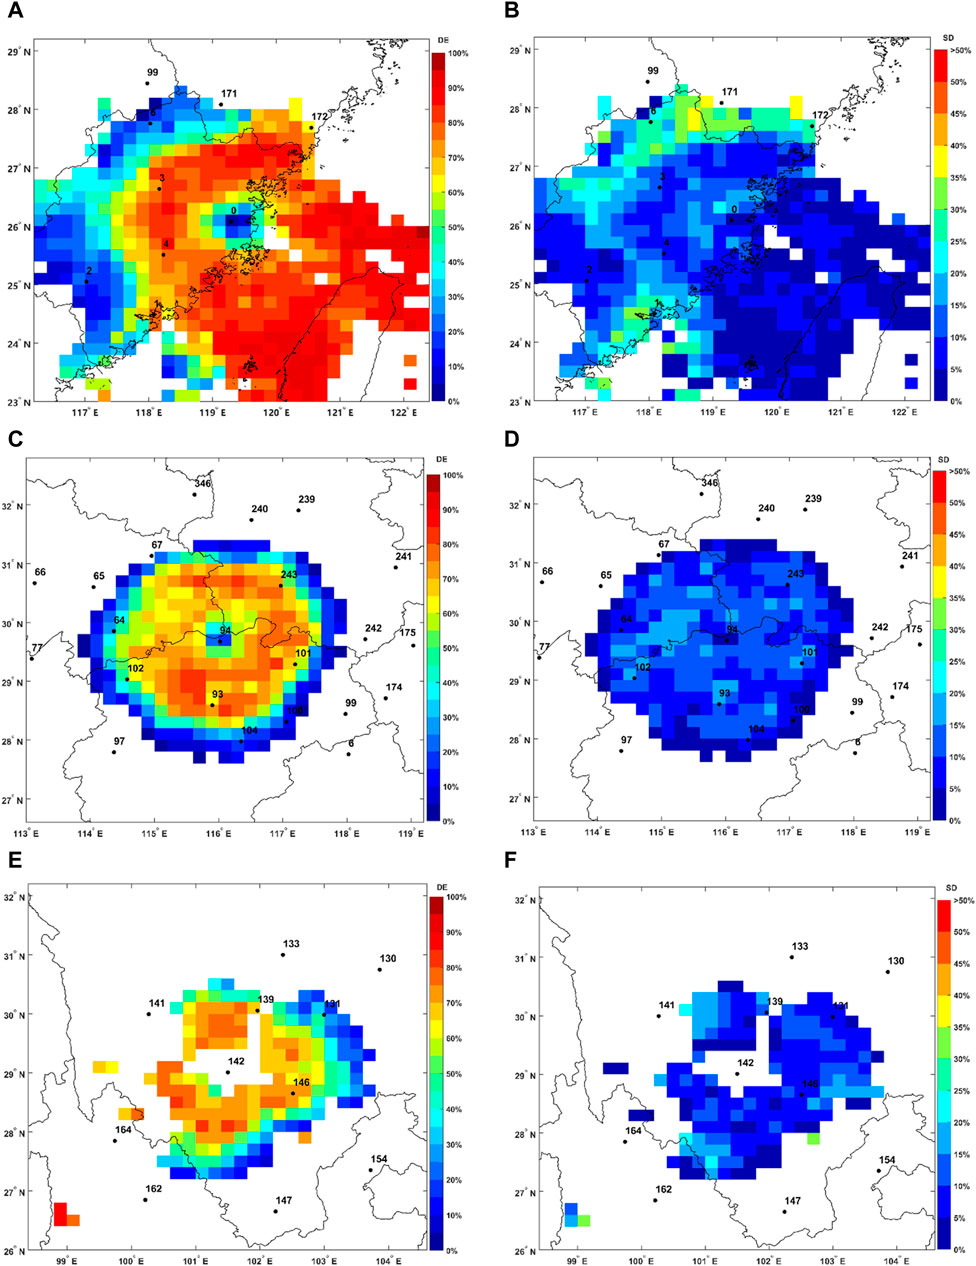
FIGURE 3. (A) The spatial distribution of DE for sensors No.0 (B) The spatial distribution of the SD of DE for sensors No.0; (C) The spatial distribution of DE for sensors No.94 (D) The spatial distribution of the SD of DE for sensors No.94; (E) The spatial distribution of DE for sensors No.142; (F) The spatial distribution of the SD of DE for sensors No.142.
From the analysis of the DE profiles of 374 sensors, it is found that the spatial distribution of sensors located in the interior of lightning location network and areas with high lightning frequency is similar to that of sensor No.94, namely, having a circular profile centered on the sensors with DE values first increasing and then decreasing with the increase of the distance. The number of such sensors is 169, and they are recorded as class A sensors. The sensors along the coast or at the border of lightning location network have a similar spatial distribution to sensor No.0. The profile of DE calculated by this type of sensor on the side where other lightning sensors are installed is close to the actual situation, while it is quite different from the actual situation on the other side. There are 68 such sensors, which are recorded as class B sensors. The spatial distribution of sensors located in the interior of lightning location network and areas with low lightning frequency is similar to that of sensor No.142. Because of the limited historical data of strokes, the cells with DE values are not enough to describe the distribution of DE of this type of sensor. There are 99 sensors, which are classified as class C sensors. In addition, 38 sensors are unable to calculate DE because the number of effective sub-networks formed in any 1 cell is smaller than 3. The spatial distribution of all types of sensors and the relationship with the number of effective sub-networks is shown in Figures 2, 4. As can be seen from Figure 4, the number of sub-networks formed by the three types of sensors is also different. The number of effective sub-networks formed by class A sensors is large, and more than 75% of the sensors form at least 50 effective sub-networks. Class B sensors form 10–50 effective sub-networks, and the number of effective sub-networks formed by nearly 50% of the sensors is smaller than 30. Due to the lack of stroke data, the number of effective sub-networks formed by class C sensors is the smallest, and more than 78% of the sensors form less than 30 effective sub-networks.
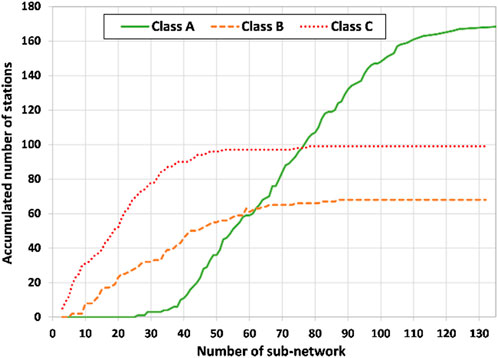
FIGURE 4. The number of accumulated stations in terms of effective sub-networks for Class A, Class B and Class C.
According to the DE values of class A sensors, the average DE of each cell in 31 × 31 cells centered on the sensors is calculated. To eliminate the influence of abnormal values on each cell and ensure that the DE value of each cell is closer to the actual value, it is required that DE can be calculated by at least 20 class A sensors in each cell when the average DE of each cell is calculated, otherwise, the average DE in the cell is not calculated. Figure 5A shows the average DE of class A sensors in each cell and its distribution with the distance. It can be seen that DE is relatively low at the cell (0,0), only about 20%. As the distance from the cell to the sensors increases, DE rises rapidly, and the maximum exceeds 70%. Afterwards, it begins to decline slowly. Taking the sensors as the starting point and 20 km as the step, the average DE at different distances within the detection range of the sensors is calculated. As shown in Figure 5B, DE is only 50.0% at a distance of 20 km from the sensors. With the increase of the detection distance, DE reaches a maximum of 73.8% at a distance of about 80 km. It gradually decreases at a distance of more than 80 km and is less than 30.0% at a distance of about 200 km. In fact, each sensor has a minimum and a maximum amplitude threshold, a stroke with amplitude at the sensor beyond the sensor’s dynamic range is ignored. On the other hand, the stroke amplitude at a sensor is a function of both the distance of the stroke to the sensor and the inherent strength of the stroke. Consequently, a sensor tends to ignore more strong strokes at closer distances and more weak strokes at large distances, so the DE of the sensors is low both near and far from them but high at a relatively appropriate distance. In general, the DE of the ADTD sensor has a circular profile centered on the sensors, increasing first and then decreasing with the increase of the distance.
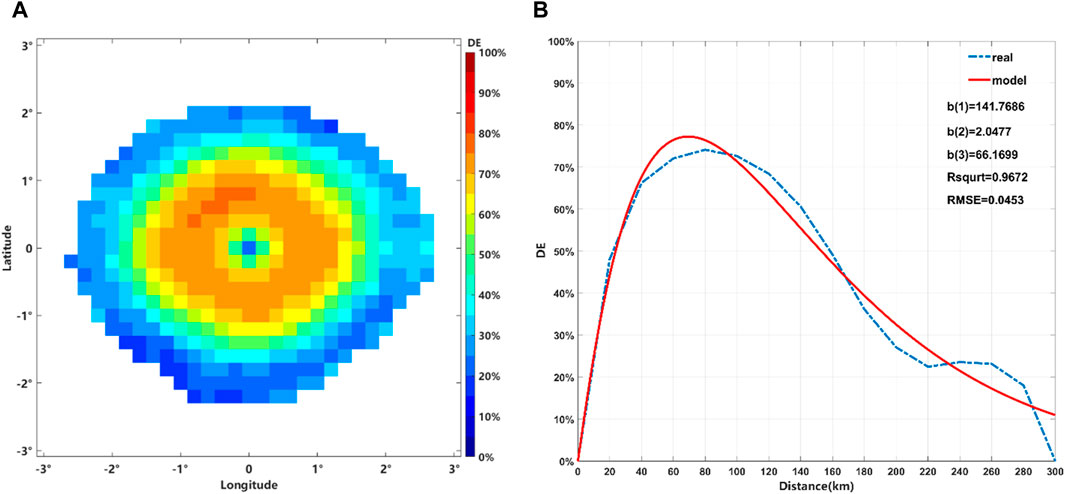
FIGURE 5. (A) Average DE profile of class A sensors; (B) Average DE versus distance for class A sensors.
In order to better investigate the relationship between DE and detection distance, the probability density function of Gamma distribution is used for the nonlinear curve fitting of the relationship between DE and distance, and the fitting formula is obtained as follows:
Where x is the distance between the location of lightning occurrence and the sensor. Through evaluation, it is found that the R2 of the fitting formula is 0.9672, and the goodness of fit is close to 1. RMSE is 0.0453, and the RMSE is also small. It shows that the fitting effect of Eq. 8 is very good, and it can well explain the relationship between DE and detection distance. Equation 8 can be used to calculate the DE of ADTD sensors at different detection distances.
The ADTD in China consists of 406 sensors and records over 61.13 million strokes from 2014 to 2020. During this study period, the spatial distribution of DE for 374 sensors is analyzed in statistics. However, due to insufficient historical data accumulation, there are still 32 sensors that cannot calculate the spatial distribution of DE. Based on the evaluation results of DE for 374 sensors, the total DE of ADTD in the whole country is calculated by using Eq. 3. Figure 6 shows the spatial distribution of DE of ADTD. The blank cells in the figure indicate that there is no DE value calculated by two or more sensors in the cells. The frequency of lightning is low, or sensors are sparse in these regions, and the number of lightning strokes detected does not reach the set statistical threshold, therefore in the present work, it is impossible to calculate the DE of sensors in these regions. As can be seen from the figure, the Qinghai-Tibet Plateau and Northwest China are basically blank regions, where the DE of ADTD cannot be calculated. The DE of ADTD in the southern and northern regions is mostly above 90%. It is over 95% in the areas with dense ADTD sensors and is slightly lower in the areas with sparse sensors. In addition, the DE of ADTD is relatively low for the edge areas and the areas near each sensor. Certainly, if the ADTD continues to steadily run for a long time and accumulates a large number of lightning location data, the DE estimated will be more accurate.

FIGURE 6. Distribution of DE of ADTD based on lightning location data statistics from 2014 to 2020.
The DE of a single sensor and ADTD can be obtained by the statistical method, but this method requires sufficient historical data of strokes to ensure statistical accuracy. The DE in the areas with low lightning frequency or a few historical records of strokes cannot be calculated. To obtain the nationwide DE of ADTD, based on the formula of DE and distance fitted by the probability density function of Gamma distribution, the DE of each sensor at different distances is calculated, and then the nationwide DE of ADTD is calculated by Eq. 3. Figure 7 shows the distribution of DE in China based on the fitting formula. It can be seen from the figure that the DE of ADTD in various regions is related to the density of sensors. The denser the sensors are, the higher the DE is. The DE in most regions of China is above 90%. In the center and east of China, the center of Heilongjiang Province, the east of Qinghai Province, and the center and east of Yunnan Province, DE can reach 95% due to dense sensors. The Qinghai-Tibet Plateau and Gansu Province are sparsely deployed with sensors, so DE is low, and lightning cannot be effectively detected in some areas. At the edge of lightning location network, DE decreases significantly with the increase of the distance. Besides, it should also be noted that DE is also low near the sensors. In summary, this distribution is reasonable and understandable. From the comparison between Figures 6, 7, it is found that the DE calculated by the fitting formula is close to the historical data in the area with statistical results, and the distribution of the two is consistent, indicating that the DE calculated by the fitting formula can better reflect the DE of ADTD in China.
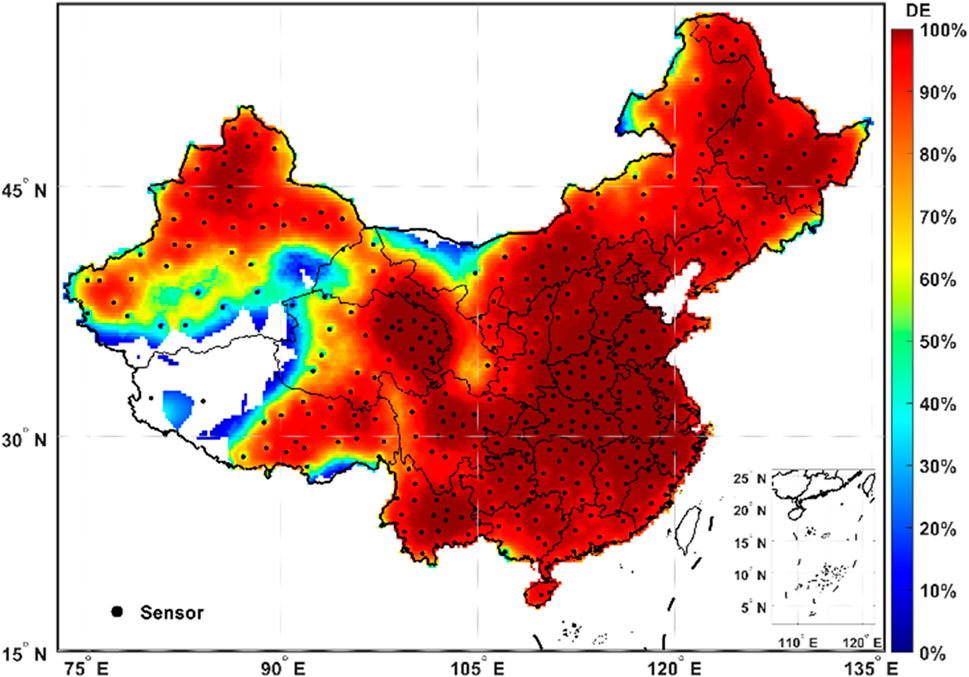
FIGURE 7. Distribution of DE of ADTD based on the fitting formula.
ADTD adopts the combined magnetic direction and time difference method for lightning location. The simulation method in Section 2.2.3 is used to evaluate the lightning location accuracy of ADTD in the whole country. The spatial distribution of location errors of ADTD in China can be seen in Figure 8. The location errors of ADTD are related to the density of sensors. In the central and eastern regions networking with a 150 km baseline, there are significantly more cells with lightning location errors less than 1,000 m, and the location errors of some cells are even less than 500 m. The minimum location error is only 31 m. In the western region networking with a 200 km baseline, there are more cells with lightning location errors greater than 1,000 m, especially in Gansu province and Ningxia province. On the whole, the cells with lightning location errors less than 2000 m account for 66.3% of the whole region. Besides, it is also found that the location error near a sensor is obviously large. The DE of lightning near the sensor is low, and the sensor often cannot locate lightning because it cannot report the occurrence of nearby lightning. As a result, the lightning location network formed by other sensors participating in the location of nearby lightning events has a large location error. In general, ADTD can accurately locate cloud-to-ground lightning events in most areas of China, while the location errors are large in some areas because of sparse sensors and instrument parameter settings.
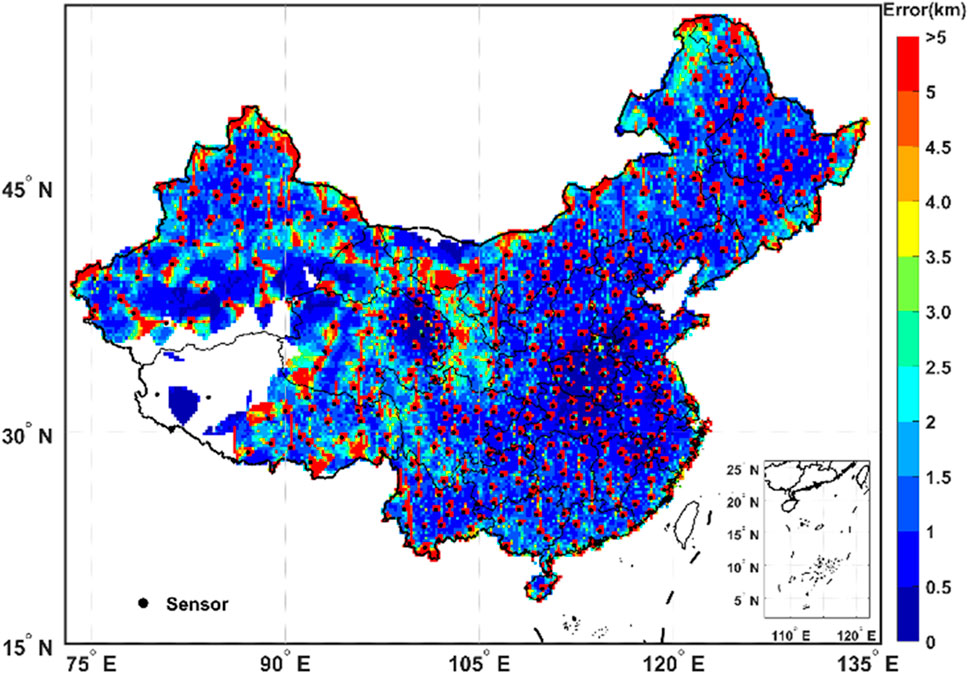
FIGURE 8. Distribution of the average location errors of ADTD.
In this paper, the statistical method of DE of ADTD, which was proposed by (Chen et al., 2013), is used to evaluate and analyze the cloud-ground lightning data recorded by ADTD nationwide from 2014 to 2020, and the DE profiles of 374 sensors are obtained, while the DE of 32 sensors cannot be calculated due to sparse surrounding sensors and insufficient historical data of strokes. Among the 374 sensors with DE profiles, the DE of 169 sensors has a circular profile centered on the sensors, and DE values increase firstly and then decrease from inside to outside. All these sensors are located in the center of the detection network, and there are more 3-sensor sub-networks. Moreover, a large amount of historical stroke data has been accumulated, so the evaluation of their lightning DE is closer to the actual situation. Hence, when the DE of a single sensor is evaluated, a small detection network should be formed with this sensor as the center. Moreover, many sensors should be evenly distributed around it, and no less than 50 effective detection sub-networks should be formed (that is, at least eight sensors should be evenly distributed around it). Furthermore, a large number of stroke data is needed. Generally speaking, the method proposed by (Chen et al., 2013) can be used to well estimate the DE of a single sensor in different cells, but this method requires sufficient historical data of strokes to ensure statistical accuracy. In regions with low lightning occurrence frequency or few historical stroke records, DE cannot be calculated.
The DE of ADTD in the whole country is calculated by using the DE and detection distance formula fitted based on the probability density function of the Gamma distribution (Figure 7). The method has no consideration of the effects of terrain, installation environment, and instrument parameters on the detection performance of sensors, and avoids separate modeling for each effect. Meanwhile, it makes up for the shortcoming of the statistical method proposed by (Chen et al., 2013) (that is, it could not calculate the DE of China’s ADTD in the Qinghai-Tibet and Northwest China due to the lack of historical data of strokes). It is worth noting that the distribution of DE in Figure 7 only represents the DE of ADTD against the current intensity that it can detect, because ADTD works in the VLF/LF band and has a poor ability to detect weak current (Wang et al., 2020a). Figure 9 shows the distribution of the peak current intensity of cloud-ground lightning strokes recorded by ADTD from 2014 to 2020. The peak current intensity is mostly concentrated in the range of 15–45 kA, and has the highest frequency near 25 kA, while there are significantly fewer cloud-ground lightning strokes with the peak current intensity below 10 kA. Srivastava et al. (2017) found that the relative detection efficiency of ADTD and BLNET in Beijing City was 49.4%, indicating that ADTD missed some cloud-ground lightning with weak current. In the later stage, the proportion of missing strokes by ADTD in the total cloud-ground lightning can be determined through observation tests and other methods, and a correction coefficient is obtained to correct the DE presented in Figure 7. For example, the rocket-triggered lightning experiment conducted over China can provide us with valuable and accurate information on lightning intensities and locations (Qie et al., 2007; Qie et al., 2011; Jiang et al., 2013; Zhang et al., 2014; Jiang et al., 2020). With more experimental data collected during these experiments, a solid calibration for ADTD can be conducted in the near future to make the DE of ADTD closer to the real DE, as well as correct cloud-to-ground lightning density. Furthermore, we know that the DE of a sensor is a function of both the stroke position to the sensor and the stroke’s inherent strength, if the ADTD continues to steadily run for a long time and accumulates a large number of lightning location data, a deeper analysis considering the strength of lightning and distances will be conducted in the future.
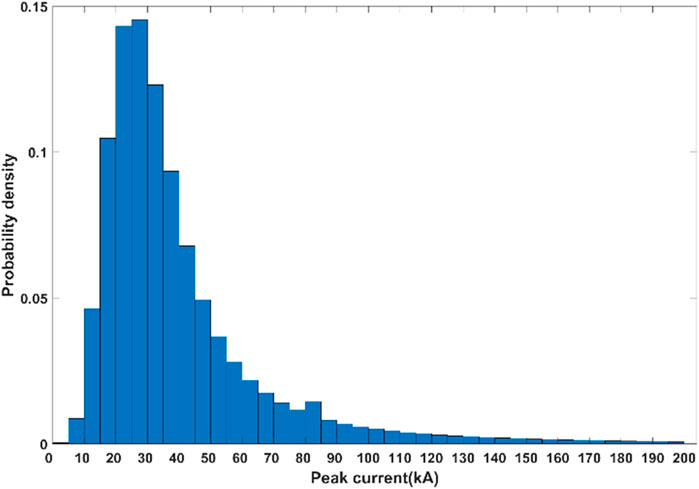
FIGURE 9. Distribution of peak current of cloud-ground lightning strokes recorded by ADTD during 2014–2020.
In this paper, the Monte Carlo error simulation method is used to quantitatively analyze the location accuracy of ADTD across the country, and the obtained distribution of location errors is only a conservative estimation result of location accuracy. The reason is that the effects of terrain and propagation speed on the location accuracy are not considered in the simulation experiment (Zhang et al., 2022), and the actual location error of ADTD should be slightly higher than the experimental result. In order to further improve the location accuracy of ADTD, especially in areas with high lightning incidence, the location accuracy can be improved by adding sensors, optimizing the location algorithm, and correcting the propagation effect.
The statistical analysis of recording data of ADTD from 2014 to 2020 is conducted firstly, and then the DE and detection distance model of a single sensor is constructed based on the probability density function of Gamma distribution. Finally, the DE and location accuracy of ADTD in the whole country are evaluated and analyzed. Some of the major conclusions are drawn as follows:
(1) The DE of ADTD sensors has a circular profile centered on the sensors, and DE values increase firstly and then decline with the increase of the distance. DE is only 50.0% at a distance of 20 km and increases to a maximum of 73.8% at a distance of about 80 km. And then it decreases gradually at a distance of more than 80 km, reaching only 20.0% near 200 km.
(2) After the fitting formula of DE and distance is evaluated, it is found that the goodness of fit is 0.9889, and the root-mean-square error is 0.0453, indicating that the model obtained based on the probability density function of Gamma distribution can explain the relationship between DE and distance well.
(3) The DE of ADTD in most regions of China is above 90%, reaching 95% in central and eastern China, central Heilongjiang Province, eastern Qinghai Province, and central and eastern Yunnan Province, while it is low in the Qinghai-Tibet Plateau and Gansu Province because of sparse sensors.
(4) The location error of ADTD shows dependence on the density of the sensors. In central and eastern China, the location error is small, less than 500 m in some areas, with a minimum of 31 m. In western China, the location error is larger due to sparse sensors. In general, the ADTD can accurately locate cloud-to-ground lightning events in most areas of China, but the location error is large in some areas due to sparse sensors, instrument parameter setting, and other problems.
The raw data supporting the conclusion of this article will be made available by the authors, without undue reservation.
HZ: Conceptualization, Writing–review and editing, Formal Analysis, Investigation, Writing–original draft. WP: Conceptualization, Formal Analysis, Investigation, Writing–review and editing. FC: Conceptualization, Writing–review and editing. MZ: Methodology, Software, Writing–review and editing. JW: Methodology, Software, Writing–review and editing. ZW: Software, Validation, Writing–review and editing.
The author(s) declare that financial support was received for the research, authorship, and/or publication of this article. This research was funded by the Innovation and Development Special Project of the Anhui Meteorological Bureau (Grant No. CXM202103), the General project of Jiangsu Meteorological Bureau (Grant No. KM202407), the Open Grants of the Key Laboratory of Mesoscale Severe Weather/MOE of Severe Weather (LMSWE-202302), the National Natural Science Foundation of China (Grant No. 41805023) and Anhui Meteorological Bureau Innovation Team Construction Plan.
The authors thank all personnel and meteorological departments involved in the construction of the ADTD site, lightning data collection, and processing. The authors would also like to thank the reviewers for their helpful feedback, which significantly improved the manuscript.
The authors declare that the research was conducted in the absence of any commercial or financial relationships that could be construed as a potential conflict of interest.
All claims expressed in this article are solely those of the authors and do not necessarily represent those of their affiliated organizations, or those of the publisher, the editors and the reviewers. Any product that may be evaluated in this article, or claim that may be made by its manufacturer, is not guaranteed or endorsed by the publisher.
Bennett, A. J., Gaffard, C., Nash, J., Callaghan, G., and Atkinson, N. C. (2011). The effect of modal interference on VLF long-range lightning location networks using the waveform correlation Technique. J. Atmos. Ocean. Technol. 28, 993–1006. doi:10.1175/2011JTECHA1527.1
Biagi, C. J., Cummins, K. L., Kehoe, K. E., and Krider, E. P. (2007). National lightning detection network (NLDN) performance in southern Arizona, Texas, and Oklahoma in 2003–2004. J. Geophys. Res. Atmos. 112, D05208. doi:10.1029/2006JD007341
Chen, L., Zhang, Y., Lu, W., Zheng, D., Zhang, Y., Chen, S., et al. (2012). Performance evaluation for a lightning location system based on observations of artificially triggered lightning and natural lightning flashes. J. Atmos. Ocean. Tech. 29, 1835–1844. doi:10.1175/JTECH-D-12-00028.1
Chen, M., Dong, Z., Du, Y., and Zhang, Y. (2013). A statistical method for evaluating detection efficiency of lightning location network and its application. Atmos. Res. 128, 13–23. doi:10.1016/j.atmosres.2013.02.012
Chen, Z., Zhang, Y., Zheng, D., Zhang, Y., Ly, W., Fan, Y., et al. (2019). A method of three-dimensional location for LFEDA combining the time of arrival method and the time reversal technique. J. Geophys. Res. Atmos. 124, 6484–6500. doi:10.1029/2019JD030401
Cummins, K. L., and Murphy, M. J. (2009). An overview of lightning locating systems: history, techniques, and data uses, with an in-depth look at the US NLDN. IEEE Trans. Electromagn. Compat. 51, 499–518. doi:10.1109/TEMC.2009.2023450
Dementyeva, S., Shatalina, M., Popykina, A., Sarafanov, F., Kulikov, M., and Mareev, E. (2023). Trends and features of thunderstorms and lightning activity in the Upper Volga Region. Atmosphere 14, 674. doi:10.3390/atmos14040674
Fan, P., Zheng, D., Zhang, Y., Gu, S., Zhang, W., Yao, W., et al. (2018). A performance evaluation of the world wide lightning location network (WWLLN) over the Tibetan Plateau. J. Atmos. Ocean. Technol. 35, 927–939. doi:10.1175/JTECH-D-17-0144.1
Gatta, F. M., Geri, A., Lauria, S., and Maccioni, M. (2016). Monte Carlo evaluation of the impact of subsequent strokes on backflashover Rate. Energies 9, 139. doi:10.3390/en9030139
Gatta, F. M., Geri, A., Lauria, S., Maccioni, M., and Santarpia, A. (2012). “An ATP-EMTP Monte Carlo procedure for backflashover rate evaluation,” in Proceedings of the 2012 International Conference on Lightning Protection (ICLP), Vienna, Austria, September 2012, 2–7 (IEEE).
Gatta, F. M., Geri, A., Lauria, S., Maccioni, M., and Santarpia, A. (2014). An ATP-EMTP Monte Carlo procedure for backflashover rate evaluation: a comparison with the CIGRE method. Electr. Power Syst. Res. 113, 134–140. doi:10.1016/j.epsr.2014.02.031
Hegde, V., and Kumar, U. (2009). Studies on characteristics of lightning generated currents in an interconnected lightning protection system. J. Electrost. 67, 590–596. doi:10.1016/j.elstat.2008.12.005
Hettiarachchi, P., Cooray, V., Diendorfer, G., Pichler, H., Dwyer, J., and Rahman, M. (2018). X-Ray observations at gaisberg tower. Atmosphere 9, 20. doi:10.3390/atmos9010020
Iwasaki, H. (2016). Relating lightning features and topography over the Tibetan Plateau using the world wide lightning location network data. J. Meteorol. Soc. Jpn. Ser. Ii. 94, 431–442. doi:10.2151/jmsj.2016-025
Jerauld, J., Rakov, V. A., Uman, M. A., Rambo, K. J., Jordan, D. M., Cummins, K. L., et al. (2005). An evaluation of the performance characteristics of the U.S. national lightning detection network in Florida using rocket-triggered lightning. J. Geophys. Res. Atmos. 110, D19106. doi:10.1029/2005JD005924
Jiang, R., Qie, X., Li, Z., Zhang, H., Li, X., Yuan, S., et al. (2020). Luminous crown residual vs bright space segment: characteristical structures for the intermittent positive and negative leaders of triggered lightning. Geophys. Res. Lett. 47, e2020GL088107. doi:10.1029/2020GL088107
Jiang, R., Qie, X., Wang, C., and Yang, J. (2013). Propagating features of upward positive leaders in the initial stage of rocket-triggered lightning. Atmos. Res. 129, 90–96. doi:10.1016/j.atmosres.2012.09.005
Li, J., Dai, B., Zhou, J., Zhang, J., Zhang, Q., Yang, J., et al. (2022). Preliminary application of long-range lightning location network with equivalent propagation velocity in China. Remote Sens. 14, 560. doi:10.3390/rs14030560
Ma, Z., Jiang, R., Qie, X., Xing, H., Liu, M., Sun, Z., et al. (2021). A low frequency 3D lightning mapping network in north China. Atmos. Res. 249, 105314. doi:10.1016/j.atmosres.2020.105314
Mallick, S., Rakov, V. A., Hill, J. D., Ngin, T., Gamerota, W. R., Pilkey, J. T., et al. (2014). Performance characteristics of the NLDN for return strokes and pulses superimposed on steady currents, based on rocket-triggered lightning data acquired in Florida in 2004–2012. J. Geophys. Res. Atmos. 119, 3825–3856. doi:10.1002/2013JD021401
Naccarato, K. P., and Pinto, J. O. (2009). Improvements in the detection efficiency model for the Brazilian lightning detection network (BrasilDAT). Atmos. Res. 91, 546–563. doi:10.1016/j.atmosres.2008.06.019
Nag, A., Mallick, S., Rakov, V. A., Howard, J. S., Biagi, C. J., Hill, J. D., et al. (2011). Evaluation of U.S. National Lightning Detection Network performance characteristics using rocket-triggered lightning data acquired in 2004–2009. J. Geophys. Res. Atmos. 116, D02123. doi:10.1029/2010jd014929
Nag, A., Murphy, M. J., Schulz, W., and Cummins, K. L. (2015). Lightning locating systems: insights on characteristics and validation techniques. Earth Space Sci. 2, 65–93. doi:10.1002/2014EA000051
Qie, X., Jiang, R., Wang, C., Yang, J., Wang, J., and Liu, D. (2011). Simultaneously measured current, luminosity, and electric field pulses in a rocket-triggered lightning flash. J. Geophys. Res. Atmos. 116 (D10), D10102. doi:10.1029/2010JD015331
Qie, X., Zhang, Q., Zhou, Y., Feng, G., Zhang, T., Yang, J., et al. (2007). Artificially triggered lightning and its characteristic discharge parameters in two severe thunderstorms. Sci. China Ser. D-Earth Sci. 50 (8), 1241–1250. doi:10.1007/s11430-007-0064-2
Qie, X., Zhao, Y., Zhang, Q., Yang, J., Feng, G., Kong, X., et al. (2009). Characteristics of triggered lightning during Shandong artificial triggering lightning experiment (SHATLE). Atmos. Res. 91 (2-4), 310–315. doi:10.1016/j.atmosres.2008.08.007
Rison, W., Thomas, R., Krehbiel, P. R., Hamlin, T., and Harlinet, J. (1999). A GPS-based three-dimensional lightning mapping system: initial observations in central New Mexico. Geophys. Res. Lett. 26 (23), 3573–3576. doi:10.1029/1999GL010856
Rodger, C., Werner, S., Brundell, J., Lay, E., Thomson, N. R., Holzworth, R. H., et al. (2006). Detection efficiency of the VLF world-wide lightning location network (WWLLN): initial case study. Ann. Geophys 24, 3197–3214. doi:10.5194/angeo-24-3197-2006
Rodger, C. J., Brundell, J. B., Holzworth, R. H., Lay, E. H., Crosby, N. B., Huang, T. Y., et al. (2009). Growing detection efficiency of the world wide lightning location network. AIP Conf. Proc. 1118, 15–20. doi:10.1063/1.3137706
Said, R., and Murphy, M. (2016). “GLD360 upgrade: performance analysis and applications,” in Proceedings of the 24th International Lightning Detection Conference & International Lightning Meteorology Conference, San Diego, CA, USA, April 2016, 18–21 (IEEE).
Shi, D., Zheng, D., Zhang, Y., Zhang, Y., Huang, Z., Lu, W., et al. (2017). Low-frequency E-field detection array (LFEDA)—construction and preliminary results. Sci. China Earth Sci. 60, 1896–1908. doi:10.1007/s11430-016-9093-9
Srivastava, A., Tian, Y., Qie, X., Wang, D., Sun, Z., Yuan, S., et al. (2017). Performance assessment of Beijing Lightning Network (BLNET) and comparison with other lightning location networks across Beijing. Atmos. Res. 197, 76–83. doi:10.1016/j.atmosres.2017.06.026
Sun, Z., Qie, X., Liu, M., Cao, D., and Wang, D. (2013). Lightning VHF radiation location system based on short-baseline TDOA technique- Validation in rocket-triggered lightning. Atmos. Res. 129, 58–66. doi:10.1016/j.atmosres.2012.11.010
Sun, Z., Qie, X., Liu, M., Jiang, R., and Zhang, H. (2022). Three-dimensional mapping on lightning discharge processes using two VHF broadband interferometers. Remote Sens. 14, 6378. doi:10.3390/rs14246378
Suzuki, Y., Araki, S., Baba, Y., Tsuboi, T., Okabe, S., and Rakov, V. A. (2016). An FDTD study of errors in magnetic direction finding of lightning due to the presence of conducting structure near the field measuring station. Atmosphere 7, 92. doi:10.3390/atmos7070092
Van Mai, K., Laurila, T. K., Hoang, L. P., Duc Du, T., Mäkelä, A., and Kiesiläinen, S. (2022). Thunderstorm activity and extremes in Vietnam for the period 2015–2019. Climate 10, 141. doi:10.3390/cli10100141
Wang, J., Huang, Q., Ma, Q., Chang, S., He, J., Wang, H., et al. (2020a). Classification of VLF/LF lightning signals using sensors and deep learning methods. Sensors 20, 1030. doi:10.3390/s20041030
Wang, J., Ma, Q., Zhou, X., Xiao, F., Yuan, S., Chang, S., et al. (2020b). Asia-Pacific lightning location network (APLLN) and preliminary performance assessment. Remote Sens. 12, 1537. doi:10.3390/rs12101537
Wang, Y., Qie, X., Wang, D., Liu, M., Su, D., Wang, Z., et al. (2016). Beijing lightning network (BLNET) and the observation on preliminary breakdown processes. Atmos. Res. 171, 121–132. doi:10.1016/j.atmosres.2015.12.012
Wang, Z., Pang, W., Liang, L., Xu, C., and Lei, Y. (2018). Self-evaluation on detection efficiency of ADTD lightning location network in Beijing. Meteor. Sci. Technol. 46, 638–643. doi:10.19517/j.1671-6345.20170406
Warner, T. A., Cummins, K. L., and Orville, R. E. (2012). Upward lightning observations from towers in Rapid City, South Dakota and comparison with national lightning detection network data, 2004-2010. J. Geophys. Res. Atmos. 117, D19109. doi:10.1029/2012JD018346
Wilks, D. S. (1990). Maximum likelihood estimation for the Gamma distribution using data containing zeros. J. Clim. 3 (12), 1495–1501. doi:10.1175/1520-0442(1990)003<1495:mleftg>2.0.co;2
Yair, Y. (2018). Lightning hazards to human societies in a changing climate. Env. Res. Lett. 13, 123002. doi:10.1088/17489326/aaea86
Zhang, G., Wang, Y., Qie, X., Zhang, T., Zhao, Y., Li, Y., et al. (2010). Using lightning locating system based on time-of-arrival technique to study three-dimensional lightning discharge processes. Sci. China Earth Sci. 53 (4), 591–602. doi:10.1007/s11430-009-0116-x
Zhang, G., Zhao, Y., Qie, X., Zhang, T., Wang, Y., and Chen, C. (2008). Observation and study on the whole process of cloud-to-ground lightning using narrowband radio interferometer. Sci. China SerD-Earth Sci. 51 (5), 694–708. doi:10.1007/s11430-008-0049-9
Zhang, J., Zhou, J., Li, J., Gu, J., Zhang, Q., Dai, B., et al. (2022). Location accuracy improvement of long-range lightning detection network in China by compensating ground wave propagation delay. Remote Sens. 14, 3397. doi:10.3390/rs14143397
Zhang, W., Zhang, Y., Zheng, D., Xu, L., and Lyu, W. (2018). Lightning climatology over the northwest Pacific region: an 11-year study using data from the world wide lightning location network. Atmos. Res. 210, 41–57. doi:10.1016/j.atmosres.2018.04.013
Zhang, Y., Yang, S., Lu, W., Zheng, D., Dong, W., Li, B., et al. (2014). Experiments of artificially triggered lightning and its application in Conghua, Guangdong, China. Atmos. Res. 135, 330–343. doi:10.1016/j.atmosres.2013.02.010
Zheng, M., Wang, J., and Chen, Z. (2007). Mathematical statistics handout. Shanghai, China: Fudan University Press, 26–27.
Zhu, Y., Lyu, W., Cramer, J., Rakov, V., Bitzer, P., and Ding, Z. (2020). Analysis of location errors of the U.S. national lightning detection network using lightning strikes to towers. J. Geophys. Res. Atmos. 125, JD2530. doi:10.1029/2020JD032530
Keywords: advanced direction time lightning detection system, return stroke, probability density function of gamma distribution, detection efficiency, location accuracy
Citation: Zhu H, Pang W, Chen F, Zhang M, Wang J and Wang Z (2024) Detection performance analysis of advanced direction time lightning detection system in China. Front. Earth Sci. 12:1322908. doi: 10.3389/feart.2024.1322908
Received: 20 October 2023; Accepted: 19 February 2024;
Published: 06 March 2024.
Edited by:
Rubin Jiang, Chinese Academy of Sciences (CAS), ChinaReviewed by:
Abhay Srivastava, North Eastern Space Application Centre, IndiaCopyright © 2024 Zhu, Pang, Chen, Zhang, Wang and Wang. This is an open-access article distributed under the terms of the Creative Commons Attribution License (CC BY). The use, distribution or reproduction in other forums is permitted, provided the original author(s) and the copyright owner(s) are credited and that the original publication in this journal is cited, in accordance with accepted academic practice. No use, distribution or reproduction is permitted which does not comply with these terms.
*Correspondence: Fengjiao Chen, Y2ZqQG1haWwudXN0Yy5lZHUuY24=
†These authors have contributed equally to this work and share first authorship
Disclaimer: All claims expressed in this article are solely those of the authors and do not necessarily represent those of their affiliated organizations, or those of the publisher, the editors and the reviewers. Any product that may be evaluated in this article or claim that may be made by its manufacturer is not guaranteed or endorsed by the publisher.
Research integrity at Frontiers
Learn more about the work of our research integrity team to safeguard the quality of each article we publish.