 Ying Jiang
 Zhongyu Chen
 Yuhong Wang1,2
- 1CMA Public Meteorological Service Centre, Beijing, China
- 2National Early Warning Centre, Beijing, China
Global climate change has intensified the water cycle, leading to frequent extreme precipitation events, posing a significant threat to railway infrastructure and safety operations. Based on the analysis of past and future precipitation changes in China, this study investigates the impact of climate change on railway safety operations. The study reveals the following findings: (1) Under the influence of the intensified East Asian summer monsoon and the northward shift of the subtropical high during the 2017–2021 compared to the 2012–2016, precipitation has significantly decreased (120 mm) in the regions south of the Yangtze River and South China, while it has increased (60 mm) in the regions from the eastern of Northwest China to the middle and lower reaches of Yangtze River; The operational precipitation risk has decreased for Urumqi, Lanzhou, Qinghai-Tibet Group, Xi’an, and Wuhan railway bureaus (abbreviated as Bureau), while it has increased for Nanchang, Chengdu, Zhengzhou, Shanghai, and Shenyang Bureaus. Particularly noteworthy is that despite a decrease in total annual precipitation for Nanchang bureau (15.3 mm/a), the frequency of intense precipitation events has increased, leading to an increased operational precipitation risk. (2) During the 21st century, under high (SSP5-8.5), medium (SSP2-4.5), and low (SSP1-2.6) forcing scenarios, all projections indicate that most of the China will experience an increasing trend in precipitation, with significant increases in precipitation observed in the regions south of the Yangtze Rive, South and Southwest China. The higher the greenhouse gas emissions, the more pronounced the increasing trend in precipitation. (3) Compared to the 20th century, under high (SSP5-8.5), medium (SSP2-4.5), and low (SSP1-2.6) forcing scenarios, all projections indicate that the total annual precipitation hours, railway inspection, speed limit, and closure risk hours have all increased on a national scale during the 21st century. The operational precipitation risk for railways has also increased. The higher the alert level for railway precipitation (precipitation < inspection < speed limit < closure), the higher the proportion of risk hours compared to the 20th century. By the late 21st century, the railway inspection, speed limit, and closure risk hours have increased by 175%, 463%, and 647%, respectively, compared to the 20th century.
1 Introduction
Global warming has intensified the water cycle (Overland and Wang, 2010; Herring et al., 2015), leading to more frequent and intense extreme precipitation events in the future, which pose significant threats to railway infrastructure and safety operations (Diakakis et al., 2020). Many scholars (Jiang et al., 2009; Lu and Fu, 2010; Sun et al., 2010; Chen et al., 2012; 2013; 2014; Wang et al., 2012; Xu et al., 2012) have studied the effects of climate change on precipitation. Chen et al. (2013, 2014) concluded that precipitation in China will increase significantly in the future. Jiang et al. (2009) stated that precipitation-related events will become more extreme, and that the magnitude of this change will be greater under high forcing scenarios. Studies related to the impact of future climate change on railway infrastructure and safety operations have garnered considerable attention from scientists and government agencies worldwide. Research has shown that in North America, climate change’s most significant effects on transportation include increased and intensified storms, road inundation due to rising sea levels, and infrastructure damage (NRC, 2008). By the year 2100, the estimated costs to the U.S. railway network due to traffic delay under RCP8.5 (high) and RCP4.5 (medium) forcing scenarios are projected to increase by $35–60 billion and $25–45 billion, respectively (Chinowsky et al., 2017). In the 21st century, flooding is expected to cause annual losses of €89 million for Australian railways (Kellermann et al., 2016). Climate-change-induced floods result in yearly losses of around €2.5 billion and €581 million for the European transport and railway networks, respectively (Klose et al., 2017; Bubeck et al., 2019). Over the next 4 decades (2040–2050), precipitation-induced damages to railways are projected to increase, leading to an 80% rise in railway transportation costs, and railway network risks are expected to increase by 255%–310% (Bubeck et al., 2019).
China boasts the world’s largest railway network, with a total track length reaching 155,000 km as of the end of 2022 (National Railway Administration, 2023). Disasters triggered by precipitation account for over 70% of natural disasters affecting railways (Xu and He, 2012; Zhao et al., 2020). Over the past 50 years, both railway debris flow and flood disasters in China have shown an increasing trend (Xu and He, 2016; 2012). However, research on the impact of future precipitation changes on China’s railways in the context of climate warming is scarce. Liu et al. (2021) studied the vulnerability of railway infrastructure under RCP8.5 (high) forcing scenarios, finding that with global warming of 1.5°C, 2.0°C, and 3.0°C, the disaster susceptibility of railway infrastructure increased by 2.8, 4.0, and 6.7 times, respectively. Zhang et al. (2021) estimated that under RCP4.5 (medium) and RCP8.5 (high) forcing scenarios, extreme wet days in the Sichuan-Tibet region will increase by 2%–19% in the late 21st century (2070–2099) and more frequent extreme precipitation events posing impact on the Sichuan-Tibet Railway.
To ensure safe railway operation during flood seasons, China’s railway authorities have adopted a rainfall alert system, which guides the implementation of inspection tours, speed restrictions, and closures along railway lines (China Railway Corporation, 2017). The rainfall alert thresholds are determined based on simulation studies of precipitation’s impact on railway operational safety and practical experience. As a result, these thresholds not only reflect the characteristics of the railway disaster-causing factor (precipitation) but also encompass the vulnerability of the railway section, including the geographical location, terrain features, and the line’s curvature, slope gradient, etc. This paper uses the duration of time when each alert threshold is exceeded to represent the risk of precipitation during railway operations. By studying past and future precipitation changes in China and their impact on railway safety, including extreme precipitation and precipitation intensity, this research aims to provide technical support for mitigating the adverse effects of climate change and ensuring the safe operation of China’s railways.
2 Data and methods
2.1 Data
2.1.1 Observed data
Hourly precipitation data from 1 January 2012, 1:00 AM to 31 December 2021, 12:00 PM were selected from national basic, reference, and general meteorological stations across the country. This dataset complies with the specifications of the World Meteorological Organization (WMO) Global Observing System and the Technical Regulations for Meteorological Observations of the China Meteorological Administration (China Meteorological Administration, 2003; WMO, 2004; Song F et al., 2004) and is provided by the National Meteorological Information Center. In this study, the annual precipitation, i.e., the total sum of precipitation over 1 year, is used to represent the average precipitation characteristics of a specific location, while the hourly accumulated precipitation is used to represent precipitation intensity.
2.1.2 Model data
Four global climate models that have performed well in simulating the large-scale atmospheric circulation over East Asia and regional precipitation in China were used from the Coupled Model Intercomparison Project Phase 6 (CMIP6) of the World Climate Research Program (WCRP) (Table 1). These models were dynamically downscaled, and the downscaled simulation results were equally weighted and integrated, referred to as the Model Ensemble (ALL_ESM). The study periods include the 21st century (2025–2100), early 21st century (2025–2034), mid-21st century (2056–2065), and late 21st century (2091–2100). The historical reference period for comparison is from 2005 to 2014.
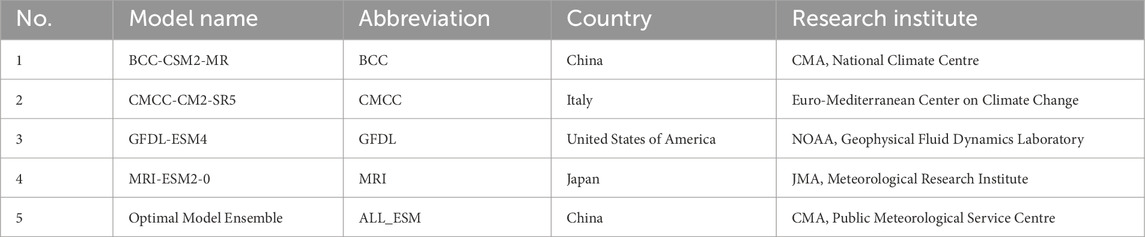
Table 1. Introduction of used global climate models.
2.2 Materials and methods
2.2.1 Estimation method
A series of future projection scenarios representing high, medium, and low greenhouse gas emissions were selected from the latest developments by the Intergovernmental Panel on Climate Change (IPCC) Working Group. These scenarios include SSP5-8.5, SSP2-4.5, and SSP1-2.6. The high forcing scenario (SSP5-8.5) represents a shared socio-economic pathway where human-induced radiative forcing reaches 8.5 W/m2 by the year 2100. The medium forcing scenario (SSP2-4.5) represents a pathway where radiative forcing stabilizes below 4.5 W/m2 by 2100, representing a combination of moderate societal vulnerability and moderate radiative forcing. The low forcing scenario (SSP1-2.6) represents a pathway where radiative forcing stabilizes below 2.6 W/m2 by 2100 and includes significant land-use changes such as a substantial increase in global forest area. This scenario supports the 2°C temperature control target and represents a combination of low vulnerability, low mitigation pressure, and low radiative forcing impacts (IPCC, 2018).
Considering the presence of certain systematic errors in climate models and their ability to simulate extreme precipitation events, this study estimates the risk hours for inspection tours, speed restrictions, and closures in the future with methods as follows: Firstly, for each railway bureau, quantile values of observed precipitation hours, inspection tour risk hours, speed restriction risk hours, and closure risk hours are calculated to determine the simulated precipitation reference thresholds for each alert level (precipitation, inspection tour, speed restriction, and closure) during the historical period (historical experiment). Then, based on these precipitation reference thresholds for each alert level, quantile values of risk hours for future precipitation, inspection tours, speed restrictions, and closures are calculated for SSP5-8.5, SSP2-4.5, and SSP1-2.6 scenarios. Finally, the quantile values of future risk hours for precipitation, inspection tours, speed restrictions, and closures are multiplied by the total annual hours to obtain the estimated future risk hours for these scenarios (SSP5-8.5, SSP2-4.5, and SSP1-2.6).
2.2.2 Precipitation intensity distribution
The distribution of precipitation intensity (i.e., hourly precipitation) follows a gamma (
Where α and β are the shape and scale parameters, respectively.
The probability density function of the
Considering that α is generally small in the distribution of precipitation intensity, the maximum likelihood estimation method proposed by Thom (1958) is used to calculate the α and β parameters. First, the natural logarithm of the difference between the sample arithmetic means and the geometric mean is calculated (Eq. (4)). The shape and scale parameters are then derived using Eqs 5, 6. In Eq. (4), n represents the total number of samples for which precipitation intensity at each station exceeds 0.1 mm.
The specific shape of the
2.2.3 Railway precipitation alert risk
(1) Alert Thresholds
Railway section-level rainfall alert thresholds not only take into account the influence of precipitation but also consider the geological and topographical characteristics of the railway line’s location and the design standards related to the curvature and slope gradient of the line. Since section-level line information exhibits strong local variability and has a relatively weak association with large-scale atmospheric background due to climate changes, this study selects the most common alert thresholds within each railway bureau’s region as the comprehensive alert thresholds for that bureau to consider the overall characteristics of the lines and mitigate the disturbance of local information posed on the research on large scale climate change as much as possible. Similarly, the most common alert thresholds across the entire country are selected to represent the comprehensive alert thresholds for the entire nation (Table 2). This approach preserves the overall characteristics of railway lines while aligning with large-scale atmospheric changes due to climate, providing a clearer reflection of the impact of climate change. The management scope of railway bureaus are shown in Figure 1 and Table 2.
(2) Risk Hours for Railway Precipitation Alert
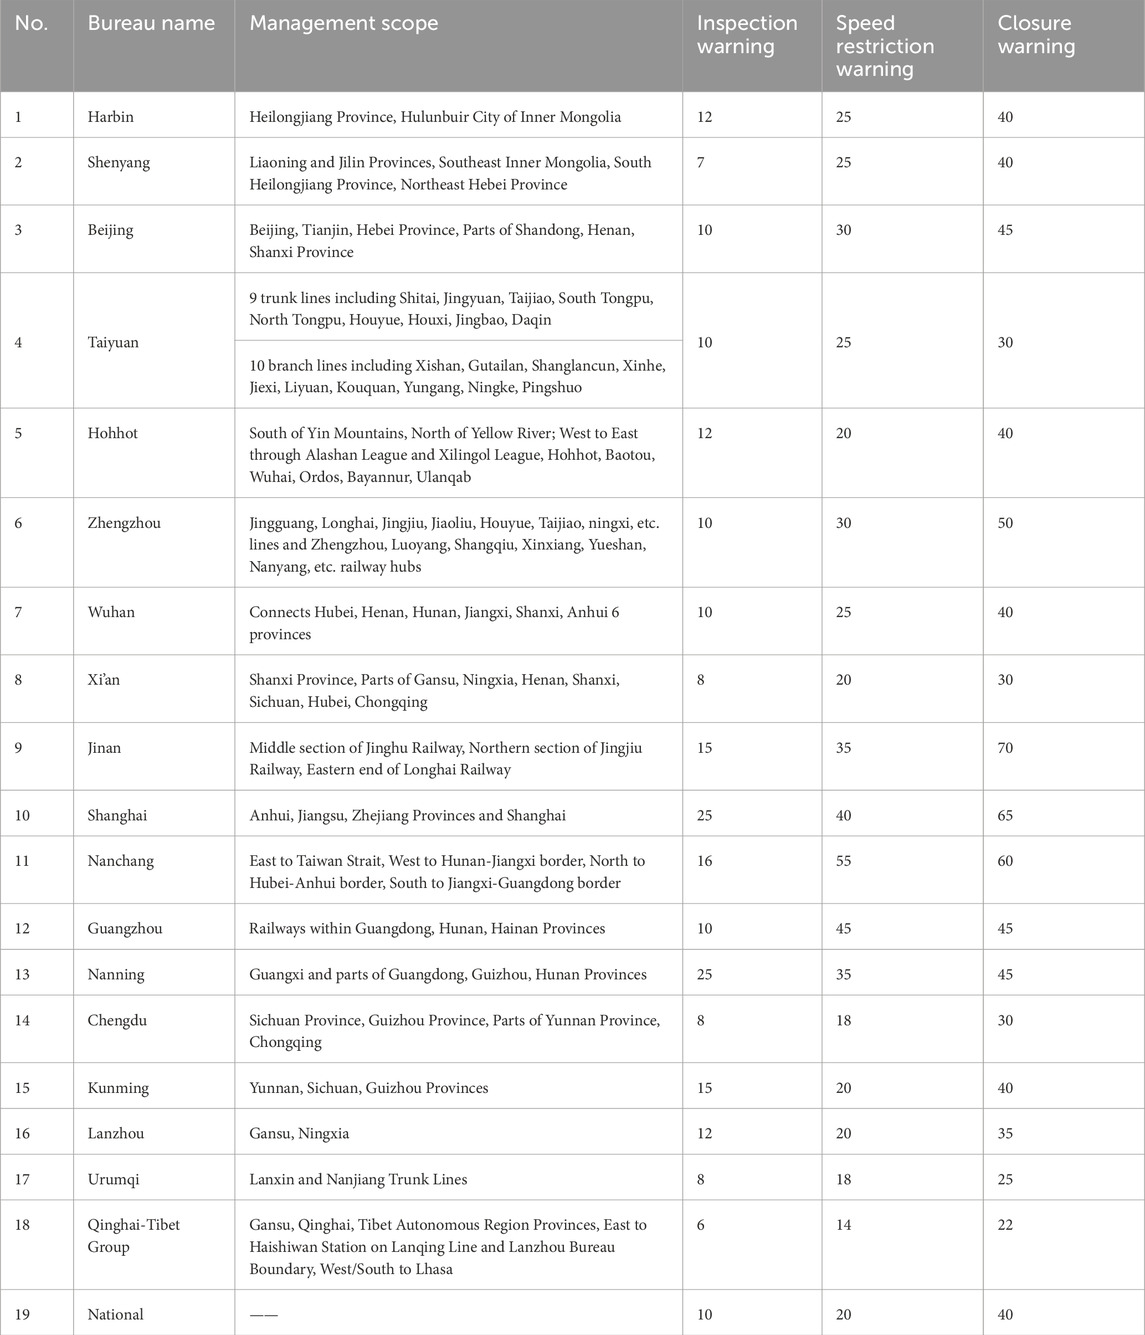
Table 2. Management Scope and Existing Railway Precipitation Warning Values of Railway Bureaus (Unit: mm).
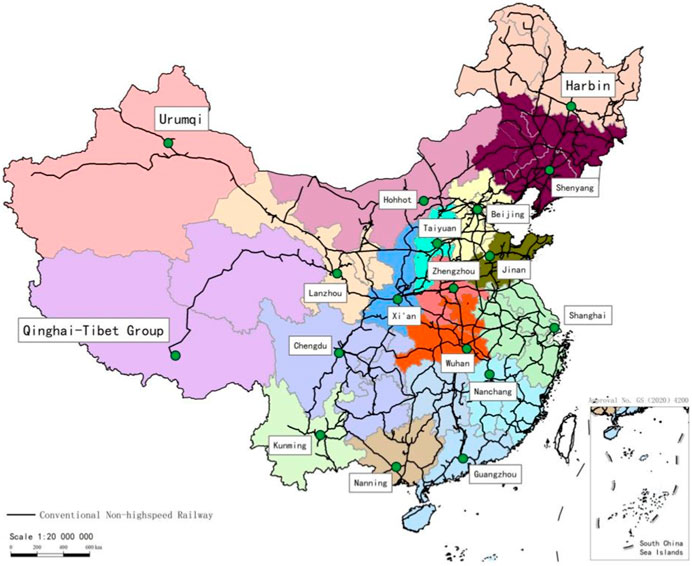
Figure 1. Management scope and location of railway bureaus.
The number of hours during which hourly precipitation exceeds the alert thresholds for inspection tours, speed restrictions, and closures is used to represent the risk of precipitation for railway operations, referred to as railway precipitation alert risk. The hours during which precipitation exceeds the alert thresholds for inspection tours, speed restrictions, and closures are termed inspection tour risk hours, speed restriction risk hours, and closure risk hours, respectively.
3 Changes in precipitation and their impact on railway safety
3.1 Historical observations
China’s annual precipitation exhibits a pattern of more precipitation in the east and less in the west, and more in the south and less in the north, gradually decreasing from the southeast coastal areas to the northwest inland regions (Figure 2A). Annual precipitation in regions such as the south of Yangtze River and South China exceeds 1800 mm, while it is less than 50 mm in parts of the Northwest China. Among the railway bureaus, Shanghai, Nanchang, Guangzhou, Nanning, Wuhan, and Chengdu have annual precipitation exceeding 1,000 mm and precipitation hours exceeding 2000 h. Guangzhou Bureau has the highest number of inspection tour risk hours, while Chengdu Bureau has the highest number of speed restriction and closure risk hours (Table 3). Based on historical observations, Guangzhou and Chengdu Bureaus face significant precipitation-related risks to railway safety.
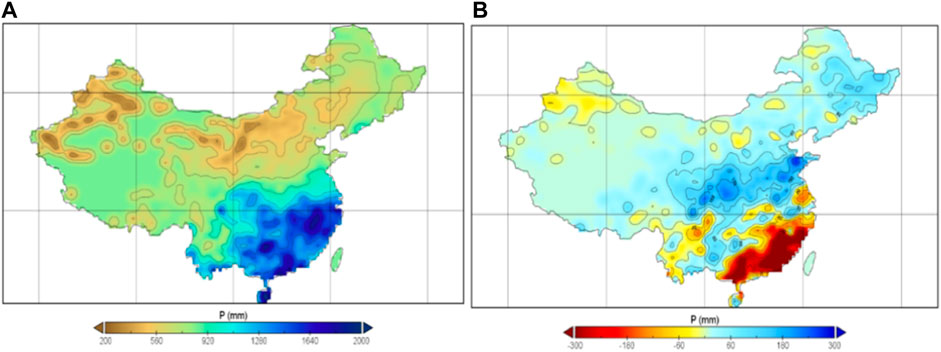
Figure 2. Spatial Distribution of Annual Precipitation and Changes (Unit: mm) (A) the Mean Precipitation in 2012–2021 (B) the Change in Precipitation between 2017–2021 and 2012–2016.
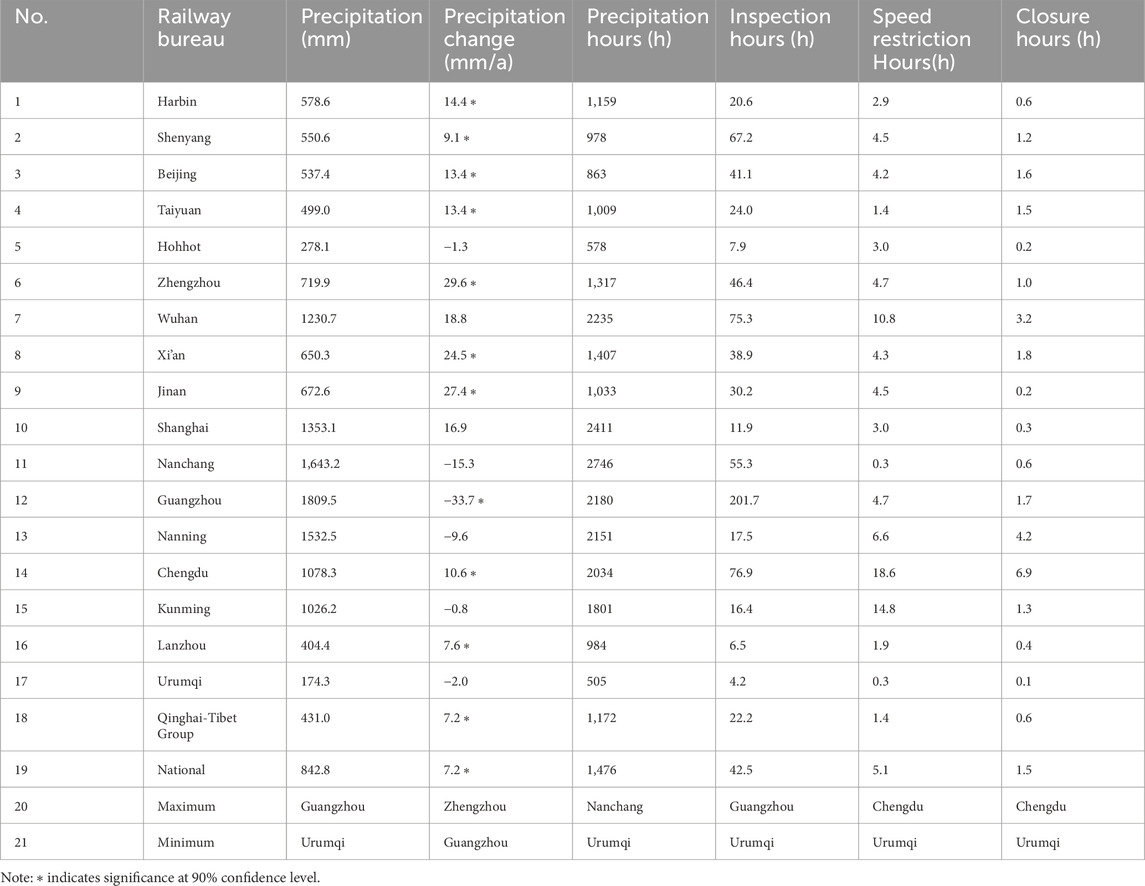
Table 3. Railway Bureau Historical Precipitation and it is Risk Hours for Railway Alert (2012–2021).
During the 2017–2021 compared to the 2012–2016, there has been a significant decrease (exceeding 120 mm) in annual precipitation in the regions south of the Yangtze River and South China, while there has been a significant increase (exceeding 60 mm) in annual precipitation in the regions from the eastern of Northwest China to the middle and lower reaches of Yangtze River (Figure 2B); Bureaus in Nanchang, Guangzhou, and Nanning have shown a clear decreasing trend in precipitation (over 9.6 mm/year), while those in Xi’an, Zhengzhou, Wuhan, Jinan, and Shanghai Bureau have exhibited a clear increasing trend in precipitation (over 15.0 mm/year). In recent years, the intensity of the East Asian summer monsoon has been stronger, and the northward shift of the extent of the subtropical high (Zhu et al., 2011; 2015) leading to more precipitation in the northern periphery region to the subtropical high and less precipitation in the southern periphery region the subtropical high, which is the main reason for changes in precipitation in China.
From the perspective of precipitation intensity distribution, all Bureaus exhibit a high frequency of light precipitation and a low frequency of heavy precipitation; as precipitation intensity increases, the frequency of occurrence decreases rapidly. There are significant differences in the distribution of precipitation intensity levels among Bureaus (Figure 3), with Wuhan, Chengdu, Kunming, and Nanning Bureaus having the highest frequency of heavy precipitation, and their speed restriction and closure risk hours are noticeably higher than those of other Bureaus (Table 3). During the 2017–2021 compared to the 2012–2016, there has been a decrease in the frequency of occurrence of heavy precipitation in Bureaus such as Urumqi, Lanzhou, Qinghai-Tibet Group, Xi’an, and Wuhan, whereas there has been an increase in the frequency of occurrence of heavy precipitation in Bureaus such as Nanchang, Chengdu, Zhengzhou, Shanghai, and Shenyang. Interestingly, Lanzhou and Xi’an Bureaus have experienced an increase in annual precipitation (7.6 mm/year and 24.5 mm/year, respectively), but the frequency of occurrence of heavy precipitation has decreased, while Nanchang Bureau has experienced a decrease in annual precipitation (15.3 mm/year), but the frequency of occurrence of heavy precipitation has increased.
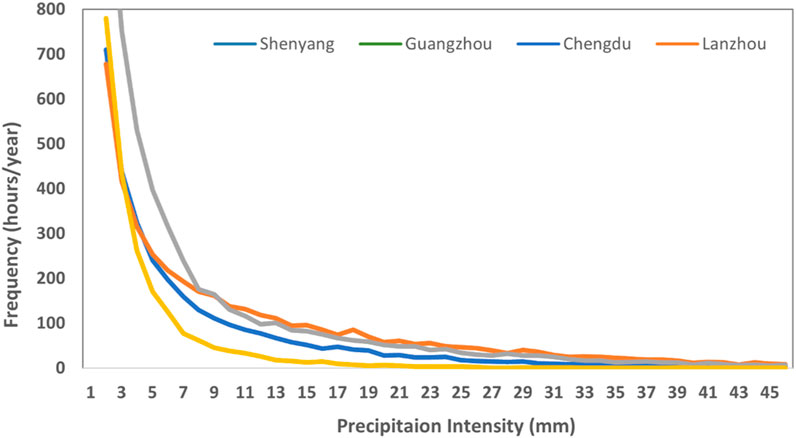
Figure 3. Precipitation intensity level distributions for shenyang, guangzhou, chengdu and lanzhou railway bureaus.
3.2 Future projections
3.2.1 Changes in precipitation
(1) 21st Century (2025–2100)
Compared to the historical period, all projections under high (SSP5-8.5), medium (SSP2-4.5), and low (SSP1-2.6) forcing scenarios indicate that most of the China will experience an increasing trend in annual precipitation. Significant increases in precipitation are projected in regions such as the south of the Yangtze River, South China, and the southern of Southwest China (exceeding 100 mm). Among the scenarios, SSP5-8.5 shows the largest and strongest increase in precipitation (Figure omitted). On a national average, SSP1-2.6, SSP2-4.5, and SSP5-8.5 all project an increasing trend in annual precipitation during the 21st century, and the increasing trend becomes more pronounced with higher emission scenarios (Table 4).
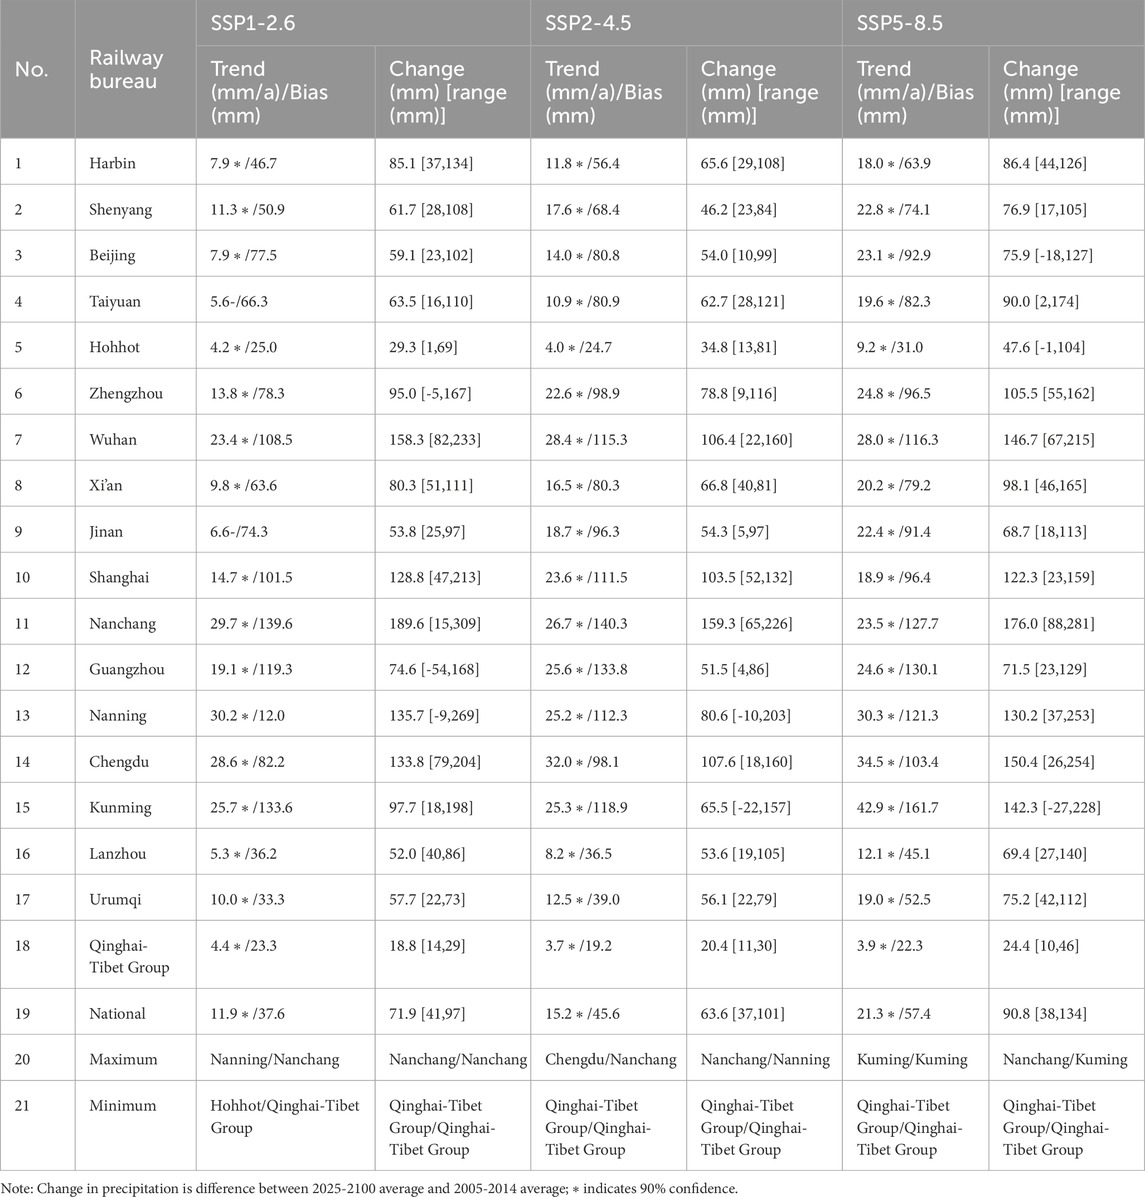
Table 4. 21st century (2025–2100) precipitation changes for Chinese railway bureaus under different scenarios.
For railway bureaus, SSP1-2.6, SSP2-4.5, and SSP5-8.5 all project an increasing trend in annual precipitation during the 21st century (Table 4; Figure 4). The most significant increase in precipitation is projected for Nanning, Chengdu, Kunming, Wuhan, and Guangzhou Bureaus (exceeding 23.0 mm/year). Except for the Nanchang Bureau, all other Bureaus show a more significant increasing trend in precipitation under SSP5-8.5 compared to SSP1-2.6, and, except for most Bureaus in the south of Yangtze River and South China (Wuhan, Shanghai, Nanchang, Nanning, and Guangzhou), all other Bureaus show a more significant increasing trend in precipitation under SSP5-8.5 compared to SSP2-4.5 (Table 4). The largest increase in precipitation is observed for the Nanchang (189.6 mm), Wuhan (158.3 mm), Chengdu (133.8 mm), and Shanghai (128.8 mm) Bureaus, while the smallest increase is for the Qinghai-Tibet Group (18.8 mm). Bureaus with higher annual precipitation also exhibit larger inter-annual variations and greater differences in projected precipitation among the models, and vice versa (Table 4).
(2) Early, Middle, and Late Periods
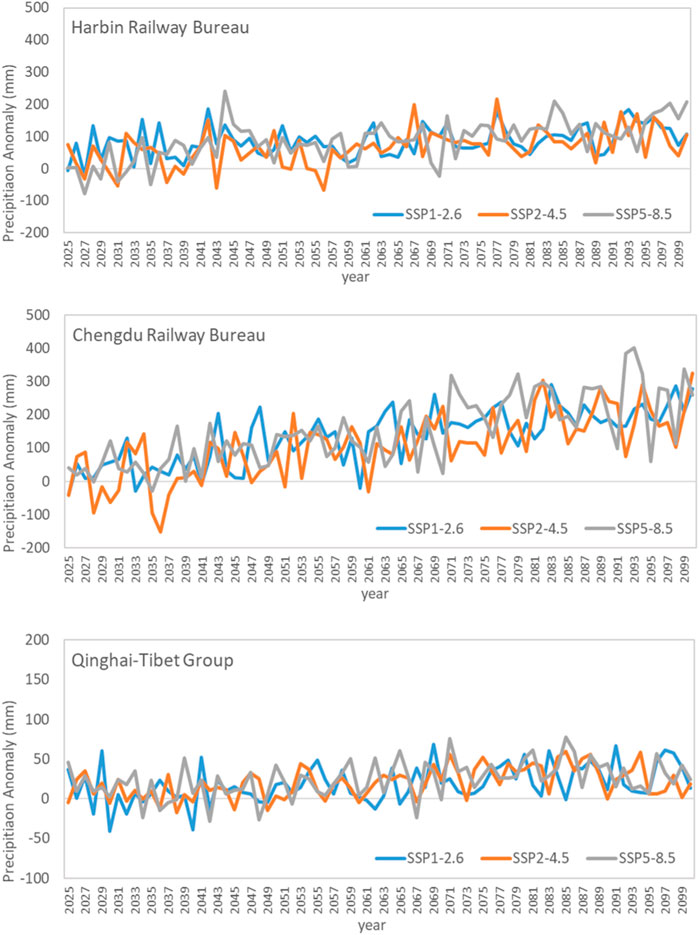
Figure 4. Precipitation Anomaly Evolution under Different Scenarios in 21st Century (Relative to 2005–2014 Average, Unit: mm).
Under the SSP1-2.6 scenario, during the early 21st century, most regions in China show an increasing trend in annual precipitation, with significant increases observed in the eastern Northwest to the south of Yangtze River, while the eastern and southern parts of Southwest and southern South China show a decreasing trend, like historical observations (Figures 5B). In the middle 21st century, the range of areas with an increasing trend in precipitation expands, and the centric intensity increases (Figure 5C). In the late 21st century, the area with an increasing trend in precipitation expands and centric intensity increases further, with increases exceeding 250 mm in the regions from the eastern of Southwest China to the south of Yangtze River and South China (Figure 5D). Similar projections are observed under SSP2-4.5 and SSP5-8.5, with the range of areas with an increasing trend in precipitation gradually expanding and the centric intensity increasing over time. SSP5-8.5 shows a wider range and stronger intensity of increasing precipitation compared to SSP2-4.5.
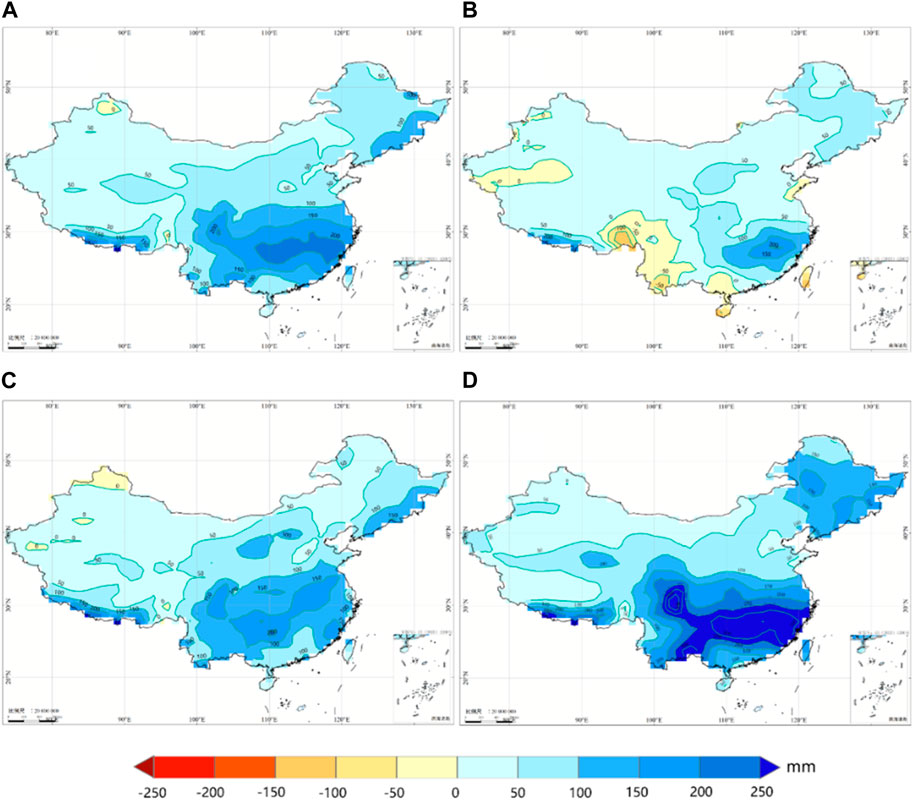
Figure 5. Estimated Precipitation Change Distributions under SSP1-2.6 Scenario in 21st Century (Unit: mm, Relative to 2005–2014) (A) 21st Century (2025–2100) (B) Early 21st Century (2025–2034) (C) Mid 21st Century (2056–2065) (D) Late 21st Century (2091–2100)
For Bureaus, all three forcing scenarios project an increase in precipitation for most Bureaus during the early 21st century, except for Kunming, Nanning, Guangzhou, and Shenyang Bureaus, which show a slightly lower precipitation than the 20th century. The remaining Bureaus all project higher precipitation than the 20th century, with the most significant increase observed for Nanchang Bureau. In the middle and late 21st century, the magnitude of precipitation increase further intensifies for all Bureaus, with the most significant increases observed for Wuhan (early SSP1-2.6), Kunming (late SSP5-8.5), and Nanchang (late SSP1-2.6, mid and late SSP2-4.5, mid SSP5-8.5) Bureaus.
3.2.2 Changes in precipitation intensity distribution
For railway operation safety, the risk and inspection strategies are influenced not only by the annual precipitation and extreme precipitation intensity but also by the changes in the frequency of different intensity levels of precipitation (e.g., greater than 30 mm/hour). Additionally, to present the changes in the intensity distribution of precipitation for each Bureau more clearly, we used the hourly precipitation data for each Bureau and plotted their
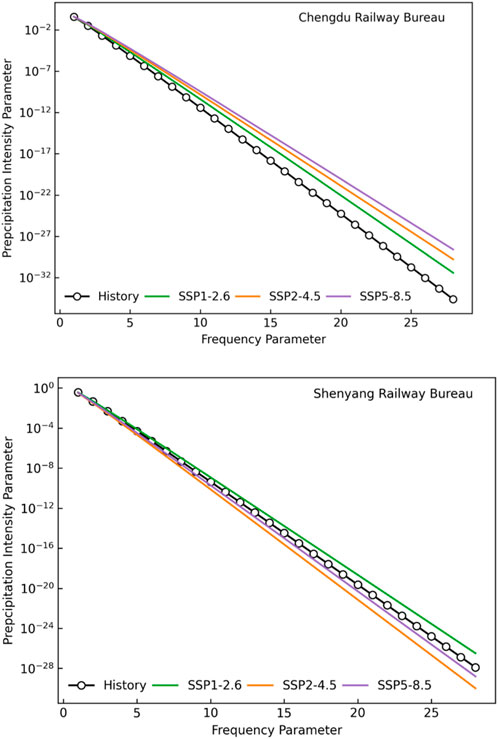
Figure 6. Precipitation intensity level distributions for chengdu and shenyang railway bureaus under different scenarios in 21st century (2025–2100)
3.2.3 Impacts on railway operation safety
From a national perspective (Table 5), under SSP1-2.6, SSP2-4.5, and SSP5-8.5 scenarios, all projections indicate an increase in the total annual precipitation hours and the risk hours for railway operation (inspection, speed limit, and closure) during the 21st century compared to the 20th century. Furthermore, the increase in risk hours is observed to decrease in magnitude with increasing alert levels (precipitation < inspection < risk < speed limit < closure). However, the proportion of risk hour changes compared to the 20th century increases for each alert threshold. Under higher forcing scenarios (SSP2-4.5 and SSP5-8.5), the risk hours for speed limit and closure show significant increases (over 30%) compared to the 20th century, while under the lower forcing scenario (SSP1-2.6), they also show increases, although less pronounced. Across all three forcing scenarios, consistent projections indicate that the precipitation hours, inspection, speed limit, and closure risk hours gradually increase over time (early, middle, and late 21st century). Additionally, as greenhouse gas emissions increase, the increasing trend in risk hours for each alert threshold becomes more pronounced. The increase in risk hours is more evident for higher railway alert levels (precipitation < inspection < speed limit < closure). By the late 21st century, the risk hours for inspection, speed limit, and closure have increased by 175%, 463%, and 647%, respectively, compared to the 20th century (Table 5).
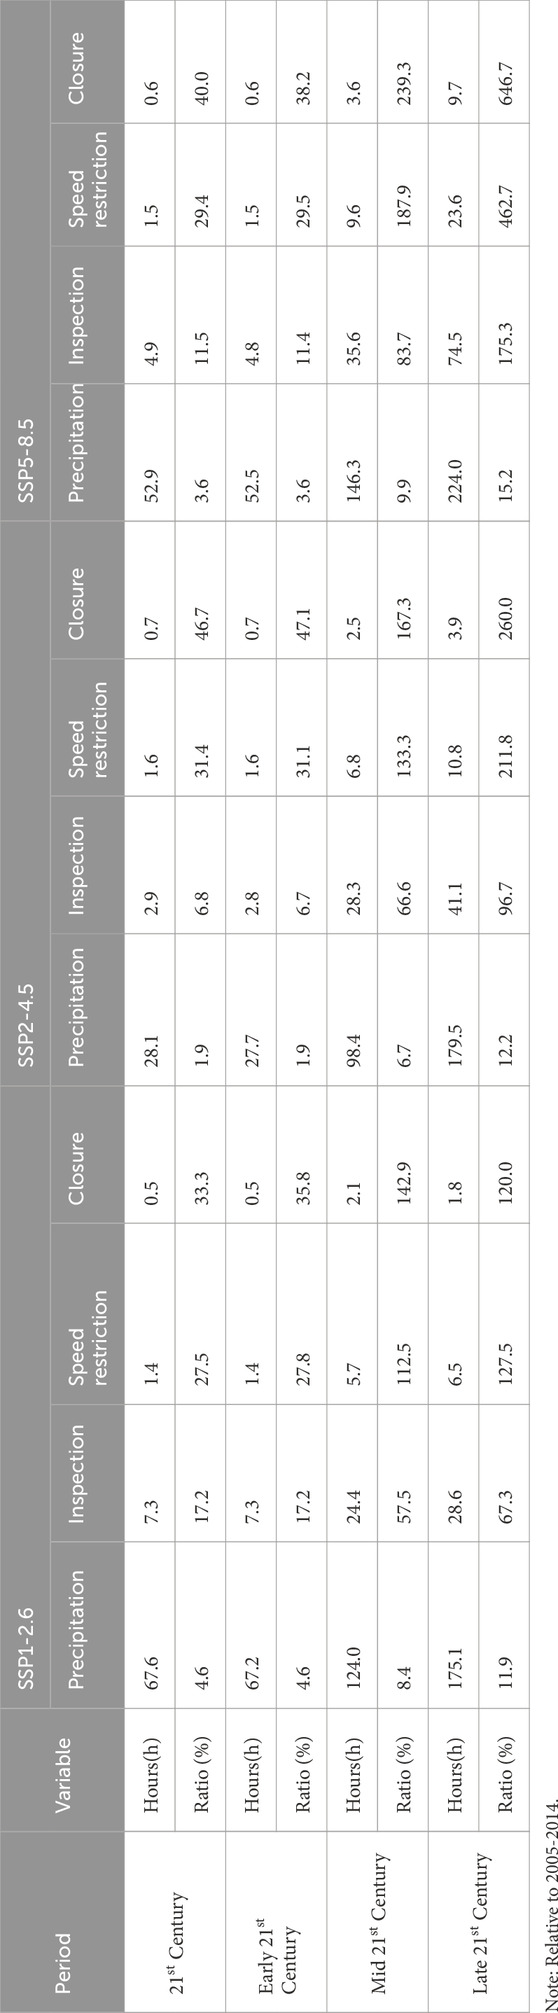
Table 5. 21st century annual precipitation, inspection risk, speed restriction risk, and closure risk hours changes and ratios to historical measurements.
The changes in risk hours for each Bureau do not entirely match the national average characteristics (Table 6). Compared to the 20th century, under the SSP1-2.6 scenario, projections indicate an increase or no significant change in the risk hours for inspection, speed limit, and closure for all Bureaus during the 21st century, with the most significant increase observed in the closure risk hours for the Harbin and Chengdu Bureaus. Under the SSP2-4.5 and SSP5-8.5 scenarios, projections indicate an increase or no significant change in the risk hours for speed limit and closure for most Bureaus across the country during the 21st century, with the Chengdu Bureau showing the largest increase in risk hours.
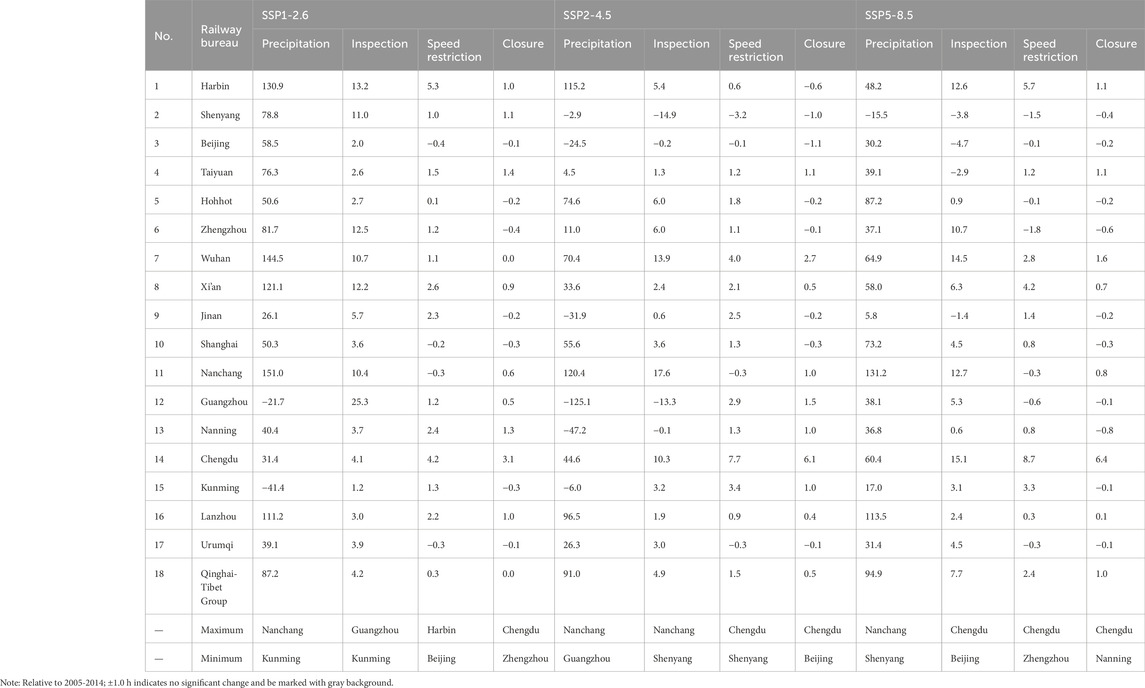
Table 6. 21st Century (2025–2100) Precipitation, Inspection Risk, Speed Restriction Risk, and Closure Risk Hours Changes for Railway Bureaus (Unit: hours).
4 Discussion and conclusion
Historical measurements indicate a significant decrease in precipitation in the regions of southern Yangtze River and South China during the 2017-2021 compared to the 2012-2016, while precipitation in the regions from the eastern Northwest China to the middle and lower reaches of Yangtze River has shown a significant increase. The intensified East Asian summer monsoon and the northward shift of the subtropical high are identified as the main reasons for precipitation changes in China. For the railway bureaus, the operational precipitation risk has decreased for Urumqi, Lanzhou, Qinghai-Tibet Group, Xi’an, and Wuhan Bureaus during the 2017-2021 compared to the 2012-2016, while it has increased for Nanchang, Chengdu, Zhengzhou, Shanghai, and Shenyang Bureaus. Particularly noteworthy is that despite an increase in annual precipitation, the operational precipitation risk has decreased for Lanzhou and Xi’an Bureaus, while for Nanchang Bureau, despite a decrease in annual precipitation, the operational precipitation risk has increased.
During the 21st century, under high (SSP5-8.5), medium (SSP2-4.5), and low (SSP1-2.6) forcing scenarios, all projections indicate that a significant portion of China will experience an increasing trend in annual precipitation. The regions south of the Yangtze River, South China, and the southern of Southwest China are projected to experience a significant increase in precipitation, with Nanning, Chengdu, Kunming, Wuhan, and Guangzhou Bureaus showing more pronounced increasing trends (exceeding 23.0 mm/year). On a national average scale, the higher the greenhouse gas emissions, the more pronounced the increasing trend in precipitation.
Compared to the 20th century, under high (SSP5-8.5), medium (SSP2-4.5), and low (SSP1-2.6) forcing scenarios, all projections indicate that during the 21st century, the total annual precipitation hours, railway inspection, speed limit, and closure risk hours have all increased. The increase in risk hours decreases with increasing alert levels (precipitation < inspection < speed limit < closure), but the proportion of risk hours compared to the 20th century increases. Over the course of the 21st century, there is a clear increasing trend in precipitation, inspection risk, speed limit risk, and closure risk hours, with the increasing trend becoming more pronounced with higher greenhouse gas emissions. By the late 21st century, the railway inspection, speed limit, and closure risk hours have increased by 175%, 463%, and 647%, respectively, compared to the 20th century.
It is worth noting that in this study, we have used the optimal (China Railway Corp, 2017) models, employed dynamic downscaling, optimal integration methods, and data correction based on observed measurements to ensure the objectivity and reliability of the projections as much as possible. Uncertainties still exists largely due to (1) the choice of models; (2) the limited understanding of the climate systems and models’ insufficient capability in reproducing them, especially for the natural decadal climate variability; (3) There are still uncertainties due to limitations in forecasting methods and human understanding of future scenarios, such as uncertainties in projected (Transportation Research Board and National Research Council, 2008) scenarios and model simulations. The uncertainty in quantitative climate projections using climate models is inherent, but their (Zhang and Dai, 2016) trend projections (Zahumensky, 2004) and broad-scale averages still carry high confidence (IPCC, 2007).
Data availability statement
Publicly available datasets were analyzed in this study. This data can be found here: https://esgf-node.llnl.gov/projects/cmip6/.
Author contributions
YJ: Writing–original draft. ZC: Visualization, Writing–review and editing. YW: Writing–original draft. JG: Writing–original draft. XZ: Writing–review and editing. RH: Writing–review and editing. HW: Writing–review and editing.
Funding
The author(s) declare that financial support was received for the research, authorship, and/or publication of this article. This work was supported by the Key Technology Research and Development Program of China State Railway Group Co., Ltd. (No. N2021G002). The funder was not involved in the study design, collection, analysis, interpretation of data, the writing of this article, or the decision to submit it for publication.
Conflict of interest
The authors declare that the research was conducted in the absence of any commercial or financial relationships that could be construed as a potential conflict of interest.
Publisher’s note
All claims expressed in this article are solely those of the authors and do not necessarily represent those of their affiliated organizations, or those of the publisher, the editors and the reviewers. Any product that may be evaluated in this article, or claim that may be made by its manufacturer, is not guaranteed or endorsed by the publisher.
References
Bubeck, P., Dillenardt, L., Alfieri, L., Feyen, L., Thieken, A. H., and Kellermann, P. (2019). Global warming to increase flood risk on European railways. Clim. Change 155, 19–36. doi:10.1007/s10584-019-02434-5
Chen, H. P. (2013). Projected change in extreme rainfall events in China by the end of the 21st century using CMIP5 models. Chin. Sci. Bull. 58 (12), 1462–1472. doi:10.1007/s11434-012-5612-2
Chen, H. P., Sun, J. Q., and Chen, X. L. (2014). Projection and uncertainty analysis of global precipitation-related extremes using CMIP5 models. Int. J. Climatol. 34, 2730–2748. doi:10.1002/joc.3871
Chen, H. P., Sun, J. Q., Chen, X. L., and Zhou, W. (2012). CGCM projections of heavy rainfall events in China. Int. J. Climatol. 32, 441–450. doi:10.1002/joc.2278
China Meteorological Administration (CMA) (2003). Ground surface meteorological observation. Beijing, China: China Meteorological Press, 157.
Chinowsky, P., Helman, J., Gulati, S., Neumann, J., and Martinich, J. (2017). Impacts of climate change on operation of the US rail network. Transp. Policy 75, 183–191. doi:10.1016/j.tranpol.2017.05.007
Diakakis, M., Boufidis, N., Grau, J. M. S., Andreadakis, E., and Stamos, I. (2020). A systematic assessment of the effects of extreme flash floods on transportation infrastructure and circulation: the example of the 2017 mandra flood. Int. J. Disaster Risk Reduct. 47, 101542. doi:10.1016/j.ijdrr.2020.101542
Herring, S. C., Hoerling, M. P., Kossin, J. P., Peterson, T. C., and Stott, P. A. (2015). Explaining extreme events of 2014 from a climate perspective. Bull. Amer Meteor Soc. 96, S1–S172. doi:10.1175/bams-explainingextremeevents2014.1
Jiang, Z. H., Chen, W. L., Song, J., and Wang, J. (2009). Projection and evaluation of the precipitation extremes indices over China based on seven IPCC AR4 coupled climate models (in Chinese). Chin. J. Atmos. Sci. 33, 109–120. doi:10.3878/j.issn.1006-9895.2009.01.10
Kellermann, P., Schönberger, C., and Thieken, A. H. (2016). Large-scale application of the flood damage model railway infrastructure loss (RAIL). Nat. Hazards Earth Syst. Sci. 16, 2357–2371. doi:10.5194/nhess-16-2357-2016
Klose, M., Auerbach, M., Herrmann, C., et al. (2017). Landslide Hazards and Climate Change Adaptation of Transport Infrastructures in Germany. 4th World Landslide Forum, Ljubljana, Slovenia. K Sassa, M Mikoš, and Y Yin, Springer, Cham, 535-541.
Liu, K., Wang, M., and Zhou, T. J. (2021). Increasing costs to Chinese railway infrastructure by extreme precipitation in A warmer world. Transp. Res. Part D Transp. Environ. 93 (1), 102797. doi:10.1016/j.trd.2021.102797
Lu, R. Y., and Fu, Y. H. (2010). Intensification of East Asian summer rainfall interannual variability in the twenty-first century simulated by 12 CMIP3 coupled models. J. Clim. 23, 3316–3331. doi:10.1175/2009jcli3130.1
National Railway Administration (2023). National railway administration of the people’s Republic of China. Available at:https://www.nra.gov.cn/xwzx/xwxx/xwlb/202305/t20230529_341754.shtml (accessed on July 7, 2023).
Overland, J. E., and Wang, M. Y. (2010). Large-scale atmospheric circulation changes are associated with the recent loss of arctic sea ice. Tellus A Dyn. Meteor Oceanogr. 62, 1–9. doi:10.3402/tellusa.v62i1.15661
Solomon, S., and Qin, D. (2007). Climate change 2007-the physical science basis: Working group I contribution to the fourth assessment report of the IPCC. Vol. 4; Cambridge University Press: Cambridge, United Kingdom and New York, NY, USA, 748–845.
Song, F., Hu, Q., and Qian, W. H. (2004). Quality control of daily meteorological data in China, 1951-2000: a new dataset. Int. J. Clim. 24 (7), 853–870. doi:10.1002/joc.1047
Sun, J. Q., Wang, H. J., Yuan, W., and Chen, H. P. (2010). Spatial-temporal features of intense snowfall events in China and their possible change. J. Geophys. Res. 115, D16110. doi:10.1029/2009JD013541
Thom, H. C. S. (1958). A note on the gamma distribution. Mon. Wea Rev. 86, 117–122. doi:10.1175/1520-0493(1958)086<0117:anotgd>2.0.co;2
Tian, F. Y., Zheng, Y. G., Mao, D. Y., Chen, Y., and Zhong, S. X. (2014). Study on probability distribution of warm season hourly rainfall with Γ distribution. Meteorol. Mon. 40 (7), 787–795. doi:10.7519/j.issn.1000-0526.2014.07.002
Transportation Research Board and National Research Council (2008). Potential impacts of climate change on U.S. Transportation: special report 290. Washington, DC, USA: The National Academies Press.
Wang, H. J., Sun, J. Q., Chen, H. P., Zhu, Y. L., Zhang, Y., Jiang, D. B., et al. (2012). Extreme climate in China: facts, simulation and projection. Meteorol. Z 21 (3), 279–304. doi:10.1127/0941-2948/2012/0330
Xu, J. Y., Shi, Y., Gao, X. J., and Giorgi, F. (2012). Projected changes in climate extremes over China in the 21st century from a high resolution regional climate model (RegCM3). Chin. Sci. Bull. 58, 1443–1452. doi:10.1007/s11434-012-5548-6
Xu, Y. Q., and He, J. C. (2012). Analysis of heavy rainfall induced flood disasters of China railway during 1951-1998. Clim. Change Res. 8 (1), 22–27. doi:10.3969/j.issn.1673-1719.2012.01.004
Xu, Y. Q., and He, J. C. (2016). Spatial and temporal characteristics of debris flow of China railways in 1951-1996. Bull. Soil water Conservation 36 (1), 337–342. doi:10.13961/j.cnki.stbctb.2016.01.060
Zahumensky, I. (2004). Guidelines on quality control procedures for data from automatic weather stations. Geneva, Switzerland: World Meteorological Organization.
Zhang, B., and Dai, X. G. (2016). Assessment of the deviation of China precipitation projected by CMIP5 models for 2006-2013. Chin. J. Atmos. Sci. 40 (5), 981–994. doi:10.3878/j.issn.1006-9895.1511.15212
Zhang, J. P., Zhao, T. B., Zhou, L. B., and Ran, L. (2021). Historical changes and future projections of extreme temperature and precipitation along the sichuan-tibet railway. J. Meteorol. Res. 35, 402–415. doi:10.1007/s13351-021-0175-2
Zhao, J., Liu, K., and Wang, M. (2020). Exposure analysis of Chinese railways to multihazards based on datasets from 2000 to 2016. Geomatics, Nat. Hazards Risk 11 (1), 272–287. doi:10.1080/19475705.2020.1714753
Zhu, Y. L., Wang, H. J., Ma, J. H., Wang, T., and Sun, J. (2015). Contribution of the phase transition of Pacific Decadal Oscillation to the late 1990s' shift in East China summer rainfall. J. Geophys. Res.-Atmos. 120, 8817–8827. doi:10.1002/2015jd023545
Keywords: global warming, future, precipitation distribution, the safety of railway operations, alert threshold, China
Citation: Jiang Y, Chen Z, Wang Y, Gao J, Zhang X, Hu R and Wu H (2024) The impact of precipitation changes on the safety of railway operations in China under the background of climate change. Front. Earth Sci. 12:1319736. doi: 10.3389/feart.2024.1319736
Received: 11 October 2023; Accepted: 11 April 2024;
Published: 10 May 2024.
Edited by:
Andreas Franz Prein, National Center for Atmospheric Research (UCAR), United StatesReviewed by:
Jayanarayanan Kuttippurath, Indian Institute of Technology Kharagpur, IndiaYali Zhu, Chinese Academy of Sciences (CAS), China
Copyright © 2024 Jiang, Chen, Wang, Gao, Zhang, Hu and Wu. This is an open-access article distributed under the terms of the Creative Commons Attribution License (CC BY). The use, distribution or reproduction in other forums is permitted, provided the original author(s) and the copyright owner(s) are credited and that the original publication in this journal is cited, in accordance with accepted academic practice. No use, distribution or reproduction is permitted which does not comply with these terms.
*Correspondence: Zhongyu Chen, cG1zY19jaGVuemhvbmd5dUBzaW5hLmNvbQ==