 Afshin Akram1*
 Arifa Tahir
 Asifa Alam
- 1Department of Environmental Sciences, Lahore College for Women University (LCWU), Lahore, Pakistan
- 2Global Studies Department, Institute of Global and Historical Studies, Government College University Lahore, Lahore, Pakistan
Out of all natural catastrophes, floods are one of the most destructive and common occurrences as it affects human lives, economy and environment. Pakistan is prone to flooding because it is greatly affected by climate change. Mianwali region, Pakistan was selected as study area because this region is vulnerable to floods and have been affected by major floods in Pakistan in 2010 and no proper study on vulnerability assessment and flood extent mapping has been done in this area. The current study was carried out to evaluate flood extent mapping of the Mianwali region by using MODIS and NDWI techniques and to develop a cumulative flood risk map for 10 years (2010–2020). For the Flood Extent Mapping MODIS Product “MODIS Combined 16-Day NDWI” was used. This product is generated from the MODIS/MCD43A4 surface reflectance composites and provides a single NDWI value for 16 daily composite images. (Earth Data Catalogue). The flood extent maps of years 2010, 2011, 2012, 2013, 2014, 2015, 2016, 2017, 2018, 2019 and 2020 were developed. These flood extent maps demonstrated Mianwali villages of high flood risk zones and shallow flood risk zones. Results revealed that the people living in villages named Dhup sari, Sheikhan Wala, Arsala Wala, Moza Zareef wala, Allah khel wala and Janay Khel wala are at a greater risk of experiencing natural disasters to their geographical location as they are located alongside river Indus. Due to the cloud coverage increase and being on the bank of river Indus Mianwali is hit by floods almost every year. Lastly a cumulative Flood Risk Map was produced by combining the all extents identified during the flooding events 2010–20. The cumulative Flood Risk zones are classified as High Risk Zones and Mixed Zones based on the NDWI values. Results clearly suggest that 7 out of 20 the communities in the study area are situated in the High Risk Flood Zone and whereas the remaining 13 communities lies in the Mixed Zone which could be an area with very high soil moisture due to shallow flooding. The apparent land cover of the study area is dominated by Agriculture upon which lively hood of the communities depend. It can be concluded that Mianwali is at high danger of flooding due to its location and lack of pre-disaster preparedness. The data obtained from this study is critical for emergency response and rehabilitation efforts. The findings can assist local disaster organizations, planners, researchers, line agencies and local government in managing flood hazards in the area.
1 Introduction
Floods are the most common and dangerous natural calamity that harms people’s health, the environment, and man-made environments (Samanta et al., 2018). Floods are major risks to human life causing loss of life, assets in terms of damages caused to agriculture sector, buildings, etc. Floods also cause loss of ecosystems, cultural heritages and communication systems (Zou et al., 2013; Samanta et al., 2018). It is indicated by literature that more than 2000 deaths are occurring every year as a result of flooding also causing severe damages and losses to many people around the globe. Catastrophic flood occurrences are due to a variety of sources, including both anthropogenic and natural ones. Flooding happens when there has been a lot of rain or snow, and it overflows into the flood plains and briefly floods the surrounding communities (Gain et al., 2015; Rao, 2001). Recent research shows that floods are triggered by a variety of factors, including climate change, around the world (Khosravi et al., 2016; Scheuer et al., 2017). The impact of flood calamities in an area can be significantly affected by variations in land use patterns that create an impermeable surface, leading to increased flow velocity (Charlton et al., 2006). In addition to these, several more variables such as slope, elevation, land use, curvature, proximity to rivers, Normalized Difference Vegetation Index (NDVI), etc., can cause floods to occur (Tehrany et al., 2013). Many scientists have worked hard to research and comprehend flood danger due to the complexity of floods, their frequent happening, and the immense damage they do throughout the world. This has led to better mitigation and management of flood (Dandapat and Panda, 2017; Dou et al., 2018; Guo et al., 2014).
A crucial instrument for monitoring and mapping flood threats is geospatial methodology (Bisht et al., 2016). The extent of the flood has been determined using space-borne data from instruments including the Landsat, Moderate Resolution Imaging Spectroradiometer (MODIS), Sentinel and Indian Remote Sensing (IRS) (Alahacoon et al., 2018). Cloud cover is the one thing that optical satellite data cannot perceive beyond. Only optical sensors can capture strong satellite photos through the rainy season, but composite outputs can occasionally be useful for monitoring floods at a regional level. As an example, the near real-time (NRT) output based on MODIS was extensively utilized for impact assessments and flood mapping over various river basins globally (Belabid et al., 2019; Tripathi et al., 2019; Rai et al., 2021). Additionally, for the purpose of mapping the size of waterlogged areas, measuring the depth of standing water, mapping flood risks, and assessing susceptibility and risk, satellite pictures taken by optical sensors have been widely utilized (Matheswaran et al., 2019, Parida et al., 2021).
South Asia, with its significant population, is widely recognized as one of the most disaster-prone regions in the world. Pakistan, with its frequent occurrence of natural disasters, is now considered one of the most vulnerable and impacted countries in South Asia due to climate change. Ice surges, storms, cyclones, droughts, flooding, tsunamis, and other natural calamities are very common in Pakistan (Khan, 2013; Sanjrani Manzoor et al., 2022). Floods, which generally occur as an outcome of storm systems originating from Bay of Bengal, make Pakistan one of the nations where the most people are vulnerable to floods each year. Pakistan’s terrain is diverse, including numerous glaciers in the north, dry deserts and productive agricultural plains in the middle, and big cities like Karachi that are near to the sea and will be negatively impacted by rising sea levels (Eckstein et al., 2021). Due to its conditions, climate and ecology, Pakistan continues to experience flooding each year and the intensity of the disaster is increasing every passing year.
Mianwali is one of Punjab’s poorest districts, ranking on the Multi-Dimensional Poverty Index; it is 29th out of 36 poor districts (Sathar et al., 2018). District of Mianwali is generally susceptible to floods along with inundation throughout the period of monsoon season. Mianwali District is more vulnerable to river flooding and overflow during the monsoon months. During the past decade the study area in Mianwali has been an area of frequent flood events where the floods have hit frequently in last decade including a super flood of 2010. Consequently, the major cause of the sublimed economic and social conditions of communities in the study area, has been mainly due to floods. Floods have plagued the Mianwali area for many years, and they are regarded as big events that have a significant impact on the local populations on a huge scale. Mianwali District in Pakistan was one of the most severely impacted districts during the 2010 catastrophe, mostly due to health-related and infrastructure losses.
The combination of Geographical Information System (GIS) and Remote Sensing (RS) data, along with other datasets, has immense potential in the modern era of technology for identifying, monitoring, and assessing flood disasters (Pradhan et al., 2009). Data-driven models present a very crucial substitute for developing relationship between input and output data without the need for detailed understanding of underlying physical processes (Li et al 2023). To investigate the extent to which the floods have contributed to this socioeconomic loss in the study area, remote sensing methods were implemented to identify the magnitude of the floods. Subsequent to flooding disasters, satellite images provide valued information obligatory for producing flood extent maps. To achieve this objective, we utilized MODIS remote sensing products and the Google Earth Engine Platform to analyze the time series data related to flooding events. In the last decade (2010–2020), the cloudiness increased by more than 15% (Valjarević et al., 2022).
Very few studies have been conducted for flood extent mapping assessment in the Mianwali region which is one of the main flood prone areas of Pakistan. A very few numbers of researchers have addressed the susceptibility of this region to flooding and have been affected by major floods of Pakistan like 2010. However, in this region, no proper study on vulnerability assessment and flood extent mapping have been done so far. The present study was led: To measure flood extent mapping of the Mianwali region by using MODIS and NDWI technique; to analyze flood hazard vulnerability of Mianwali region; to develop cumulative flood risk map for 10 years (2010–2020).
2 Materials and methods
2.1 Description of study area
District Mianwali is situated in the north-western part of Punjab Province, representing the western plains of the salt-ranges and located near the Sakesar hill. Geographically district Mianwali lies between 32° 30′and 33° 14′N. and 71° 7′and 71° 44′E., covering an area of 5840 square KM. (Government of Punjab, 2010). Figure–1 demonstrates the map of the study region. Climate of the district is severe with cold winters with little rain and extended hot summer. The summer months of June and July sizzle with scorching temperatures reaching a mean maximum of 48°C. In contrast, the winter months of December and January bring chilly weather with a mean minimum temperature of 4°C–5°C. During the monsoon season, this district is traditionally vulnerable to floods and overflow.
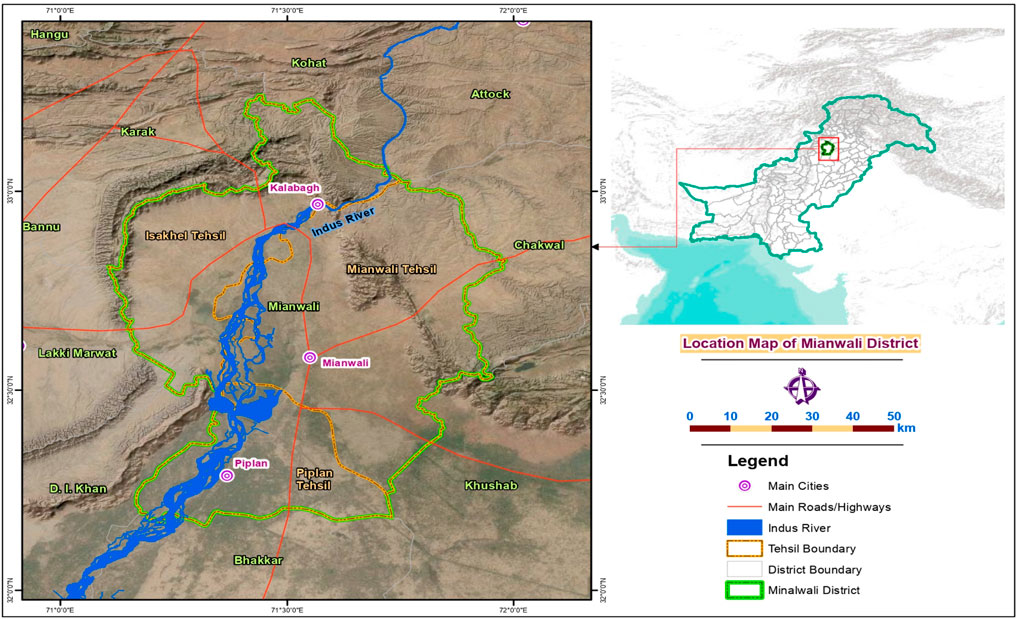
FIGURE 1. Study area map of mianwali.
2.2 Data description
For Flood Extent Mapping, MODIS Product “MODIS Combined 16-Day NDWI” was used. This product is generated from the MODIS/MCD43A4 surface reflectance composites and provide a single NDWI value for 16 daily composite images (Earth Data Catalogue).
2.3 MODIS and NDWI
During the past decade the study area in Mianwali has been an area of frequent Flood events where the Floods have hit frequently in last decade including a super flood of 2010. Consequently, the major cause of the sublimed social and economic conditions of communities in the study area, has been mainly due to floods. To investigate the extent to which the floods have contributed to this socioeconomic loss in the study area, remote sensing techniques were used to identify the extent of the floods. Subsequent to flooding disasters, satellite images provide valued information obligatory for producing flood extent maps. Therefore, for this purpose, the MODIS remote sensing products along with the Google Earth engine Platform were used to analyze the time series data pertaining to the flooding events.
MODIS (Moderate Resolution Imaging Spectroradiometer) is a multispectral satellite remote sensing platform with two satellites, namely, AQUA and TERAA which provide Earth observations images with the spatial resolution in three different ranges of resolutions, i.e. 250 m, 500 m, and 1 km. Because of its temporal and spectral resolution by visiting the Earth every 1–2 days and obtaining statistics in 36 spectral bands the MODIS Images and derived data products, it is the most widely used satellite platform in Earth observations [NASA].
2.3.1 Products and methods
For the purpose of the Flood Extent Mapping MODIS Product “MODIS Combined 16-Day NDWI” was used. This product is generated from the MODIS/MCD43A4 surface reflectance composites and provide a single NDWI value for 16 daily composite images (Earth Data Catalogue).
NDWI stands for Normalized difference vegetation index is widely used for the detection of the surface water bodies (Emre et al). The NDWI index was proposed by McFeeters in 1996. Its primary use today is to detect and monitor changes in water content of the water bodies. Using NIR (near-infrared) and GREEN (visible green) spectral bands, the NDWI is used to highlight water bodies in a satellite image (ESA).
Numerous studies have been conducted in investigating flood inundation extent using MODIS imagery. (Huete et al). McFeeters used Normalized Difference Water Index (NDWI) to detect inundation. (Chang etal).
NDWI equation for calculating the Index is:
The NDWI uses visible green wavelengths, that maximize the typical reflectance of the water surface. The near-infrared wavelengths maximize the high reflectance of terrestrial vegetation and soil features, while minimizing the low reflectance of water features. The result of the NDWI equation is positive values for water features and negative ones (or zero) for soil and terrestrial vegetation.
To analyze the data in time series Google Earth Engine Platform Is used to process and analyze large scale data sets from July to August (2010–2020) which is the flooding season in Pakistan due to ongoing monsoon and glacial melting feeding the rivers with increased flow.
2.3.2 NDWI work flow
To identify subtle changes in water content of surface water bodies, the Normalized Difference Water Index (NDWI) is widely utilized. McFeeters introduced the NDWI index back in 1996, and it remains a valuable tool for identifying and monitoring changes in water content within water bodies. The NDWI index can identify water bodies in satellite images by analyzing the near-infrared (NIR) and visible green (GREEN) spectral bands (Figure 2A). However, the index is susceptible to overestimating water bodies due to man-made structures.
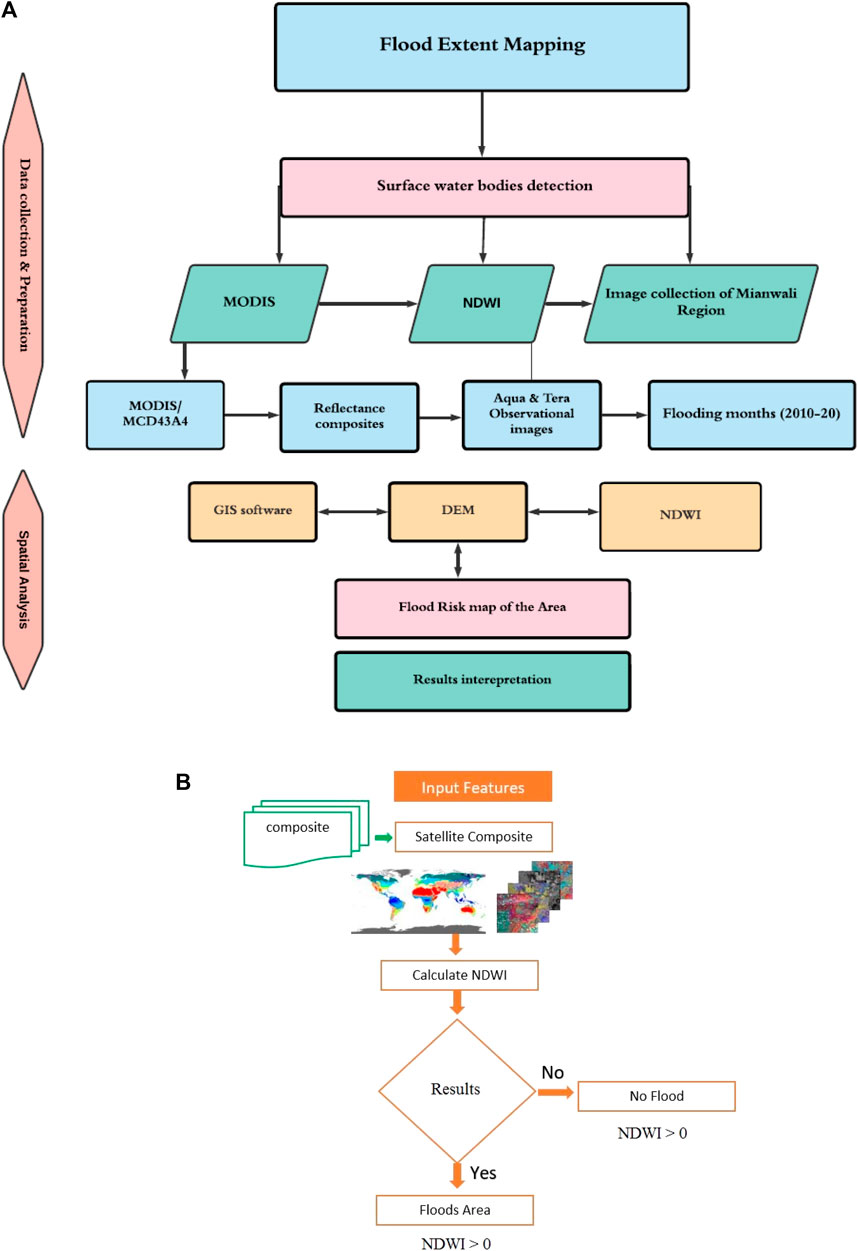
FIGURE 2. (A) Methodology flow chart adopted in Study. (B) NDWI workflow.
Numerous studies have been led for investigating extent of floods using MODIS imagery (Peng et al., 2011). McFeeters utilized the Normalized Difference Water Index (NDWI) to identify areas of inundation (Li et al., 2022).
NDWI equation for calculating the Index is:
For Landsat 7 data:
For Landsat 8 data:
For Sentinel 2 data:
By analyzing the visible green wavelengths, the NDWI maximizes the reflection of water surfaces. Simultaneously, the near-infrared wavelengths minimize the low reflectance of water and enhance the reflectance of soil and vegetation. The NDWI index is used whenever it is necessary to locate a water body, make its map outline more distinct, and keep track of changes in its clarity. Water reflects almost no light in the infrared and beyond the visible spectrum. The NDWI effectively utilizes this characteristic to identify water bodies on a map and track turbidity.
2.4 NDWI values interpretation
Water bodies typically have values above 0.5, while vegetation has much lower values, making it easier to distinguish between them. Developed features have positive values ranging from 0 to 0.2.
The NDWI values can be categorized into the following ranges:
0.2—1—Water surface,
0.0—0.2—Flooding, humidity,
−0.3 – 0.0—Moderate drought (non-aqueous surfaces).
−1—−0.3—Drought (non-aqueous surfaces).
2.5 NDWI data visualization
Graphs and maps are used to visually represent the changes in values over time as a curve, using data extracted from satellite images through the NDWI index. Values below 0, extending to −1, generally indicate drought conditions, unless the area is non-aqueous. The NDWI utilizes visible green wavelengths to enhance the reflection of water surfaces. The near-infrared wavelengths enhance the reflection of land vegetation and soil, while reducing the reflection of water. On a map, higher values approaching +1 usually appear blue and represent high water content or a water surface, while negative values or zero indicate soil and land vegetation.
To analyze the data in time series Google Earth Engine Platform was used to process and analyze large scale data sets from July to August (2010–2020) which is the flooding season in Pakistan due to ongoing monsoon and glacial melting feeding the rivers with increased flow. Methodology adopted in study has been illustrated in Figure 2B.
2.6 Spatial analysis
Once the flood prone areas were identified, then the resultant raster layers were exported for further spatial analysis using GIS software to develop flood extent maps and identification of the affected communities.
2.7 Conversion of raster layers into vector layers
The identified flood extents from the Google Earth Engine were exported for further analysis. The raster layers obtained were converted to vector layers to create smother polygons by creating buffer. Buffer creates polygons that extend a certain distance from a feature that is a point, line, or polygon. Typically, buffers are used to create regions that can be further analyzed with a programme like Overlay Layers (Figure 3).

FIGURE 3. Buffer illustration.
Based on the land use analysis, it can be observed that the study area is primarily characterized by agricultural land, therefore, the area where the higher values of the NDWI were identified was classified as flood waters. The succeeding areas where the higher NDWI values depicted higher values falling in the agricultural land were classified as a mixed zone where the values could depict shallow floods/higher plant water content or very high values of soil moisture. Later, a digital elevation model (DEM) was utilized to precisely determine the extent of the flooded areas and exclude higher elevation regions with a lower possibility of floodwater. A digital elevation model (DEM) shows the Earth’s bare ground surface, excluding trees, structures, and other objects.
Once the flood prone areas were identified, then the resultant raster layers were exported for further spatial analysis using GIS software to develop flood extent maps and identification of the affected communities.
The identified flood extents from the Google Earth Engine were exported for further analysis. The raster layers obtained were converted to vector layers to create smother polygons by creating buffer. The land use analysis depicts that the study area is mainly dominated by agriculture land. As the NDWI values vary between +1 and −1 therefore the area where the higher values of the NDWI were close to 1 were identified and classified as the flood waters. The succeeding areas where the higher NDWI values depicted higher values falling in the agriculture land were classified as a mixed zone. These values could depict shallow floods/higher plant water content or very high values of soil moisture. Later digital elevation model (DEM) was also used to identify the exact extent of the flooding waters and mask out areas of higher elevation where the possibility of the flood water is lowest.
2.8 Flood elevation during 2010–2020 and hazard estimation
Lastly, a cumulative Flood Risk Map was produced by combining all extents identified during the flooding events 2010–20. The cumulative Flood Risk zones were classified as High-Risk Zones and Mixed Zones based on the NDWI values.
3 Results and discussions
Timely and thorough reports of the floods are needed by the disaster management specialists for the identification and location of the places affected by floods and also for the implementation of mitigation strategies to combat the damages caused by floods. Cumulative flood extent mapping was done for this purpose.
Elevation factor and land use distribution are important factors in flood occurrences.
3.1 Elevation profile of mianwali district
Among the different factors involved in flood occurrences and their causes, elevation is a major factor as the pattern of flow of water is from higher places to lower areas (Sahana and Patel, 2019). Figure 4 tells us about the elevation profile of Mianwali region that ranges from maximum 1515m–162 m.
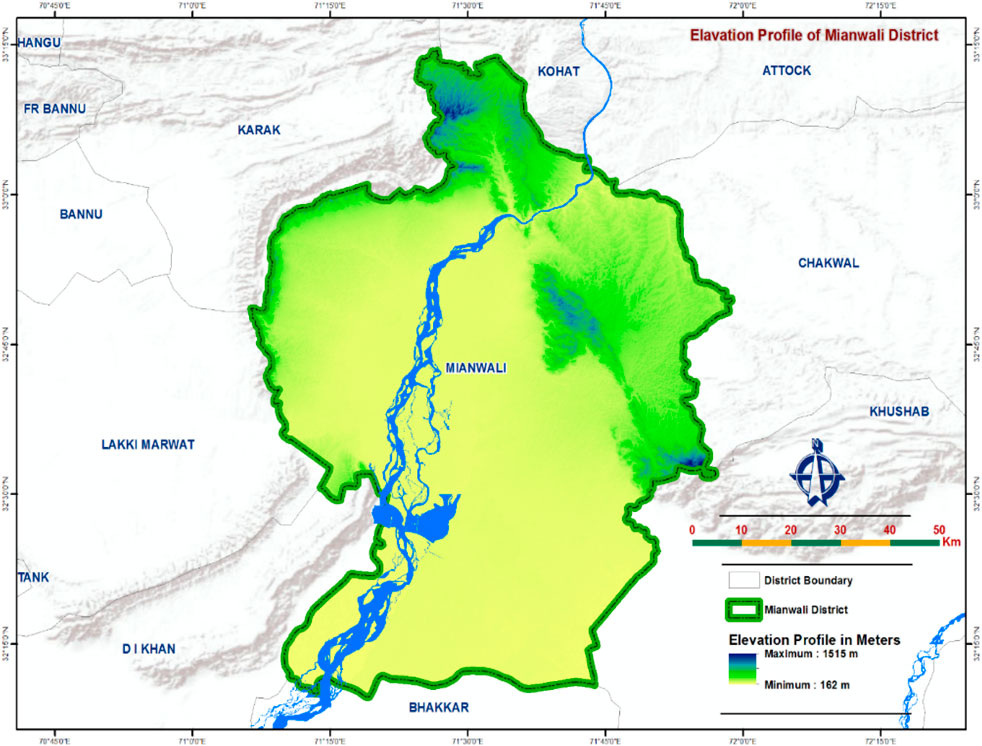
FIGURE 4. Elevation profile of Mianwali district.
Elevation map of the Mianwali region shows its elevation profile. And elevation of any area is always calculated before flood risk assessment because it plays a vital part in calculating the water flows and analysis of catchment areas. In flood situations, elevation plays a crucial role as water naturally flows from higher areas to lower land areas (Sahana and Patel, 2019).
3.2 Land use distribution map of mianwali district
The apparent land cover of the area under study is dominated by Agriculture upon which livelihood of the communities depend. Figure 5 showing Land use/Land cover of Mianwali district showing percentages of land use distribution among different categories. It is clear from Figure 6 about the land use distribution map that major land use percentage of the study area goes for agriculture covering 63.89% of the total land.
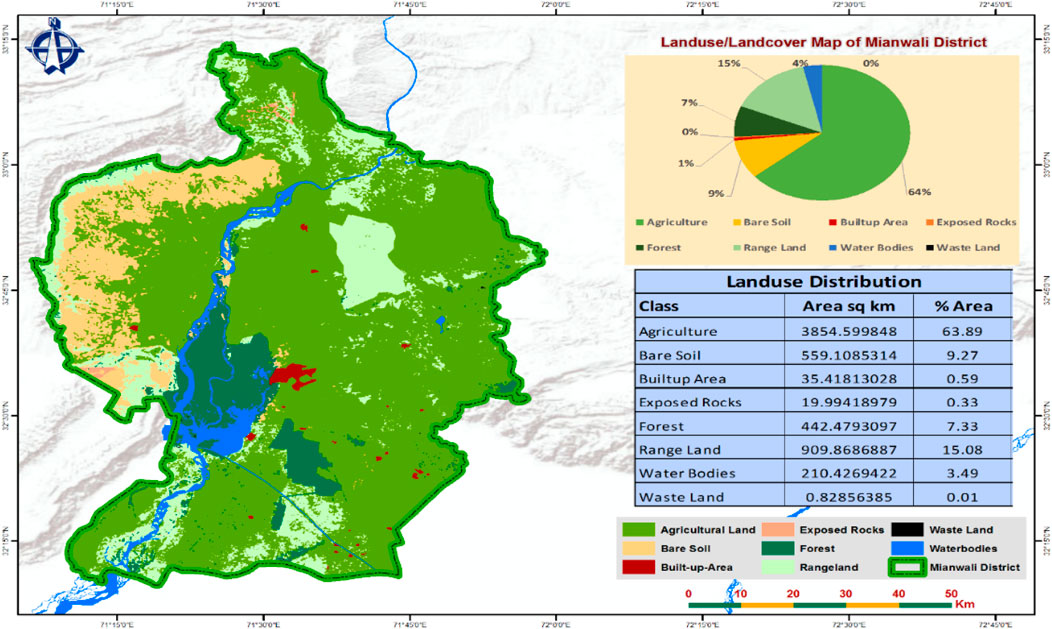
FIGURE 5. Land use/land cover of Mianwali district showing percentages of land use distribution among different categories.
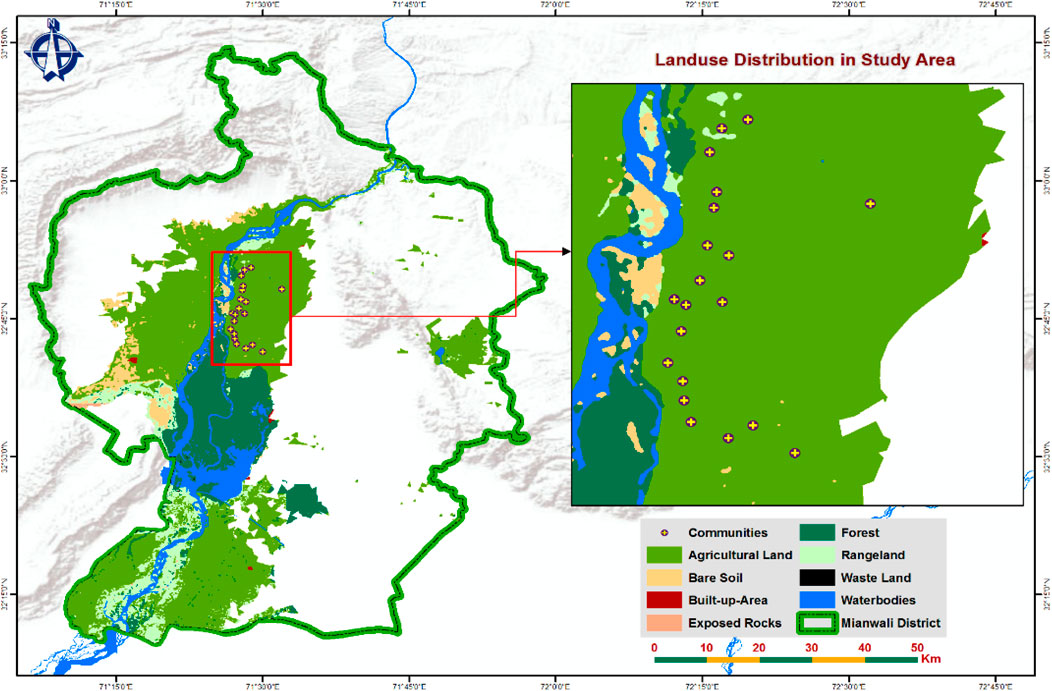
FIGURE 6. Land use distribution of the study area showing the major area percentage is agricultural land.
3.3 Flooding events in mianwali from 2010–2020
Table 1 shows the total record of the flooding events in the project area for the period of 2010–2020. It is evident from Table 1 that 7 out of total communities in the project lies in High Flood zone where they have been hit by a high flood more than once in last decade. These communities are extremely vulnerable to flood catastrophe and can suffer heavy socio-economic losses in future. Moreover, extreme events due to climatic changes in the upper Indus Basin like heavy rainfall and accelerated glacial melts could also trigger the intensified flood events. The rest of the communities which lie in the mixed zone also suffer heavy losses due to floods. The situation in these areas become extremely vulnerable especially for live stalk which is a major source of income of these communities. The high moisture and mud like conditions trigger fatal animal diseases and limited supply of feed for the live stalk which in turn result in the economic loos for these communities. Due to higher soil moisture the poor crop yield is also observed in the project area. As maize and wheat are the major crops of these communities which are used for animal feed and food self-sufficiency therefore these flooding events also put the food security of these communities at risk. The delayed sowing, and crop damage is also observed during these flooding events in the project area.
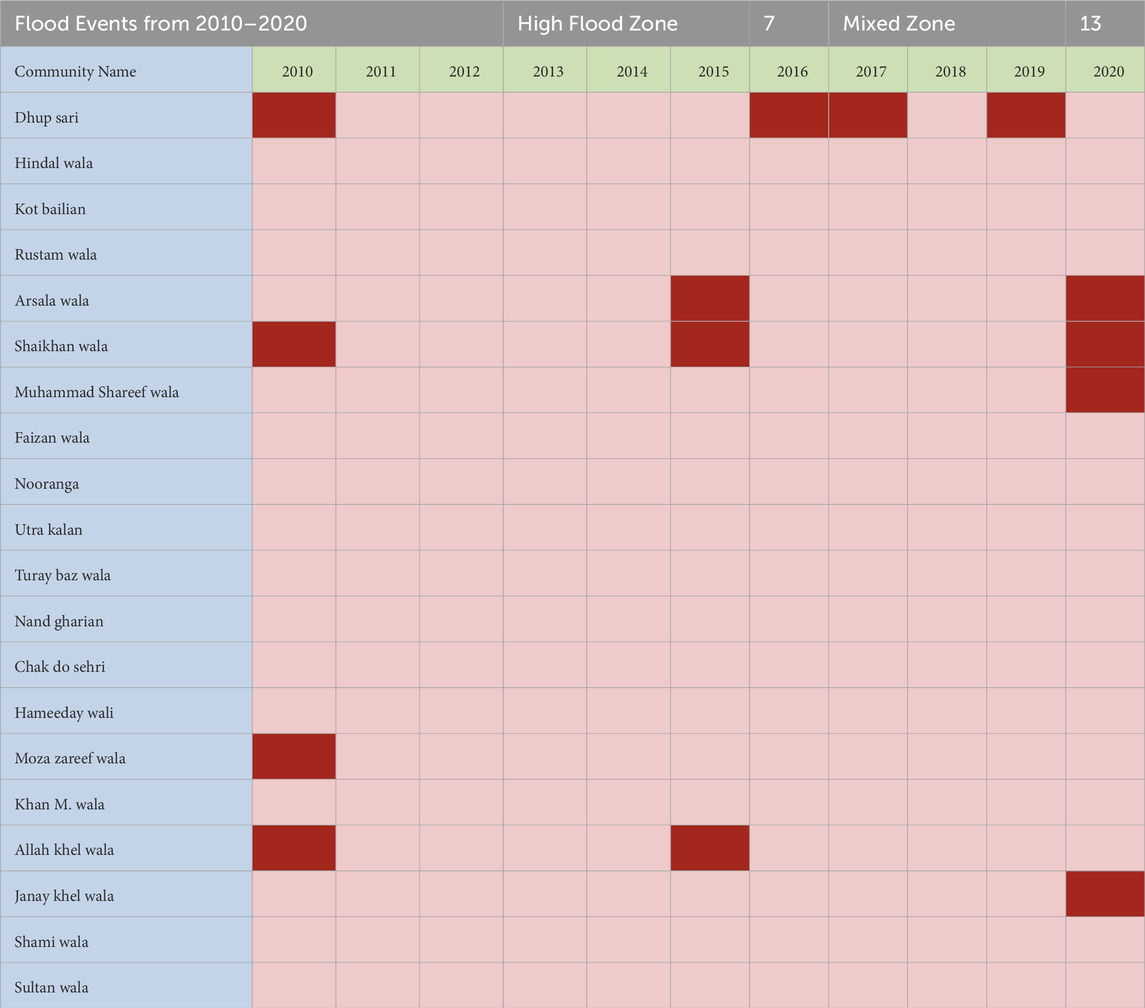
TABLE 1. Total record of the flood events in the project area for the period of 2010–2020.
Rainfall serves as the only source of water in the study area and the main months of high rainfall are the monsoon months, i.e., July and August. The main cause of flash floods in the regions lying nearby River Indus is sudden rainfall. This was also reported in previous studies that in semi-arid regions the main cause of flash floods is sudden rainfall due to Asian monsoon (Acharya et al., 2019).
In the study area, glacial melts and rainfall in the catchment of the Upper Indus Basin are the primary factors that contribute to high flows in the Indus River, especially in months of high rainfall, i.e., July and August due to monsoon. The main cause of flash floods in the regions lying nearby River Indus is sudden and intense rainfall. This was also reported in previous studies that in semi-arid regions the main cause of flash floods is sudden rainfall due to Asian monsoon (Das, 2018). Flooding has been found to have a correlation with rainfall through various studies (Hong et al., 2018; Acharya et al., 2019; Sahana and Patel, 2019).
3.4 Flood extent mapping
Flood extent maps were developed using tools of remote sensing for understanding and observing the spatial and progressive dynamics of the floods in the study region. Results clearly suggest that 7 out of 20 the communities in the study area are located in the High Risk Flood Zone and whereas the remaining 13 communities lies in the Mixed Zone which could be an area with very high soil moisture due to shallow flooding.
The most significant objective of flood extent mapping is to mark out the zones that have frequently been struck by the floods in the past and are likely to be vulnerable to hazards caused by floods. In this study, the flood hazard areas have been divided into five subclasses of hazard zones: very high, high, medium, low, and very low. For the purpose of this research, they have been classified as high flood risk zones and shallow flood risk zones. The villages lying near the river are highly susceptible to floods and are marked as high flood risk zones as shown in the maps.
In this study, the MODIS Product “MODIS Combined 16-Day NDWI” was used. It is derived from the MODIS/MCD43A4 surface reflectance composites and provides a single NDWI value for 16 daily composite images. To process the data, we utilized the Google Earth Engine platform to analyze the time series data of flood events. This helped us generate flood extent maps from 2010 to 2020. The flood risk maps were generated for the months of July and August because major flood events in the study area have been recorded in these months. The flood extent maps of years 2010, 2011, 2012, 2013, 2014, 2015, 2016, 2017, 2018, 2019 and 2020 were developed as shown in Figure 7 and Figure 8. These flood extent maps clearly show the villages of study area which are coming in high flood risk zones and those which lie in shallow flood risk zones. According to the current study, the villages of Dhup Sari, Sheikhan Wala, Arsala Wala, Moza Zareef Wala, Allah Khel Wala, and Janay Khel Wala are situated next to the Indus River, making them highly susceptible to flooding and at great risk.
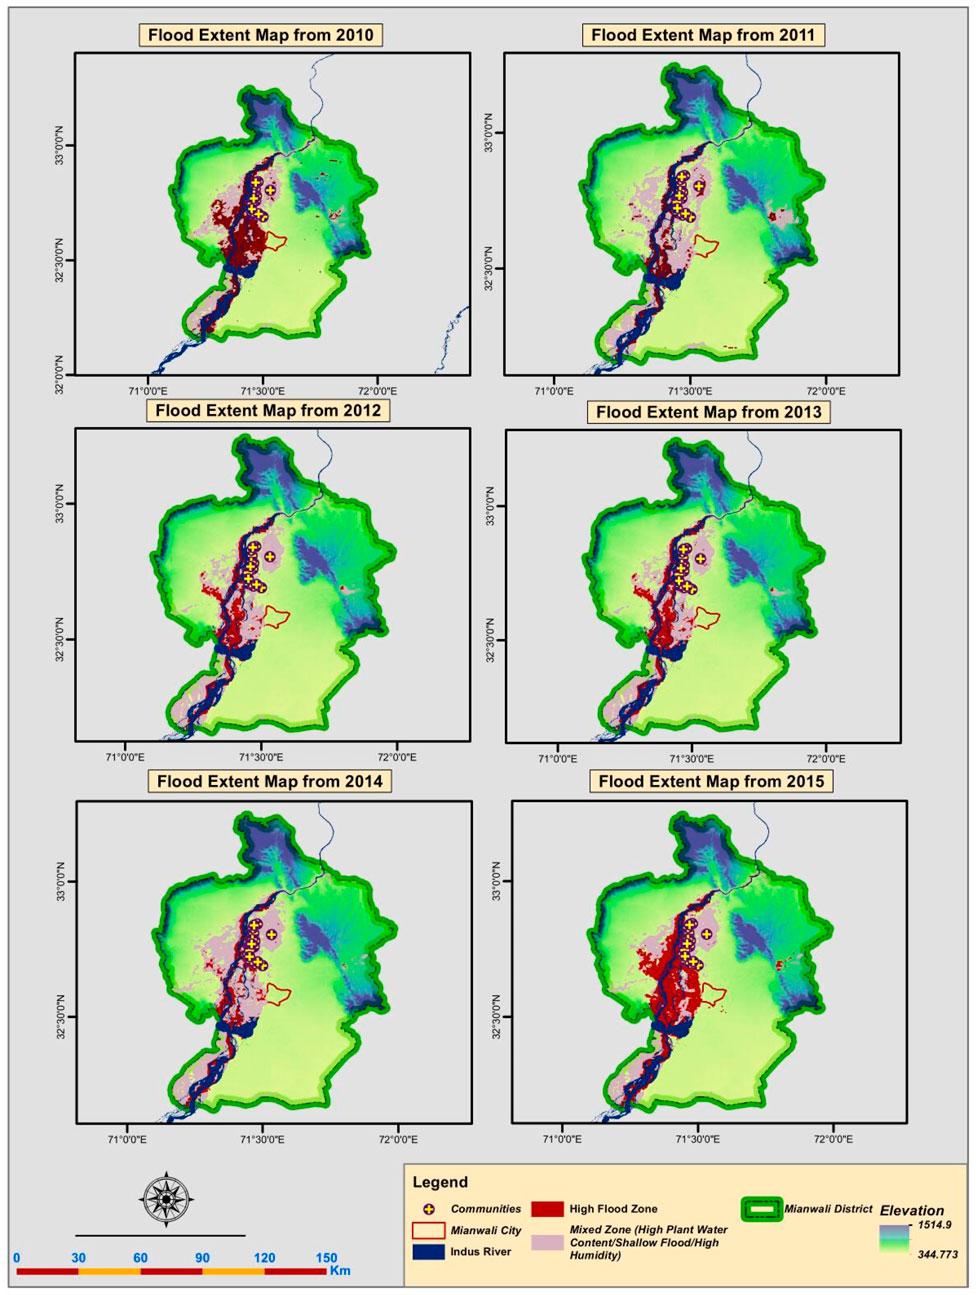
FIGURE 7. Flood extent maps for year 2010, 2011, 2012, 2013, 2014, and 2015.
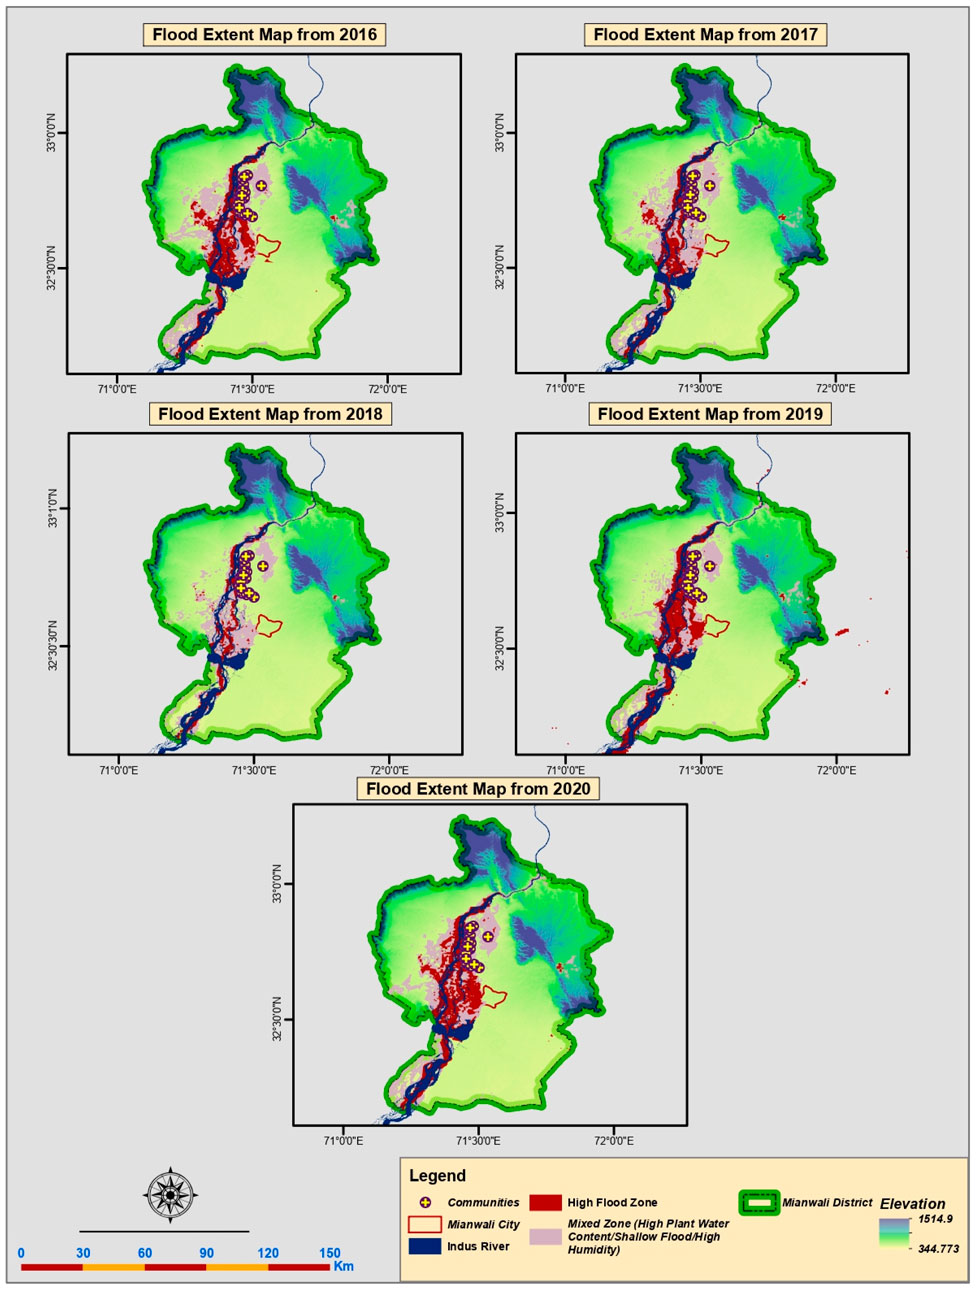
FIGURE 8. Flood extent maps for the year 2016, 2017, 2018, 2019, and 2020.
According to the study, Mianwali is at high risk of flooding due to its geographical location and lack of pre-disaster preparedness measures. Floods are a recurring event in the Mianwali district during the monsoon season, happening almost every year. The intensity of the hazard usually ranges from moderate to severe. Figure 7, the flood extent map of 2010, clearly indicates that the Mianwali district was severely impacted, with significant health-related and infrastructure damages.
Pakistan is an agricultural nation with a vast and strategic network of rivers and canals. Unfortunately, because of negligence and lack of proper maintenance, flooding has had a significant impact on millions of people. The province of Punjab was severely affected by the 2010 flood in Pakistan, which was caused by heavy rainfall during the monsoon season. The flood shattered all previous records, surpassing not only in rainfall and discharge but also in terms of the devastating loss of life and property. The 2010 flood had a significant impact on Mianwali, accounting for nearly 6% of the province’s damage. This warning condition indicates that the flood may continue to occur more aggressively in the coming years, much like it did in 2010. The flooding was primarily triggered by the intensified rainfall, which was a result of climate change in the region. Flood extent maps play a crucial role in minimizing the devastating impacts of floods. They are considered the primary and essential tool for assessing flood damages (Haq, 2011; Houze et al., 2011).
The flood extent maps for the study area have been developed for the years 2010–2020 to mark down the high risk areas for prevention of damages in future. Creating hazard maps, as highlighted by Hussain et al. (2021), is crucial in minimizing the impact of disasters in vulnerable areas. These maps help identify and mitigate risks to life and property. Additionally, flood maps serve as valuable guides for development and construction in high-risk flood areas.
3.5 Cumulative flood risk map
A cumulative flood risk map of the study regions was created by combining the flood extents for these 10 years (2010–2020) as shown in Figure 8. The cumulative flood extent map (Figure 9) shows the regions of high flood zone and a mixed zone (Very High Soil moisture due to shallow flooding/High Water Plant Content) which were affected by floods during the period of 10 years. This map is very important because life-threatening weather events due to climate change are intensifying the occurrences of natural disasters specially floods so this map would help us to mark the areas of risk due to floods. And because of this future mitigation measures and planning can be done to avoid the risks and damages. The path of the Indus River through Mianwali has also shown signs of long-term geographical changes as a result of the substantial influx of monsoon rains and river waters over an extended period.
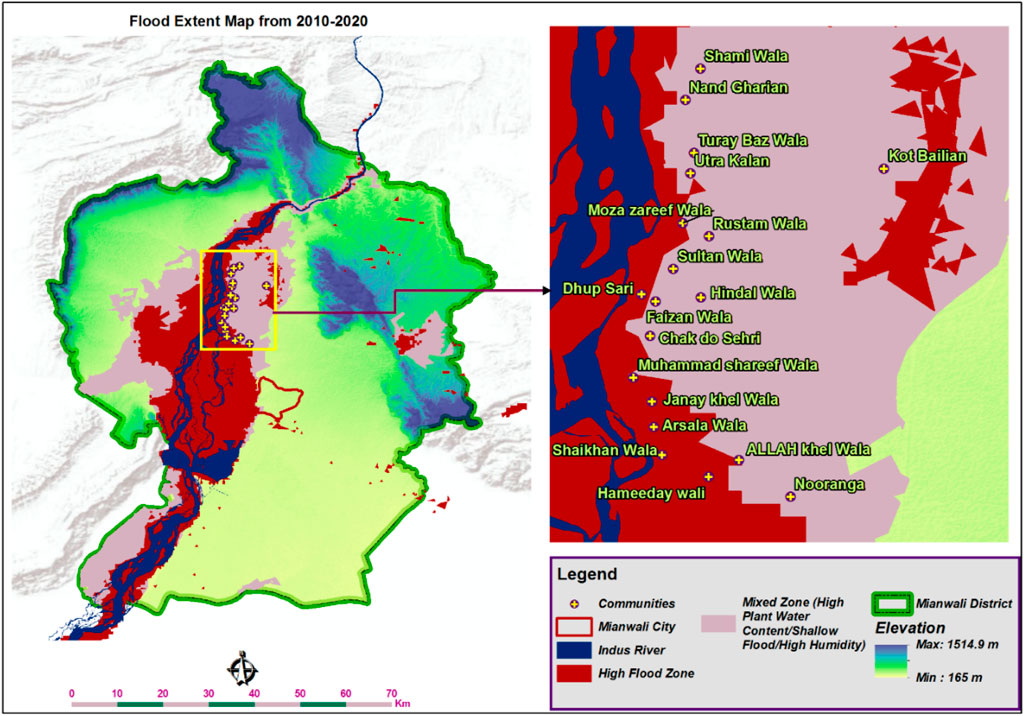
FIGURE 9. Cumulative flood extent map of study area for the period of 2010–2020 showing the regions of high flood zone and shallow flood zone.
The IPCC (Intergovernmental Panel on Climate Change) has anticipated a strong increase in the natural disasters in upcoming years which would be because of complex meteorological conditions and weather patterns. These complex weather patterns would be from variations in the ocean temperatures of the Equatorial Pacific that could upset the hydrological assets. Pakistan in specific, too would be facing the consequence of climate change due to the shrinkage in its hydrological reserves. According to sixth report of IPCC, Pakistan expects an increase in temperature significantly above the worldwide average with an expected rise of 1.3°–4.9°C by the 2090s based over the 1986–2005 reference line. This increase in temperature could top to natural disasters like floods, droughts, high temperatures, health issues, pest viruses, etc., in the approaching years (Hussain, et al., 2021).
If we talk about social dispersion of the targeted study area depending upon our analysis of past 10 years and vulnerability capacity assessment of the locals, it is very necessary to take immediate actions. We came to the conclusion that six communities of our study area are extremely vulnerable and susceptible to floods. So, in order to avoid future calamites and losses we should displace them to safer places. The mitigation and adaptation strategies of other fourteen areas should also be considered and the actions should be taken. Most of these communities are dependent on agriculture for their economic circle.
According to IPCC’s sixth report, the occurrence and strength of dangerous climate events In Pakistan is estimated to rise, increasing the risk of natural disasters mainly for vulnerable underprivileged and smaller groups. A possible increase of around 5 million people exposed to life-threatening river floods by 2035–2044 and a probable increase of around 1 million yearly exposed to seaside flooding by 2070–2100 was projected by IPCC. According to this future predictions, if we relate our research findings about our study area then there will be more intense floods in future. And as we know that our study area was already highly vulnerable so it is high need to displace the communities to some safer places timely.
Satellite images taken for our research and flood risks maps of these vulnerable areas are giving alarms to take possible measures. And the future projections of IPCC are very alarming so it is high time to make social and economic establishment reforms to avoid the damages caused by floods in future. There is a serious need for advance research and provision of effective adaptation and measures for disaster risk reduction.
Work by Willner et al., 2018 approximates that by 2035–2044 an additional 5 million people will be harmed by Extreme River flooding each year in Pakistan. Pakistan’s mountain areas also hold vulnerability to glacial lake outpouring floods, caused by ice melting due to increase in temperature. With an unclear future of temperature rises and fluctuations in the precipitation patterns, there is high need for additional inquiry and preventative measures for disaster risk reduction. Population settlements should be restricted in these vulnerable areas should be restricted by the responsible agencies.
4 Discussion
According to Figure 6, it is can be clearly seen that majority of the Landuse in the vicinity of the study area is agriculture land.
The livelihoods of the communities in the project area are mainly dependent on the agriculture and Live stalk. The Table 1 shows the total record of the flooding events in the project area.
The livelihoods of the communities in the project area are mainly dependent on the agriculture and livestock.
It is evident that 7 out of total communities in the project lies in High Flood zone where they have been hit by a high flood more than once in last decade. These communities are extremely vulnerable to flood catastrophe and can suffer heavy socio-economic losses in future. Moreover, extreme events due to climatic changes in the upper Indus Basin like heavy rainfall and accelerated glacial melts could also trigger the intensified flood events. The rest of the communities which lie in the mixed zone also suffer heavy losses due to floods. The situation in these areas become extremely vulnerable especially for live stalk which is a major source of income of these communities. The high moisture and mud like conditions trigger fatal animal diseases and limited supply of feed for the live stalk which in turn result in the economic loos for these communities. Due to higher soil moisture the poor crop yield is also observed in the project area. As wheat and the maize are the major crops of these communities which are used for animal feed and food self-sufficiency therefore these flooding events also put the food security of these communities at risk. The delayed sowing, and crop damage is also observed during these flooding events in the project area.
5 Conclusion
Using satellite data for flood monitoring has been a successful approach in rapidly and accurately assessing flooded regions. In the study, remote sensing and geographic information systems (RS and GIS) were utilized to promptly analyze and identify flood-affected areas, as well as land use and land cover features. To estimate damages, the approach involved overlaying processed satellite images with population density data and land use/land cover maps. This method yielded results within a few hours and allowed for swift damage assessment. The study aimed to assess flood hazards and create flood-prone zone maps in Mianwali, Pakistan. The rest of the communities which lie in the mixed zone also suffer heavy losses due to floods. It was also concluded that the soil and agricultural areas also get affected each year and the fertility of the soil is lost to much extent. By integrating remote sensing, geospatial techniques, and the RFR method, the researchers evaluated and mapped areas susceptible to flooding. Eight conditioning factors, including slope, elevation, TWI, LULC, NDVI, drainage density, curvature, and rainfall, were utilized to generate flood susceptibility maps. The flood susceptibility map created in this study is a valuable resource for disaster managers, decision-makers, and engineers in developing flood risk management plans. The study’s findings can aid authorities in implementing effective measures to mitigate and prepare for the impact of both present and future floods.
Data availability statement
The raw data supporting the conclusion of this article will be made available by the authors, without undue reservation.
Author contributions
AfA: Conceptualization, Data curation, Formal Analysis, Investigation, Methodology, Software, Validation, Visualization, Writing–original draft, Writing–review and editing. AT: Supervision, Writing–review and editing. AsA: Conceptualization, Supervision, Validation, Writing–review and editing.
Funding
The author(s) declare that no financial support was received for the research, authorship, and/or publication of this article.
Acknowledgments
Authors are grateful to all the members of the Department of Environmental Sciences, Lahore College for Women University, Lahore, for their support and help during this research.
Conflict of interest
The authors declare that the research was conducted in the absence of any commercial or financial relationships that could be construed as a potential conflict of interest.
Publisher’s note
All claims expressed in this article are solely those of the authors and do not necessarily represent those of their affiliated organizations, or those of the publisher, the editors and the reviewers. Any product that may be evaluated in this article, or claim that may be made by its manufacturer, is not guaranteed or endorsed by the publisher.
References
Acharya, R., Pal, J., Das, D., and Chaudhuri, S. (2019). Long-range forecast of Indian summer monsoon rainfall using an artificial neural network model. Meteorol. Appl. 26 (3), 347–361. doi:10.1002/met.1766
Alahacoon, N., Matheswaran, K., Pani, P., and Amarnath, G. (2018). A decadal historical satellite data and rainfall trend analysis (2001–2016) for flood hazard mapping in Sri Lanka. Remote Sens. 10, 448. doi:10.3390/rs10030448
Belabid, N., Zhao, F., Brocca, L., Huang, Y., and Tan, Y. (2019). Near-real-time flood forecasting based on satellite precipitation products. Remote Sens. 11, 252. doi:10.3390/rs11030252
Bisht, D. S., Chatterjee, C., Kalakoti, S., Upadhyay, P., Sahoo, M., and Panda, A. (2016). Modeling urban floods and drainage using swmm and mike urban: a case study. Nat. Hazards 84, 749–776. doi:10.1007/s11069-016-2455-1
Charlton, R., Fealy, R., Moore, S., Sweeney, J., and Murphy, C. (2006). Assessing the impact of climate change on water supply and flood hazard in Ireland using statistical downscaling and hydrological modelling techniques. Clim. change 74 (4), 475–491. doi:10.1007/s10584-006-0472-x
Das, S. (2018). Geographic information system and AHP-based flood hazard zonation of Vaitarna basin, Maharashtra, India. Arabian J. Geosciences 11 (19), 576. doi:10.1007/s12517-018-3933-4
Eckstein, D., Künzel, V., and Schäfer, L. (2021). The global climate risk index 2021. Bonn: Germanwatch.
Guo, E., Zhang, J., Ren, X., Zhang, Q., and Sun, Z. (2014). Integrated risk assessment of flood disaster based on improved set pair analysis and the variable fuzzy set theory in central Liaoning Province, China. Nat. hazards 74, 947–965. doi:10.1007/s11069-014-1238-9
Haq, S. M. A. (2011). Urban green spaces and an integrative approach to sustainable environment. J. Environ. Prot. 2 (5), 601–608. doi:10.4236/jep.2011.25069
Hong, H., Panahi, M., Shirzadi, A., Ma, T., Liu, J., Zhu, A. X., et al. (2018). Flood susceptibility assessment in Hengfeng area coupling adaptive neuro-fuzzy inference system with genetic algorithm and differential evolution. Sci. total Environ. 621, 1124–1141. doi:10.1016/j.scitotenv.2017.10.114
Houze, R. A., Rasmussen, K. L., Medina, S., Brodzik, S. R., and Romatschke, U. (2011). Anomalous atmospheric events leading to the summer 2010 floods in Pakistan. Bull. Am. Meteorological Soc. 92 (3), 291–298. doi:10.1175/2010bams3173.1
Hussain, M., Tayyab, M., Zhang, J., Shah, A. A., Ullah, K., Mehmood, U., et al. (2021). GIS-based multi-criteria approach for flood vulnerability assessment and mapping in district Shangla: khyber Pakhtunkhwa, Pakistan. Sustainability 13 (6), 3126. doi:10.3390/su13063126
Khan, A. N. (2013). Analysis of 2010-flood causes, nature and magnitude in the Khyber Pakhtunkhwa, Pakistan. Nat. hazards 66 (2), 887–904. doi:10.1007/s11069-012-0528-3
Khosravi, K., Nohani, E., Maroufinia, E., and Pourghasemi, H. R. (2016). A GIS-based flood susceptibility assessment and its mapping in Iran: a comparison between frequency ratio and weights-of-evidence bivariate statistical models with multi-criteria decision-making technique. Nat. hazards 83, 947–987. doi:10.1007/s11069-016-2357-2
Li, C., Wang, W., Gao, J., and Liu, Z. (2023). A hybrid rainfall-runoff model: integrating initial loss and LSTM for improved forecasting. Front. Environ. Sci. 11, 1261239. doi:10.3389/fenvs.2023.1261239
Matheswaran, K., Alahacoon, N., Pandey, R., and Amarnath, G. (2019). Flood risk assessment in South Asia to prioritize flood index insurance applications in Bihar, India. Geomat. Nat. Hazards Risk 10, 26–48. doi:10.1080/19475705.2018.1500495
Peng, D., Huete, A. R., Huang, J., Wang, F., and Sun, H. (2011). Detection and estimation of mixed paddy rice cropping patterns with MODIS data. Int. J. Appl. Earth Observation Geoinformation 13 (1), 13–23. doi:10.1016/j.jag.2010.06.001
Pradhan, B., Shafiee, M., and Pirasteh, S. (2009). Maximum flood prone area mapping using RADARSAT images and GIS: kelantan river basin. Int. J. Geoinformatics 5 (2).
Rai, P. K., Singh, P., Mishra, V. N., Kumar, J., and Sahoo, S. (2021). “Monitoring North Bihar flood of 2020 using geospatial technologies,” in It is correct recent technologies for disaster management and risk reduction; earth and environmental Sciences library (New York, NY, USA: Springer International Publishing), 135–155.
Rao, G. N. (2001). Occurrence of heavy rainfall around the confluence line in monsoon disturbances and its importance in causing floods. J. Earth Syst. Sci. 110 (1), 87–94. doi:10.1007/bf02702232
Sahana, M., and Patel, P. P. (2019). A comparison of frequency ratio and fuzzy logic models for flood susceptibility assessment of the lower Kosi River Basin in India. Environ. Earth Sci. 78, 289–327. doi:10.1007/s12665-019-8285-1
Samanta, R. K., Bhunia, G. S., Shit, P. K., and Pourghasemi, H. R. (2018). Flood susceptibility mapping using geospatial frequency ratio technique: a case study of Subarnarekha River Basin, India. Model. Earth Syst. Environ. 4, 395–408. doi:10.1007/s40808-018-0427-z
Sanjrani Manzoor, A., Wajidi, A., Wagan, S. A., Riaz, S., and Siddique, M. (2022). Disaster risk management: focused to flood hazard and its impact in Pakistan. Glob. NEST J. 24. doi:10.30955/gnj.004223
Sathar, Z., Khalil, M., Hussain, S., Sadiq, M., and Khan, K. (2018). Climate change, resilience, and population dynamics in Pakistan: a case study of the 2010 floods in Mianwali District.
Scheuer, S., Haase, D., and Volk, M. (2017). Integrative assessment of climate change for fast-growing urban areas: measurement and recommendations for future research. PLoS One 12 (12), e0189451. doi:10.1371/journal.pone.0189451
Tehrany, M. S., Pradhan, B., and Jebur, M. N. (2013). Spatial prediction of flood susceptible areas using rule based decision tree (DT) and a novel ensemble bivariate and multivariate statistical models in GIS. J. hydrology 504, 69–79. doi:10.1016/j.jhydrol.2013.09.034
Tripathi, G., Parida, B. R., and Pandey, A. C. (2019). Spatio-temporal rainfall variability and flood prognosis analysis using satellite data over north Bihar during the August 2017 flood event. Hydrology 6, 38. doi:10.3390/hydrology6020038
Valjarević, A., Popovici, C., Štilić, A., and Radojković, M. (2022). Cloudiness and water from cloud seeding in connection with plants distribution in the Republic of Moldova. Appl. Water Sci. 12 (12), 262. doi:10.1007/s13201-022-01784-3
Willner, S. N., Otto, C., and Levermann, A. (2018). Global economic response to river floods. Nat. Clim. Change 8 (7), 594–598. doi:10.1038/s41558-018-0173-2
Keywords: flood risk management, MODIS, climate change, risk extent mapping, NWDI techniques
Citation: Akram A, Tahir A and Alam A (2024) GIS based flood extent assessment using MODIS satellite remote sensing and spatial analysis. Front. Earth Sci. 12:1309629. doi: 10.3389/feart.2024.1309629
Received: 08 October 2023; Accepted: 25 January 2024;
Published: 22 February 2024.
Edited by:
Gustavo J. Nagy, Universidad de la República, UruguayReviewed by:
Guy Jean-Pierre Schumann, University of Bristol, United KingdomAleksandar Valjarević, University of Belgrade, Serbia
Copyright © 2024 Akram, Tahir and Alam. This is an open-access article distributed under the terms of the Creative Commons Attribution License (CC BY). The use, distribution or reproduction in other forums is permitted, provided the original author(s) and the copyright owner(s) are credited and that the original publication in this journal is cited, in accordance with accepted academic practice. No use, distribution or reproduction is permitted which does not comply with these terms.
*Correspondence: Afshin Akram, YWZzaGluYWtyYW1AaG90bWFpbC5jb20=; Asifa Alam, QXNpZmFnY3VAeWFob28uY29tQXNpZmEuYWxhbUBnY3UuZWR1LnBr