 Liujun Xie1
 Bo Wang
 Jinwei Fang
94% of researchers rate our articles as excellent or good
Learn more about the work of our research integrity team to safeguard the quality of each article we publish.
Find out more
ORIGINAL RESEARCH article
Front. Earth Sci., 16 April 2024
Sec. Geohazards and Georisks
Volume 12 - 2024 | https://doi.org/10.3389/feart.2024.1307275
The occurrence of major accidents such as water inrush in coal mines and coal-gas outbursts is closely correlated with the unclear exploration of underground geological structures. Seismic exploration in underground coal mines is not limited by ground conditions and close to the detected target, so it has advantages with respect to the detection of underground geological structures. However, the geological structures leading to accidents are usually characterized by small size and diverse combinations, making it difficult to detect. In coal mine working faces, the use of transmission observation systems, combined with full waveform inversion methods, represents a new attempt at finely detecting geological structures. Therefore, a three-dimensional numerical model of an abnormal combination of faults and collapse columns was established, a physical simulation model of a multi-collapse column combination was built, and transmission and detection experiments were carried out. The results show that the morphology and locations of 1 fault and 4 collapse columns obtained by the FWI algorithm are consistent with the data from the actual numerical model. According to physical simulation results, the background velocity of the model after inversions and the velocity of 5 anomalies are consistent with the actual values. Field experiments were conducted in the actual underground coal mines. After verification, the average error ratios of the long axis, short axis and intersection angle of the 4 collapse columns were 0.19, 0.15 and 0.02. The detection findings and comparison results confirm the feasibility of precise detection of geological structures by transmissive seismic waves based on the FWI method.
Driven by a growing demand for coal resources (Yin et al., 2021b), underground mining targets deeper areas of the Earth (XIE et al., 2015; Zhu et al., 2021; Ren et al., 2023), and safety in coal mining has become more important (Yin et al., 2019; Khan et al., 2021). In most cases, the occurrence of many geological disasters in underground mines is caused by unclear exploration of geological conditions (YUAN, 2021). In China, the conditions of geological structures in most mines are very complex (Kong and Wang, 2018). The abnormality of geological structures will result in fractures of coal seams and damage the entirety and continuity of rock strata (Khan et al., 2022). This will further reduce the mining efficiency and cause accidents (Das et al., 2018; Ren et al., 2022; Khan et al., 2024). Hence, a precise detection of various geological structures in underground coal mines is very significant (Yin et al., 2021a; Khan et al., 2023).
In the 1980s, channel waves were introduced into China. Currently, such waves have been used as a crucial method for detecting structures of the working faces in roadways (LI et al., 2017). The seismic wave properties of channel waves are used for underground geological exploration. The most common detection method is to arrange geophone receiver lines and source excitation lines on the working face to carry out CT detections (HU et al., 2013). However, when there are complex geological anomalies on the working face, the channel wave-based detection method is unable to realize accurate detection, failing to identify and interpret the properties of such geological anomalies (Jiao et al., 2023). Besides, this method may be used only in areas where channel waves are developed. When channel waves are not developed, the interpretation of structures may rely on body waves only (WU and MA, 2023).
Seismic inversion refers to reconstruction of an accurate model of underground space by obtaining information about underground space from collected seismic data. It may be applied to various research issues such as the physical properties, structures and distribution of rocks and minerals, and can identify underground structures based on different processing and analysis of different data. Precise detection of geological structures has been an issue for exploring geophysics. Wang (WANG et al., 2012) et al. applied refracted wave tomography to the detection of collapse columns on a working face and well identified the scope of collapse columns. Li (LI, 2016) et al. combined the traditional CT method with a transmitted channel wave-based exploration technique to detect the distribution of hidden geological structures. The facts show that the accuracy of traditional inversion imaging is not high in the detection of complex anomalies. As for traditional seismic inversion, the arrival time of seismic waves such as direct waves, refracted waves and reflected waves are utilized. Different from traditional methods, the FWI method utilizes all the information about kinematics and dynamics contained in the seismic data (Owusu et al., 2016; Klotzsche et al., 2019). Therefore, compared to traditional methods, it can significantly improve resolution (Asgharzadeh and Urosevic, 2018; Aragao and Sava, 2020; Junqiu and Ying, 2023). Since the geological structures developed in coal faces have a direct influence on the mining process and safety during construction, it is particularly important to adopt the FWI method to accurately detect the development conditions of geological structures in the working areas (Virieux and Operto, 2009).
In this paper, a model of a complex anomaly portfolio in the working face and a physical model were established according to the properties of seismic waves excited by the working face floor. FWI was carried out by using the body waves collected in the experiment, and the applied research was conducted by utilizing real seismic data.
FWI is a technique for high-resolution imaging and model reconstruction of underground media based on the propagation of and interaction between seismic waves.
The first step is to initialize a model. Known information is needed to build an underground media model. Then, based on the known seismic source and underground media model, the synthetic seismic data is calculated by using the numerical simulation method. Such data is produced by the propagation of and interaction between seismic waves in the underground media. A comparison of the synthetic seismic data with actually observed seismic data is carried out to calculate the residuals between them. Later, the model is updated by minimizing the residuals and passing back the residuals to the underground media model. An iterative approach is used in this process to repeatedly generate synthetic data, calculate residuals, and update the model until a satisfactory match is achieved. In the iteration process, some conditions can be designed for parameters, such as the value of residuals and the change in model parameters. When these conditions are met, the iteration stops and a model is output. The specific process is shown in Figure 1.
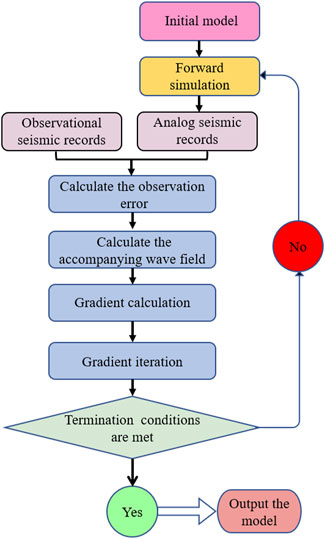
Figure 1. Processing flow of FWI data.
The key to FWI is to constrain the updating of the underground media model by calculating the difference between the synthetic seismic data and the actual observation data. This process requires a highly accurate numerical simulation method for seismic wave propagation and abundant resources for computation. Some key calculation steps (FANG et al., 2022) are shown as follows:
Define the objective function as follows:
Where d refers to observation data; u is synthetic data; x represents computational space; xr means the position parameter of a geophone;
The synthetic data is produced by elastic parameters, and the formula is shown as follows:
Where xs is the coordinate of a shot point; L[·] refers to the forward simulation operator of elastic waves; s(xs,t) represents the source wavelet.
The gradients of model parameters are calculated as follows:
Where
The conjugate gradient method is used for identifying the iterative direction and updating. The formula is as follows:
Where k is the frequency of iteration; mk and mk+1 refer to model parameters of the kth and (k+1)th iterations; tk is the selected update step size.
With faults and collapse columns in the mining face as the research objects, numerical simulation experiments were designed, and a velocity model was established. 45 shots were placed for excitation, and 45 channels were designed for receipt. The channel spacing was 2 m, and the shot interval was 2 m. An observation system was established, as shown in Figure 2A. In the numerical simulation experiment, the Ricker wavelet of 200 Hz was selected. The sampling duration was 150 ms, the sampling interval was 0.1 ms, and the grid size was 0.25 m×0.25 m. PML absorbing boundary was added. For the detection in the working face, transmitted waves were used, and the two-dimensional horizontal section contacted by coal seams and rocks surrounding the floor (as shown in Figure 2B) was selected as the research object. A two-dimensional velocity model of initial inversion was established according to the law of propagation of transmitted waves along the working face floor. The background velocity of the model was 2500 m/s. The velocity of the collapse column velocity model was 3000 m/s, and the velocity of the fault velocity model was 3200 m/s.
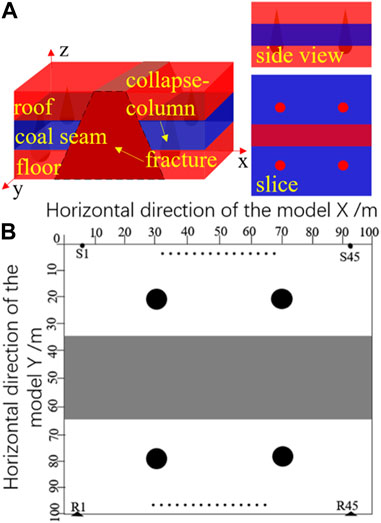
Figure 2. An observation system for slices on the floor of complex combined anomalies. Slices on the floor of complex combined anomalies (A); Observation system (B).
Figure 3 shows the seismic records of two components received at the receiver point. The coordinate of the shot point is (2,0). The X component refers to the horizontal X direction of the model, and the Z component is the horizontal Y direction of the model. The results of comparing the two groups of seismic records reveal that the overall energy of the X-component signals is stronger than that of the Z-component signals, but the energy of initially arriving P-waves is weaker than that of the-Z component waves. And there is partial absence of the event of P-waves. The energy of signals in the Z-component seismic records is weaker than that of signals in the X-component seismic records on the whole, but the energy of P-waves is stronger and the event is more continuous. The seismic records of the two components occur after direct P-waves. While there is superimposition of their subsequent records to varying degrees, making the events discontinuous and difficult to be distinguished. In general, the event of initially arriving P-waves of the Z-component is clear and continuous, and the overall energy of initially arriving signals is relatively even. So, such waves can be selected as the characteristic waves for FWI.
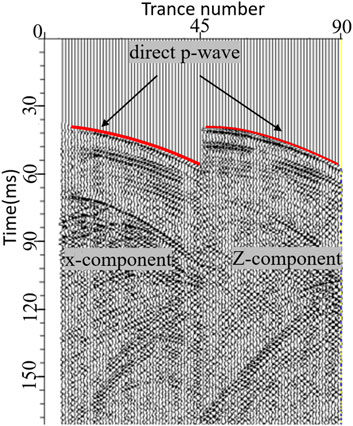
Figure 3. The X-component and Z-component seismic records for the shot point at (2, 0).
Figure 4 refers to the synthetic seismic records in the case of the shot point at (46,0). After a comparative analysis of Figures 4A, B, the conjugate gradient method is used to perform one iterative inversion. The results show that there is a difference between the seismic records in the velocity model after the inversion and those in the real velocity model and a variation in the waveform, event, in-phase status and energy. The residual between the two groups of seismic records is high (Figure 4C), and the degree of fitting is low. Therefore, the effect of velocity models generated by inversion is not reliable when the iteration frequency is low.
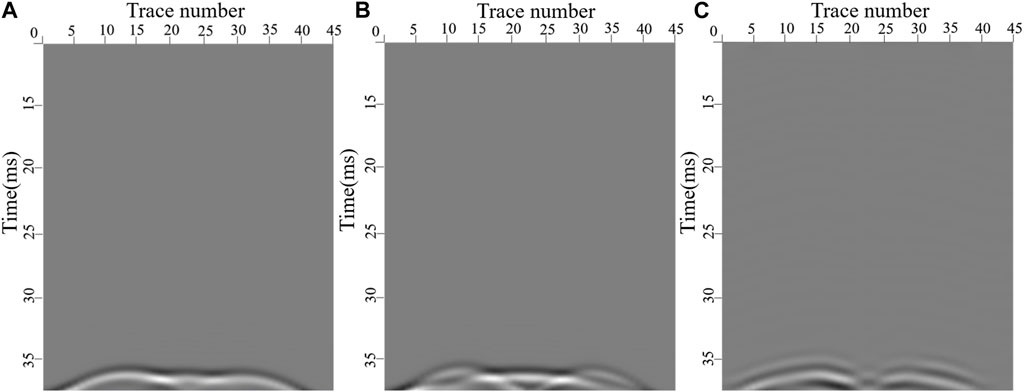
Figure 4. Seismic records after the first iteration for the shot point at (46, 0). Synthetic seismic records (A); Actual seismic records (B); The residual between b and a (C).
Figure 5 refers to the seismic observation records for the shot point at (46,0). Only the part containing information about the waveform of direct P-waves is chosen from the seismic records. After comparing the actual seismic records in Figure 5B with the synthetic seismic records after the 40th iterative inversion of velocity model in Figure 5A, the results disclose a basic consistency in waveform and phase information. The degree of fitting between the two groups of seismic records is high. According to Figure 5C, there is a weak difference in energy between the seismic records obtained by inversion and those in the real model, and there is basically no variation in waveform and phase information, Hence, the velocity model after 40 iterative inversions is basically consistent with the real velocity model.
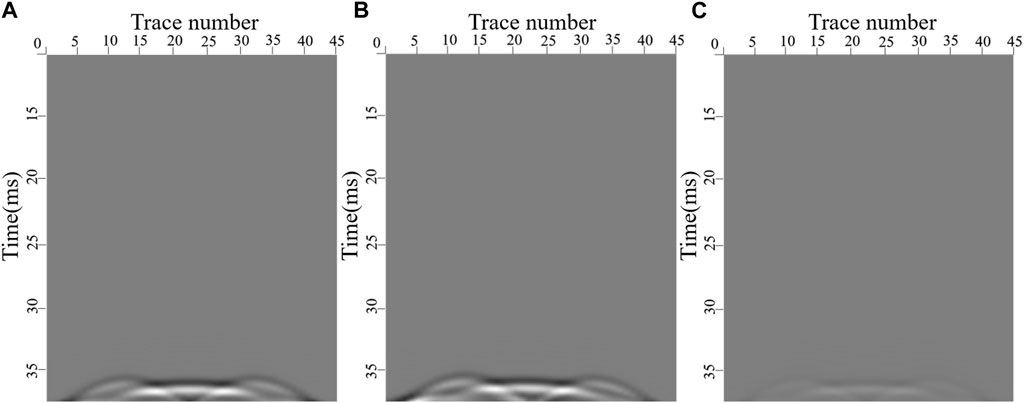
Figure 5. Seismic records after the 40th iteration for the shot point at (46, 0). Synthetic seismic records (A); Actual seismic records (B); The residual between b and a (C).
As shown in Figure 6A, the conjugate gradient method is used for 1 iteration to generate a velocity model, and the parameter information of this model is not restored. According to Figure 6B and Table 1, after 40 iterative inversions, the wave velocities of the collapse columns and fault are 3050 m/s and 3150 m/s. The average diameter of collapse columns is 6.2 m and the size of the fault is 30.5*100 m. The average error of wave velocities of the collapse columns and fault, collapse column diameter and fault size are 0.017, 0.016, 0.24 and 0.017, respectively. Therefore, the velocity model after 40 iterative inversions is basically consistent with the real velocity model. On the whole, the numerical simulation experiments conducted for the anomalous body combination have achieved very good inversion results, verifying the applicability of FWI methods to complex structural inversion. However, due to the good quality of the seismic waveforms obtained from numerical simulation, the inversion results are significantly influenced by data quality, and it is speculated that this may also affect the number of iterations. Therefore, it is necessary to further demonstrate this with physical simulations.
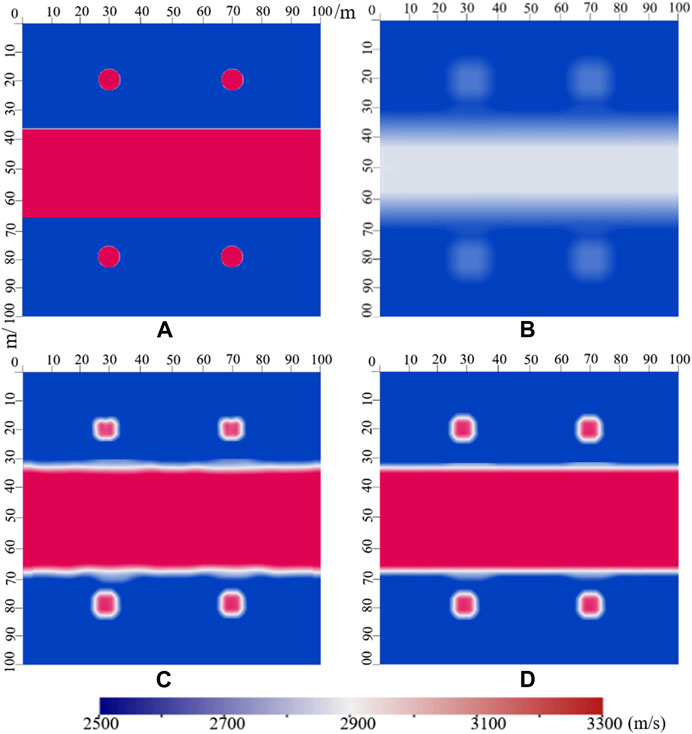
Figure 6. The initial velocity model, and the velocity models after different iterations. The initial velocity model (A); The velocity model after the 1st iteration (B); The velocity model after the 25th iteration (C); The velocity model after the 40th iteration (D).
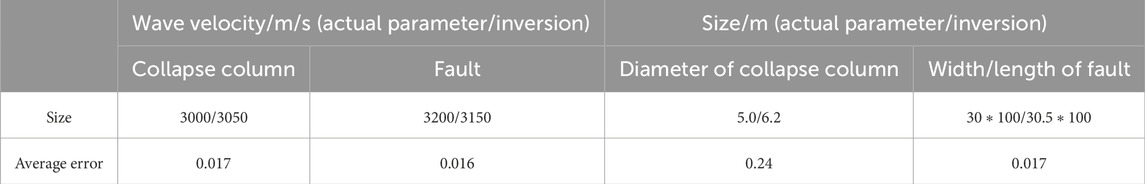
Table 1. A comparison of actual parameters after 40 iterations in the numerical simulation with the inversion results.
A multichannel ultrasonic transducer was used in the experiment. The instrument’s transmission frequency is 25 kHz, and its receiving main frequency is around 3.2 kHz, as determined through spectrum analysis of the collected data., and the voltage for pulse transmission was 1000 V. It is characterized by 16 channels, and the sampling interval was 1 μs. A 100×100 cm acrylic model was adopted. 5 anomalies were circular voids with a diameter of 5cm, and the coordinates of their centers were (30,30), (70,30), (50,50), (30,70), and (70,70). 45 shots and 45 channels were arranged in the experiment. The coordinates of the excitation points S1 and S45 for the first shot were (6,100) and (94,100). The coordinates of the first receiving points R1 and R45 for the first channel were (6,0) and (94,0). The shot interval and channel spacing were 2 cm. The anomaly’s velocity was 340 m/s, equal to the acoustic velocity in the air. After experimental determination, the velocity of longitudinal waves of the acrylic plate material was 2450 m/s. The layout of the instrument and the observation system are shown in Figure 7.
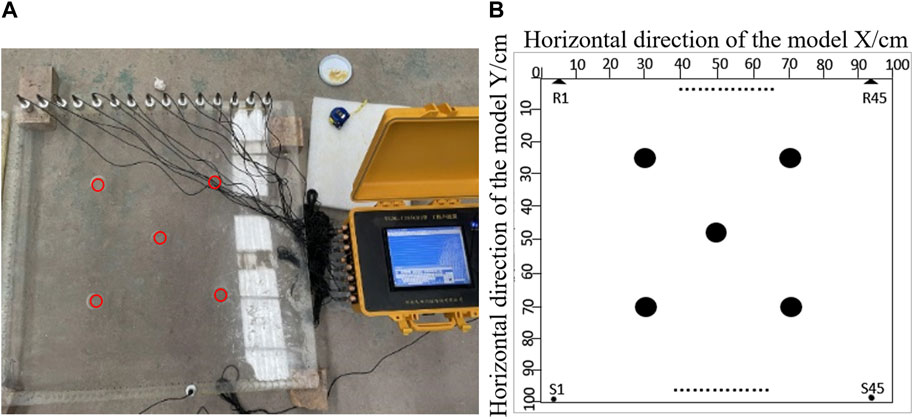
Figure 7. Experimental instruments, acrylic models of multiple anomalies, and the observation system. Experimental instruments, and acrylic models of multiple anomalies (A); Observation system (B).
The event for seismic records in the initial model is smooth and continuous. A comparison with the seismic records in the actual anomaly model reveals the changes in seismic records caused by abnormality. As shown in Figure 8, a comparative analysis of seismic records shows that the velocity model recovered after 20 iterative inversions still fails to well restore the amplitude and phase information of seismic records. In other words, there is still a large difference between the model obtained this time and the actual model.
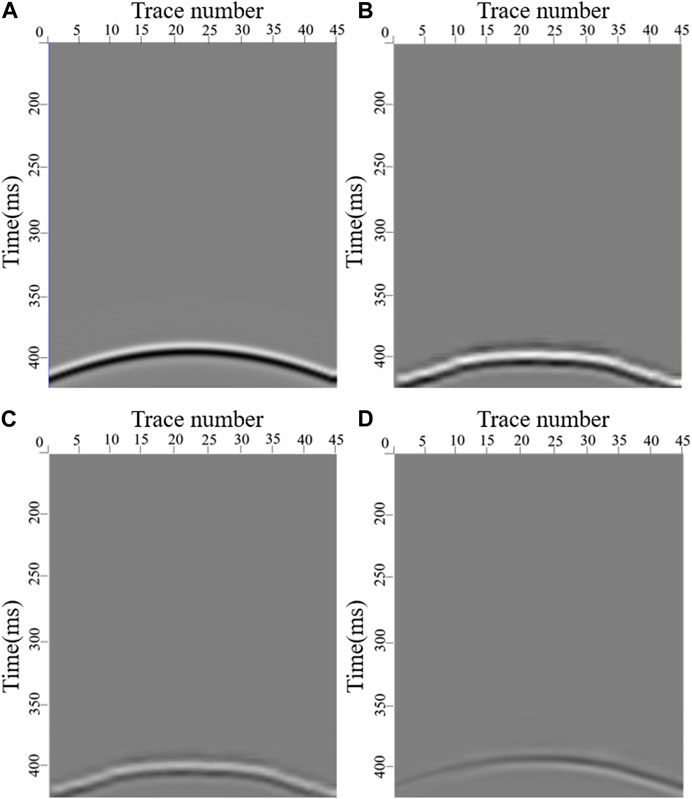
Figure 8. A comparison of seismic records for the shot point at (42,100) in the inversion process. Seismic records in the initial model for inversion (A); Seismic records in the actual model (B); Seismic records after the 20th iteration in the inversion process (C); The residual between b and c (D).
Figure 9 refers to the changing curve of the normalized value of the objective function after numerous iterative inversions. According to the curve, the value of the objective function decreases rapidly from 0.9745 (the value after the 1st iteration) to 0.2541 (the value after the 13th iteration) during the first 13 iterative inversions. The gradient of a subsequent decline in the value of the objective function becomes gentler. Finally, the extreme value occurs after 48 iterative inversions. After 48 iterations of inversion, the objective function value remains unchanged.
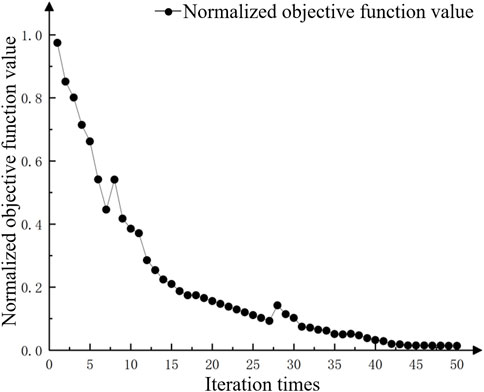
Figure 9. A descending curve of the objective function.
Through iterations of varying frequencies, the inversion results shown in Figure 10 were obtained. The phase information of anomalies in the velocity model produced after 48 iterative inversions is basically consistent with that in the actual model, and the velocity information of anomalies is well restored. However, there is still a slight difference between the abnormal morphology and the actual morphology. False abnormal areas exist around the model boundary and cannot be eliminated. The reasons are analyzed as follows. Firstly, because the FWI method highly relies on velocity, the acrylic model fails to achieve complete homogeneity, leading to a difference in velocity. Secondly, the anomaly is too small to excite signals with a higher frequency, resulting in lower detection accuracy. But from the perspective of the overall inversion process, the expected inversion effect has been achieved.
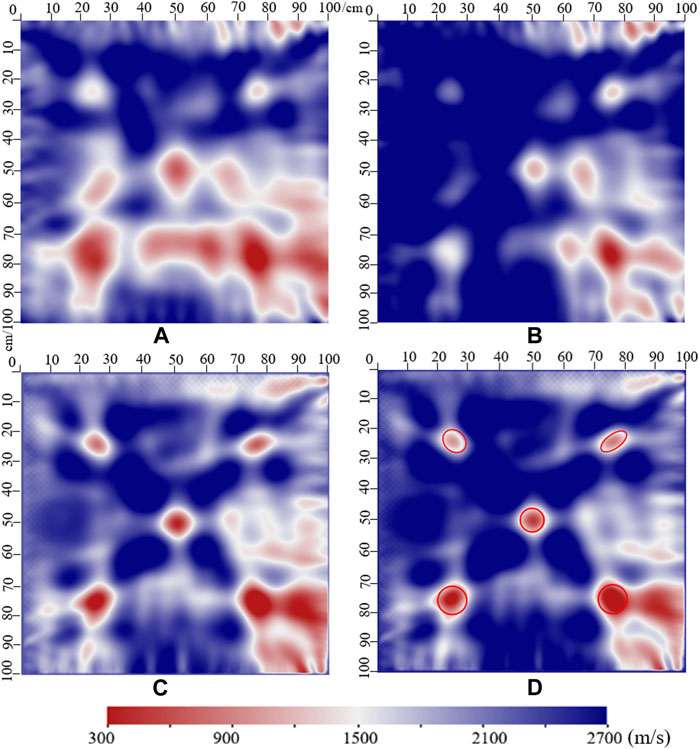
Figure 10. The inversion results of various iterations. The 1st iteration (A); The 16th iteration (B); The 32nd iteration (C); The 48th iteration (D).
The working face #10102 in a province is located in the west of a mining area of the coal seam 10#. There are three major roadways (track, transportation and return airway) in the north, the goaf #10101 in the east, an unmined coal seam in the west, and a boundary of the coal field in the south. Surface elevation ranges from +995.2 m to +1132.2 m, and underground elevation ranges from +715.90 m to +772.70 m. The average coal seam thickness is 3.90 m, the inclination width is 205 m, and the strike length is 948 m.
According to the requirements, two detections were carried out on the working face. For the first detection, 39 shots were arranged as excitation sources in the transportation roadway, with a shot interval of 20m, and 104 receiving points were arranged in the return airway, with the channel spacing of 10 m. For the second detection, 39 shots were arranged as excitation sources in the return airway, with a shot interval of 20m, and 84 receiving points were arranged in the transportation roadway, with the channel spacing of 10 m.
The seismic observation records for 2 random shots in Figure 11 show that P-waves have obvious properties at the initial arrival. However, the characteristics of the wave groups are complex, and there is aliasing to different degrees. Meanwhile, many side lobes of wavelets exist. On the whole, the characteristics of the collected seismic signal data are relatively obvious. Therefore, the method of extracting seismic wavelets is adopted for FWI. A velocity of 2000 m/s in the coal seam is selected for the initial background velocity model, and the size of a computational grid is 1 m×1 m. For data processing before inversion, noise reduction is first carried out, and seismic wavelets are then extracted from the generated seismic data with a high signal-to-noise ratio. After filtering the extracted seismic wavelets, the convolution of the objective function is considered to complete FWI calculations. In the end, the final inversion results are produced, as shown in Figure 12.
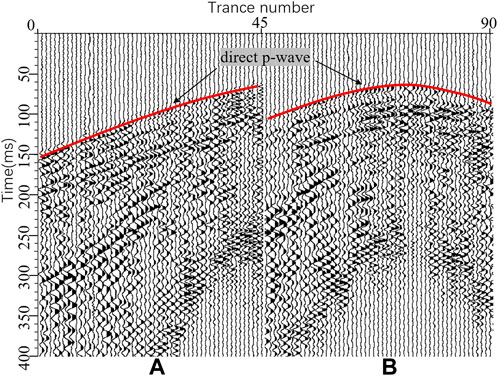
Figure 11. Seismic observation records for 2 random shots. Seismic records for the 10th shot (A); Seismic records for the 2nd shot (B).
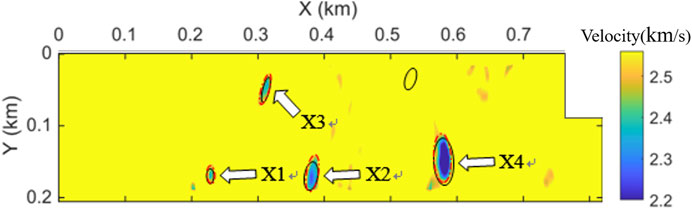
Figure 12. Inversion results.
The mining of the working face was conducted to verify 5 collapse columns, and 4 anomalous regions were explained by the FWI method. According to the comparative analysis in Figure 13, the parameters of the anomalies explained by FWI such as position, scale and morphology were basically consistent with the mining-based verification results. After comparing the FWI results with the data obtained by actual mining, the findings show that the FWI results of 4 geological anomalies (X1-X4) are basically consistent with the data about these anomalies disclosed by actual mining, as shown in Table 2, but the fifth anomaly is not presented. The reason is that the value of the selected step length is relatively high, and the FWI resolution fails to reach a corresponding level when an anomaly is small. However, on the whole, the attitude of anomalies in the FWI results is generally consistent with that of real anomalies revealed by mining, and the center of anomalies in FWI is close to that of real anomalies. The overall degree of fitting is high.
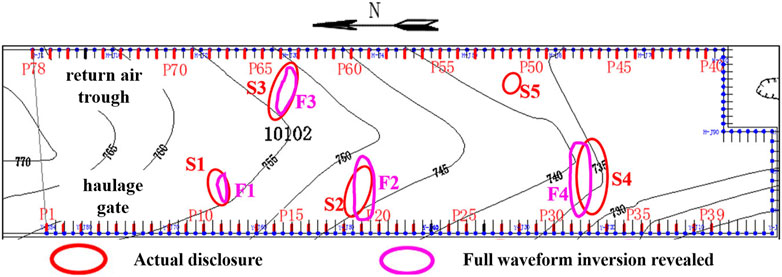
Figure 13. A comparison of FWI results with mining-based verification results.
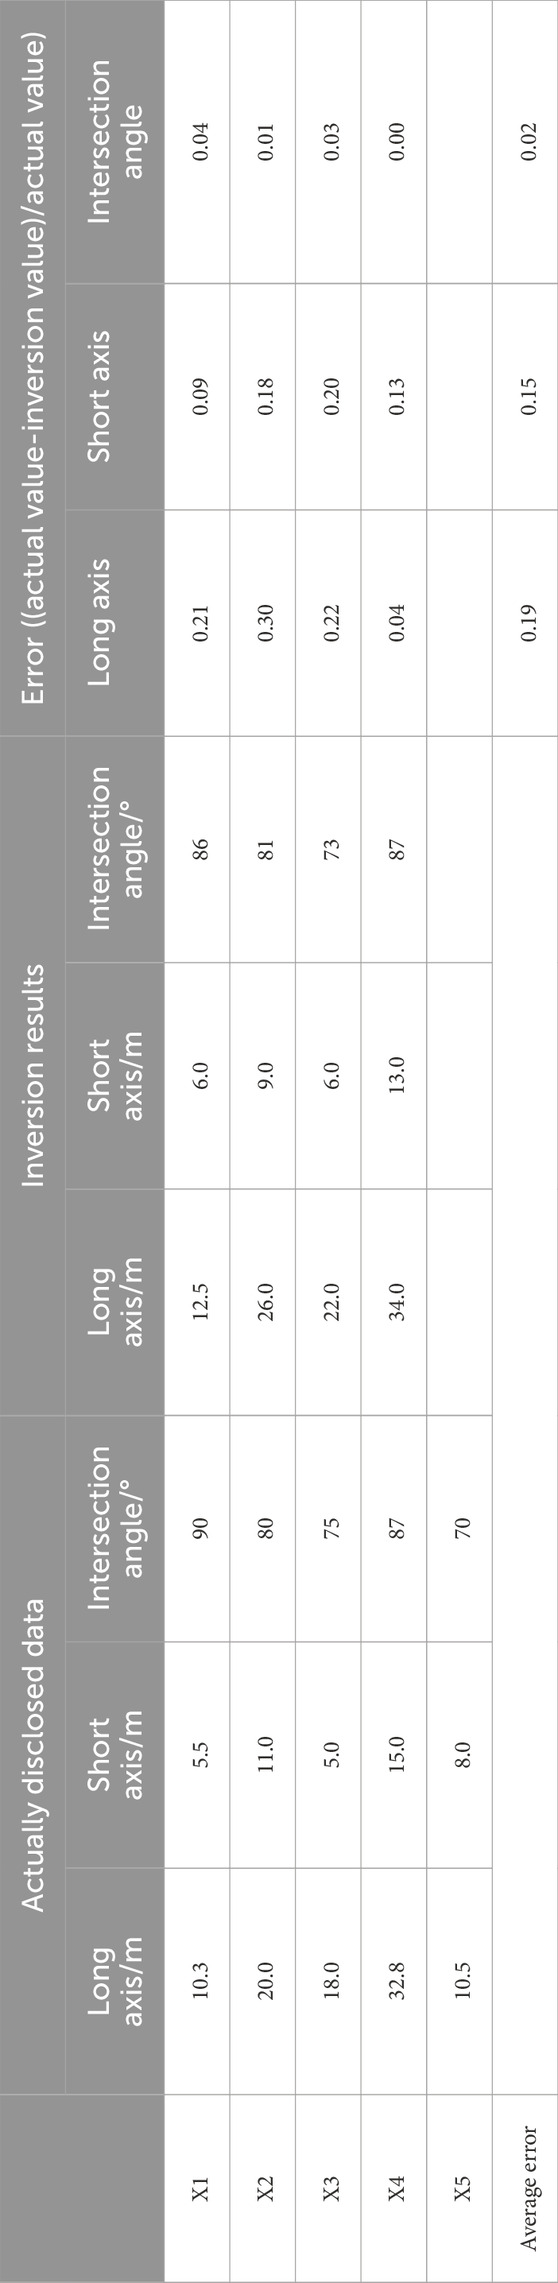
Table 2. A comparison of inversion results with the actually disclosed data.
(1) A model of fault-collapse column portfolio is established by numerical simulation. According to the seismic records generated by simulation, the initially arriving P waves in the Z-component seismic records are the most suitable characteristic waves for FWI. A comparison of the reconstructed anomaly model with the real model reveals that there is no significant difference in the central position, and the average errors of the wave velocity of collapse columns and faults, collapse column diameter and fault size are 0.017, 0.016, 0.24 and 0.017. A good inversion effect has been achieved in the simulation of complex anomalies of the working face.
(2) For experiments using acrylic models of multiple anomalies, the synthetic seismic records in the final iterative inversion model are generally consistent with the real seismic records. The recovered background velocity in the model is concentrated at 2650 m/s, and the recovered velocity of anomalies is concentrated at 320–360 m/s. These values are generally consistent with the real velocities.
(3) For the measured data about mines, direct P waves were preprocessed and FWI was carried out. The inversion results were compared with the mining-based actual data which revealed 5 collapse columns. 4 suspected collapse columns were explained by FWI, and their positions and morphology were basically consistent with the actual data. After verification, the average error ratios of the long axis, short axis and intersection angle of the 4 collapse columns were 0.19, 0.15 and 0.02. The overall effect was good.
(4) Due to limited computing power, a two-dimensional inversion was carried out only in numerical simulation. While the real working surface should be considered a three-dimensional space. In the future numerical simulation research, three-dimensional full-waveform inversion should be conducted. In view of the complexity of seismic wave fields, the initially arriving P-waves were selected as characteristic waves for FWI in the experiment. But in practice, it is necessary to consider the properties of S-waves and channel waves in the working face and choose a proper wave type or wave group for research, thus helping realize the inversion of full wavefield and multi-physical parameters.
The raw data supporting the conclusion of this article will be made available by the authors, without undue reservation.
LX: Writing–original draft. BW: Writing–review and editing. YW: Writing–review and editing. JF: Writing–review and editing. LZ: Writing–review and editing. GX: Writing–review and editing. Sihongren Shen: Writing–review and editing. ZS: Writing–review and editing.
The author(s) declare that no financial support was received for the research, authorship, and/or publication of this article.
Author YW was employed by Hunan Geosun Hi-technology Co., Ltd.
The remaining authors declare that the research was conducted in the absence of any commercial or financial relationships that could be construed as a potential conflict of interest.
All claims expressed in this article are solely those of the authors and do not necessarily represent those of their affiliated organizations, or those of the publisher, the editors and the reviewers. Any product that may be evaluated in this article, or claim that may be made by its manufacturer, is not guaranteed or endorsed by the publisher.
Aragao, O., and Sava, P. (2020). Elastic full waveform inversion with probabilistic petrophysical clustering. Geophys. Prospect. 68, 1341–1355. doi:10.1111/1365-2478.12910
Asgharzadeh, BAHRI, Urosevic, H., and Urosevic, M. (2018). The use of FWI in coal exploration. ASEG Ext. Abstr. 2018, 1–7. doi:10.1071/aseg2018abm1_3a
Das, A. J., Mandal, P. K., Sahu, S. P., Kushwaha, A., Bhattacharjee, R., and Tewari, S. (2018). Evaluation of the effect of fault on the stability of underground workings of coal mine through DEM and statistical analysis. J. Geol. Soc. INDIA 92, 732–742. doi:10.1007/s12594-018-1096-2
Fang, J. W., Wang, B., Liu, S. D., Zhang, J., Huang, L. Y., and Wang, Y. F. (2022). Full - wave form inversion and its application in imaging of complex collapse columns in coal seam floor. J. China Univ. Min. &Technology 51, 863–872. doi:10.13247/j.cnki.jcumt.001438
Hu, G. Z., Teng, J. W., Pi, J. L., Wang, W., and Qiao, Y. H. (2013). In-seam seismic exploration techniques: a geophysical method predicting coal - mine disaster. Prog. Geophys 28, 439–451. doi:10.6038/pg20130150
Jiao, W. J., Ji, G. Z., Hu, Z., Wang, J., Dou, W. W., and Jiao, Y. (2023). Wave field characteristics and transmission processing of seismic waves in coal seams with non-developing fundamental mode channel waves. J. Appl. Geophys. 210, 104939. doi:10.1016/j.jappgeo.2023.104939
Junqiu, Z., and Ying, R. (2023). Seismic full waveform inversion accelerated by overlapping data input and computation. Pure Appl. Geophys. 180, 3517–3526. doi:10.1007/s00024-023-03338-3
Khan, M., He, X. Q., Farid, A. S., Chen, J. Q., Wang, H. L., Song, D. Z., et al. (2022). Geophysical characterization of mining-induced complex geological deformations in a deep coalmine. Lithosphere 2021. doi:10.2113/2022/7564984
Khan, M., He, X. Q., Farid, A., Song, D. Z., Li, Z. L., Tian, X. H., et al. (2021). A novel geophysical method for fractures mapping and risk zones identification in a coalmine, Northeast, China. Energy Rep. 7, 3785–3804. doi:10.1016/j.egyr.2021.06.071
Khan, M., He, X. Q., Guo, J., and Song, D. Z. (2024). Accurate prediction of indicators for engineering failures in complex mining environments. Eng. Fail. Anal. 155, 107736. doi:10.1016/j.engfailanal.2023.107736
Khan, M., Xueqiu, H., Dazhao, S., Xianghui, T., Li, Z. L., Yarong, X., et al. (2023). Extracting and predicting rock mechanical behavior based on microseismic spatio-temporal response in an ultra-thick coal seam mine. Rock Mech. Rock Eng. 56, 3725–3754. doi:10.1007/s00603-023-03247-w
Klotzsche, A., Vereecken, H., and van der Kruk, J. (2019). Review of crosshole ground-penetrating radar full-waveform inversion of experimental data: recent developments, challenges, and pitfalls. GEOPHYSICS 84, H13–H28. doi:10.1190/geo2018-0597.1
Kong, H. L., and Wang, L. Z. (2018). Seepage problems on fractured rock accompanying with mass loss during excavation in coal mines with karst collapse columns. ARABIAN J. GEOSCIENCES 11, 585. doi:10.1007/s12517-018-3881-z
Li, S. Y., Lian, J., Teng, J. W., Feng, L., Yao, X. S., and Liu, G. D. (2017). Inter - pretation technology of coal seam thickness in mining face by ISS transmission method. J. China Coal Soc. 42, 719–725. doi:10.13225/j.cnki.jccs.2016.0595
Li, G. (2016). Detection technique of transmission in-seam wave for concealed fault in working face of underground coal mine. Coal Geol. Explor. 44, 142–145. doi:10.3969/j.issn.1001-1986.2016.05.027
Owusu, J. C., Podgornova, O., Charara, M., Leaney, S., Campbell, A., Ali, S., et al. (2016). Anisotropic elastic full-waveform inversion of walkaway vertical seismic profiling data from the Arabian Gulf. Geophys. Prospect. 64, 38–53. doi:10.1111/1365-2478.12227
Ren, F. Q., Zhu, C., He, M. C., Shang, J. L., Feng, G. L., and Bai, J. W. (2022). Characteristics and precursor of static and dynamic triggered rockburst: insight from multifractal. Rock Mech. Rock Eng. 56, 1945–1967. doi:10.1007/s00603-022-03173-3
Ren, F. Q., Zhu, C., Yuan, Z. H., Karakus, M., Tang, S. B., and He, M. (2023). Recognition of shear and tension signals based on acoustic emission parameters and waveform using machine learning methods. Int. J. Rock Mech. Min. Sci. 171, 105578. doi:10.1016/j.ijrmms.2023.105578
Virieux, J., and Operto, S. (2009). An overview of full-waveform inversion in exploration geophysics. GEOPHYSICS 74, WCC1–WCC26. doi:10.1190/1.3238367
Wang, J., Zhu, P. M., and Zhang, S. J. (2012). Application of reflection tomography to detecting collapse column in coal mine. Chin. J. Eng. Geophys. 9, 719–725. doi:10.3969/j.issn.1672-7940.2012.06.014
Wu, G. Q., and Ma, Y. L. (2023). Research on the interpretation method of channel waves for various abnormal bodies in geologically transparent working faces. Coal Sci. Technol. 51, 149–160. doi:10.13199/j.cnki.cst.2021-1016
Xie, H. P., Gao, F., Ju, Y., Gao, M. Z., Zhang, R., and Gao, Y. N. (2015). Quantitative definition and investigation of deep mining. J. China Coal Soc. 40, 1–10. doi:10.13225/j.cnki.jccs.2014.1690
Yin, Q., Liu, R. C., Jing, H. W., Su, H. J., Yu, L. Y., and He, L. X. (2019). Experimental study of nonlinear flow behaviors through fractured rock samples after high-temperature exposure. Rock Mech. Rock Eng. 52, 2963–2983. doi:10.1007/s00603-019-1741-0
Yin, Q., Wu, J. Y., Zhu, C., He, M. C., Meng, Q. X., and Jing, H. W. (2021a). Shear mechanical responses of sandstone exposed to high temperature under constant normal stiffness boundary conditions. Geomechanics Geophys. Geo-Energy Geo-Resources 7, 35–17. doi:10.1007/s40948-021-00234-9
Yin, Q., Wu, J. Y., Zhu, C., Wang, Q., Xie, J. Y., Jing, H., et al. (2021b). The role of multiple heating and water cooling cycles on physical and mechanical responses of granite rocks. Geomechanics Geophys. Geo-Energy Geo-Resources 7, 69. doi:10.1007/s40948-021-00267-0
Yuan, L. (2021). Research progress of mining response and disaster prevention and control in deep coal mines. J. China Coal Soc. 46, 716–725. doi:10.13225/j.cnki.jccs.YT21.0158
Keywords: coal mine accidents, geological structure, seismic waves, precise detection, FWI
Citation: Xie L, Wang B, Wang Y, Fang J, Zeng L, Xin G, Shen S and She Z (2024) The method for precise seismic detection of geological structures in underground coal mines and application. Front. Earth Sci. 12:1307275. doi: 10.3389/feart.2024.1307275
Received: 04 October 2023; Accepted: 13 March 2024;
Published: 16 April 2024.
Edited by:
Manoj Khandelwal, Federation University Australia, AustraliaReviewed by:
Chun Zhu, Hohai University, ChinaCopyright © 2024 Xie, Wang, Wang, Fang, Zeng, Xin, Shen and She. This is an open-access article distributed under the terms of the Creative Commons Attribution License (CC BY). The use, distribution or reproduction in other forums is permitted, provided the original author(s) and the copyright owner(s) are credited and that the original publication in this journal is cited, in accordance with accepted academic practice. No use, distribution or reproduction is permitted which does not comply with these terms.
*Correspondence: Bo Wang, Ym93YW5nMTk4NEAxMjYuY29t
Disclaimer: All claims expressed in this article are solely those of the authors and do not necessarily represent those of their affiliated organizations, or those of the publisher, the editors and the reviewers. Any product that may be evaluated in this article or claim that may be made by its manufacturer is not guaranteed or endorsed by the publisher.
Research integrity at Frontiers
Learn more about the work of our research integrity team to safeguard the quality of each article we publish.