
94% of researchers rate our articles as excellent or good
Learn more about the work of our research integrity team to safeguard the quality of each article we publish.
Find out more
ORIGINAL RESEARCH article
Front. Earth Sci., 20 March 2024
Sec. Geoscience and Society
Volume 12 - 2024 | https://doi.org/10.3389/feart.2024.1305496
This article is part of the Research TopicNear-Surface Geophysics in Latin American Contexts: Its Applications, Education and Societal Perspectives as a wholeView all 6 articles
 Kimberly Coutinho Paes Leme de Castro*
 Luciano Soares da Cunha
 Ana Clara de Araujo Sousa
 Pedro Vencovsky Nogueira
 Welitom Rodrigues Borges
This study aims to assess the impact of the sand-clay ratio on the detection of simulated forensic targets resembling human burial evidence using ground-penetrating radar (GPR). To achieve this goal, we established a controlled site consisting of four experimental graves (SEPs), with each SEP representing a distinct burial scenario. The project’s objectives encompass evaluating how varying the clay soil content influences the detection of swine targets using 2D, quasi-3D, and 4D GPR imaging techniques. We observed signal attenuation in the GPR data during the rainy season and after reflection from larger targets, primarily due to the conductive behavior of the soft tissues within the targets. We achieved more precise results in an SEP that was 85% sand and 15% clay material, regardless of seasonality. We obtained better results in the dry season due to the greater penetrability of electromagnetic waves and more explicit reflections. In comparison, we achieved more precise results for SEP03, which was 70% sand and 30% clay material. In conclusion, controlled sites are invaluable tools for geophysical investigations, as they provide a controlled environment where we can meticulously adjust various parameters, leading to a more precise and insightful analysis of the results. By systematically manipulating factors such as the soil composition, target depth, and environmental conditions, researchers can effectively calibrate their instruments and methodologies, enhancing the accuracy and reliability of their findings. Therefore, controlled sites not only facilitate comprehensive data collection but also serve as essential platforms for refining and validating geophysical techniques, ultimately advancing the field of geophysical forensics.
Forensic geophysics research employing ground-penetrating radar (GPR) exhibits substantial potential for the non-destructive detection of concealed or interred objects. The forensic application of GPR has demonstrated notable progress across diverse scientific domains. It has been incorporated into various lines of investigation, encompassing the decomposition of organic matter (Schultz et al., 2016; Ruffell et al., 2017; Schoor et al., 2017; Dick and Pringle, 2018; Pringle et al., 2020), the examination of submerged environments (Parker et al., 2010; Schultz et al., 2013), controlled sites (Barone et al., 2022; Pringle et al., 2020; Cavalcanti et al., 2018; Schoor et al., 2017; Booth and Pringle, 2016; Molina et al., 2016a; b; Pringle et al., 2016; Schultz et al., 2016; Almeida et al., 2015; Molina et al., 2015; Almeida et al., 2014; Lowe et al., 2013; González-Jorge et al., 2012; Pringle et al., 2020; Schultz and Martin, 2012; Solla et al., 2012; Schultz and Martin, 2011; Parker et al., 2010; Schultz, 2008; Schultz et al., 2006; Powell, 2004; Schultz et al., 2002), and its synergistic utilization in conjunction with complementary methodologies (Hansen and Pringle, 2013; Molina et al., 2016a; Aziz et al., 2016; Cavalcanti et al., 2018; Rubio-Melendi et al., 2018; Abate et al., 2019; Pringle et al., 2020).
GPR is overwhelmingly the most commonly used geophysical technique for the detection of subsurface human remains, but resistivity, electromagnetic induction, magnetics, acoustic techniques, and gravity data are also applied depending on the particular burial circumstances (Berezowski et al., 2021). Nevertheless, applying the GPR technique for this purpose presents inherent limitations contingent upon site-specific characteristics, the soil composition, and the extent of decomposition exhibited by the target materials (Lester and Bernold, 2006; Barone and Di Maggio, 2019).
The principal advancements identified were in research conducted within controlled sites, which were systematically examined and cultivated under tightly monitored conditions. These conditions encompassed a comprehensive set of parameters, including the depth, dimensions, target type, soil characteristics, frequency, and the integration of supplementary methodologies, which were all meticulously controlled. Some objectives were facilitating comparisons across various antenna frequencies, establishing foundational principles for forensic research, and delineating optimal practices and methodologies for detecting inhumations. This research direction, recognized as promising in a systematic literature review (SLR) (Castro and Cunha, 2021), is the central objective of this work.
The primary goal of this study is to assess how the clay soil content, GPR frequency, and data collected under both dry and rainy conditions influence the recognition of forensic targets within a controlled environment designed to simulate human burial evidence. We monitored the spatial-temporal variations in the moisture content with depth and made measurements by employing electrical tomography and the spontaneous potential within this controlled site.
The controlled site for the conducted experiments was established within an approximate area of 100 m2 situated within the Experimental Farm (FAL) of the Federal University of Brasília (UnB). The vegetation at the site had already undergone partial suppression, with shrubs, medium-sized trees, and grasses remaining. Figure 1 provides a visual representation of the specific location of the controlled site (Castro, 2021).
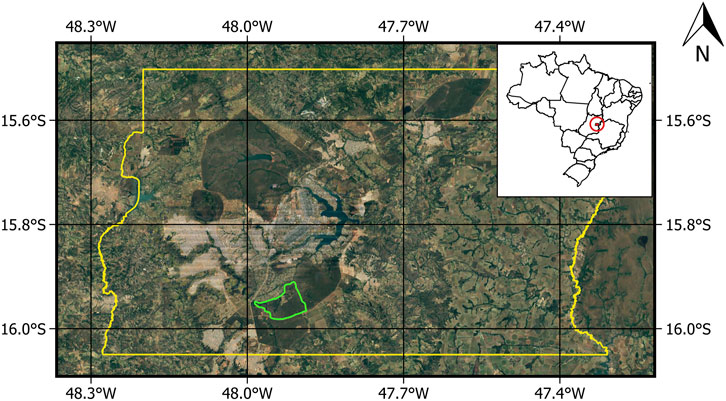
Figure 1. Location map of the controlled site area situated within the Experimental Farm (highlighted by the green polygon) in Brasilia, Distrito Federal—DF. (Source: Google Earth image, 2021).
Our area of the controlled site is within the FAL in a region characterized by the presence of oxisols. The climate in the Federal District region, according to Koppen’s classification, falls within the spectrum of a tropical savanna and rainy temperate climate, with a distinct dry winter season. This climate exhibits a clear seasonal division: a rainy and hot period occurs from October to April, and it is followed by a cold and dry phase from May to September. The temperature fluctuations are notable, with the coldest months registering temperatures as low as 12°C, while the hottest months can see temperatures exceeding 28.5°C (Cavalcanti, 2017). The average annual precipitation in this region is 1,600 mm (available at https://tempo.inmet.gov.br/Graficos/A001, accessed on 01 November 2021).
In July 2021, the controlled site was established; it comprised four experimental inhumations involving the burial of target specimens (pigs) at depths of either 0.50 m or 0.90 m with different cover texture compositions (Figure 2). Detailed specifications regarding the targets’ dimensions and the composition of the cover textures can be found in Table 1 (Castro, 2021).
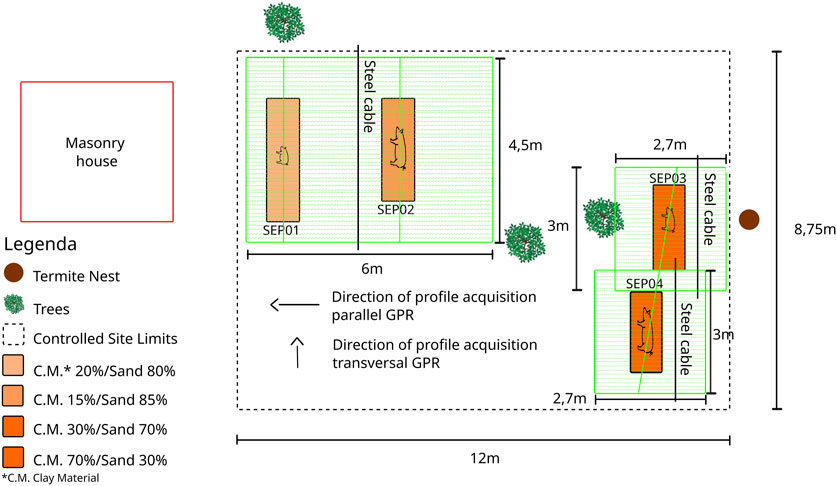
Figure 2. Sketch of the controlled site area featuring the layout of the experimental graves, illustrating the composition of the SEP fill and outlining the GPR data acquisition scheme.
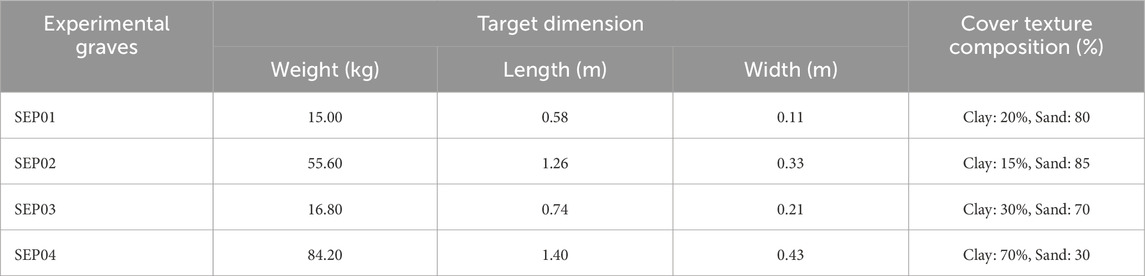
Table 1. Identification of the experimental burial sites, the composition of the cover textures, and the dimensions of the buried targets.
The oxisols, sourced from the excavation of the graves, were employed as the clay material constituting the cover for the targets. We conducted a laboratory analysis to assess the granulometry of the clay and sand materials, and we present the results in Table 2. The technique used to analyze the fine particles in the granulometry analysis was the sedimentology test, while for the larger particles (>0.075 mm), the sieving test was used (NBR 5734/ABNT, 1989).
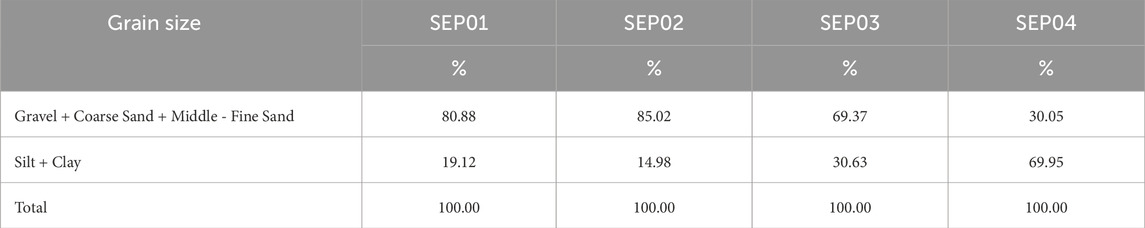
Table 2. Granulometric analysis results for the sand and clay materials used as cover for the targets.
Experimental Sepulture 01 (SEP01) is 3.00 m in length, 0.80 m in width, and 1.50 m in depth. We filled it according to the following sequence (Figure 3A): first, for the base, there is a layer of 0.15 m of gravel, followed by a nonwoven geotextile layer. Then, there is 0.20 m of sand and 0.65 m of clay material. Finally, we placed the pig target at a depth of 0.50 m, with its specific dimensions outlined in Table 1. A mixture of 20% clay material and 80% sand was employed to bury the target and complete the grave filling (Castro, 2021).
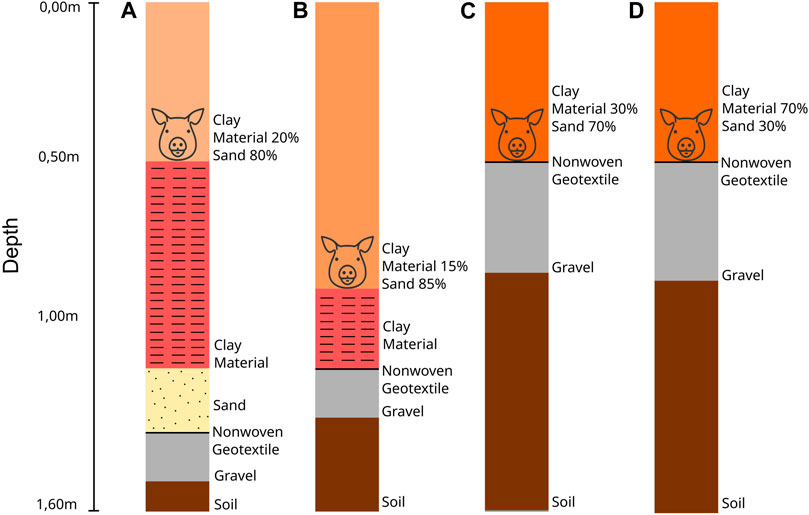
Figure 3. Illustration depicting the sequence of filling for the experimental graves: (A) SEP01 filled with gravel, nonwoven geotextile, sand, clay material, and sand-clay proportion. (B) SEP02 filled with gravel, nonwoven geotextile, clay material, and sand-clay proportion. (C) SEP03 filled with gravel, nonwoven geotextile, and sand-clay proportion. (D) SEP04 filled with gravel, nonwoven geotextile, and sand-clay proportion.
Experimental Grave 02 (SEP02) is 2.50 m in length, 0.80 m in width, and 1.30 m in depth. The filling process (Figure 3B) proceeded as follows, from bottom to top: there is a layer of 0.15 m of gravel, followed by a nonwoven geotextile layer. Then, there is 0.25 m of clay material. We positioned the pig target at a depth of 0.90 m, with the dimensions specified in Table 1. We utilized a mixture comprising 15% clay and 85% sand to bury the target and complete the grave filling (Castro, 2021).
Experimental Grave 03 (SEP03) is 2.10 m in length, 0.80 m in width, and 0.85 m in depth. The filling process (Figure 3C) proceeded as follows, from bottom to top: there is a layer of 0.35 m of gravel, followed by a nonwoven geotextile layer. We positioned the pig target at a depth of 0.50 m, with the dimensions specified in Table 1. A mixture comprising 30% clay and 70% sand was employed to bury the target and complete the grave filling (Castro, 2021).
Experimental Grave 04 (SEP04) is 2.00 m in length, 0.80 m in width, and 0.87 m in depth. The filling process (Figure 3D) proceeded as follows, from bottom to top: there is a layer of 0.37 m of gravel, followed by a nonwoven geotextile layer. We positioned the pig target at a depth of 0.50 m, with the dimensions specified in Table 1. A mixture comprising 70% clay and 30% sand was employed to bury the target and complete the grave filling (Castro, 2021).
The GPR is a geophysical method for mapping subsurface structures using electromagnetic energy. Various deployment methods exist, but all approaches involve a transmitter generating radiofrequency signals, which are typically in the 1–5,000 MHz frequency range, and a receiver detecting similar signals. The objective is to measure the impulse response or the transfer function of the surrounding medium to reconstruct the material’s property structure. In its simplest form, a GPR system with a transmitter and receiver is moved over the ground surface, and reflections returning from subsurface objects are detected, recorded, and displayed for the user (Annan, 2004).
As the GPR system is moved over the ground, a shallow image of the subsurface is obtained along the survey line. These images, called radargrams (Figure 5), are two-dimensional graphical representations (XZ) of the detected reflections. The X-axis represents the antenna displacement along the survey line, while the Z-axis represents the two-way travel time of the emitted pulse (in nanoseconds). Suppose that the time taken for the electromagnetic pulse to travel from the transmission antenna to the reflector in the soil and back to the receiving antenna is measured. In that case, the velocity of this pulse in the subsurface medium is known, and the reflector’s position can be determined (Solla et al., 2012).
We acquired data using the Geophysical Survey System Inc. (GSSI) GPR SIR3000 equipment with 400 MHz and 900 MHz antennas. The dry data collection process occurred on 03 August 2021 (Figure 4) and on 18 August 2021. The rainy data collection process occurred on 23 February 2023. During the dry field operation, we acquired 385 radargrams across the controlled site area, and 377 radargrams were acquired during the rainy field operation.
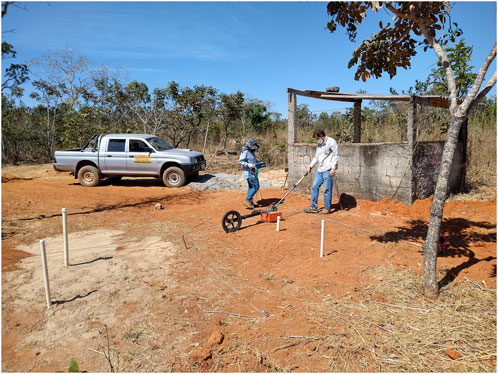
Figure 4. Photograph of the GPR data acquisition in the controlled site area with the 400 MHz antenna.
We employed two tape measures to ensure precise profile orientation, and a rope was stretched between them to demarcate the starting and ending points of the surveyed lines. We acquired data with the spacing between these lines set to 0.05 m, moving from northeast to southwest. A steel cable was also employed to facilitate the 3D processing of GPR data.
For the processing of the radargrams, the Reflex-Win 7.5.2 software was employed (Sandmeier, 2014). Below is the processing sequence utilized for dry season data.
- Static correction—the determination of the initial arrival point of electromagnetic energy directly propagated by the acquisition surface (Olhoeft, 2000).
- Energy decay function—enhances reflectors through an iterative process that can be applied linearly and exponentially at a specified depth.
- Bandpass frequency—filters out undesired frequencies and reduces noise from various sources, permitting frequencies within the specified band to pass (Gomes et al., 2011).
- Background removal—eliminates any background noise.
- FK filter—a two-dimensional filter defined in the frequency and wave number domain (F-K) that enables the suppression of electromagnetic signal noise (Cavalcanti, 2017).
- Migration (Kirchhoff)—relocates reflections to their accurate positions in the subsurface and collapses diffractions, thereby improving the spatial resolution (Yilmaz 2001). We determined the velocities of the electromagnetic waves based on the known depth (h) of the buried targets and the double transit time values of the electromagnetic wave (t) over each hyperbolic event assigned to the buried targets. We calculated the average electromagnetic wave propagation velocities used for migration using Eq. 1. The velocities (V) ranged from 0.07 to 0.1 m/ns in the dry season and from 0.1 to 0.12 m/ns in the rainy season:
We applied the same processing steps for the rainy season data, except for the bandpass frequency filter, which could have yielded more satisfactory results in assessing the clay and sand content and the moisture content.
The radargram processing routine for Figures 5A–D followed the same procedures outlined in the previous section. Figure 5A displays the radargram obtained using the 400 MHz antenna outside SEP01 and SEP02 during the dry season to assess the background. The geophysical response highlights the behavior of the homogeneous latosol, where disordered hyperbolas are observed, likely representing tree roots or animal burrows. Shortly after the 3.0 m position, a hyperbola corresponding to the steel cable added during the GPR survey is visible. Figure 5B shows the radargram obtained using the 900 MHz antenna outside SEP01 and SEP02 during the dry season for background verification. The response emphasizes the behavior of the homogeneous latosol, revealing some reflectors that attenuate as depth increases. Additionally, at approximately 3.4 m, there is a hyperbola that corresponds to the steel cable added during the GPR survey. Figure 5C presents the radargram acquired using the 400 MHz antenna outside SEP01 and SEP02 during the rainy season for background verification. The geophysical response illustrates the behavior of the homogeneous latosol, displaying less prominent, disordered hyperbolas that likely represent tree roots or animal burrows. Around the 3.0 m position, a hyperbola corresponding to the steel cable added during the GPR survey is visible. Lastly, Figure 5D exhibits the radargram obtained using the 900 MHz antenna outside SEP01 and SEP02 during the rainy season for background verification. The response underscores the behavior of the homogeneous latosol, revealing some reflectors that attenuate as the depth increases; they are particularly noticeable after 30 ns.
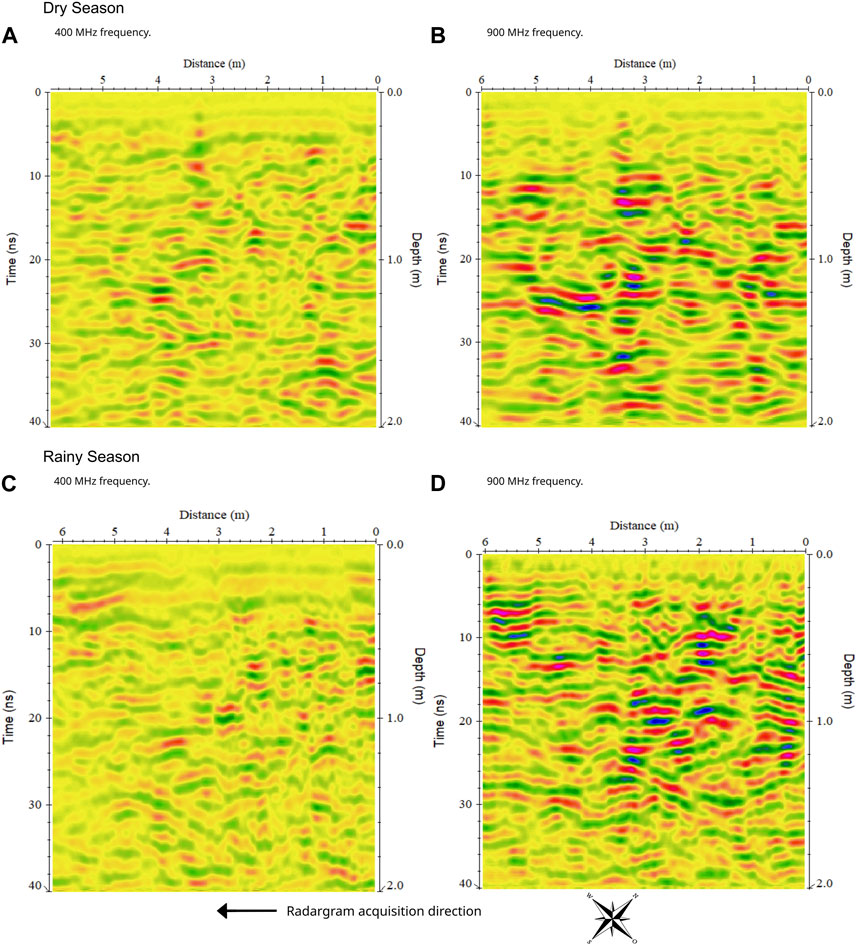
Figure 5. GPR profiles acquired outside SEP 01 and 02, during dry and rainy seasons, to verify the background. (A) Profile obtained using the 400 MHz antenna during the dry period. (B) Profile obtained using the 900 MHz antenna during the dry period. (C) Profile obtained using the 400 MHz antenna during the rainy period. (D) Profile obtained using the 900 MHz antenna during the rainy period.
In this method, the radargrams are acquired parallel to the axis of the buried target. This means that the electromagnetic waves travel along the length of the target. This approach is useful for mapping the layers of the soil in depth and assessing the composition and distribution of the soil along the profile. Parallel radargrams offer a vertical view of the target, which can aid in assessing its depth and internal structure. We chose to use 2D parallel radargrams to interpret the targets’ data below and over the pig carcass’s abdominal region due to its wider dimension.
Figures 6A–D depict radargrams obtained over SEP01 and SEP02, captured with a 400 MHz frequency during both the dry and rainy periods. Figure 6A shows the radargram obtained inside the grave during the dry season, excluding the buried pig’s location. In SEP01, disordered reflectors were observed, primarily corresponding to the layer of clayey material, as evidenced by a comparison with the burial scenario (Figure 6E). In Figure 6B, which was obtained during the dry season, well-defined hyperbolas indicate the targets’ depths, particularly in SEP01, where the clayey material is visible below the target, followed by a layer of sand. SEP02 also exhibits distinct layers, with the top of the target and the layer of clayey material being evident.
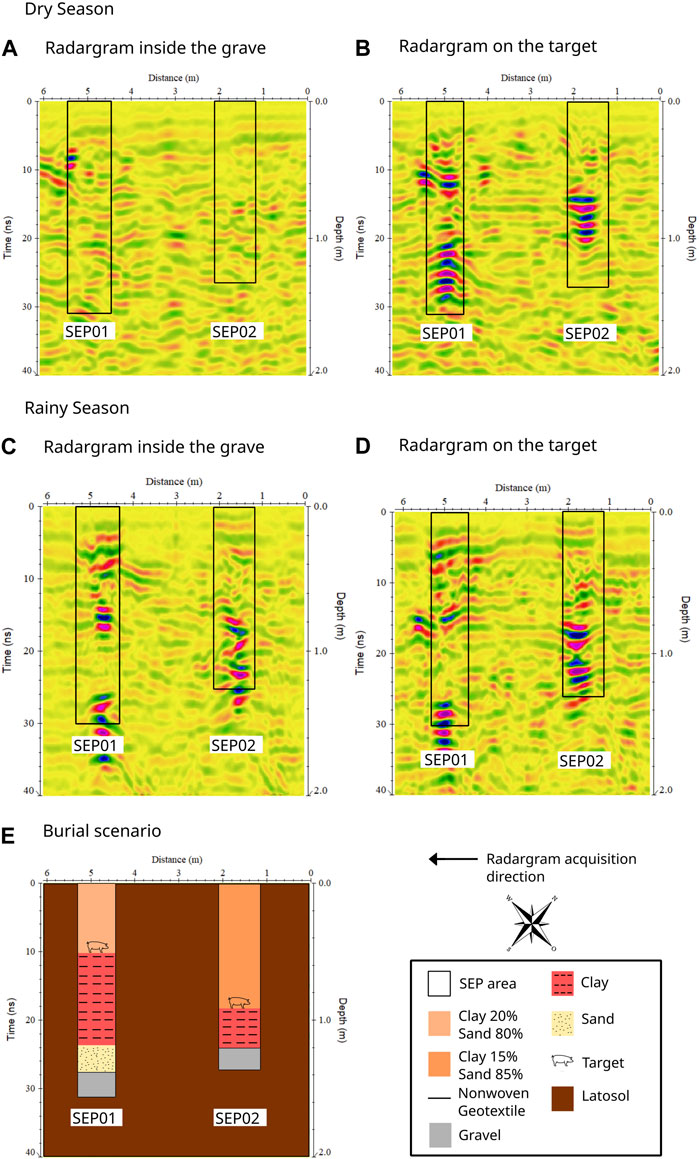
Figure 6. Radargrams obtained over SEP01 and SEP02 during dry and rainy seasons with the 400 MHz antenna. Data acquired: (A) Inside the grave during the dry period. (B) Over the target during the dry period. (C) Inside the grave during the rainy period. (D) Over the target during the rainy period. (E) Illustrative model of the buried target in the burial scenario.
Figure 6C presents the radargram inside the grave during the rainy season, again without the buried pig; it shows disordered hyperbolas, especially in SEP02, indicating the end of the sand-clay mixture layer and the presence of the clayey layer. Figure 6D displays the radargram over the buried targets during the rainy season, revealing moderate-to high-amplitude hyperbolas, which are particularly clear at the depths corresponding to SEP02.
Figures 7A–D depict radargrams captured over SEP03 with a 400 MHz frequency during the dry and rainy periods. Figure 7A displays the radargram inside the grave during the dry season, again excluding the buried pig’s location, revealing reflectors corresponding to the sand-clay mixture and gravel layers. In Figure 7B, which displays the radargram over the buried target during the dry season, a clear hyperbola indicates the target’s depth. Figure 7C shows the radargram inside the grave during the rainy season, indicating signal attenuation and reflectors corresponding to the sand-clay mixture layer. In Figure 7D, which shows the radargram over the buried target during the rainy season, a single anomalous hyperbola corresponds to the sand-clay mixture layer.
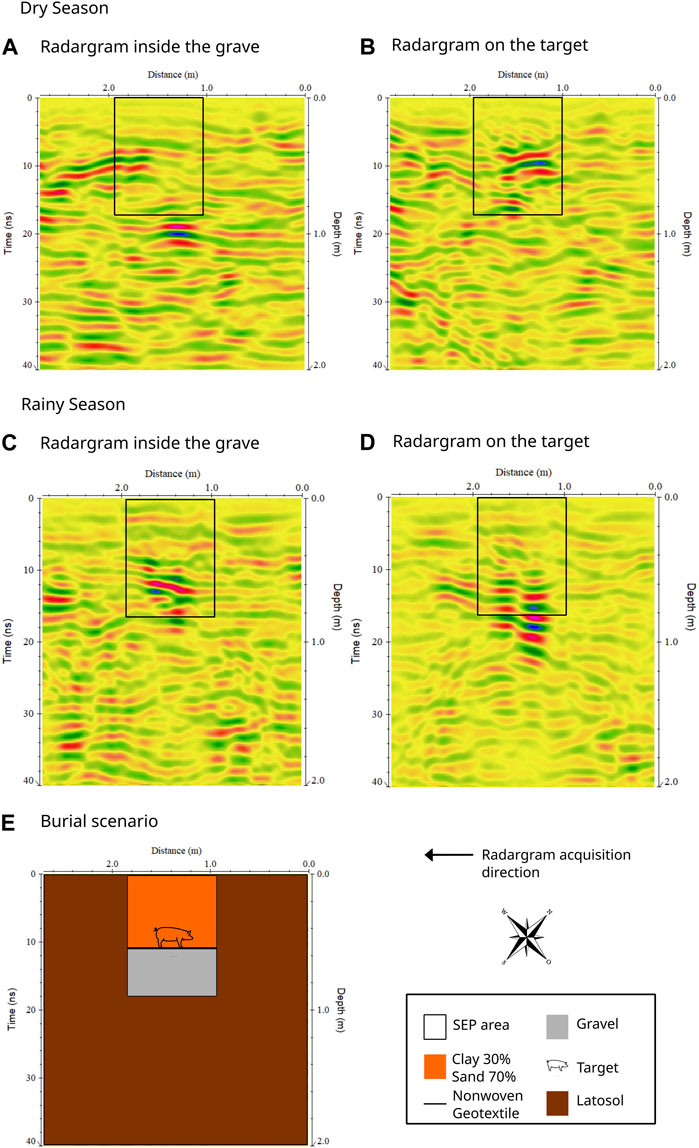
Figure 7. Radargrams obtained over SEP03 during dry and rainy seasons with the 400 MHz antenna. Data acquired: (A) Inside the grave during the dry period. (B) Over the target during the dry period. (C) Inside the grave during the rainy period. (D) Over the target during the rainy period. (E) Illustrative model of the buried target in the burial scenario.
Figures 8A–D exhibit radargrams over SEP04 captured with a 400 MHz frequency during the dry and rainy periods. Figure 8A displays the radargram inside the grave during the dry season, where no notable anomalies are observed. Figure 8B shows the radargram over the buried target during the dry season, revealing the target’s hyperbola. In Figure 8C, inside the grave during the rainy season, a medium-to high-amplitude hyperbola corresponds to the sand-clay mixture and gravel layers. Figure 8D displays the radargram over the buried target during the rainy season, indicating signal attenuation and hyperbolas corresponding to the target’s position.
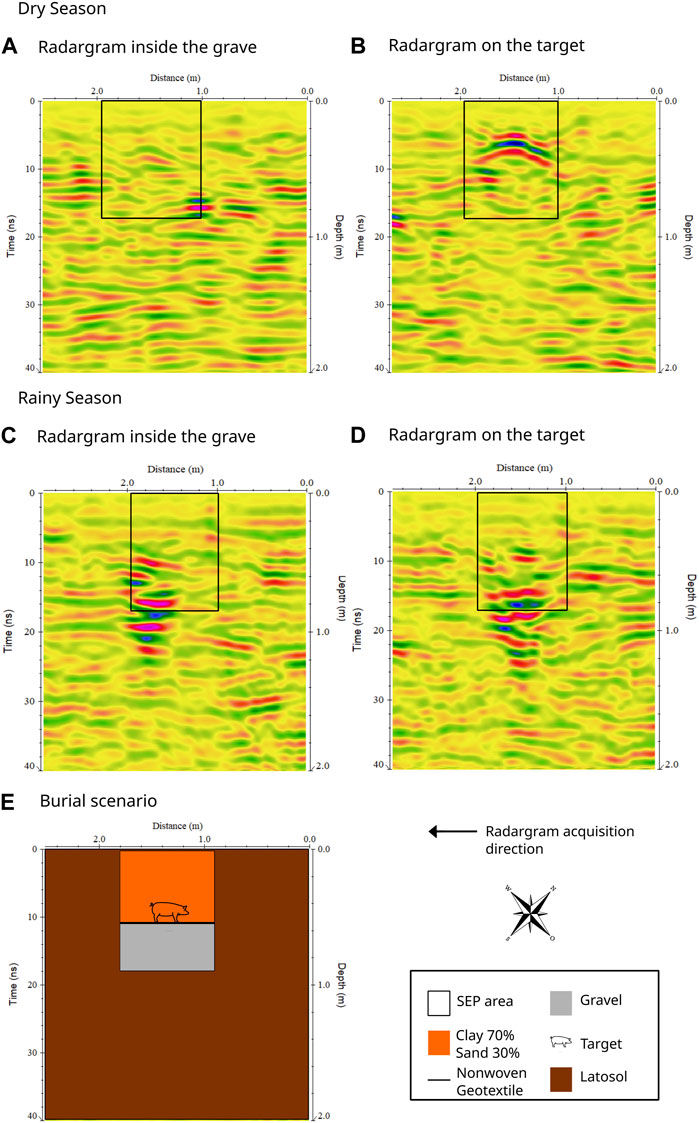
Figure 8. Radargrams obtained over SEP04 during dry and rainy seasons with the 400 MHz antenna. Data acquired: (A) Inside the grave during the dry period. (B) Over the target during the dry period. (C) Inside the grave during the rainy period. (D) Over the target during the rainy period. (E) Illustrative model of the buried target in the burial scenario.
Figures 9A–D present radargrams over SEP01 and SEP02 captured with a 900 MHz frequency during dry and rainy periods. Figure 9A shows the radargram inside the grave during the dry season, revealing reflections from all the layers observed in the burial scenario. Figure 9B displays the radargram over the buried targets during the dry season, indicating hyperbolas corresponding to the targets. Figures 9C, D show radargrams during the rainy season; they exhibit reflections from all layers observed in the burial scenario, with Figure 8D indicating hyperbolas corresponding to the targets.
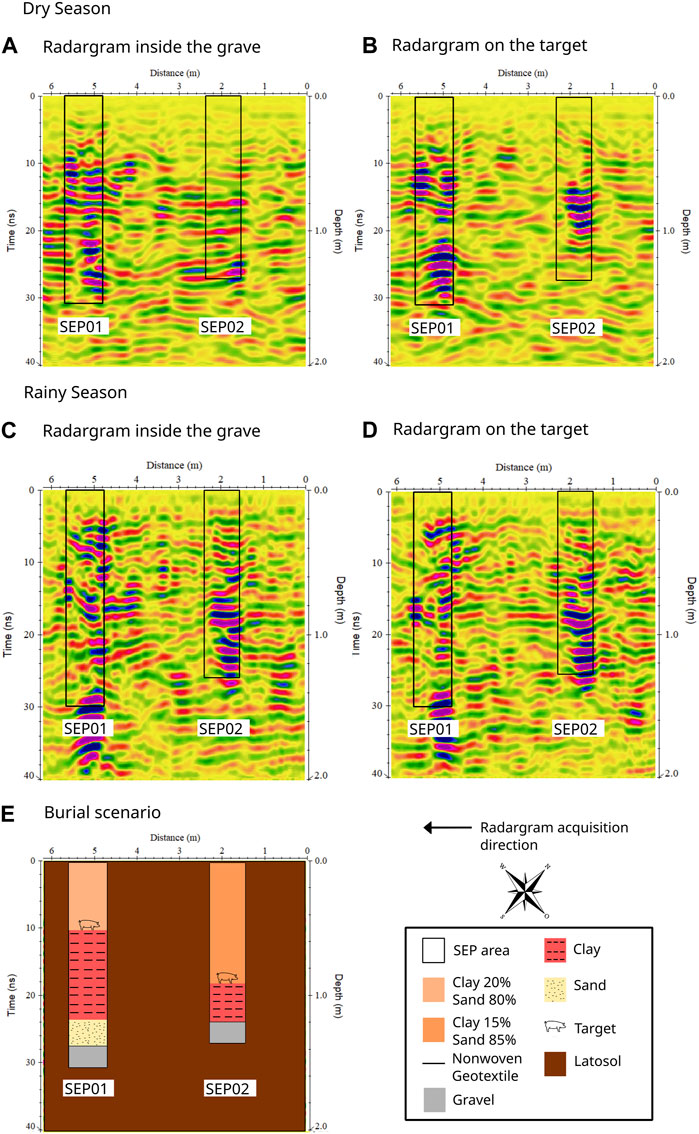
Figure 9. Radargrams obtained over SEP01 and SEP02 during dry and rainy seasons with the 900 MHz antenna. Data acquired: (A) Inside the grave during the dry period. (B) Over the target during the dry period. (C) Inside the grave during the rainy period. (D) Over the target during the rainy period. (E) Illustrative model of the buried target in the burial scenario.
Figures 10A–D present radargrams over SEP03 using a 900 MHz frequency during the dry and rainy periods, with Figure 10A showing the radargram inside the grave during the dry season, indicating a reflection corresponding to the PVC pipe. Figures 10B,D display radargrams over the buried target during both dry and rainy seasons; they indicate hyperbolas corresponding to the targets.
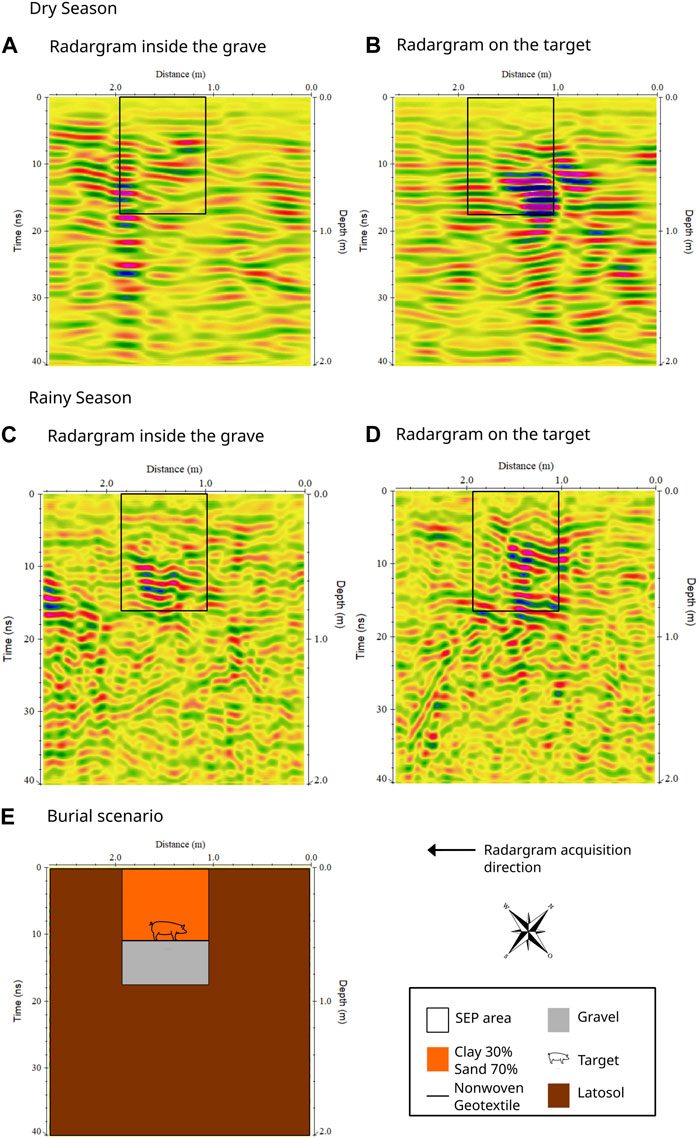
Figure 10. Radargrams obtained over SEP03 during dry and rainy seasons with the 900 MHz antenna. Data acquired: (A) Inside the grave during the dry period. (B) Over the target during the dry period. (C) Inside the grave during the rainy period. (D) Over the target during the rainy period. (E) Illustrative model of the buried target in the burial scenario.
Figures 11A–D show radargrams over SEP04 using a 900 MHz frequency during the dry and rainy periods, with Figure 11A revealing a reflection corresponding to the gravel layer during the dry season. Figures 11B,D display radargrams over the buried target during both the dry and rainy seasons; they indicate hyperbolas corresponding to the targets.
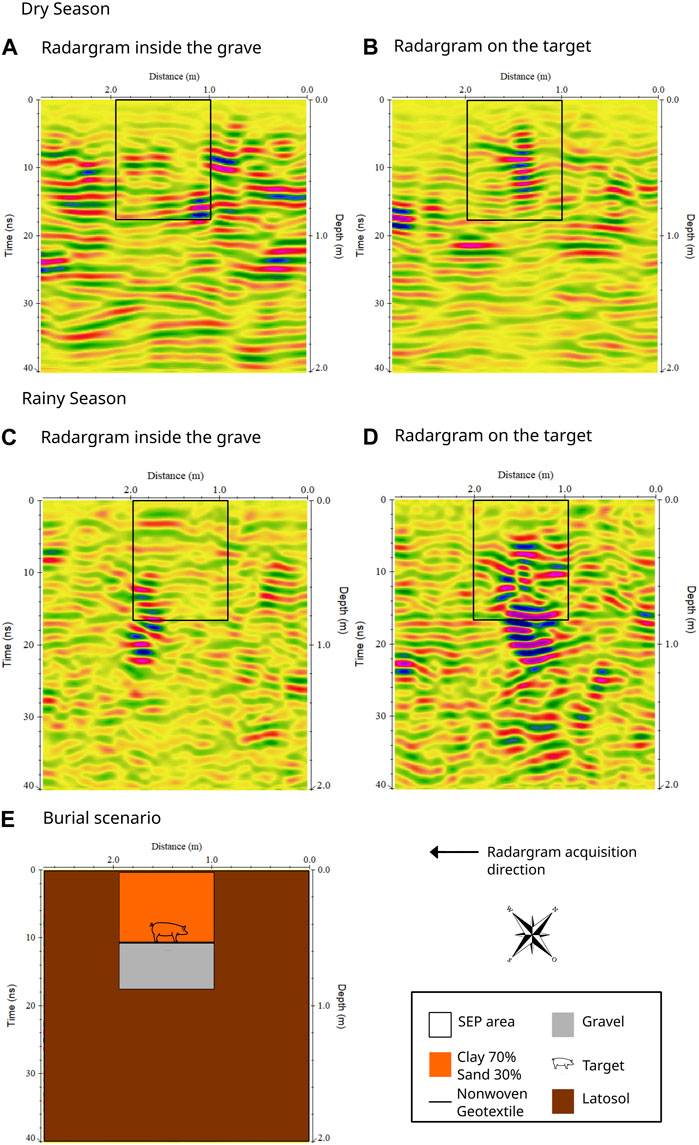
Figure 11. Radargrams obtained over SEP04 during dry and rainy seasons with the 900 MHz antenna. Data acquired: (A) Inside the grave during the dry period. (B) Over the target during the dry period. (C) Inside the grave during the rainy period. (D) Over the target during the rainy period. (E) Illustrative model of the buried target in the burial scenario.
In this method, the radargrams are acquired perpendicular to the axis of the buried target. This means that the electromagnetic waves travel from one side of the target to the other. This type of acquisition is useful for detecting abrupt changes in subsurface properties, such as interfaces between different layers or the presence of buried objects, such as a tomb or a buried box. Transverse radargrams offer a lateral view of the target, which can aid in assessing its shape and lateral extent.
In Figures 12A–I, radargrams transversely obtained over SEP01 to SEP04 and their respective burial scenario models are presented; they were acquired by utilizing a 400 MHz frequency during both the dry and rainy periods.
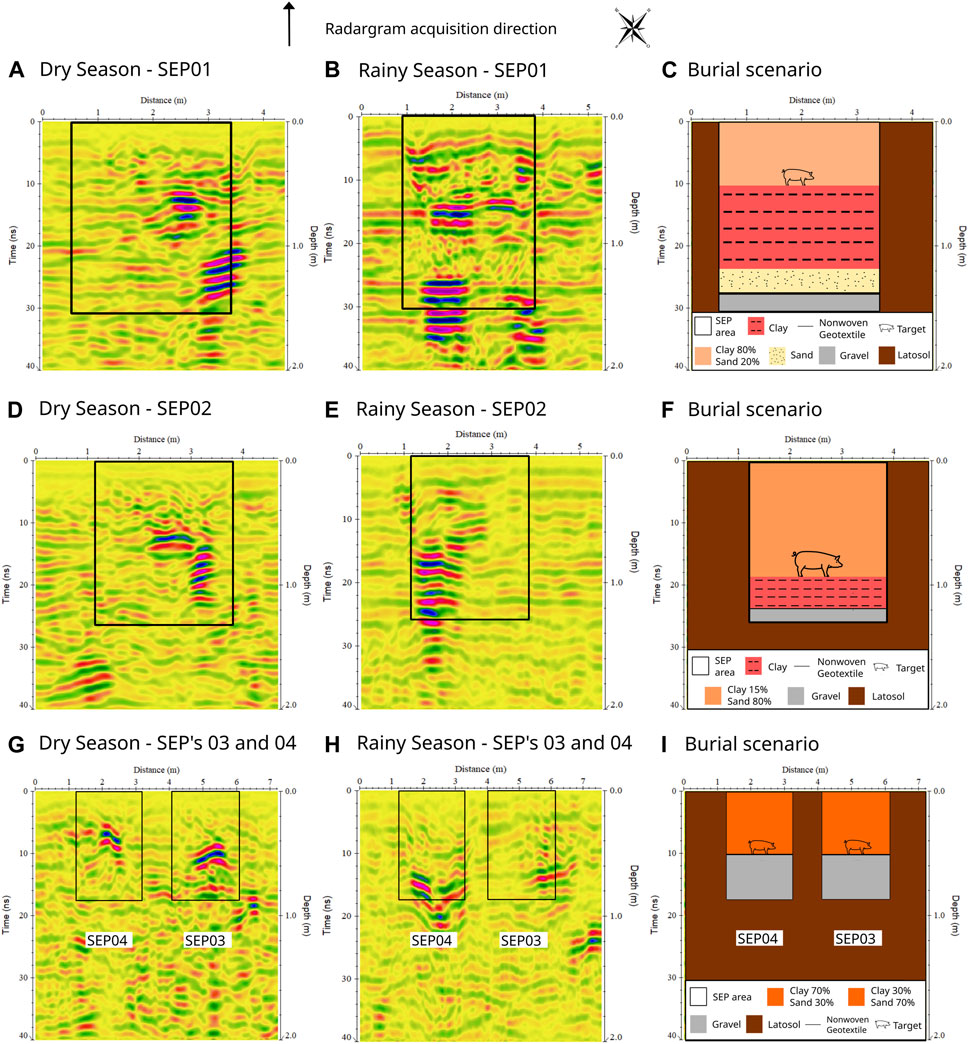
Figure 12. Radargrams obtained transversely over the SEP’s, and their respective models illustrate the buried targets’ burial scenario. Data were acquired with the 400 MHz antenna during dry and rainy seasons.
Figure 12A depicts a GPR profile over SEP01 during the dry season, revealing heterogeneous reflectors within the grave and a less prominent hyperbola representing the target. Figure 12B shows a GPR profile over SEP01 during the rainy season, with distinct hyperbolas indicating soil layers and the target’s position. Figure 12D presents a GPR profile taken transversely over SEP02 during the dry season, showing reflections suggesting the target’s presence and layer interfaces. In contrast, Figure 12E displays a GPR profile over SEP02 during the rainy season, highlighting hyperbolas corresponding to different soil layers and the target’s position. In Figures 12G, H, GPR profiles taken transversely over SEP03 and SEP04 during both the dry and rainy seasons are depicted. Reflectors corresponding to gravel layers and targets are visible, with notable differences in the signal strength and attenuation between seasons.
In Figures 13A–I, GPR profiles conducted transversely over SEP01 to SEP04 and their respective burial scenario models are presented; they were acquired by utilizing a 900 MHz frequency during both the dry and rainy periods.
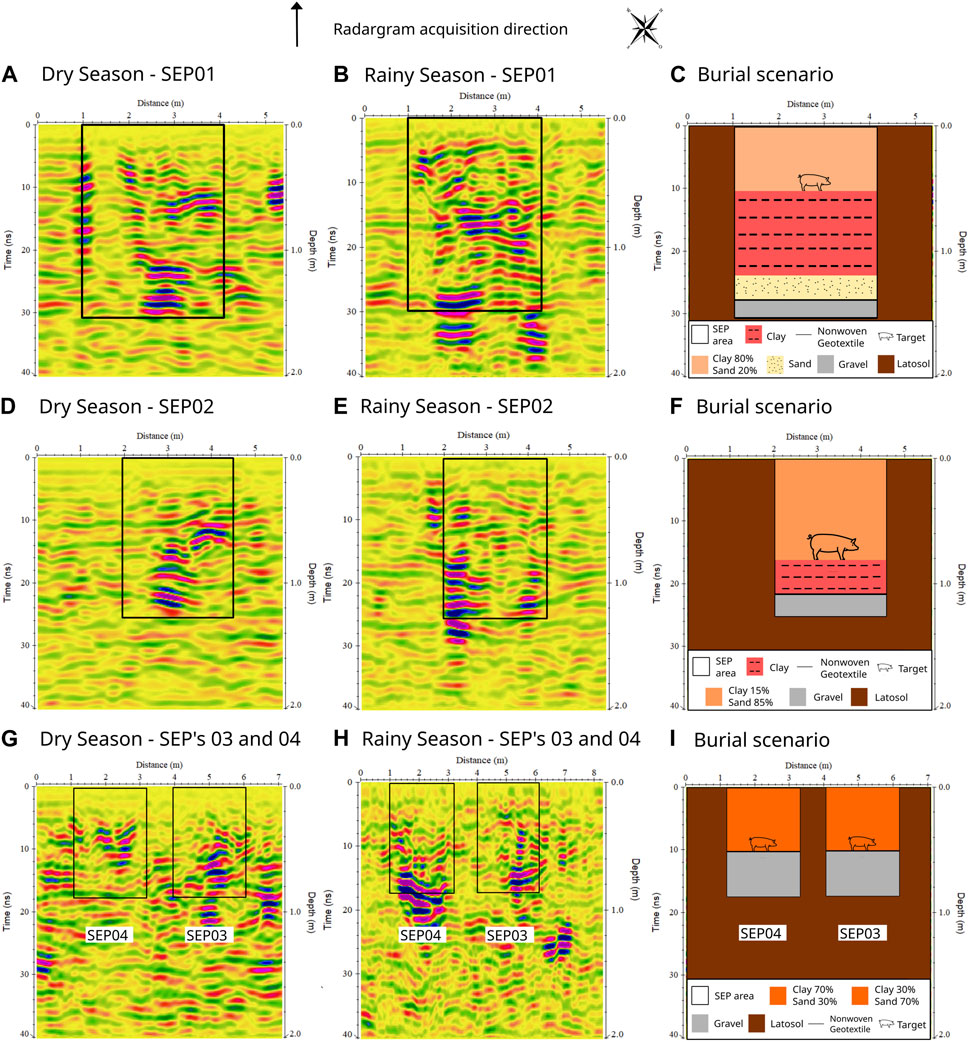
Figure 13. Radargrams obtained transversely over the SEP’s, and their respective models illustrate the buried targets’ burial scenario. Data were acquired with the 900 MHz antenna during dry and rainy seasons.
Figure 13A displays a GPR profile over SEP01 during the dry season; it shows various reflections and the absence of a signal at the grave’s beginning. Figure 13B shows a GPR profile over SEP01 during the rainy season; it indicates signal attenuation near the target’s position. Figure 13D presents a GPR profile taken transversely over SEP02 during the dry season, highlighting reflections indicating the target’s position and soil layer interfaces. In contrast, Figure 13E displays a GPR profile over SEP02 during the rainy season; it shows hyperbolas corresponding to different soil layers and the target’s position. In Figures 13G, H, transverse GPR profiles over SEP03 and SEP04 during both the dry and rainy seasons are depicted; they show reflectors corresponding to gravel layers and targets, with variations in the signal strength and attenuation between seasons.
In Figures 14A–F, the depth-sliced diagram blocks from the GPR profile radargrams conducted on SEPs with a 400 MHz frequency are presented for the dry and rainy periods, respectively; Figures 15A–F present the same data but with a 900 MHz frequency. The depth slicing for SEP01 (Figures 14A,B; Figures 15A,B) was performed at 0.5 m, while for SEP02, it was performed at 0.9 m. Black rectangles outline the burials, and the targets exhibit medium to high amplitudes. The depth slicing for SEP03 was at a depth of 0.5 m, and the black rectangle outlines the interment (Figures 14C, D; Figures 15C, D). The buried target exhibits medium to high amplitudes, with a notable shift in fluid migration observed in the depth slices. The depth slicing for SEP04 was at a depth of 0.5 m, with the buried target exhibiting medium to high amplitudes (Figures 14C, D; Figures 15C, D). A distinct downward displacement due to fluid migration is observed in these depth slices.
Figure 14. Data acquired with 400 MHz antenna. (A) Block diagram formed with the radargrams obtained over SEP01 and SEP02 in the depth slicing mode during dry season. (B) Block diagram formed with the radargrams obtained over SEP01 and SEP02 in the depth slicing mode during rainy season. (C) Block diagram formed with the radargrams obtained over SEP03 in the depth slicing mode during dry season. (D) Block diagram formed with the radargrams obtained over SEP03 in the depth slicing mode during rainy season. (E) Block diagram formed with the radargrams obtained over the SEP04 in the depth slicing mode during dry season. (F) Block diagram formed with the radargrams obtained over the SEP04 in the depth slicing mode during rainy season.
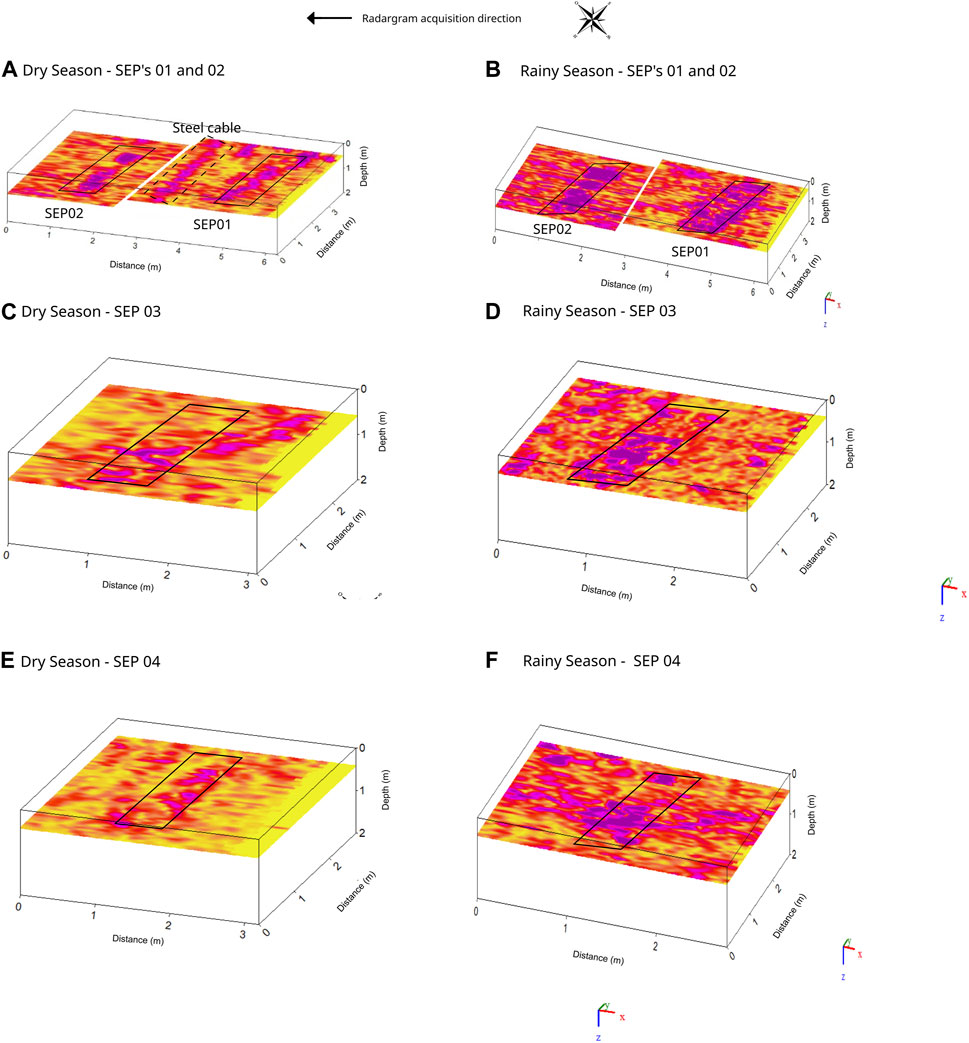
Figure 15. Data acquired with 900 MHz antenna. (A) Block diagram formed with the radargrams obtained over SEP01 and SEP02 in the depth slicing mode during dry season. (B) Block diagram formed with the radargrams obtained over SEP01 and SEP02 in the depth slicing mode during rainy season. (C) Block diagram formed with the radargrams obtained over SEP03 in the depth slicing mode during dry season. (D) Block diagram formed with the radargrams obtained over SEP03 in the depth slicing mode during rainy season. (E) Block diagram formed with the radargrams obtained over the SEP04 in the depth slicing mode during dry season. (F) Block diagram formed with the radargrams obtained over the SEP04 in the depth slicing mode during rainy season.
We observed a remarkable migration of fluids in the direction of the gravitational force, leading to a consequential alteration in the position of the anomaly relative to the target. We observed this phenomenon better in in-depth slices, where a downward displacement of a few centimeters occurred. The displacement is more distinctly observable in the depth slices acquired with the 400 MHz antenna. In the depth slices observed in Figures 14C, D, this displacement occurred at depths of 0.47–0.50 m, while in Figures 14E, F, we observed this displacement in the depth range of 0.32–0.46 m.
With information about the actual positions of buried targets, it is possible to determine their locations when interpreting the radargrams obtained. Furthermore, it is possible to accurately assess the ideal frequency, grave composition, and season (dry or rainy) for identifying buried forensic targets with more precision.
In Figure 6B (SEP02), 8b, 9b (SEP02), 11b, 12d–g (SEP04), and 13d–g (SEP04), we observed the attenuation of the GPR signal after the target reflection, varying according to the size of the targets and the filling mixture of the graves, as shown in Table 1. In SEP02 and SEP04, these targets have larger dimensions. In SEP04, the concentration of clayey material is higher than in the other SEPs, causing a more significant attenuation of the GPR signal, which is visible, for example, starting at 25 ns in Figure 9B (SEP02) and 15 ns in Figure 12G (SEP04).
We observed indicators of the presence of disturbed soil in areas corresponding to the grave by comparing the radargrams of GPR profiles executed outside the grave and over the targets. As seen in the radargrams presented in the results, the 400 MHz frequency provides a better identification of the disturbed soil, which is visible, for example, in Figure 12D from 1.2 m to 3.8 m and Figure 6B from 1.0 m to 2.0 m.
The best reflection results obtained with the 2D GPR profile radargrams conducted parallel to the targeted areas were observed in SEP01 and SEP02. These sites, characterized by a lower proportion of clayey material, exhibit minimal attenuation of the GPR signal, resulting in optimal detection outcomes. Remarkably, these outcomes were consistently achieved across both the 400 MHz and 900 MHz frequencies.
Regarding the sand-clay composition within the burial sites and the parallel 2D GPR profile radargrams, the second-best outcomes were observed in SEP04 at both frequency ranges. Despite presenting the second-highest efficacy in target visualization, credit is attributed to the balanced sand (30%) and clay (70%) mixture rather than the target size. This underscores that the presence of clayey material in the soil does not hinder the detection process, especially for larger forensic targets.
Lastly, considering the influence of the sand-clay proportion in detecting the buried target, SEP03, due to the target’s dimensions and the texture composition of the grave fill material (Table 1), resulted in an imprecise identification of the pig at both studied frequencies with parallel 2D radargrams. Even the layer of crushed stone did not show a clear reflection.
The best reflection results obtained with the 2D GPR profile radargrams executed transversely over the sought-after targets were observed in SEP01 and SEP02, which exhibit a lower attenuation of the GPR signal due to their composition, which has a lower concentration of clayey material. Consequently, the radargrams provide more detailed subsurface information and indicate the sought-after targets at both the 400 MHz and 900 MHz frequencies.
SEP03 showed the second-best result in terms of the level of detail at both studied frequencies, making it possible to identify the sought-after target and obtain information about the sand and clay proportions in the graves.
Lastly, considering the influence of the texture composition of the grave fill material (Table 1) in detecting the buried target, SEP04 allowed the identification of the pig at both studied frequencies. Nevertheless, the attenuation of the GPR signal hindered the attainment of finer details, thereby impeding the identification of the gravel layer.
In Figures 6C, D (SEP01), with a frequency of 400 MHz, the attenuation of the electromagnetic wave signal transmitted by the GPR is observed in the layer of clayey material. Conversely, with the 900 MHz antenna, as seen in Figures 9C, D, there is a wealth of details in the graves (SEPs), albeit with diffuse reflections. In SEP02 (Figure 9D), the electromagnetic signal attenuates after the grave ends, unlike in SEP01, where the signal propagates with high-amplitude hyperbolas.
In Figure 8D (SEP03), with the 400 MHz antenna, there are no indications of the presence of a target, which we expected. This response occurs because, as stated in Table 1, the target has small dimensions, and data acquisition during the rainy season was conducted more than 6 months after the pig’s burial. Additionally, the signal is heavily attenuated throughout the SEP, displaying low-to medium-amplitude hyperbolas only in the area corresponding to the gravel layer. Figure 11D (SEP03), with the 900 MHz antenna, exhibits diffuse reflections and hyperbolas in the region of the buried target, but they are inconclusive regarding the presence of a buried object.
Signal attenuation in the region corresponding to the target and some reflections appeared in the region corresponding to the gravel layer in SEP04, with the 400 MHz antenna (Figure 8D). Strong signal attenuation with the 900 MHz antenna was recorded in the grave without the target until the gravel layer was reached (Figure 11C), while reflections appear very diffusely (Figure 11D).
The radargrams obtained transversely over the graves at a frequency of 400 MHz did not highlight the target location in any of the graves (Figures 12B–H), because SEP01 displays highly diffuse reflections (Figure 12B) and SEP02 shows high signal attenuation. The left side of the grave shows hyperbolas with higher amplitude, none of which correspond to the pig’s location (Figures 12E). In SEP03 and SEP04, the signal exhibits high attenuation, and clear hyperbolas are only visible in the region corresponding to the gravel layer.
Figures 13B,E, H showcase radargrams captured transversely over the graves using a 900 MHz antenna. In SEP01 (Figure 13B), despite diffuse reflections, detailed layers of the grave are discernible. Conversely, in SEP02 (Figure 13E), significant signal attenuation is evident, with hyperbolas exhibiting lower attenuation visible only along the grave’s periphery. Similarly, in SEP03 and SEP04, pronounced signal attenuation is observed around the target’s area, accompanied by hyperbolas displaying higher amplitudes within the gravel layer.
The best reflection was obtained with the 2D GPR profiles (400 MHz and 900 MHz frequencies) executed parallel to the sought-after targets in SEP01 and SEP02 due to their composition; they had a lower concentration of clayey material that exhibited less attenuation of the GPR signal. This is in contrast with the 2D GPR profile radargrams executed transversely over the targets at the 400 MHz and 900 MHz frequencies, which provided imprecise results in almost all graves due to the high signal attenuation.
Moist and clay-rich soils generally cause high signal attenuation in GPR (Doolittle and Collins, 1995; Annan, 2004; Linford and Linford, 2004; Schulze, 2005). However, some authors have indicated that the penetration depth is directly related to the clay mineralogy. For instance, Conyers and Connell (2007) demonstrate that kaolinite clay allows electromagnetic energy transmission. In contrast, McDonald et al. (2005) show that montmorillonite clay significantly diminishes most of the radar signal in the subsurface (Barone et al., 2013).
As expected, electromagnetic waves exhibited reduced penetrability during the rainy season due to water absorbing and dispersing a significant amount of energy, as shown in Figures 6, 7. Given that the buried targets were at shallow depths, this characteristic of electromagnetic waves in moist soils was not a hindrance. We also noted that the signal attenuation increased with a higher clay content in the layer mixture.
The 2D GPR profiles conducted parallel to the targets in SEP01 and SEP02 during the rainy period revealed hyperbolas with higher amplitudes and occasionally even greater layer detail at both frequencies. However, the dry season offered more clarity for target visualization in the region where the pig was buried. More imprecision in identifying the position’s target occurred in SEP03 during the dry and rainy periods (Figures 7, 10). We attributed this imprecision to the small dimensions of the target (Table 1). During the rainy season, SEP03 displayed more detailed layers, although the influence of the PVC pipe observed in the dry season was absent. In SEP04 (Figures 8, 11), the target was distinctly visible during the dry season, whereas we observed that the signal significantly attenuated in the rainy season. Hyperbolas referring to the target were observable only with the 900 MHz antenna.
In the 2D GPR profiles conducted transversely to the targets during the rainy season at both frequencies (Figures 12, 13), there was substantial signal attenuation, diffuse reflections due to water molecule absorption and dispersion, reduced clarity in the disturbed soil compared to dry season data, and limited target visibility. In the pseudo-3D block diagrams, it was evident that the burials displayed higher amplitudes during the rainy periods due to the higher dielectric constant of moist soil.
The migration process of decomposition fluids is prominently emphasized in the pseudo-3D acquisition depth slices (Figures 14C–F). This is relevant for understanding geophysical phenomena associated with clandestinely buried targets. Factors such as the composition of the SEPs or climatic conditions influence the percolation of fluids resulting from decomposition. Additional experiments are required to determine the most influential factors affecting the outcomes of this experiment. It is noteworthy that in SEP04 (Figures 14E, F), fluid percolation was high compared to SEP03 (Figures 14C, D); this is potentially explained by the larger dimensions of the buried target (Table 1).
Upon comparing the dry and rainy seasons, we can conclude that the best results with 2D GPR profiles executed parallel and transversely to the sought targets were achieved during the dry season. During this period, GPR waves produced more evident reflections, facilitating target detection, and there was less absorption or dispersion of energy due to the reduced water content. Unlike the dry season, larger targets did not exhibit better reflections during the rainy season. In the rainy season, the most influential parameter was the proportions of sand and clay material, which had a lesser impact during the dry season.
In summary, transverse radargrams are more suitable for identifying the presence and shape of buried objects, while parallel radargrams are more suitable for mapping subsurface characteristics in depth and assessing the composition of the subsurface along the profile. Both methods can be complementary and used together for a comprehensive assessment of a forensic site of interest.
As mentioned, this study aimed to evaluate how the clayey soil content, GPR frequency, and data collected under dry and rainy conditions influence the recognition of forensic targets in a controlled environment designed to simulate human burial evidence. We achieved the objective, as evidenced in the above results and discussions, allowing the visualization of the geophysical response of the GPR method on graves with different sand-clay proportions and varying target dimensions in periods of low and high soil moisture.
After analyzing the obtained results, it is noteworthy that soils with higher moisture and clay content typically lead to significant GPR signal attenuation, as indicated by various studies. However, some research suggests that the penetration depth is directly linked to the clay mineralogy. For instance, while kaolinite allows the transmission of electromagnetic energy, montmorillonite can significantly diminish radar signals in the subsurface.
During the rainy season, we observed a reduction in the penetrability of electromagnetic waves due to water absorption and dispersion, as evidenced in our results. However, since our targets were at shallow depths, this characteristic of electromagnetic waves in moist soils did not pose a significant obstacle. Additionally, we observed that signal attenuation increased with a higher clay content in the soil mixture.
The 2D GPR profiles conducted parallel to the targets in SEP01 and SEP02 during the rainy season revealed hyperbolas with higher amplitudes and occasionally greater layer detail at both frequencies. However, the dry season provided more clarity for target visualization in the region where the pig was buried. In SEP03, during both the dry and rainy seasons, we observed more imprecision in identifying the target’s position, attributed to its smaller dimensions.
In the 2D GPR profiles conducted transversely to the targets during the rainy season at both frequencies, there was significant signal attenuation, diffuse reflections due to the absorption and dispersion of water molecules, reduced clarity in the disturbed soil compared to dry season data, and limited target visibility.
The pseudo-3D diagrams highlighted the migration process of decomposition fluids, a crucial aspect for understanding geophysical phenomena associated with clandestinely buried targets. The composition of burial sites and climatic conditions influence the percolation of fluids resulting from decomposition. Further experiments are necessary to determine the most influential factors in the outcomes of this experiment.
Comparing the dry and rainy seasons, we conclude that the best results with 2D GPR profiles executed parallel and transversely to the targets were achieved during the dry season. During this period, GPR waves produced more evident reflections, facilitating target detection, and there was less absorption or dispersion of energy due to the reduced water content. Unlike the dry season, larger targets did not exhibit better reflections during the rainy season. In this season, the most influential parameter was the proportions of sand and clay material, which had less impact during the dry season.
Combining GPR with another geophysical method is recommended to resolve any ambiguities in data interpretation. Other research has already been done with this procedure using electrical tomography and spontaneous potential measurements due to their excellent detection rates, even in clayey soils, and more straightforward data processing compared to GPR.
The raw data supporting the conclusion of this article will be made available by the authors, without undue reservation.
The animal study was approved by the Comitê de ética da Universidade de Brasília, Brasil. The study was conducted in accordance with the local legislation and institutional requirements.
KP Castro: Conceptualization, Formal Analysis, Investigation, Methodology, Project administration, Supervision, Validation, Visualization, Writing–original draft. LS: Conceptualization, Investigation, Methodology, Project administration, Supervision, Validation, Visualization, Writing–review and editing. AS: Investigation, Writing–review and editing. PN: Formal Analysis, Investigation, Writing–review and editing. WB: Investigation, Project administration, Supervision, Writing–review and editing.
The author(s) declare financial support was received for the research, authorship, and/or publication of this article. The authors declare that financial support was received of the CAPES PROAP program, totaling R$7350.
The authors thank all the employees of Fazenda Água Limpa (FAL)/UnB for their work on this project. The authors thank the Geosciences Institute/UnB for their support. The authors thank Hartos Agropecuária Cenci for donating the pig carcasses.
The authors declare that the research was conducted in the absence of any commercial or financial relationships that could be construed as a potential conflict of interest.
All claims expressed in this article are solely those of the authors and do not necessarily represent those of their affiliated organizations, or those of the publisher, the editors and the reviewers. Any product that may be evaluated in this article, or claim that may be made by its manufacturer, is not guaranteed or endorsed by the publisher.
Abate, D., Colls, S. C., Moyssi, N., Karsili, D., Faka, M., Anilir, A., et al. (2019). Optimizing search strategies in mass grave location through the combination of digital technologies. Forensic Sci. Int. 1, 95–107. doi:10.1016/j.fsisyn.2019.05.002
ABNT (1989). Brazilian association of norms techniques. Peneiras para ensaio com telas de tecido metálico. NBR 5734.
Almeida, E. R., Porsani, J. L., Catapano, I., Gennarelli, G., and Soldovieri, F. (2014). GPR data analysis enhanced by microwave tomography for forensic archaeology. Proc. 15th Int. Conf. Ground Penetrating Radar, 474–478. doi:10.1109/ICGPR.2014.6970470
Almeida, E. R., Porsani, J. L., Catapano, I., Gennarelli, G., and Soldovieri, F. (2015). Microwave tomography-enhanced GPR in forensic surveys: the case study of a tropical environment. IEEE J. Sel. Top. Appl. Earth Observations Remote Sens. 9, 115–124. doi:10.1109/jstars.2015.2466556
Annan, A. P. (2004). Ground penetrating radar: principles, procedures and applications. Sensors Softw. Inc. Technical paper.
Aziz, A. S., Stewart, R., Green, S., and Flores, J. (2016). Locating and characterizing burials using 3D ground-penetrating radar (GPR) and terrestrial laser scanning (TLS) at the historic Mueschke Cemetery, Houston, Texas. J. Archaeol. Sci. Rep. 8, 392–405. doi:10.1016/j.jasrep.2016.06.035
Barone, P. M., and Di Maggio, R. M. (2019). Forensic geophysics: ground penetrating radar (GPR) techniques and missing persons investigations. Forensic Sci. Res. 4, 337–340. doi:10.1080/20961790.2019.1675353
Barone, P. M., Matsentidi, D., Mollard, A., Kulengowska, N., and Mistry, M. (2022). Mapping decomposition: a preliminary study of non-destructive detection of simulated body fluids in the shallow subsurface. Forensic Sci. 2, 620–634. doi:10.3390/forensicsci2040046
Barone, P. M., Mattei, E., and Pettinelli, E. (2013). Non-invasive archaeological exploration in stratigraphically complex rural settings: an example from Ferento (Viterbo, Italy). Archaeol. Anthropol. Sci. 5, 267–273. doi:10.1007/s12520-013-0138-3
Berezowski, V., Mallett, X., Ellis, J., and Moffat, I. (2021). Using ground penetrating radar and resistivity methods to locate unmarked graves: a review. Remote Sens. 13, 2880. doi:10.3390/rs13152880
Booth, A. D., and Pringle, J. K. (2016). Semblance analysis to assess GPR data from a five-year forensic study of simulated clandestine graves. J. Appl. Geophys. 125, 37–44. doi:10.1016/j.jappgeo.2015.11.016
Castro, K. C. P. L. (2021). Aplicação de Ground Penetrating Radar (GPR) para Identificação de Evidências Forenses no Sítio Controlado Fazenda Água Limpa/Universidade de Brasília - DF. 100pp. Trabalho de Conclusão de Curso (Bacharelado em Geofísica) – Universidade de Brasília - UnB. Brasil: Brasília.
Castro, K. C. P. L., and Cunha, L. S. (2021). Forensic investigations with the identification of human remains with ground penetrating radar (GPR): a review. Estud. Geol. 31 (2), 64–86. doi:10.51359/1980-8208/estudosgeologicos.v31n2p64-86
Cavalcanti, M. M. (2017). Estudo da Resposta Geofísica em Diferentes Cenários de Sepultamento. Brazil: Ph. D. Thesis. University of Brasilia - IG. Brasília, 197.
Cavalcanti, M. M., Rocha, M. P., Blum, M. L. B., and Borges, W. R. (2018). The forensic geophysical controlled research site of the University of Brasilia, Brazil: results from methods GPR and electrical resistivity tomography. Forensic Sci. Int. 293, 101.e1–101.e21. doi:10.1016/j.forsciint.2018.09.033
Conyers, L. B., and Connell, S. (2007). “An analysis of ground-penetrating radar’s ability to discover and map buried archaeological sites in Hawaii,” in Hawaiian archaeology. Editors M. Desilets, and M. T. Carson 11th edn. (Honolulu, ISSN: Society for Hawaiian Archaeology).
Dick, H. C., and Pringle, J. K. (2018). Inorganic elemental analysis of decomposition fluids of an in situ animal burial. Forensic Sci. Int. 289, 130–139. doi:10.1016/j.forsciint.2018.05.034
Doolittle, J. A., and Collins, M. E. (1995). Use of soil information to determine application of ground penetrating radar. J. Appl. Geophys 33, 101–108. doi:10.1016/0926-9851(94)00031-i
Gomes, M. P., Vital, H., and Macedo, J. W. P. (2011). Fluxo de Processamento aplicado a dados de Sísmica de Alta resolução em ambiente de Plataforma continental. Exemplo: Macau-rn. Rev. Bras. Geofísica 29 (1), 173–186. doi:10.1590/s0102-261x2011000100012
González-Jorge, H., Solla, M., Martínez-Sánchez, J., and Arias, P. (2012). Comparison between laser scanning, single-image rectification and ground-penetrating radar technologies in forensic science. Measurement 45, 836–843. doi:10.1016/j.measurement.2012.02.013
Hansen, J. D., and Pringle, J. K. (2013). Comparison of magnetic, electrical and ground penetrating radar surveys to detect buried forensic objects in semi-urban and domestic patio environments. Geol. Soc. Lond. Spec. Publ. 384, 229–251. doi:10.1144/sp384.13
Lester, J., and Bernold, L. E. (2006). Innovative process to characterize buried utilities using Ground Penetrating Radar. Automation Constr. 16, 546–555. doi:10.1016/j.autcon.2006.09.004
Linford, N., and Linford, P. (2004). Ground penetrating radar survey over a roman building at groundwell ridge, blunsdon st andrew, swindon, UK. Archaeol. Prospect 11, 49–55. doi:10.1002/arp.220
Lowe, A., Beresford, D., Carter, D., Gaspari, F., O'brien, R., and Forbes, S. (2013). Ground penetrating radar use in three contrasting soil textures in southern Ontario. Geol. Soc. Lond. Spec. Publ. 384, 221–228. doi:10.1144/sp384.12
McDonald, L. M., Evangelou, V. P., and Chappel, M. A. (2005). “Cation exchange,” in Encyclopedia of soils in the environment. Editor H. Daniel (Amsterdam: Elsevier Academic Press), Vol. 1, 180–188.
Molina, C. M., Pringle, J. K., Saumett, M., and Evans, G. T. (2016a). Geophysical and botanical monitoring of simulated graves in a tropical rainforest, Colombia, South America. J. Appl. Geophys. 135, 232–242. doi:10.1016/j.jappgeo.2016.10.002
Molina, C. M., Pringle, J. K., Saumett, M., and Evans, G. T. (2016b). Geophysical monitoring of simulated graves with resistivity, magnetic susceptibility, conductivity and GPR in Colombia, South America. Forensic Sci. Int. 261, 106–115. doi:10.1016/j.forsciint.2016.02.009
Molina, C. M., Pringle, J. K., Saumett, M., and Hernández, O. (2015). Preliminary results of sequential monitoring of simulated clandestine graves in Colombia, South America, using ground penetrating radar and botany. Forensic Sci. Int. 248, 61–70. doi:10.1016/j.forsciint.2014.12.011
Olhoeft, G. R. (2000). Maximizing the information return from ground penetrating radar. J. Appl. Geophys. 43, 175–187. doi:10.1016/S0926-9851(99)00057-9
Parker, R., Ruffell, A., Hughes, D., and Pringle, J. K. (2010). Geophysics and the search of freshwater bodies: a review. Sci. Justice 50, 141–149. doi:10.1016/j.scijus.2009.09.001
Powell, K. (2004). Detecting buried human remains using near-surface geophysical instruments. Explor. Geophys. 35, 88–92. doi:10.1071/eg04088
Pringle, J. K., Jervis, J. R., Roberts, D., Dick, H. C., Wisniewski, K. C., Cassidy, N. J., et al. (2016). Long-term geophysical monitoring of simulated clandestine graves using electrical and ground penetrating radar methods: 4-6 Years after burial. J. Forensic Sci. 61, 309–321. doi:10.1111/1556-4029.13009
Pringle, J. K., Stimpson, I. G., Wisniewski, K. C., Heaton, V., Davenward, B., Mirosch, N., et al. (2020). Geophysical monitoring of simulated homicide burials for forensic investigations. Sci. Rep. 10, 7544. doi:10.1038/s41598-020-64262-3
Rubio-Melendi, D., Gonzalez-Quirós, A., Roberts, D., García, M. C. G., Domínguez, A. C., Pringle, J. K., et al. (2018). GPR and ERT detection and characterization of a mass burial, Spanish Civil War, Northern Spain. Forensic Sci. Int. 287, e1–e9. doi:10.1016/j.forsciint.2018.03.034
Ruffell, A., Pringle, J. K., Cassella, J. P., Morgan, R. M., Ferguson, M., Heaton, V., et al. (2017). The use of geoscience methods for aquatic forensic searches. Earth-Science Rev. 171, 323–337. doi:10.1016/j.earscirev.2017.04.012
Sandmeier, K. J. (2014). REFLEXW Version 7.5, Windows 9x/2000/NT. Program for the processing of seismic, acoustic or electromagnetic reflection, refraction and transmission data. Karlsruhe, Germany: Manual of Software.
Schoor, M., Nienaber, W. C., and Marais-Werner, A. (2017). A controlled monitoring study of simulated clandestine graves using 3D ground penetrating radar. Near Surf. Geophys. 15, 274–284. doi:10.3997/1873-0604.2017007
Schultz, J. J. (2008). Sequential monitoring of burials containing small pig cadavers using ground penetrating radar. J. Forensic Sci. 53, 279–287. doi:10.1111/j.1556-4029.2008.00665.x
Schultz, J. J., Collins, M. E., and Falsetti, A. B. (2006). Sequential monitoring of burials containing large pig cadavers using ground-penetrating radar. J. Forensic Sci. 51, 607–616. doi:10.1111/j.1556-4029.2006.00129.x
Schultz, J. J., Falsetti, A. B., Collins, M., Koppenjan, S., and Warren, M. W. (2002). Detection of forensic burials in Florida using GPR. Ninth Int. Conf. Ground Penetrating Radar 4758. doi:10.1117/12.462239
Schultz, J. J., Healy, C., Parker, K., and Lowers, B. (2013). Detecting submerged objects: the application of side scan sonar to forensic contexts. Forensic Sci. Int. 231, 306–316. doi:10.1016/j.forsciint.2013.05.032
Schultz, J. J., and Martin, M. M. (2011). Controlled GPR grave research: comparison of reflection profiles between 500 and 250MHz antennae. Forensic Sci. Int. 209, 64–69. doi:10.1016/j.forsciint.2010.12.012
Schultz, J. J., and Martin, M. M. (2012). Monitoring controlled graves representing common burial scenarios with ground penetrating radar. J. Appl. Geophys. 83, 74–89. doi:10.1016/j.jappgeo.2012.05.006
Schultz, J. J., Walter, B. S., and Healy, C. (2016). Long-term sequential monitoring of controlled graves representing common burial scenarios with ground penetrating radar: years 2 and 3. J. Appl. Geophys. 132, 60–74. doi:10.1016/j.jappgeo.2016.06.015
Schulze, D. G. (2005). “Clay minerals,” in Encyclopedia of soils in the environment. Editor H. Daniel (Amsterdam: Elsevier Academic Press), Vol. 1, 246–254.
Keywords: clandestine grave, controlled research site, forensic science, burials, GPR, ground penetrating radar
Citation: Castro KCPLd, Cunha LSd, Sousa ACdA, Nogueira PV and Borges WR (2024) Influence of the sand-clay ratio of the burial material of forensic targets on ground-penetrating radar (GPR) responses–comparison of dry and rainy season data. Front. Earth Sci. 12:1305496. doi: 10.3389/feart.2024.1305496
Received: 01 October 2023; Accepted: 28 February 2024;
Published: 20 March 2024.
Edited by:
Marcelo Cohen, Federal University of Pará, BrazilReviewed by:
Pier Matteo Barone, American University of Rome, ItalyCopyright © 2024 Castro, Cunha, Sousa, Nogueira and Borges. This is an open-access article distributed under the terms of the Creative Commons Attribution License (CC BY). The use, distribution or reproduction in other forums is permitted, provided the original author(s) and the copyright owner(s) are credited and that the original publication in this journal is cited, in accordance with accepted academic practice. No use, distribution or reproduction is permitted which does not comply with these terms.
*Correspondence: Kimberly Coutinho Paes Leme de Castro, a2ltYmVybHljcGxjYXN0cm9AeWFob28uY29t
Disclaimer: All claims expressed in this article are solely those of the authors and do not necessarily represent those of their affiliated organizations, or those of the publisher, the editors and the reviewers. Any product that may be evaluated in this article or claim that may be made by its manufacturer is not guaranteed or endorsed by the publisher.
Research integrity at Frontiers
Learn more about the work of our research integrity team to safeguard the quality of each article we publish.