 Xiaolang He1,2
 Xinchao Zheng
- 1China Coal Energy Research Institute Co., Ltd., Xi’an, Shaanxi, China
- 2College of Geology and Environment, Xi’an University of Science and Technology, Xi’an, Shaanxi, China
Studying the changes in electrical resistivity of sandstones under various frequencies and saturation levels is important for addressing many geological problems through electrical prospecting. In this study, we investigated the effect of different frequencies (500 Hz–200 kHz) and saturation levels (0%–100%) on the resistivity of sandstone in the Ordos region. Our research indicates that when the saturation level is low (<40%), the resistivity of the sandstone decreases rapidly. With the increase of saturation level, pore water gradually becomes another major factor affecting resistivity in addition to induced polarization effect. When the saturation level is high (>80%), the resistivity tends to stabilize. Additionally, the resistivity of sandstone decreases with the increase of saturation. Furthermore, with an increase in frequency, the rate of reduction in resistivity gradually slows down, and the resistivity of sandstone decreases under the influence of saturation. This study provides a valuable reference for the practical application of sandstone resistivity in geological prospecting.
1 Introduction
Stratigraphic lithologies often presents differences in electrical resistivity, which can be characterized by geophysical methods, in particular for mineral exploration. The induced polarization method is a part of geoelectrical exploration methods used to locate minerals and solve hydrogeology, engineering geology, and other problems based on the induced polarization effect of rocks and ores (e.g., Nunes and Alberto, 2014; Revil et al., 2017; Duvillard et al., 2018). In particular, the spectral induced polarization method (in the frequency domain) allows to obtain the complex resistivity spectra of a medium, which is linked to its conduction and polarization properties (e.g., Tabbagh et al., 2021).
As an important physical parameter of rocks, resistivity affects the propagation of electromagnetic fields in porous media (Liu et al., 2017). Due to its characteristics of accuracy, convenience, and non-destructiveness, resistivity characterization technology has a wide range of applications in geotechnical engineering (Long et al., 2017), petroleum exploration (Senger et al., 2021), and other fields. By measuring the resistivity of rocks, important information such as water saturation (Jiang et al., 2021), porosity (Whitman and Yeboah-Forson, 2015), permeability (Kirkby and Heinson, 2017), rock type and composition (Rekapalli et al., 2015; Senger et al., 2021; Bai et al., 2022a) can be determined. Since Archie first proposed the empirical relationship between rock resistivity, porosity, and water saturation (Archie, 1942), scholars have studied the resistivity changes of rocks on this basis and found that the development of fractures (Yin and Xu, 2021), pressure (Wang et al., 2014), saturation (Yang et al., 2022), and frequency (Zhou and Che, 2021) of rocks affect resistivity changes. The frequency of rock fractures significantly affects the variation of resistivity with water saturation which can be used for fracture detection and evaluation (Lee et al., 2021; Liu et al., 2022). The resistivity of rocks changes rapidly with the expansion of internal fractures (Li et al., 2015). Before rock fracture failure, an increase in compressive stress will increase rock resistivity (Sun et al., 2015), and the combined effect of rock compression and saturation will also affect rock resistivity (Pan et al., 2021).
As sandstones are one of the most common rock formations (Yin et al., 2021), it is essential to study the changes in resistivity to investigate the geological structure and solve related geological problems. Previous studies have focused on the influence of fractures (Park et al., 2017), pressure (Amalokwu and Falcon-Suarez, 2021; Zheng et al., 2023), temperature (Zhang et al., 2016; Liu et al., 2020; Yuan et al., 2022), and rock type (Wu et al., 2023) on rock resistivity. However, research on the resistivity of sandstone is not extensive enough. Therefore, it is significant to study the influence of different saturation and frequency on the resistivity of sandstone, explore the joint action of saturation and induced polarization effect in rocks, and explain the relevant change laws for the practical application of sandstone resistivity.
In this paper, we studied the resistivity changes of middle sandstone in the Ordos at different frequencies and saturations. We obtained the influences of low and high frequencies, low and high saturations on rock resistivity, and the corresponding resistivity values. Additionally, the factors affecting the resistivity change of sandstone at different frequencies and saturation are analyzed. The research results provide a valuable reference for the practical application of sandstone resistivity.
2 Materials and test methods
2.1 Sample preparation and test equipment
The core used for this test was extracted from sandstone in the overlying strata of the Ordos region, located in the Inner Mongolia Autonomous Region of China, as shown in Figure 1. The core was processed into cylindrical samples with dimensions of φ25mm × 50 mm using a coring machine and cutting machine. A total of 15 samples were divided into two groups, namely, SA and SB, based on the variation law of resistivity with saturation. Group SA comprised nine samples, while group SB comprised six samples.
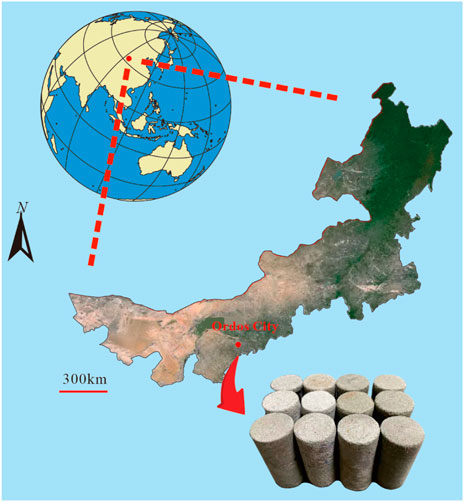
FIGURE 1. Sampling position.
The test employed the following equipment models and main technical parameters.
(1) TH2816A Precision LCR Meter: Resistance display range of 1 × 10⁻⁵ Ω to 100 MΩ; Operating temperature of 0–40°C; Working humidity of RH ≤90%; Margin of error of ±0.05%; Test signal frequency of 50 Hz–200 kHz; Test speed of 32 ms/time.
(2) TDZ5-WS Centrifugal Machine: Maximum speed of 5000 r/min; Maximum relative centrifugal force of 4,390×g; Maximum capacity of 4 × 250 mL; Rotational speed accuracy of ±30 r/min; Time range of 1–99 min.
(3) Mettlee Toledo Me204 Electronic Scale: Measuring range of 0–220 g; Measuring accuracy of 0.0001 g.
2.2 Test process
The processed sample was placed in a drying box and dried at 105°C for 12 h to ensure complete dryness. After weighing, the sample was placed in a vacuum filling device to pump vacuum for 12 h and soaked in water for 2 h for filling. The resistivity measurement method used in this experiment is the two-electrode method. The copper sheet is placed in the upper and lower cross sections of the sample, and the insulating bricks are placed at both ends of the copper sheet to form a closed loop. The positive and negative poles of the resistivity characterization equipment are connected to the copper sheet respectively, and then the resistance of the sample at different frequencies is measured, and the resistivity of the sample is calculated by formula (1).
Where, ρ represents the resistivity of sandstone, measured in Ω·m; R represents the resistance of sandstone, measured in Ω; S represents the cross-sectional area of sandstone, measured in m2; and L represents the length of the sample, measured in m.
After weighing the mass of saturated water, the resistance under the saturated state was measured. The sample was then centrifuged and dehydrated for 5 min, and the mass of the dehydrated sample was measured again. Centrifugation was performed at different speeds (500 r/min, 700 r/min, 1,000 r/min, 1,500 r/min, 2,500 r/min, 4000 r/min) for 5 min, and the test sequence of weighing-resistance-centrifugation was repeated (with centrifugation rate increasing from small to large). The test process is shown in Figure 2. The saturation is calculated using formula (2):
Where Sa represents the saturation of the sample, measured in %; Ws represents the mass of the saturated sample, measured in grams; Wd represents the mass of the sample after drying, measured in grams; and Wc represents the mass of the sample after centrifugation, measured in grams.
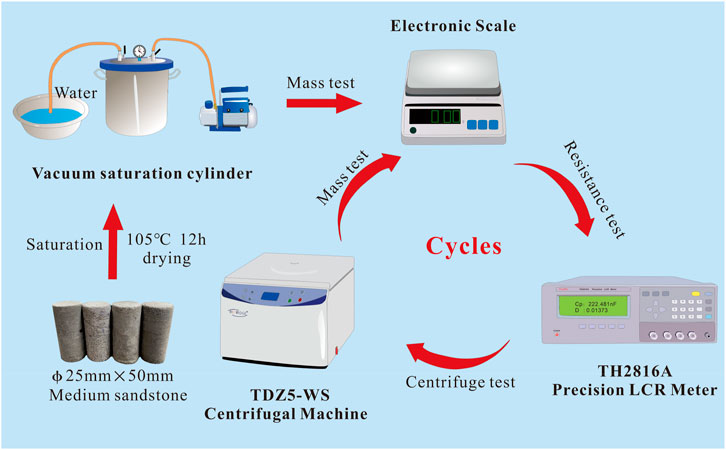
FIGURE 2. Test process.
3 Result
3.1 Resistivity varies with saturation
Table 1 shows the change in saturation of sandstone samples after centrifugation at different speeds. After saturation, all samples had a saturation of 100%. To better describe the test trend, saturation levels less than 40% are referred to as low saturation, saturation levels between 40% and 80% are referred to as medium saturation, and saturation levels greater than 80% are referred to as high saturation. As shown in Figure 3, the resistivity of sandstone decreases with an increase in saturation at frequencies of 500 Hz, 1 kHz, and 10 kHz, with peak resistivity appearing at low saturation. When the frequency is 50 kHz, 100 kHz, and 200 kHz, the resistivity of sandstone first increases and then decreases with an increase in saturation. The peak resistivity appears in the range of 20%–40% saturation. Moreover, the higher the frequency, the lower the peak saturation.
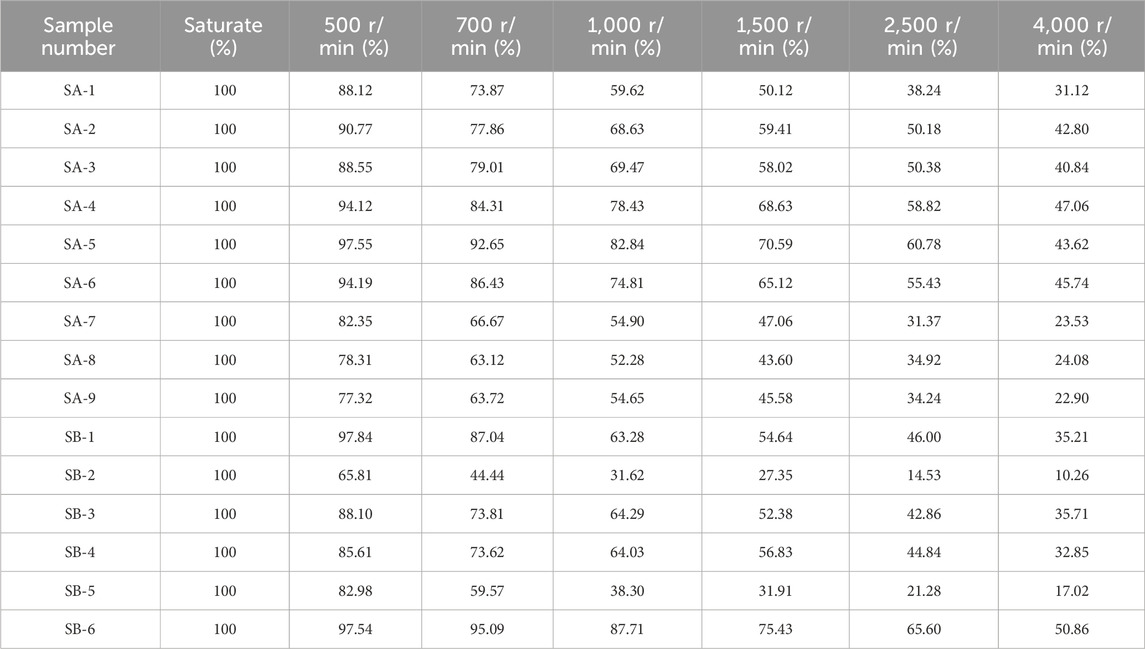
TABLE 1. Saturation changes at different centrifugal speeds.
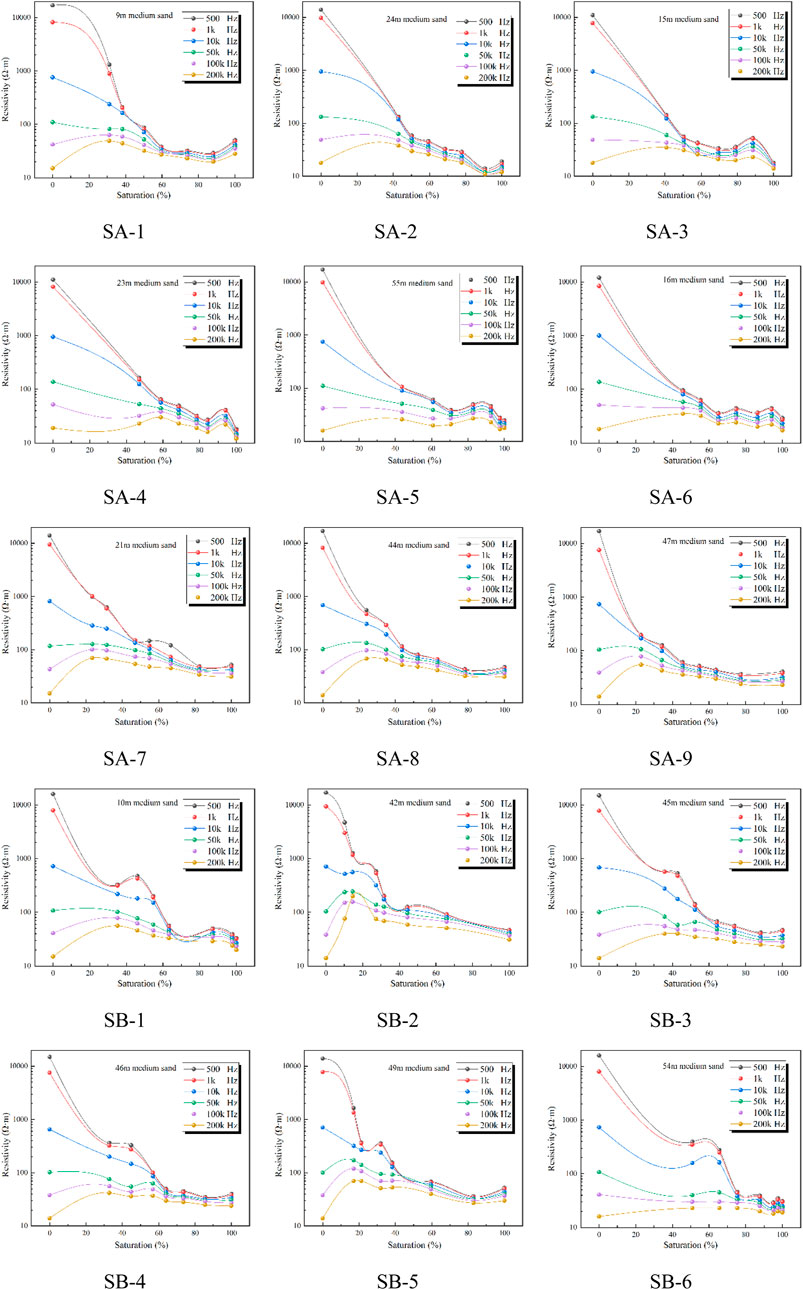
FIGURE 3. Variation trend of sandstone resistivity with saturation.
Based on the variation trend of resistivity with saturation at low frequency, the variation can be divided into two modes, namely, A and B. As depicted in Figure 4, in mode A, the resistivity showed a rapid decline at low saturation, followed by a steady decline as the saturation increased from low to medium-high levels. In mode B, the resistivity also decreased rapidly at low saturation and remained stable as the saturation increased from low to medium levels. After reaching a resistivity plateau, the resistivity continued to decrease with an increase in saturation and showed a steady decline as the saturation changed from medium to high levels.
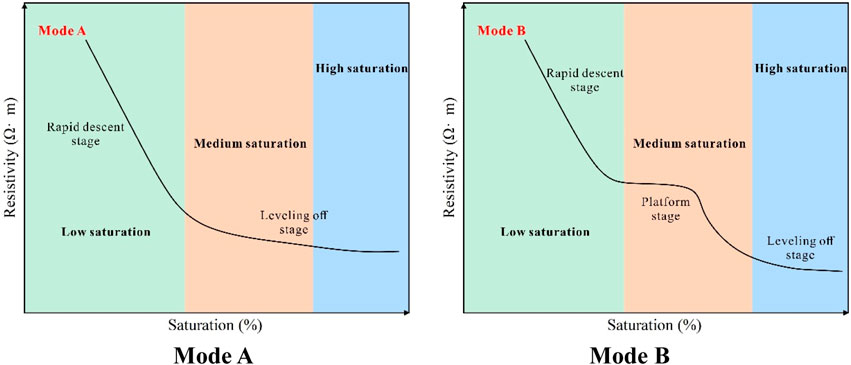
FIGURE 4. Variation pattern of resistivity with saturation.
3.2 Resistivity varies with frequency
Figure 5 demonstrates that the resistivity of medium sandstone decreases gradually with an increase in frequency. Additionally, the effect of saturation on resistivity decreases as frequency increases. Notably, at 200 kHz, the resistivity of sandstone varies the least with different saturation levels, indicating good resistivity stability. As frequency decreases, the resistivity of sandstone at 100 kHz and 50 kHz remains relatively stable, but the peak resistivity is higher than at 200 kHz.
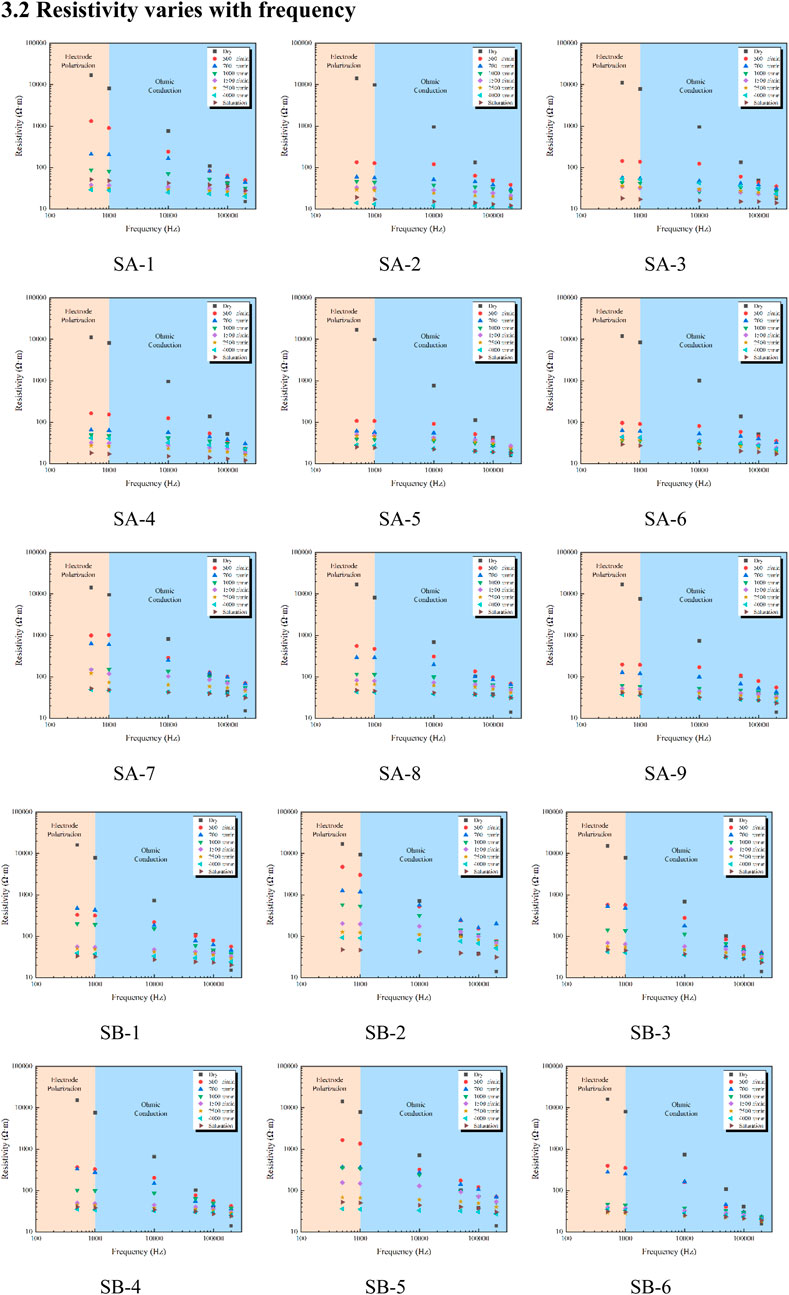
FIGURE 5. Variation trend of sandstone resistivity with frequency.
Under dry conditions (0% saturation), the reduction in sandstone resistivity is most significant with an increase in frequency. Dry sandstone exhibits the highest resistivity at 500 Hz, and the resistivity under dry conditions is most affected by frequency. The maximum resistivity of the sandstone sample is 16,681.25 Ω cm at 500 Hz. At 10 kHz, the maximum resistivity decreases by 94.12%–981.25 Ω cm. Finally, at 200 kHz, the maximum resistivity is only 17.66 Ω cm, which is a mere 0.11% of the resistivity at 500 Hz.
As the saturation level increases, the change in resistivity in a saturated state (100% saturation) decreases with an increase in frequency. The maximum resistivity of the sandstone sample is 51.03 Ω cm at 500 Hz under saturated conditions. This maximum resistivity decreases by 15.39%–43.18 Ω cm at 10 kHz. However, at 200 kHz, the maximum resistivity increases by 59.61% to 30.42 Ω cm compared to the resistivity at 500 Hz.
4 Discussion
The investigation reveals a strong exponential function relationship between resistivity and saturation of sandstone, as shown in Figure 6. When the frequency remains constant, the resistivity displays a rapid decline trend with increasing saturation. As saturation increases, the resistivity gradually stabilizes, indicating that the resistivity of sandstone decreases with increasing water saturation under fixed conditions. At low saturation, electron conduction occurs mainly through the solid phase (Boulahya et al., 2019), some studies have proved that the unconnected pore water dissolves the solid particles around the pores, resulting in a decrease in the adhesion between minerals and a change in the conductivity of the solid particles, and thus a higher resistivity (Bai et al., 2022b). With the saturation increases, the conductivity of sandstone transitions from electronic conduction in the solid state to ionic conduction in the pore water. As the saturation level increases, the ionic mobility also increases, resulting in enhanced conductivity of sandstone (Almpanis et al., 2021).
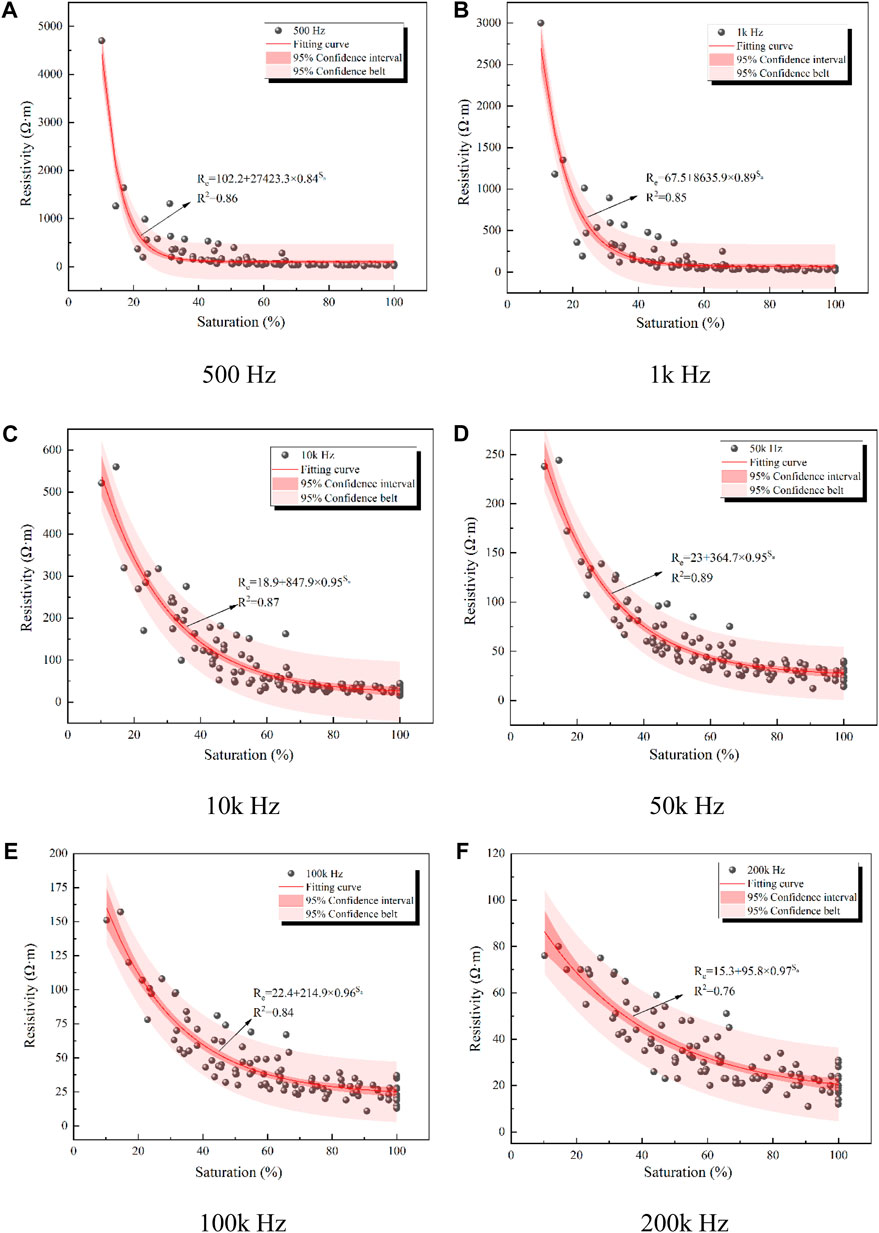
FIGURE 6. Variation trend of sandstone resistivity with frequency.
As the frequency exponential order increases, the resistivity of sandstone tends to decrease when the saturation level is low. Table 2 displays the curve fitting formula for changes in sandstone resistivity with varying saturation levels. The base number of the exponential function increases from 0.84 at 500 Hz to 0.97 at 200 kHz, indicating that the effect of saturation on resistivity diminishes as the frequency increases (Pan et al., 2022). At lower frequencies, there is a substantial difference in resistivity between dry and saturated states, which gradually decreases as frequency increases. The minerals in the sandstone will produce the induced polarization effect under the action of variable frequency electric field. When the saturation is different, the charged particles in the solution will change the conductivity of the sandstone, thus presenting different resistivity (Luo et al., 2022).
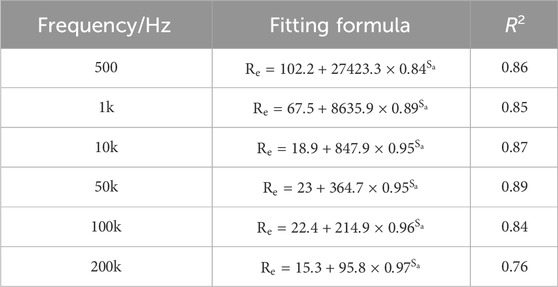
TABLE 2. Fitting curve at different frequencies.
At low water saturation, the resistivity decreases rapidly with the increase of saturation (Figure 4 Rapid descent stage). With the increase of saturation, the water in the sandstone pores has a higher conductivity, which can form a conductive channel and reduce the overall resistance. As the saturation level of pore water increases, the resistivity of sandstone gradually decreases and reaches a plateau (Figure 4 Leveling off stage). The difference between mode A and mode B is that mode B has a plateau stage in medium saturation, which means that the resistivity in this part decreases slowly with the increase of saturation, and this phenomenon deserves attention. The conductivity of sandstone at different frequencies will be affected by polarization, double layer deformation, ion adsorption and other factors, and the measured values will be different (Sikiru et al., 2020), because the charge accumulated by the Maxwell-wagner polarization effect may still exist after the electric field is removed, it contributes to the resistance measurement process. In addition, Maxwell Wagner polarization occurs under high frequency conditions (Han et al., 2020), since sandstone is in line with Ohm’s law when tested at this frequency, it is less affected by polarization, and is a commonly used frequency band for testing, known as ohmic conduction.
Figure 7 is a schematic diagram of the effect of pore water on rock resistivity. The induced polarization effect in rock is closely related to the double-layer electrical phenomenon at the interface between rock particles and the surrounding solution. This effect causes the cations in the double-layer diffusion zone on the surface of rock particles to move and accumulate around the electrode under the influence of external current, resulting in the formation of a film-like material similar to colloidal particles (Gurin et al., 2015). This phenomenon affects the conductivity of rock, leading to an increase in resistivity. When the frequency is constant, the resistivity of sandstone mainly depends on water saturation, and the resistivity decreases with the increase of water saturation. When the electric field frequency changes, the induced polarization intensity will also change (Dhont and Kang, 2010), and both water saturation and frequency will affect the resistivity.
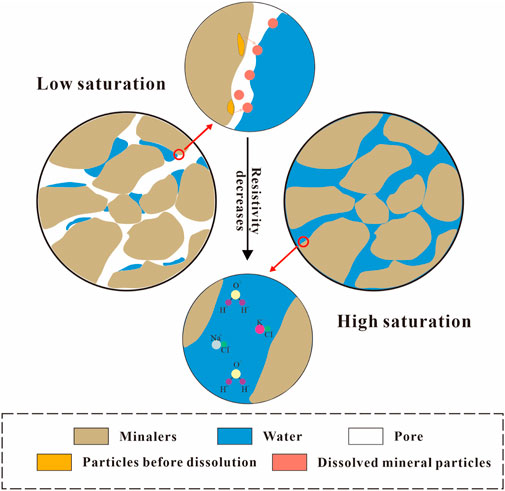
FIGURE 7. Schematic diagram of the effect of pore water on rock resistivity.
Figure 8 shows the proportion of some representative mineral components in model A and Model B. The difference in mineral composition between model A and model B can be seen in Figure 8. The change in resistivity of sandstone is also closely associated with its mineral composition and content (Bai et al., 2021), as the induced polarization effect between minerals varies due to differences in their dielectric constant and dielectric loss (Maineult et al., 2017; Bai et al., 2022a). The biggest difference between mode A and mode B lies in the difference of quartz and feldspar content, and the feldspar content in mode A is lower than that in mode B. Among them, quartz has a weak ability to conduct current, while feldspar has a certain amount of aluminum sodium ions and some oxides, which has a certain conductivity. Under the action of different electric field frequency, mineral content may affect the intensity of induced polarization (Shin et al., 2016). When the frequency is less than 10 kHz, the minerals affected by induced polarization are relatively singular, leading to a higher resistivity. However, when the frequency is higher than 10 kHz, the minerals are subject to more types of induced polarization (Zhdanov et al., 2018; Xin et al., 2022), resulting in a reduction in resistivity. This leads to a significant difference between mode A and mode B and the corresponding mineral composition proportions of sandstone.
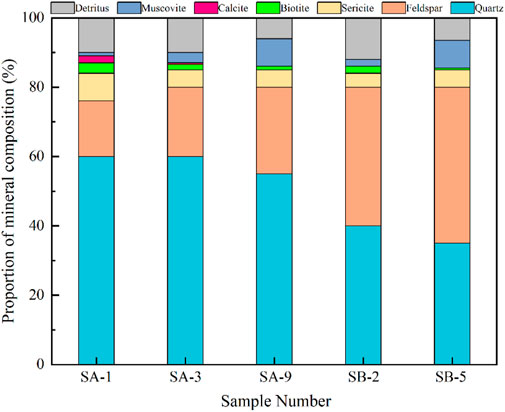
FIGURE 8. Mineral composition of sandstone under two models A and B.
5 Conclusion
This study aimed to investigate the changes in resistivity of medium sandstone from the Ordos area under different frequency and saturation conditions and analyze the factors affecting resistivity. The factors affecting the resistivity change of sandstone at different frequencies and saturation are analyzed. The research results provide a valuable reference for the practical application of sandstone resistivity. Furthermore, the content of feldspar and quartz in sandstone influences the resistivity trend under medium saturation. These findings offer valuable insights for the practical application of sandstone resistivity. Therefore, the following research conclusions can be drawn.
(1) The resistivity of sandstone decreases with the increase of frequency, and the resistivity also decreases with the increase of saturation.
(2) Saturation affects the resistivity of sandstone. With the increase of saturation, the resistivity decreases exponentially. With the increase of electric field frequency, the decrease rate of resistivity with the increase of saturation gradually slows down.
(3) The proportion of feldspar mineral content in sandstone affects the variation pattern of resistivity with saturation, with higher feldspar mineral content leading to higher resistivity. At medium saturation, the resistivity of feldspar hinders the conductivity of pore water, inhibiting the decreased trend of sandstone resistivity. However, with increasing saturation, the resistivity eventually decreases and stabilizes.
Data availability statement
The original contributions presented in the study are included in the article/Supplementary material, further inquiries can be directed to the corresponding author.
Author contributions
XH: Conceptualization, Data curation, Investigation, Software, Writing–original draft. XZ: Data curation, Formal Analysis, Software, Supervision, Writing–original draft, Writing–review and editing. ZP: Methodology, Writing–review and editing. WQ: Project administration, Writing–original draft. DD: Validation, Writing–review and editing. PX: Data curation, Writing–review and editing. QZ: Conceptualization, Writing–review and editing.
Funding
The author(s) declare no financial support was received for the research, authorship, and/or publication of this article.
Acknowledgments
The experimental materials and equipment for this research were provided by Xi’an University of Science and Technology.
Conflict of interest
Authors XH, ZP, WQ, DD, PX, and QZ were employed by China Coal Energy Research Institute Co., Ltd.
The remaining author declares that the research was conducted in the absence of any commercial or financial relationships that could be construed as a potential conflict of interest.
The experimental materials and equipment for this research were provided by China Coal Energy Research Institute Co., LTD.
Publisher’s note
All claims expressed in this article are solely those of the authors and do not necessarily represent those of their affiliated organizations, or those of the publisher, the editors and the reviewers. Any product that may be evaluated in this article, or claim that may be made by its manufacturer, is not guaranteed or endorsed by the publisher.
References
Almpanis, A., Gerhard, J., and Power, C. (2021). Mapping and monitoring of DNAPL source zones with combined direct current resistivity and induced polarization: a field-scale numerical investigation. Water Resour. Res. 57 (11), e2021WR031366. doi:10.1029/2021WR031366
Amalokwu, K., and Falcon-Suarez, I. H. (2021). Effective medium modeling of pressure effects on the joint elastic and electrical properties of sandstones. J. Pet. Sci. Eng. 202, 108540. doi:10.1016/j.petrol.2021.108540
Archie, G. E. (1942). The electrical resistivity log as an aid in determining some reservoir characteristics. Trans 146, 54–62. doi:10.2118/942054-G
Bai, G., Sun, Q., Geng, J., Wang, S., and Jing, X. (2022). Resistivity of granite and sandstone varies with frequency and water saturation. Geomech. Geophy. Geo. 8 (6), 198. doi:10.1007/s40948-022-00503-1
Bai, G., Sun, Q., Jia, H., Ge, Z., and Li, P. (2021). Variations in fracture toughness of SCB granite influenced by microwave heating. Eng. Fract. Mech. 258, 108048. doi:10.1016/j.engfracmech.2021.108048
Bai, G., Sun, Q., Jia, H., Ge, Z., Tang, L., and Xue, S. (2022). Mechanical responses of igneous rocks to microwave irradiation: a review. Acta geophys. 70 (3), 1183–1192. doi:10.1007/s11600-022-00789-5
Boulahya, K., Muñoz-Gil, D., Gómez-Herrero, A., Azcondo, M. T., and Amador, U. (2019). Eu2SrCo1.5Fe0.5O7 a new promising Ruddlesden–Popper member as a cathode component for intermediate temperature solid oxide fuel cells. J. Mater. Chem. A 7 (10), 5601–5611. doi:10.1039/c8ta11254a
Dhont, J. K. G., and Kang, K. (2010). Electric-field-induced polarization and interactions of uncharged colloids in salt solutions. Eur. Phys. J. E 33, 51–68. doi:10.1140/epje/i2010-10656-5
Duvillard, P. A., Revil, A., Qi, Y., Soueid Ahmed, A., Coperey, A., and Ravanel, L. (2018). Three-dimensional electrical conductivity and induced polarization tomography of a rock glacier. J. Geophys. Res. Solid Earth. 123 (11), 9528–9554. doi:10.1029/2018JB015965
Gurin, G., Titov, K., Ilyin, Y., and Tarasov, A. (2015). Induced polarization of disseminated electronically conductive minerals: a semi-empirical model. Geophys. J. Int. 200 (3), 1555–1565. doi:10.1093/gji/ggu490
Han, T., Wei, Z., and Fu, L. Y. (2020). Cementation exponent as a geometric factor for the elastic properties of granular rocks. Geophysics 85 (6), MR341–MR349. doi:10.1190/geo2020-0250.1
Jiang, Z., Fu, J., Li, G., Mao, Z., and Zhao, P. (2021). Using resistivity data to study the waterflooding process: a case study in tight sandstone reservoirs of the Ordos Basin, China. Geophysics 86 (2), B55–B65. doi:10.1190/geo2020-0401.1
Kirkby, A., and Heinson, G. (2017). Three-dimensional resistor network modeling of the resistivity and permeability of fractured rocks. J. Geophys. Res. Solid Earth 122, 2653–2669. doi:10.1002/2016JB013854
Lee, H., Lee, J. W., and Oh, T. M. (2021). Permeability evaluation for artificial single rock fracture according to geometric aperture variation using electrical resistivity. J. Rock Mech. Geotech. 13 (4), 787–797. doi:10.1016/j.jrmge.2021.04.003
Li, K., Pan, B., and Horne, R. (2015). Evaluating fractures in rocks from geothermal reservoirs using resistivity at different frequencies. Energy 93, 1230–1238. doi:10.1016/j.energy.2015.09.084
Liu, B., Sun, Y., Wang, B., Han, Y., Zhang, R., and Wang, J. (2020). Effect of water content on mechanical and electrical characteristics of the water-rich sandstone during freezing. Environ. Earth Sci. 79, 236–314. doi:10.1007/s12665-020-08991-8
Liu, H., Jie, T., Li, B., Youming, D., and Chunning, Q. (2017). Study of the low-frequency dispersion of permittivity and resistivity in tight rocks. J. Appl. Geophys. 143, 141–148. doi:10.1016/j.jappgeo.2017.05.018
Liu, Q., Song, D., Qiu, L., Xiao, Y., Yin, S., Peng, Y., et al. (2022). An experimental study of the resistivity response on fracture process of sandstone with pre-existing flaw. Theor. Appl. Fract. Mech. 121, 103487. doi:10.1016/j.tafmec.2022.103487
Long, M., Pfaffhuber, A. A., Bazin, S., Kåsin, K., Gylland, A., and Montaflia, A. (2018). Glacio-marine clay resistivity as a proxy for remoulded shear strength: correlations and limitations. Q. J. Eng. Geol. Hydrogeol. 51 (1), 63–78. doi:10.1144/qjegh2016-136
Luo, Y., Xiang, K., Yan, L., Tong, X., Tan, G., Ruan, J., et al. (2022). Influence of wettability upon IP characteristics of rocks in low porosity and low permeability reservoirs. J. Pet. Sci. Eng. 216, 110752. doi:10.1016/j.petrol.2022.110752
Maineult, A., Jougnot, D., and Revil, A. (2017). Variations of petrophysical properties and spectral induced polarization in response to drainage and imbibition: a study on a correlated random tube network. Geophys. J. Int. 212 (2), 1398–1411. doi:10.1093/gji/ggx474
Nunes, B. A., and Alberto, D. C. (2014). Fluid salinity, clay content, and permeability of rocks determined through complex resistivity partition fraction decomposition. Geophysics 79 (5), 333–347. doi:10.1190/geo2013-0306.1
Pan, B., Ruhan, A., Guo, Y., Zhang, L., Wei, B., and Zhou, W. (2022). An experimental study on the complex resistivity of fractured rock under different saturation conditions. Acta geophys. 70 (3), 1061–1081. doi:10.1007/s11600-022-00762-2
Pan, B. Z., Ruhan, A., Guo, Y., Zhang, L., Wei, B., and Zhou, W., (2021). Study on the relationship between complex resistivity and water saturation in fractured rock at low frequency. Chin. J. Geophys. 64 (10), 3774–3787. doi:10.6038/cjg2021O0084
Park, J., Lee, K. H., Seo, H., Ryu, J., and Lee, I. M. (2017). Role of induced electrical polarization to identify soft ground/fractured rock conditions. J. Appl. Geophys. 137, 63–72. doi:10.1016/j.jappgeo.2016.12.017
Rekapalli, R., Sarma, V. S., and Phukon, P. (2015). Direct resistivity measurements of core sample using a portable in-situ DC resistivity meter in comparison with HERT data. J. Geol. Soc. India. 86, 211–214. doi:10.1007/s12594-015-0300-x
Revil, A., Murugesu, M., Prasad, M., and Le Breton, M. (2017). Alteration of volcanic rocks: a new non-intrusive indicator based on induced polarization measurements. J. Volcanol. Geotherm. Res. 341, 351–362. doi:10.1016/j.jvolgeores.2017.06.016
Senger, K., Birchall, T., Betlem, P., Ogata, K., Ohm, S., Olaussen, S., et al. (2021). Resistivity of reservoir sandstones and organic rich shales on the Barents Shelf: implications for interpreting CSEM data. Geosci. Front. 12 (6), 101063. doi:10.1016/j.gsf.2020.08.007
Shin, S. W., Park, S., and Shin, D. B. (2016). Spectral-induced polarization characterization of rocks from the Handuk iron mine, South Korea. Environ. Earth Sci. 75, 827. doi:10.1007/s12665-016-5618-1
Sikiru, S., Yahya, N., Soleimani, H., Ali, A. M., and Afeez, Y. (2020). Impact of ionic-electromagnetic field interaction on Maxwell-Wagner polarization in porous medium. J. Mol. Liq. 318, 114039. doi:10.1016/j.molliq.2020.114039
Sun, Q., Zhu, S., and Xue, L. (2015). Electrical resistivity variation in uniaxial rock compression. Arab. J. Geosci. 8, 1869–1880. doi:10.1007/s12517-014-1381-3
Tabbagh, A., Rejiba, F., Finco, C., Schamper, C., Souffaché, B., Camerlynck, C., et al. (2021). The case for considering polarization in the interpretation of electrical and electromagnetic measurements in the 3 kHz to 3 MHz frequency range. Surv. Geophys. 42, 377–397. doi:10.1007/s10712-020-09625-1
Wang, D., Yu, Y., and Zhou, Y. (2014). Electrical conductivity anisotropy in alkali feldspar at high temperature and pressure. High. Press. Res. 34 (3), 297–308. doi:10.1080/08957959.2014.913042
Whitman, D., and Yeboah-Forson, A. (2015). Electrical resistivity and porosity structure of the upper biscayne aquifer in miami-dade county, Florida. J. Hydrol. 531, 781–791. doi:10.1016/j.jhydrol.2015.10.049
Wu, F., Cong, L., Ma, W., Liu, J., Dai, J., Nie, X., et al. (2023). Finite element method-based resistivity simulation and water saturation calculation of irregular laminated shaly sandstone. Geomech. Geophys. Geo. 9 (1), 2–19. doi:10.1007/s40948-023-00544-0
Xin, Y., Sun, Q., Jia, H., Yuan, S., Ge, Z., and Tang, L. (2022). Acoustic emission (AE) characteristics of limestone during heating. J. Therm. Anal. Calorim. 147 (23), 13725–13736. doi:10.1007/s10973-022-11519-w
Yang, X., Jiang, A., and Guo, X. (2022). Effects of water content and temperature on creep properties of frozen red sandstone: an experimental study. Bull. Eng. Geol. Environ. 81 (1), 51. doi:10.1007/s10064-021-02553-3
Yin, D., and Xu, Q. (2021). Investigating the damage evolution of sandstone using electrical impedance spectroscopy. Int. J. Rock Mech. Min. 144, 104817. doi:10.1016/j.ijrmms.2021.104817
Yuan, H., Sun, Q., Geng, J., Ge, Z., and Yuan, S. (2022). Acoustic emission characteristics of high-temperature granite through different cooling paths. Geomech. Geophy. Geo. 8 (3), 97. doi:10.1007/s40948-022-00407-0
Zhang, W., Sun, Q., Hao, S. Q., and Yang, L., (2016). Experimental study of the effect of thermal damage on resistivity and mechanical properties of sandstone. Acta Geodyn. Geomater. 13 (2), 185–192. doi:10.13168/AGG.2015.0056
Zhdanov, M. S., Burtman, V., Endo, M., and Lin, W. (2018). Complex resistivity of mineral rocks in the context of the generalised effective-medium theory of the induced polarisation effect. Geophys. Prospect. 66 (4), 798–817. doi:10.1111/1365-2478.12581
Zheng, X., Sun, Q., Jing, X., Yang, D., and Jia, H. (2023). Evolution of pore structure and radon exhalation characterization of porous media grouting. Sci. Total Environ. 865, 161352. doi:10.1016/j.scitotenv.2022.161352
Keywords: resistivity, saturation, frequency, induced polarization effect, sandstone
Citation: He X, Zheng X, Pu Z, Qin W, Duan D, Xie P and Zhang Q (2024) Experimental study of the influence of saturation on the resistivity response of sandstone. Front. Earth Sci. 12:1301184. doi: 10.3389/feart.2024.1301184
Received: 24 September 2023; Accepted: 03 January 2024;
Published: 16 January 2024.
Edited by:
Manoj Khandelwal, Federation University Australia, AustraliaReviewed by:
Alexis Maineult, Centre National de la Recherche Scientifique (CNRS), FranceKripamoy Sarkar, Indian Institute of Technology Dhanbad, India
Copyright © 2024 He, Zheng, Pu, Qin, Duan, Xie and Zhang. This is an open-access article distributed under the terms of the Creative Commons Attribution License (CC BY). The use, distribution or reproduction in other forums is permitted, provided the original author(s) and the copyright owner(s) are credited and that the original publication in this journal is cited, in accordance with accepted academic practice. No use, distribution or reproduction is permitted which does not comply with these terms.
*Correspondence: Xinchao Zheng, emhlbmd4aW5jaGFvQHN0dS54dXN0LmVkdS5jbg==