 Joana Carvalho
 Graça Silveira
 Virgílio B. Mendes1
 Martin Schimmel
94% of researchers rate our articles as excellent or good
Learn more about the work of our research integrity team to safeguard the quality of each article we publish.
Find out more
ORIGINAL RESEARCH article
Front. Earth Sci., 09 April 2024
Sec. Solid Earth Geophysics
Volume 12 - 2024 | https://doi.org/10.3389/feart.2024.1298472
This article is part of the Research TopicChallenges in Seismology to Our Understanding of Volcanic Islands and Their Magmatic UnrestView all 5 articles
Ambient noise correlation analyses are largely used to monitor temporal medium changes generally associated with stress field variations and/or fluid movement. Here, we analyze the 2021 eruption of La Palma, the most active island in the Canary archipelago, to study its effects on the structure in a post-eruptive stage. To date, most of the studies, whether in volcanic environments or other geological systems, focus on determining seismic velocity changes that can be associated with precursory signals. In our study, we are interested in localizing the medium changes that permit constraining the depth of the most affected structure and suggesting possible mechanisms capable of inducing such alterations. The auto- and cross-correlation functions were computed using the phase cross-correlation strategy. The correlations were linearly stacked using a 3-day sliding window. The combination of these two approaches proved to render the best results. The analysis of 3 years of data resulted in the detection of occasional decorrelation before the eruption, followed by a well-defined decoherence period after the eruption. In addition, the relationship between the waveform correlation and lag time, using autocorrelations from before and after the eruption, permits identifying phase shifts and waveform distortion, which are sensitive to different parameters and, thus, have great importance in inferring the possible mechanism. Phase shifts occur when there is only velocity change without changing the structure, whereas waveform distortion is caused by a structural (geological) change. We also inferred the depths at which the most significant medium alterations occur. We observed that the decorrelation occurs at lag times corresponding to changes localized in depth. The surface structure appears to not have undergone significant medium changes for depths until approximately 8 km, either before or after the eruption.
Volcanic activity is a surface expression of the dynamic processes occurring within the earth’s interior. This phenomenon is often accompanied by several recordable seismic signals that can occur before, during, and/or after an eruption. These signals may reflect temporal medium changes in the subsurface seismic structure due to the movement of magmatic or hydrothermal fluids, which can modify the seismic velocity values by altering the elastic properties of the surrounding medium. Monitoring and studying these changes in the seismic wave propagation process over time can provide a better understanding of Earth’s inner state and the geodynamic processes involved in volcanic activity and, in the future, may aid in forecasting this activity.
Medium changes caused by both earthquake and volcanic activities started to be measured by cross-correlating seismograms of repeating earthquakes (e.g., Poupinet et al., 1984) or active sources (e.g., Nishimura et al., 2000; Wegler et al., 2006). However, repeating earthquakes do not occur so often, and explosions can be both destructive and expensive, leading to limited and inadequate data. The development of seismic interferometry overcomes this limitation, allowing the conversion of ambient seismic noise or the scattered coda wave field into meaningful seismic signals that register the seismic velocity distribution within the medium of propagation through the ambient noise cross-correlations (e.g., Lobkis and Weaver, 2001; Campillo and Paul, 2003; Wapenar, 2003; Shapiro and Campillo, 2004; Snieder, 2004; Wapenar, 2004; Shapiro et al., 2005).
Over the past two decades, ambient seismic noise interferometry has been widely applied to measure temporal changes in seismic wave propagation associated with different activities, such as volcanic eruptions (e.g., Sens-Schönfelder and Wegler, 2006; De Plaen et al., 2016; Cubuk-Sabuncu et al., 2021; Ruiz et al., 2022), earthquakes with different magnitudes (high [Ohmi et al., 2008]; moderate [Maeda et al., 2010]; or small [DHour et al., 2015]), landslide monitoring (Bontemps et al., 2020; Le Breton et al., 2021) groundwater fluctuations (Berbellini et al., 2021), and even industrial operations like mining (Lynch and Mendecki, 2001), CO2 storage (Zhao et al., 2022), geothermal energy (Taira et al., 2018; Sanchez-Pastor et al., 2019), or oil and gas extraction (Maxwell et al., 2010). In addition to the wide range of applications, this technique has the advantage of being more sensitive to changes at depths that do not produce measurable deformations of the structure at the surface (Brenguier et al., 2008). Studies focusing on monitoring structural changes typically use many stations and station pairs; however, seismic noise interferometry can also be applied to a single station, as demonstrated by Hobiger et al. (2012), D’Hour et al. (2015), De Plaen et al. (2016), and Ikeda and Takagi (2019), among others. In such cases, the distance between the two stations turns zero, and the cross-correlation function becomes an autocorrelation, providing a zero-offset empirical Green’s function (EGF) that contains information about the local structure beneath the seismic station (Claerbout, 1964; Wapenaar, 2004). For this study, we employ the phase cross-correlation (PCC) technique (Schimmel, 1999) to compute the auto- and cross-correlation functions and the classical correlation to measure the waveform similarity of the noise correlations with respect to a reference waveform. The classical correlation is less sensitive to small waveform changes and, therefore, provides a smaller scatter in the waveform similarity curves (Schimmel, 1999).
The 2021 La Palma eruption offers a great opportunity for examining structural changes over time in response to a series of seismic swarms that were probably caused by the magmatic movement. In our study, we analyze continuous data from January 2020 to November 2022, recorded by two stations deployed on the island—TBT and EHIG. Such a time window was chosen to be able to study the behavior within the volcanic structure before the eruption and its recovery after the eruption. We computed both auto- and cross-correlation functions and analyzed the time evolution of the waveform similarity at different lag time windows. Seismicity and ground deformation accompanying the volcanic activity are compared to the waveform similarity results for a better knowledge of the mechanisms capable of causing the detected temporal changes.
The Canary Islands are an intraplate chain of seven volcanic islands, islets, and seamounts located in the Atlantic Ocean, off the northwest coast of Africa. The islands are underlain by the Jurassic oceanic crust with an age of approximately 175–150 Ma (Schmincke et al., 1998). The oldest islands are located to the east, where the subaerial volcanic activity began at approximately 20 Ma. The westernmost and youngest islands, La Palma and El Hierro, are currently in the shield stage of growth (Ancochea et al., 1993; Galipp et al., 2006) (Figure 1). The east-to-west age progression of the Canary Islands suggests that they were formed by a slow-moving African plate over a hotspot (Hoernle and Schmincke, 1993; Carracedo et al., 2001).
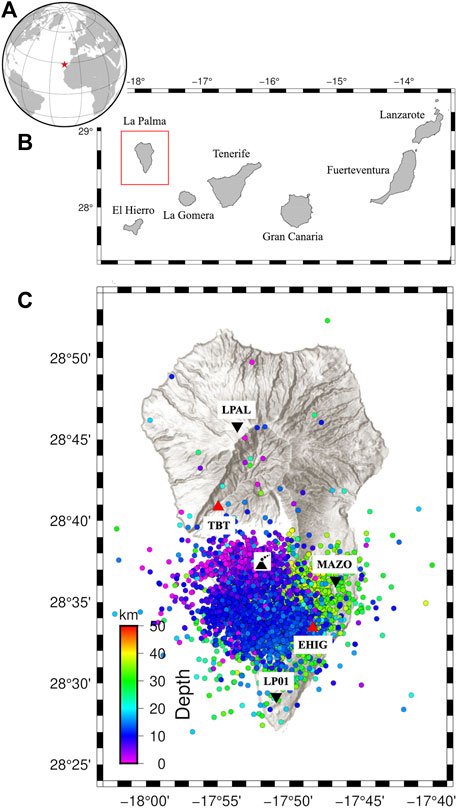
Figure 1. Location of the Canary Islands (A). Islands that compose the archipelago with their respective names. The red square marks the island of La Palma (B). Shaded relief map of La Palma (C). Red triangles represent the seismic stations, and the inverted black triangles are the GPS stations. The seismicity recorded from 2020 to 2022 is represented by colored dots as a function of depth. The eruption center from the 2021 eruption is marked by the volcano symbol.
Volcanic eruptions have occurred across all the Canary Islands over the last million years, except for La Gomera. However, La Palma stands out as the most historically active island, with several relatively recent eruptions sourced by the Cumbre Vieja volcanic rift, including the events in 1585, 1646, 1677–-78, 1712, 1949, 1971, (Carracedo et al., 2001) and, most recently, in 2021. The volcanic history of La Palma began with the formation of the older basal complex (4.0–3.0 Ma [Carracedo et al., 1999; Staudigel et al., 1986]), followed by subaerial volcanic activity (1.8–0.5 Ma) that contributed to the formation of the volcanic series: Garafía volcano, Taburiente shield volcano, Bejenado edifice, and Cumbre Nova (Carracedo et al., 2001). The decrease in volcanic activity at the Taburiente and Bejenado volcanoes pushed the volcanism to the southern part of the island, where the Cumbre Vieja volcanic ridge formed at approximately 125 ka (Bonadonna et al., 2022, and references therein).
The most recent and longest historical eruption of La Palma lasted from 19 September to 13 December 2021; however, the geophysical and geochemical precursory signals started years before. After 50 years of quiescence, unusual seismic activity began with two relatively deep seismic swarms (between 14 and 28 km of depth) recorded in October 2017 and February 2018, with a maximum magnitude of 2.7 (e.g., Torres-González et al., 2020; Carracedo et al., 2022; DAuria et al., 2022). These events were considered the result of magma migration from a deeper (upper mantle) reservoir toward a shallower (sub-crustal) reservoir (Padrón et al., 2022). In addition, changes in helium and carbon dioxide emissions were registered, although no ground deformation was observed (Torres-González et al., 2020). Padrón et al. (2022) suggested that in 2020, 3He-rich less degassed magma intruded at depth, causing a higher degassing of 3He from both reservoirs. This episode may have been responsible for another five seismic swarms, one of which included long-period events. Furthermore, the combination of a fractured crust and continuous 3He degassing maintained a low magmatic volatile pressure, delaying the eruption. A week before the eruption, ground deformation reached its maximum of approximately 20 cm, and the seismicity became intense and shallower, indicating the rapid magma movement toward the surface (Amonte et al., 2022; DAuria et al., 2022).
The impact of the eruption was huge, with lasting effects that continue to affect people’s lives. In fact, according to the air quality permanent monitoring network (https://volcan.lapalma.es/pages/calidad-del-aire), the high concentrations of CO2 of hydrothermal volcanic origin keep two villages uninhabitable (Montesinos et al., 2023).
This eruption is considered one of the largest that has occurred in La Palma. As the first sub-aerial eruption in the Canary Islands to be documented in detail (Wadsworth et al., 2022), it represents a major milestone in our understanding of volcanic activity in the region. Its importance extends far beyond the local community as it has the potential to serve as a valuable proxy for future eruptions not only in the Canaries but also in other intraplate volcanic archipelagos.
The seismic monitoring network in La Palma underwent significant expansion in response to the increasing seismic activity and ground deformation. Prior to October 2017, only five stations were installed; however, during the second half of October 2017, the Instituto Geográfico Nacional (IGN) deployed seven more stations. All seismic stations are equipped with three-component broadband seismometers, sampling at 100 Hz. Of the entire network, the permanent seismic station (TBT) is the only station with free access. Following the eruption, the volcanology group of the IGN decided to grant public access to an additional seismic station—EHIG. Unfortunately, in the EHIG station spectrogram, we detected an atypical signal at approximately 2 Hz, present in most of the days, which we cannot attribute to any specific source. According to the information provided by the IGN, this may be related to a local feature since this signal has been present since 2008. The problem persisted even after changing the instruments. Supplementary Figure S1 of Supplementary Material shows the spectrogram of the unfiltered vertical component and the probabilistic power spectral density (PPSD) of both stations. We return to this topic in the following sections.
For pre-processing, the daily vertical component waveforms are cut into 1-h-length segments. The hourly files are then downsampled from the original 100 Hz to 50 Hz, and the instrument response is removed to obtain ground velocities. The data analyzed correspond to a time of almost 3 years (January 2020 to November 2022), which covers the period before and after the eruption.
GPS data for the Canary Islands are available from the GRAFCAN (https://www.grafcan.es) and ERGNSS (https://www.ign.es) reference networks and were included as part of a large dataset processing scheme that involves stations from the IGS network (https://igs.org) and EPN (https://epncb.oma.be) to ensure a time series of positions in the ITRF2014 reference frame (Altamimi et al., 2016). Data were processed using GAMIT/GLOBK software (Herring et al., 2015; Herring et al., 2018) using the latest models and methodology.
The auto- and cross-correlation functions were computed through the PCC approach developed by Schimmel (1999). PCC uses the concept of analytical signals, which enables the decomposition of a real time-series into its instantaneous phase and envelope function. PCC solely considers the instantaneous phase of the analytic traces. It is, therefore, amplitude unbiased and eliminates the need for time- and frequency-domain normalization procedures before computing the correlation functions. PCC assesses the waveform similarity by measuring the closeness between the instantaneous phases of two time series as a function of lag time. In the case of autocorrelations, where the time series are the same, PCC measures their self-similarity (e.g., Schimmel et al., 2021).
Although the PCC approach is amplitude unbiased, applying a bandpass filter is still recommended. Filtering allows the selection of the frequency of interest, improving the waveform coherence by attenuating noise from frequencies outside the band. Moreover, the bandpass filter ensures that the time series are zero mean, which is important for the split into instantaneous amplitude and phase (Romero and Schimmel, 2018). Selecting an appropriate frequency band for detecting temporal changes in the correlation functions is often challenging due to the absence of standardized procedures and differing characteristics from site to site. In general, the chosen frequency should be selected according to the target depths where the temporal changes occur. Additionally, it is important to avoid frequency bands that are susceptible to intense source fluctuations (Zhan et al., 2013). Monitoring studies rely on the assumption that the seismic wave field is stable, which requires that the sources do not vary too much over the considered data time windows. Varying sources may change the noise correlation response, and systematic changes can be especially misinterpreted as structural variability.
Different frequency bands were tested to compute the autocorrelations for each hourly file: [0.5–2.0 Hz], [0.8–3.0 Hz], [1.0–3.0 Hz], and [2.0–4.0 Hz]. The autocorrelations were linearly stacked using a 3-day moving data window to obtain daily autocorrelation functions (ACFs). Supplementary Figure S2 of Supplementary Material shows the comparison between the daily autocorrelation functions of station TBT for the mentioned frequency bands. All frequency bands, except for (2.0–4.0 Hz), exhibit distinguishable and stable waveforms, enabling the identification of stable structures or signals. For a better visualization, we plotted only the data from 2021 before the eruption.
Among the tested frequency bands, the 1.0–3.0-Hz band appears to be most suitable, allowing the clear identification of different and coherent signals throughout the non-eruptive period. In addition, it allows the identification of stable signals even at greater lag times, unlike the lower frequency bands. Furthermore, we will not consider the eruptive period in the analysis to avoid bias by the volcanic tremors as they may change the correlation response if they occur with similar waveforms and on a regular base.
Either before or after an eruption, the structure undergoes alterations due to the movement of magma or hydrothermal fluids, which can cause changes in the seismic velocities and/or the position of scatterers. These seismic structure changes translate into phase shifts and altered waveforms in the noise auto- and cross-correlation functions that can be measured through the waveform similarity. Here, we measure waveform similarity by comparing each noise correlation function to a reference trace that we obtain by stacking correlation functions from a stable period, i.e., without volcanic and seismic activity. To this end, we stacked 40 days of the pre-eruptive period of 2021 (from May to mid-June). Other reference traces were tested, but the differences in the results are insignificant, and the main patterns remain the same (Supplementary Figure S3). The similarity of the daily auto- and cross-correlations to their corresponding reference was computed using the zero-lag classical cross-correlation strategy (e.g., Eq. 1 of the study by DHour et al., 2015). That is, the time-dependent waveform similarity as a function of lag time and day is obtained by comparing each daily correlation function with the reference trace as the zero lag-cross correlation in a predefined lag-time window (5-s-long lag time sliding windows with 3-s overlapping). The degree of waveform similarity is represented by values ranging from −1 to 1, where 1 indicates that the seismic noise response is similar to the reference, which represents a proxy for the unperturbed medium.
The daily ACFs permit identifying temporal variations that can be caused by different noise source conditions and/or structural variability. Furthermore, they facilitate the inspection of specific lag times that are worth further investigation. Figure 2 displays the plot of the daily auto- and cross-correlation functions for the entire period under analysis and for both stations.
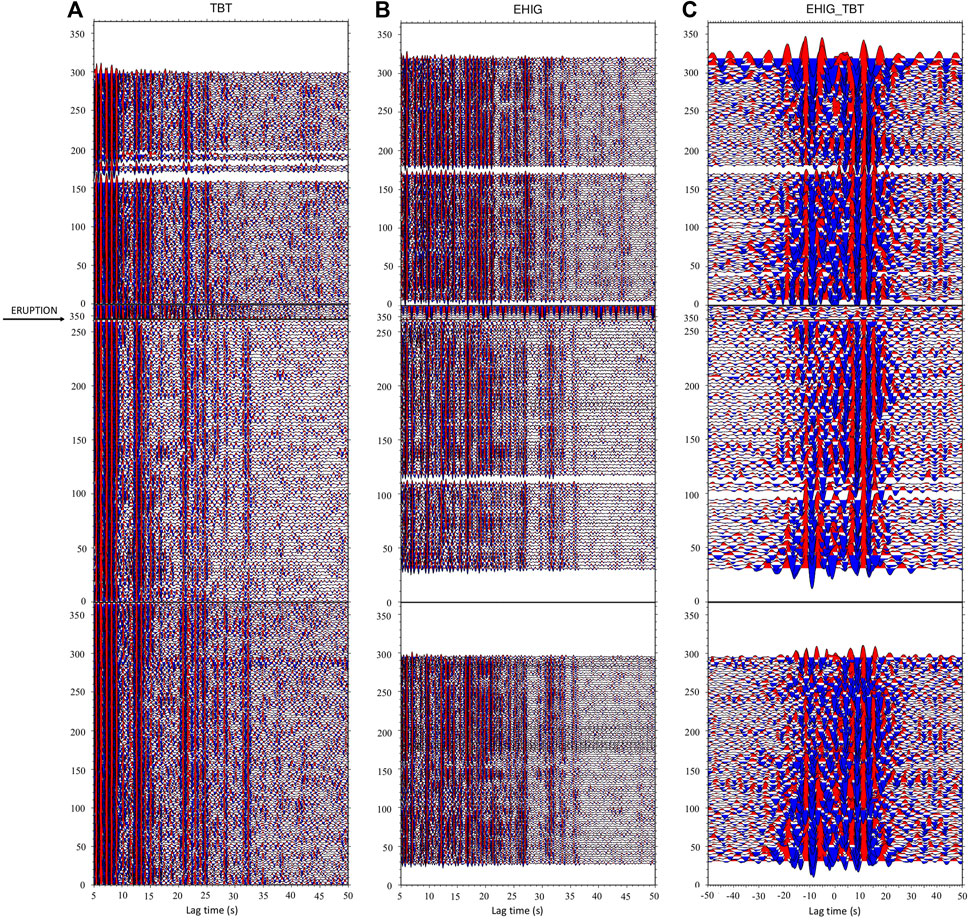
Figure 2. Daily autocorrelation functions computed using phase cross-correlation (PCC) strategy for station TBT (A) and station EHIG (B), and daily cross-correlation functions for station pair EHIG–TBT (C). The blank spaces correspond to days with no data available or problematic data removed from further computations. The eruptive period was discarded, but the eruption is properly marked (black arrow). The positive and negative amplitude lobes are colored in red and blue, respectively.
In both autocorrelograms, it is possible to identify signals that stay stable for several days and, in some cases, even for extended periods of months. In general, prior to the eruption (indicated by the black arrow in Figure 2), the waveforms are quite stable. However, in the post-eruptive period, some signals get disturbed. For instance, for station TBT, stable signals can be identified at the 23-s and 32-s lag time, but they disappear or become weaker after the eruption. Because station EHIG is noisier and exhibits slightly higher waveform variability, some signals are more difficult to isolate; yet, similar to TBT, after the eruption at the 32-s lag-time, the waveforms present smaller amplitude. This is probably related to medium changes caused by the eruption. Another noteworthy observation is that the phases identified in one station may not be present in the other. For example, at 17 s, station EHIG exhibits a clear, stable, and consistently present signal, while station TBT does not show any corresponding feature. Conversely, at the lag time of 28 s, station TBT exhibits a clear signal, whereas EHIG does not, possibly indicating a different structure beneath each station. In addition, station EHIG seems to have been more disturbed by the seismicity than TBT (see Figure 1 for station location).
The cross-correlation functions show higher amplitude and more coherent and stable waveforms in the causal lag, revealing that the strongest sources are most likely located to the east of the EHIG station. The acausal lag shows significant fluctuations in both amplitude and coherence. For this study, in the case of the cross-correlations, we are interested in the coda between 10 s and 45 s, where we detect small-amplitude waveform fluctuations.
To assess the waveform stability and systematic changes, we stacked groups of data: all data for 2020, all data for 2020 plus the first 3 months of 2021, the previous data plus the next 3 months of 2021, and so on until finishing all data. The eruptive period was not considered. Figure 3 shows the waveforms for the different stackings. The stacks considering data before the eruption are represented in black (2020) and blue, and those including data after the eruption are represented in red.
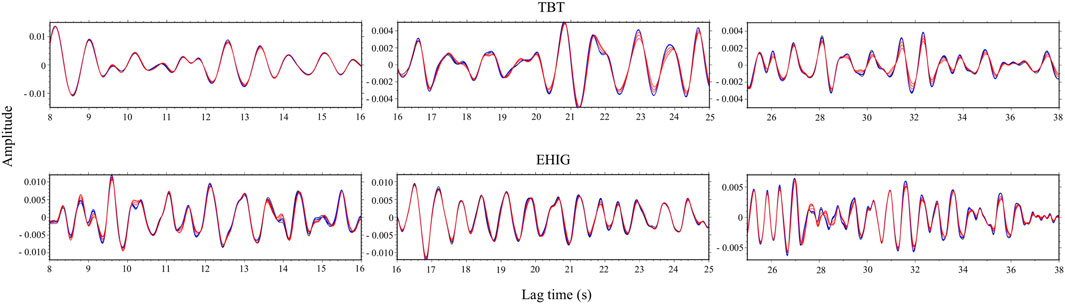
Figure 3. Averaged autocorrelation functions for both stations (TBT and EHIG). In black, the stack representing the entire 2020. In blue, the stackings representing the pre-eruptive period (2020 and 2021). In red, the stackings representing all data (2020, 2021, and 2022). Each line corresponds to another 3-months of data added to the stack. The eruptive period was not considered. The plots are separated in groups of lag times for a better visualization.
It is possible to observe that the waveforms corresponding to the pre-eruptive period (black and blue lines) overlap with each other, whereas the ones representing the post-eruptive data (red lines), for some lags, appear deviated, revealing changes in the waveform shape and/or amplitudes. For station TBT, the waveforms are quite stable until the 16-s lag time, when the variations start to appear, becoming even clearer above 22 s. Curiously, station EHIG exhibits stable waveforms for lag times between 16 s and 27 s, yet they are clearly unstable below 16 s and above 27 s. These results may indicate that for certain depths, which are different depending on the station location, the structure underwent alterations caused by the eruption and did not recover to its initial state (before the eruption).
Volcanic eruptions disturb not only the seismic velocity but also the scattering properties of the medium (e.g., Obermann et al., 2013, 2014; Brenguier et al., 2016; Ikeda and Takagi, 2019). A mechanical change in the medium (e.g., variation in the fluid or rock velocities due to pore pressure changes or rock stress alterations caused by the deformation of the surrounding material) will be noticed in the waveform as a time shift and refers to a velocity change in the medium. In opposition, structural changes are reflected in the waveforms as small changes in amplitude or shape, which are responsible for waveform distortion (or decoherence) and result from small changes in the scattering properties of the medium. The ability to detect these changes is useful for monitoring material damage such as the crack appearance or fluid migration (Obermann and Hillers, 2019).
To inspect if the ACF waveforms exhibit time shifts and/or decoherence, and in which lag times they occur, we compared data from 50 days before the eruption (2021) and the exact same 50 days after the eruption (2022). Figure 4 presents the results of this comparison.
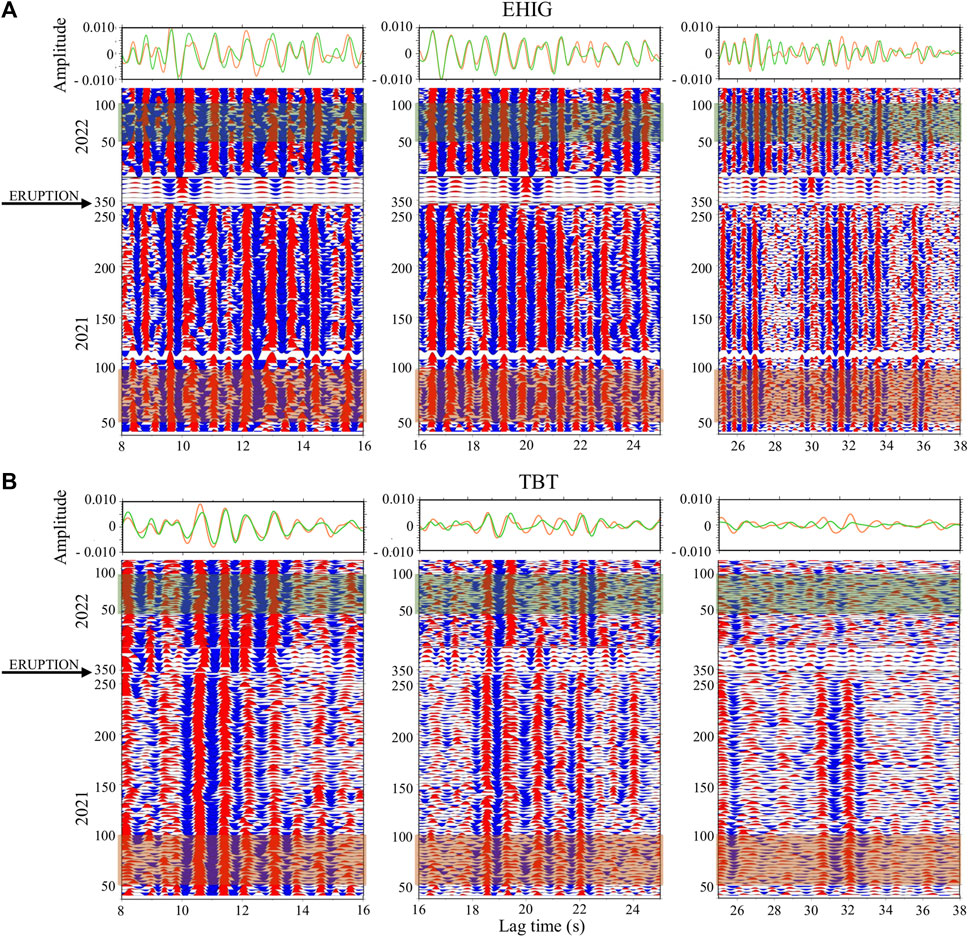
Figure 4. Autocorrelation functions (ACFs) at stations EHIG (A) and TBT (B). The panels on top of each ACF show the averaged ACFs for a period of 50 days before the eruption (orange) and the same period after the eruption (green). The eruptive period was removed from the representation, but its beginning is marked by the black arrows.
For station EHIG, the time shifts are visible around 19–21-s lag times, but the changes in amplitude or waveform shape dominate the signals. Station TBT exhibits time shifts at 19-s and 24-s lag times, but the waveform decoherence is dominant.
In addition to the autocorrelations, we also computed the cross-correlation functions (CCFs), which also provide information about the structure between the station pair. The cross-correlations were computed following the same processing steps as the ACFs but in the frequency band of 0.1–1.0 Hz. Auto- and cross-correlation functions were further analyzed, together with the waveform similarity, and compared to other observables, such as seismicity and ground deformation, as well as documented geological and geophysical information.
The time evolution of the waveform similarity can provide information about the structural changes occurring throughout time. Figure 5 shows the results of waveform similarity for each single station (autocorrelations) and for the station pair EHIG–TBT (cross-correlations) at several lag times. The cross-correlations (CCs) are more sensitive to medium changes along the inter-station trajectory than the autocorrelations (ACs). The CCs have a stronger contribution of surface waves, while in the AC, the body waves may dominate, which can explain the differences observed in the similarity results. For this reason, we calculated the CC in a broader frequency band (0.1–1.0 Hz). The sensitivity kernels, based on the 1-D mean S-wave velocity model calculated for La Palma (DAuria et al., 2022b), show that for the frequency band of 0.1–1.0 Hz, the Rayleigh waves are sensitive to a structure down to approximately 8 km (Supplementary Figure S9 of the study by Cabrera-Perez et al., 2023a).
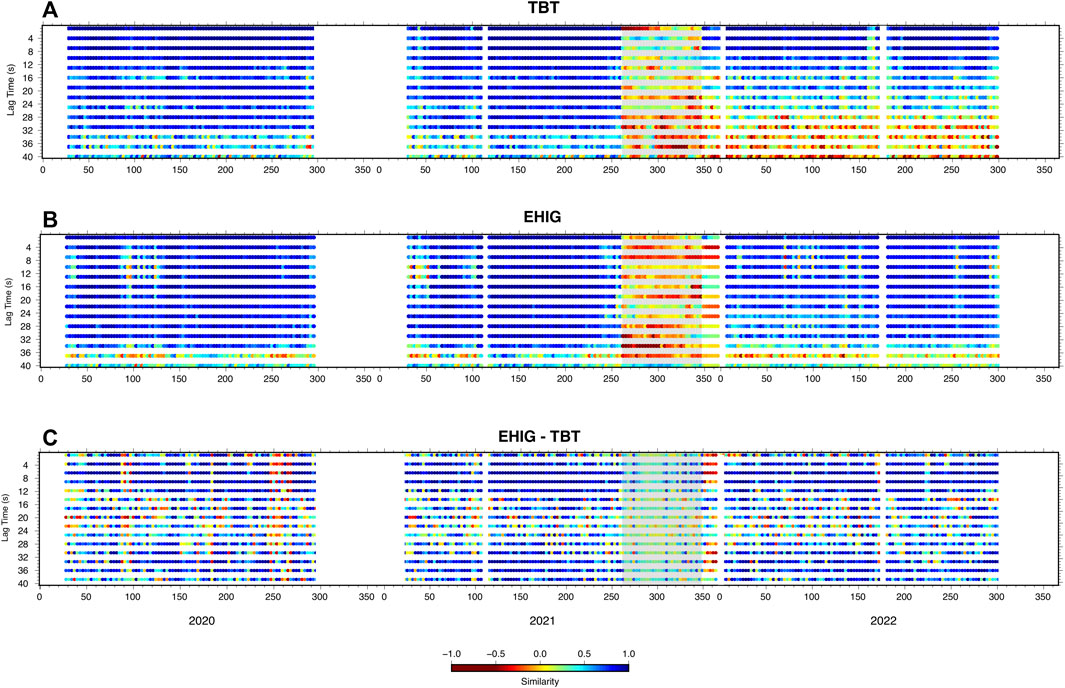
Figure 5. Lag-time-dependent waveform similarity from autocorrelations [(A) TBT and (B) EHIG] computed in the frequency band of 1.0–3.0 Hz and from cross-correlations [(C) EHIG–TBT] in the frequency band of 0.1–1.0 Hz. Blank spaces correspond to periods without data. The positive and negative lags were averaged for representation. The color scale varies from red (decorrelation) to blue (perfectly correlated). The shaded gray rectangle marks the eruptive period.
For the AC and before the eruption, it is possible to observe that with a few exceptions, the similarity values are close to 1, and thus, they are well correlated. The exceptions are between days 90 and 120 of 2020 and around days 40 and 100 of 2021 for both stations, where clear decorrelation can be observed. These results are even stronger in the CC. For station TBT, there are some intriguing results at lag times of 16 s and 24 s, where the similarity exhibits several days of decorrelation not observed for other lag times or days. For lag times of above 32 s, both stations show higher values of decorrelation.
The lowest similarity values correspond to the eruptive period, which is indicated by the shaded gray rectangle. The beginning of the eruption (262/2021) is clearly distinguishable by a sharp decrease in the waveform similarity. However, pinpointing the exact end of the eruption (347/2021) is more challenging due to the continued decorrelation for a few days thereafter.
After the eruption, station TBT exhibits decorrelation for lag times above 16 s. These results persist for the entire post-eruptive period considered. For station EHIG, the similarity values are not as low as those for station TBT, but the decorrelation is also visible, yet for longer lag times.
For the CC waveform similarity, the eruptive period is less obvious, yet distinguishable. However, there are a few days before the eruption exhibiting decorrelated signals for all lag times (e.g., 100 and 250 of 2020 and 000–050 and 100 of 2021). After the eruption, the decorrelation predominates in all days but is largely concentrated between 12-s and 28-s lag times.
La Palma was dormant for 46 years when in 2017, the seismic silence was interrupted. Between 2017 and 2021 (before the eruption), nine seismic swarms were registered, reflecting the magmatic ascent from the mantle to the oceanic crust base. The seismic events were relatively deep (25–35 km) and of low magnitude (<2.7), causing no significant stress changes (e.g., Carracedo et al., 2022; DAuria et al., 2022). Intense seismic activity started only in the week preceding the eruption. The increase in the seismicity was accompanied by an increase in the vertical ground deformation, which reached a maximum value of 20 cm in the days before the eruption (Amonte et al., 2022). The ground deformation was more intense near the eruption location, affecting mostly the NW side of the Cumbre Vieja ridge toward the coast (Carracedo et al., 2022). Both seismicity and ground deformation are likely caused by magmatic movement, and they are capable of changing the internal state of the earth through changes in the stress state, pore fluid movement, and even the occurrence of small cracks and fractures. Figure 6 shows the comparison of the waveform similarity results for station TBT with the seismic activity and ground deformation measured in the GPS station MAZO for the period between 2020 and 2022. Ground deformation was computed by taking the norm of the differences in the three components of position with respect to ALJR, which is located on the island of La Gomera. Figure 6 (bottom panel) displays the evolution of this spatial deformation since the beginning of 2020, arbitrarily selected as zero. The ground deformation results show the increasing deformation for the eruptive period corresponding to inflation signals in agreement with the intense seismicity for the same period, which is possibly related to the magmatic rise toward the surface. Notably, the volcano inflation state seems to continue after the eruption as the deformation signal maintained a considerable value and did not return to values prior to the eruption, as also revealed by the seismic waveforms (see Figure 3) that are stable for the entire period before the eruption, yet after the eruption, they do not return to the previous state.
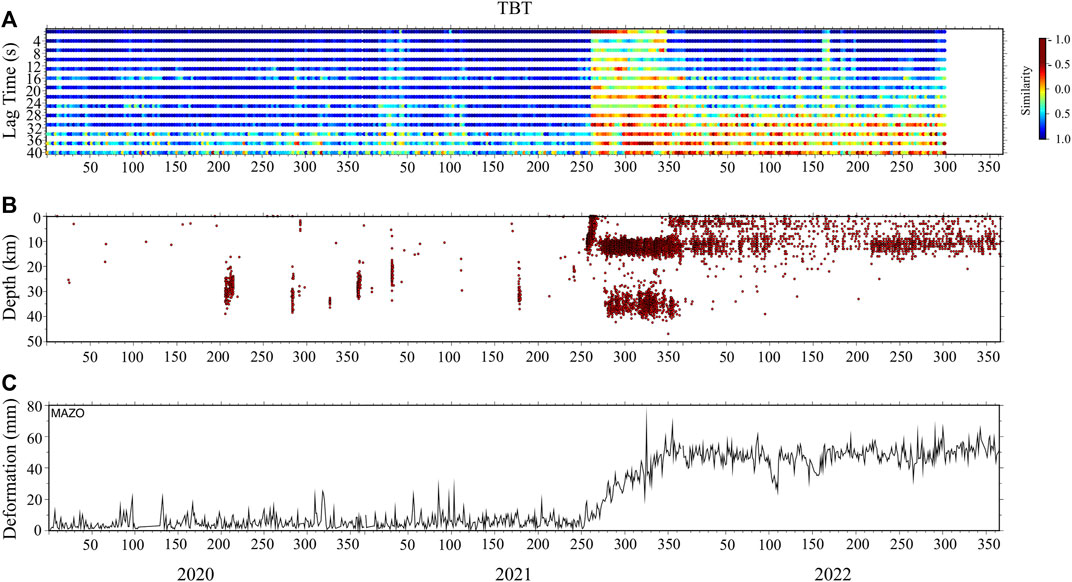
Figure 6. Comparison of the waveform similarity for station TBT (A) with the seismicity (B) and the ground deformation detected in GPS station MAZO (C).
There is no clear correlation with the swarm occurrence in the waveform similarity before the eruption. After the eruption, the seismic activity continues at shallow depths; yet, again, these events do not seem to affect the similarity.
In addition, we compared our results with the precipitation data (AEMET, 2023) over the 2 years to investigate whether there is any connection between the waveform similarity results and the amount of rain. Intense rainfall can cause changes in the groundwater mass, pore pressure, and water table level, which can consequently change the seismic velocities (Hirose et al., 2022, and references therein). Normal levels of precipitation, if affecting the waveform similarity, are only visible at very short lag times and for short periods of time. The Canary Islands generally experience mild winters and warm summers. The levels of rainfall differ due to the northeasterly winds, but, in general, the precipitation in the summer months is almost non-existent and is not abundant even during the winter. Due to the low precipitation rate and the absence of heavy rainfall in La Palma, for the period under study, we did not find any significant correlation between the similarity results and the precipitation data. In Supplementary Figure S4 of Supplementary Material, we present the waveform similarity results for station EHIG, together with seismicity, ground deformation registered in LP01 GPS stations (IGN), and precipitation.
In a volcanic environment, medium changes related to volcanic activity are generally attributed to stress, deformation, and magmatic or hydrothermal fluid migration (e.g., Yukutake et al., 2016; Yates et al., 2019; Caudron et al., 2022; Cabrera-Perez et al., 2023a). If there is no structural change, e.g., due to the dislocation of seismic wave scatterers, then medium changes are likely related to seismic velocity variations. Determining whether the decorrelation is accompanied by an increase or decrease in the seismic velocities is out of the scope of this study. Seismic velocity changes lead to a special case of waveform decorrelation as noise correlation responses are either stretched or compressed due to velocity changes within a larger volume. We believe that structural medium alterations due to fracturing through the pressuring of magma, an overall changed stress regime, and the presence of earthquakes are more likely than pure velocity changes and, therefore, focused on waveform decorrelation. Our results distinguish temporal medium changes occurring at different lag times (different depth ranges in the case of autocorrelations) and, thus, suggest some possible driving mechanisms causing them.
The waveform similarity given in Figure 5 shows consistent results among the single stations (ACs) and the station-pair (CCs). Before the eruption, there are a few groups of days that interrupt the almost perfectly correlated waveforms at lag times shorter than 36 s. Cabrera-Perez et al. (2023a) presented results and possible causes for the velocity variations observed during the pre-eruptive episode. The authors discarded the magmatic intrusion itself as the magma reached the surface only on the day of the eruption. Dilatation or compression of the edifice resulting from the magma chamber dynamics was excluded due to the absence of ground deformation, and seismicity does not seem an option since the earthquake magnitude is generally lower before the eruption. In addition, our study also excluded precipitation as a possible driving mechanism. Our results seem to point to a punctual process disturbing the structure for a short period of time, such as pockets of hydrothermal fluids from a hydrothermal reservoir, which is in agreement with previous results (Cabrera-Perez et al., 2023b; Cabrera-Perez et al., 2023a).
After the eruption, the similarity results suggest that the shallow structure beneath the stations was not disrupted by the eruption. Despite being more evident in station TBT, the similarity values decreased for both stations for lag times above 16–20 s. The cessation of the eruptive activity results in reduced pressurization of the plumbing system (De Plaen et al., 2019), with parameters such as deformation restored to the previous values. A possible explanation for our results is that at deeper levels, the structure remains altered after the eruption, and thus, the system can still be pressurized. During an eruption, a huge portion of fluids and melts from higher depths migrate toward the surface, causing fluid saturation in the upper structure and a deficit of liquids deep down (Serrano et al., 2023). In addition, the magma intrusion at shallow depths and the posterior eruption can cause structural damages that can take several days or even months to recover. Another possible explanation is related to heating and degassing, which can increase the pore pressure, reducing the effective normal stress. Under such conditions, rocks can be characterized by high fluid pore pressure, thus altering the medium conditions (Ruiz et al., 2022), but this is only probable when the degassing is continuous after the eruption for a long period of time.
The decorrelation occurring on the same days in both stations but at different lag times reinforces the previously mentioned hypothesis that the structure beneath the stations can be affected by the same driving mechanism, but due to its location relative to the source mechanism site, the medium changes occur at different distances.
Quantifying the temporal changes is a challenging task; however, considering an empirical apparent velocity of 1 km/s for scattered waves (Zhan et al., 2013) and the two-way travel time, it is possible to roughly estimate some depths at which perturbations occur. Analyzing the results of the ACF waveforms (Figure 4) and the waveform similarity (Figure 5) together, it is possible to make some important considerations. Before the eruption, both stations exhibit decorrelation at higher lag times (above 32 s), which can be attributed to medium changes occurring at higher depths. However, for some specific days, the stations also exhibit decorrelation at shorter lag times (see Figure 5). Between days 90 and 120 of 2020 and days 45 and 100 of 2021, station EHIG showed decorrelation for lag times at approximately 4–16 s, which corresponds to a depth between 2 and 8 km. On the other hand, station TBT shows decorrelation not only on the same days but also for several days but in two specific lag times: 16 s and 24 s (approximately 8–12 km depth). These results may indicate the presence of a large volume of magma accumulation due to the magma injections from the mantle to the base of the crust (∼10 km depth) beneath station TBT, whereas beneath station EHIG, the decorrelation should be related to occasional ascent of fluids toward the surface, in agreement with the previously published pre-eruptive model in Figure 2B of the study by DAuria et al. (2022). We also believe that the reason why most of the time the waveform similarity appears almost perfectly correlated is because of the pre-established ascent pathways, which allows magma movement without causing stress changes.
After the eruption, the surface structure seems to not have experienced significant detectable changes, with the exception of day 165 for station TBT, for which we do not have enough information to attribute an explanation. Comparing both stations, TBT shows decorrelation for lag times higher than 16 s, whereas for EHIG, the similarity values are higher and the decorrelation starts to appear at 24 s. Our results show that the structure beneath station TBT may have underwent more medium changes than the structure beneath station EHIG, which rapidly recovers its state prior to the eruption.
In this study, we calculated auto- and cross-correlations of continuous ambient seismic noise data recorded in La Palma from January 2020 to November 2022. We analyzed the time evolution patterns of both autocorrelograms and the waveform similarity to identify possible medium changes before the eruption and how the structure behaves after the eruptive episode. Our results were compared with the cataloged seismicity, ground deformation data, and precipitation.
Before the eruption, we observe a few days exhibiting decorrelation, to which we attribute a punctual process, such as hydrothermal fluid ascent, in agreement with previous studies. We could not find any correlation with the seismic swarms or the ground deformation for these days. The beginning of the eruption is clearly distinguishable with the increasing decorrelation, seismicity, and ground deformation. After the eruption, our results show that at deeper levels, the volcanic system can still be pressurized, possibly due to heated and vaporized hydrothermal water occupying the plumbing system, which was previously filled with magmatic material. At shallow depths, the structure appears not to have undergone significant changes, thus quickly recovering from the eruption.
We show that variations in pore pressure, saturation, and micro-structures driven by gas release, fluid circulation, and pressure perturbations associated with the unrest subsurface volcanic system trigger relative changes in the propagation of seismic waves generated by ambient seismic noise. Thus, seismic noise interferometry from auto- and cross-correlation functions is a promising and suitable method to determine medium changes and improve our knowledge of the pre- and post-eruptive process in active volcanoes, even when the number of stations is limited. In addition, this analysis can be applied to study not only other volcanoes around the world but also restlessness induced by seismic volcanic swarms, fluctuations of the groundwater systems, landslides, geothermal energy, and even carbon sequestration. As future work, it could be interesting to include a detailed anisotropic study to better understand the structural changes. This would be helpful not only to validate our results but also to define a strategy to implement this type of studies as real-time monitoring.
The original contributions presented in the study are included in the article/Supplementary Material; further inquiries can be directed to the corresponding author.
JC: conceptualization, investigation, and writing–original draft. GS: conceptualization, investigation, supervision, validation, and writing–review and editing. VM: methodology and writing–review and editing. MS: methodology, software, and writing–review and editing. RA: data curation and writing–review and editing.
The author(s) declare that financial support was received for the research, authorship, and/or publication of this article. This work was funded by the Portuguese Fundação para a Ciência e Tecnologia (FCT), I.P./MCTES through national funds PIDDAC—UIDB/50019/2020 (https://doi.org/10.54499/UIDB/50019/2020), UIDP/50019/2020 (https://doi.org/10.54499/UIDP/50019/2020), and LA/P/0068/2020 (https://doi.org/10.54499/LA/P/0068/2020). This study is a contribution to two projects FCT I.P./MCTES through national funds RESTLESS PTDC/CTA-GEF/6674/2020 (https://doi.org/10.54499/PTDC/CTA-GEF/6674/2020) and GEMMA PTDC/CTA-GEO/2083/2021 (https://doi.org/10.54499/PTDC/CTA-GEO/2083/2021). JC acknowledges the financial support of FCT project PTDC/CTA-GEF/6674/2020 (https://doi.org/10.54499/PTDC/CTA-GEF/6674/2020). MS acknowledges EPYSIM (PID 2022-136981NBI00, MCIN, Spain).
The authors declare that the research was conducted in the absence of any commercial or financial relationships that could be construed as a potential conflict of interest.
The handling editor JF is currently organizing a research topic with the author GS.
All claims expressed in this article are solely those of the authors and do not necessarily represent those of their affiliated organizations, or those of the publisher, the editors, and the reviewers. Any product that may be evaluated in this article, or claim that may be made by its manufacturer, is not guaranteed or endorsed by the publisher.
The Supplementary Material for this article can be found online at: https://www.frontiersin.org/articles/10.3389/feart.2024.1298472/full#supplementary-material
AEMET (2023). Agencia estatal de Meteorología. Available at: http://www.opendata.aemet.es
Altamimi, Z., Rebischung, P., Métivier, L., and Collilieux, X. (2016). ITRF2014: a new release of the International Terrestrial Reference Frame modeling nonlinear station motions. J. Geophys. Res. Solid Earth 121, 6109–6131. doi:10.1002/2016JB013098
Amonte, C., Melián, G. V., Asensio-Ramos, M., Pérez, N. M., Padrón, E., Hernández, P. A., et al. (2022). Hydrogeochemical temporal variations related to the recent volcanic eruption at the Cumbre Vieja volcano, La Palma, canary islands. Front. Earth Sci. 10. doi:10.3389/feart.2022.1003890
Ancochea, E., Hernán, F., Cendrero, A., Cantagrel, J. M., Fúster, J. M., Ibarrola, E., et al. (1993). Constructive and destructive episodes in the building of a young oceanic island, La Palma, canary islands, and genesis of the caldera de Taburiente. Geotherm. Res. 60, 243–262. doi:10.1016/0377-0273(94)90054-x
Berbellini, A., Zaccarelli, L., Faenza, L., Garcia, A., Improta, L., De Gori, P., et al. (2021). Effect of groundwater on noise-based monitoring of crustal velocity changes near a produced water injection well in Val d'Agri (Italy). Front. Earth Sci. 9, 626720. doi:10.3389/feart.2021.626720
Bontemps, N., Lacroix, P., Larose, E., Jara, J., and Taipe, E. (2020). Rain and small earthquakes maintain a slow-moving landslide in a persistent critical state. Nat. Commun. 11 (1), 780. doi:10.1038/s41467-020-14445-3
Brenguier, F., Rivet, D., Obermann, A., Nakata, N., Boué, P., Lecocq, T., et al. (2016). 4-D noise-based seismology at volcanoes: ongoing efforts and perspectives. J. Volcanol. Geotherm. Res. 321, 182–195. doi:10.1016/j.jvolgeores.2016.04.036
Brenguier, F., Shapiro, N. M., Campillo, M., Ferrazzini, V., Duputel, Z., Coutant, O., et al. (2008). Towards forecasting volcanic eruptions using seismic noise. Nat. Geosci. 1 (2), 126–130. doi:10.1038/ngeo104
Bonadonna, C., Pistolesi, M., Biass, S., Voloschina, M., Romero, J., Coppola, D., et al. (2022). Physical characterization of long-lasting hybrid eruptions: the 2021 Tajogaite eruption of Cumbre Vieja (La Palma, Canary Islands). J. Geophys. Res. Solid Earth 127 (11), e2022JB025302.
Carracedo, J. C., Day, S. J., Guillou, H., and Torrado, F. J. P. (1999). Giant quaternary landslides in the evolution of La Palma and El Hierro, Canary Islands. J. of Volcano and Geother. Res. 94 (1-4), 169–190.
Cabrera-Pérez, I., D’Auria, L., Soubestre, J., Przeor, M., Barrancos, J., García-Hernández, R., et al. (2023a). Spatio-temporal velocity variations observed during the pre-eruptive episode of La Palma 2021 eruption inferred from ambient noise interferometry. Sci. Rep. 13 (1), 12039. doi:10.1038/s41598-023-39237-9
Cabrera-Pérez, I., Soubestre, J., D’Auria, L., Barrancos, J., Martín-Lorenzo, A., van Dorth, D. M., et al. (2023b). Geothermal and structural features of La Palma Island (Canary Islands) imaged by ambient noise tomography. Sci. Rep. 13 (1), 12892. doi:10.1038/s41598-023-39910-z
Campillo, M., and Paul, A. (2003). Long-range correlations in the diffuse seismic coda. Science 299, 547–549. doi:10.1126/science.1078551
Carracedo, J. C., Rodríguez-Badiola, E. R., Guillou, H., de la Nuez, J., and Pérez-Torrado, F. J. (2001). Geología y vulcanología de La Palma y El Hierro, canarias occidentales. Estud. Geologicos-Madrid 57 (5–6), 175–273. doi:10.3989/egeol.01575-6134
Carracedo, J. C., Troll, V. R., Day, J. M., Geiger, H., Aulinas, M., Soler, V., et al. (2022). The 2021 eruption of the Cumbre Vieja volcanic ridge on La Palma, canary islands. Geol. Today 38 (3), 94–107. doi:10.1111/gto.12388
Caudron, C., Aoki, Y., Lecocq, T., De Plaen, R., Soubestre, J., Mordret, A., et al. (2022). Hidden pressurized fluids prior to the 2014 phreatic eruption at Mt Ontake. Nat. Commun. 13 (1), 6145. doi:10.1038/s41467-022-32252-w
Claerbout, J. F. (1964). Detection of P-waves from weak sources at great distances. Geophysics 29 (2), 197–211. doi:10.1190/1.1439350
Cubuk-Sabuncu, Y., Jónsdóttir, K., Caudron, C., Lecocq, T., Parks, M. M., Geirsson, H., et al. (2021). Temporal seismic velocity changes during the 2020 rapid inflation at Mt. Þorbjörn-Svartsengi, Iceland, using seismic ambient noise. Geophys. Res. Lett. 48, e2020GL092265. doi:10.1029/2020GL092265
DAuria, L., Koulakov, I., Prudencio, J., Cabrera-Pérez, I., Ibanez, J., Barrancos, J., et al. (2022). Voluminous storage and rapid magma ascent beneath La Palma revealed by seismic tomography. Phys. Sci. doi:10.21203/rs.3.rs-1238072/v1
DAuria, L., Koulakov, I., Prudencio, J., Cabrera-Pérez, I., Ibáñez, J. M., Barrancos, J., et al. (2022b). Rapid magma ascent beneath La Palma revealed by seismic tomography. Sci. Rep. 12 (1), 17654. doi:10.1038/s41598-022-21818-9
De Plaen, R. S., Cannata, A., Cannavo', F., Caudron, C., Lecocq, T., and Francis, O. (2019). Temporal changes of seismic velocity caused by volcanic activity at Mt. Etna revealed by the autocorrelation of ambient seismic noise. Front. Earth Sci. 6, 251. doi:10.3389/feart.2018.00251
De Plaen, R. S. M., Lecocq, T., Caudron, C., Ferrazzini, V., and Francis, O. (2016). Single-station monitoring of volcanoes using seismic ambient noise. Geophys. Res. Lett. 43, 8511–8518. doi:10.1002/2016GL070078
DHour, V., Schimmel, M., Do Nascimento, A. F., Ferreira, J. M., and Lima Neto, H. C. (2015). Detection of subtle hydromechanical medium changes caused by a small-magnitude earthquake swarm in NE Brazil. Pure Appl. Geophys. 173 (4), 1097–1113. doi:10.1007/s00024-015-1156-0
Galipp, K., Klügel, A., and Hansteen, T. H. (2006). Changing depths of magma fractionation and stagnation during the evolution of an oceanic island volcano: La Palma (Canary Islands). J. Volcanol Geotherm Res 155, 285–306. doi:10.1016/j.jvolgeores.2006.04.002
Herring, T. A., Floyd, M. A., King, R. W., and McClusky, S. C. (2015). GLOBK reference manual, global kalman filter VLBI and GPS analysis program. Cambridge, MA, USA: Massachusetts Institute of Technology. Release 10.6.
Herring, T. A., King, R. W., Floyd, M. A., and McClusky, S. C. (2018). GAMIT reference manual, GPS analysis at MIT, release 10.7. Cambridge, MA, USA: Massachusetts Institute of Technology.
Hirose, T., Ueda, H., and Fujita, E. (2022). Seismic scattering property changes correlate with ground deformation at Suwanosejima volcano, Japan. J. Geophys. Res. Solid Earth 127 (9), e2022JB024352. doi:10.1029/2022jb024352
Hobiger, M., Wegler, U., Shiomi, K., and Nakahara, H. (2012). Coseismic and postseismic elastic wave velocity variations caused by the 2008 Iwate-Miyagi Nairiku earthquake, Japan. J. Geophys. Res. Solid Earth 117 (B9). doi:10.1029/2012jb009402
Hoernle, K., and Schmincke, H. U. (1993). The role of partial melting in the 15-Ma geochemical evolution of Gran Canaria: a blob model for the Canary hotspot. J. Petrology 34, 599–626. doi:10.1093/petrology/34.3.599
Ikeda, H., and Takagi, R. (2019). Coseismic changes in subsurface structure associated with the 2018 Hokkaido Eastern Iburi Earthquake detected using autocorrelation analysis of ambient seismic noise. Earth, Planets Space 71 (1), 72–11. doi:10.1186/s40623-019-1051-5
Le Breton, M., Bontemps, N., Guillemot, A., Baillet, L., and Larose, É. (2021). Landslide monitoring using seismic ambient noise correlation: challenges and applications. Earth-Science Rev. 216, 103518. doi:10.1016/j.earscirev.2021.103518
Lobkis, O. I., and Weaver, R. L. (2001). On the emergence of the Green’s function in the correlations of a diffuse field. J. Acoust. Soc. Am. 110, 3011–3017. doi:10.1121/1.1417528
Lynch, R. A., and Mendecki, A. J. (2001). “High-resolution seismic monitoring in mines,” in Highresolution Seismic Monitoring in Mines, vols. 19–24. Proceedings of fifth international symposium on rockburst and seismicity in mines. Editors G. Van Aswegen, R. J. Durrheim, and W. D. Ortleep
Maeda, T., Obara, K., and Yukutake, Y. (2010). Seismic velocity decrease and recovery related to earthquake swarms in a geothermal area. Earth, Planets Space 62 (9), 685–691. doi:10.5047/eps.2010.08.006
Maxwell, S. C., Rutledge, J., Jones, R., and Fehler, M. (2010). Petroleum reservoir characterization using downhole microseismic monitoring. Geophysics 75 (5), 75A129–75A137. doi:10.1190/1.3477966
Montesinos, F. G., Sainz-Maza, S., Gómez-Ortiz, D., Arnoso, J., Blanco-Montenegro, I., Benavent, M., et al. (2023). Insights into the magmatic feeding system of the 2021 eruption at Cumbre Vieja (La Palma, canary islands) inferred from gravity data modeling. Remote Sens. 15 (7), 1936. doi:10.3390/rs15071936
Nishimura, T., Nakamichi, H., Tanaka, S., Sato, M., Kobayashi, T., Ueki, S., et al. (2000). Source process of very long period seismic events associated with the 1998 activity of Iwate Volcano, northeastern Japan. J. Geophys. Res. 105 (B8), 19135–19147. doi:10.1029/2000JB900155
Obermann, A., Froment, B., Campillo, M., Larose, E., Planès, T., Valette, B., et al. (2014). Seismic noise correlations to image structural and mechanical changes associated with the Mw 7.9 2008 Wenchuan earthquake. J. Geophys. Res. Solid Earth 119 (4), 3155–3168. doi:10.1002/2013jb010932
Obermann, A., and Hillers, G. (2019). Seismic time-lapse interferometry across scales. Adv. Geophys. 60, 65–143. doi:10.1016/bs.agph.2019.06.001
Obermann, A., Planès, T., Larose, E., and Campillo, M. (2013). Imaging preeruptive and coeruptive structural and mechanical changes of a volcano with ambient seismic noise. J. Geophys. Res. Solid Earth 118, 6285–6294. doi:10.1002/2013jb010399
Ohmi, S., Hirahara, K., Wada, H., and Ito, K. (2008). Temporal variations of crustal structure in the source region of the 2007 Noto Hanto Earthquake, central Japan, with passive image interferometry. Earth, planets space 60, 1069–1074. doi:10.1186/bf03352871
Poupinet, G., Ellsworth, W. L., and Frechet, J. (1984). Monitoring velocity variations in the crust using earthquake doublets: an application to the Calaveras Fault, California. J. Geophys. Res. 89 (B7), 5719–5731. doi:10.1029/JB089iB07p05719
Padrón, E., Pérez, N. M., Hernández, P. A., Sumino, H., Melián, G. J., Alonso, M., et al. (2022). Early precursory changes in the 3He/4He ratio prior to the 2021 Tajogaite eruption at Cumbre Vieja volcano, La Palma, Canary Islands. Geophy. Res. Lett. 49 (18), e2022GL099992.
Romero, P., and Schimmel, M. (2018). Mapping the basement of the Ebro Basin in Spain with seismic ambient noise autocorrelations. J. Geophys. Res. Solid Earth 123, 5052–5067. doi:10.1029/2018jb015498
Ruiz, M. Z., Civilini, F., Ebinger, C. J., Oliva, S. J., Ruiz, M. C., Badi, G., et al. (2022). Precursory signal detected for the 2018 Sierra Negra volcanic eruption, Galápagos, using seismic ambient noise. J. Geophys. Res. Solid Earth 127, e2021JB022990. doi:10.1029/2021JB022990
Sánchez-Pastor, P., Obermann, A., Schimmel, M., Weemstra, C., Verdel, A., and Jousset, P. (2019). Short-and long-term variations in the Reykjanes geothermal reservoir from seismic noise interferometry. Geophys. Res. Lett. 46 (11), 5788–5798. doi:10.1029/2019gl082352
Schimmel, M. (1999). Phase cross correlations: design, comparisons, and applications. Bull. Seismol. Soc. Am. 89 (5), 1366–1378. doi:10.1785/bssa0890051366
Schimmel, M., Stutzmann, E., Lognonné, P., Compaire, N., Davis, P., Drilleau, M., et al. (2021). Seismic noise autocorrelations on Mars. Earth Space Sci. 8 (6), e2021EA001755. doi:10.1029/2021ea001755
Schmincke, H.-U., Klügel, A., Hansteen, T. H., Hoernle, K., and van den Bogaard, P. (1998). Samples from the jurassic ocean crust beneath gran canaria, La Palma and lanzarote (canary islands). Earth Planet. Sci. Lett. 163 (1–4), 343–360. doi:10.1016/s0012-821x(98)00168-x
Sens-Schönfelder, C., and Wegler, U. (2006). Passive image interferometry and seasonal variations of seismic velocities at Merapi Volcano, Indonesia. Geophys. Res. Lett. 33, 21302. doi:10.1029/2006gl027797
Serrano, I., Dengra, M. A., Almendros, F. J., Torcal, F., and Zhao, D. (2023). Seismic anisotropy tomography beneath La Palma in the canary islands, Spain. J. Volcanol. Geotherm. Res. 441, 107870. doi:10.1016/j.jvolgeores.2023.107870
Shapiro, N., and Campillo, M. (2004). Emergence of broadband Rayleigh waves from correlations of the ambient seismic noise. Geophys. Res. Lett. 31, 1615–1619. doi:10.1029/2004gl019491
Shapiro, N., Campillo, M., Stehly, L., and Ritzwoller, M. (2005). High resolution surface-wave tomography from ambient seismic noise. Science 307, 1615–1618. doi:10.1126/science.1108339
Snieder, R. (2004). Extracting the Green’s function from the correlation of coda waves: a derivation based on stationary phase. Phys. Rev. E 69 (046610.1), 046610. doi:10.1103/physreve.69.046610
Staudigel, H., Feraud, G., and Giannerini, G. (1986). The history of intrusive activity on the island of La Palma (Canary Islands). J. of Volcano and Geother. Res. 27 (3-4), 299–322.
Taira, T. A., Nayak, A., Brenguier, F., and Manga, M. (2018). Monitoring reservoir response to earthquakes and fluid extraction, Salton Sea geothermal field, California. Sci. Adv. 4 (1), e1701536. doi:10.1126/sciadv.1701536
Torres-González, P. A., Luengo-Oroz, N., Lamolda, H., D'Alessandro, W., Albert, H., Iribarren, I., et al. (2020). Unrest signals after 46 years of quiescence at Cumbre Vieja, La Palma, canary islands. J. Volcanol. Geotherm. Res., 392, 106757, doi:10.1016/j.jvolgeores.2019.106757
Wadsworth, F. B., Llewellin, E. W., Farquharson, J. I., Gillies, J. K., Loisel, A., Frey, L., et al. (2022). Crowd-sourcing observations of volcanic eruptions during the 2021 Fagradalsfjall and Cumbre Vieja events. Nat. Commun. 13, 2611. doi:10.1038/s41467-022-30333-4
Wapenaar, K. (2003). Synthesis of an inhomogeneous medium from its acoustic transmission response. Geophysics 68, 1756–1759. doi:10.1190/1.1620649
Wapenaar, K. (2004). Retrieving the elastodynamic green's function of an arbitrary inhomogeneous medium by cross correlation. Phys. Rev. E 93, 254301. doi:10.1103/physrevlett.93.254301
Wegler, U., Lühr, B. G., Snieder, R., and Ratdomopurbo, A. (2006). Increase of shear wave velocity before the 1998 eruption of Merapi volcano (Indonesia). Geophys. Res. Lett. 33, L09303. doi:10.1029/2006GL025928
Yates, A. S., Savage, M. K., Jolly, A. D., Caudron, C., and Hamling, I. J. (2019). Volcanic, coseismic, and seasonal changes detected at White Island (Whakaari) volcano, New Zealand, using seismic ambient noise. Geophys. Res. Lett. 46 (1), 99–108. doi:10.1029/2018gl080580
Yukutake, Y., Ueno, T., and Miyaoka, K. (2016). Determination of temporal changes in seismic velocity caused by volcanic activity in and around Hakone volcano, central Japan, using ambient seismic noise records. Prog. Earth Planet. Sci. 3, 29–14. doi:10.1186/s40645-016-0106-5
Zhan, Z., Tsai, V. C., and Clayton, R. W. (2013). Spurious velocity changes caused by temporal variations in ambient noise frequency content. Geophys. J. Int. 194 (3), 1574–1581. doi:10.1093/gji/ggt170
Keywords: ambient noise, autocorrelations, volcanic activity, waveform similarity, temporal medium changes, fluid migration
Citation: Carvalho J, Silveira G, Mendes VB, Schimmel M and Antón R (2024) Insights into fluid migration during the 2021 La Palma eruption using seismic noise interferometry. Front. Earth Sci. 12:1298472. doi: 10.3389/feart.2024.1298472
Received: 21 September 2023; Accepted: 18 March 2024;
Published: 09 April 2024.
Edited by:
João Fontiela, Institute of Earth Sciences, University of Evora, PortugalReviewed by:
Sven Schippkus, University of Hamburg, GermanyCopyright © 2024 Carvalho, Silveira, Mendes, Schimmel and Antón. This is an open-access article distributed under the terms of the Creative Commons Attribution License (CC BY). The use, distribution or reproduction in other forums is permitted, provided the original author(s) and the copyright owner(s) are credited and that the original publication in this journal is cited, in accordance with accepted academic practice. No use, distribution or reproduction is permitted which does not comply with these terms.
*Correspondence: Joana Carvalho, amZjYXJ2YWxob0BmYy51bC5wdA==
Disclaimer: All claims expressed in this article are solely those of the authors and do not necessarily represent those of their affiliated organizations, or those of the publisher, the editors and the reviewers. Any product that may be evaluated in this article or claim that may be made by its manufacturer is not guaranteed or endorsed by the publisher.
Research integrity at Frontiers
Learn more about the work of our research integrity team to safeguard the quality of each article we publish.