 Kaitong Xu
 Yujia Huang2
- 1PetroChina Tarim Oilfield Company, Exploration Department, Korla, China
- 2Korla Branch of Research Institute of Bureau of Geophysical Prospecting INC, China National Petroleum Corporation, Korla, China
- 3PetroChina Tarim Oilfield Company, Kela Oil and Gas Production Management Zone, Korla, China
- 4PipeChina Group, Chongqing, China
The identification of the origins of source rock palaeo-overpressure based on logging response parameters is frequently influenced by the presence of organic matter. To accurately identify the paleo-overpressure origin of source rocks and employ an appropriate method for paleo-pressure calculation, this study proposes a quantitative approach to assess the influence of organic matter content on overpressure analysis. The findings demonstrate that the presence of organic matter in Chang 7 shale leads to an increase in acoustic time difference and a decrease in density. After incorporating the multi-component rock equivalent volume model correction, it is evident that the paleo-overpressure observed in the Chang 7 member is not attributed to undercompaction but rather to fluid expansion mechanisms. In conjunction with the acoustic velocity-density palte method, the paleo-overpressure of the Chang 7 member is attributed to undercompaction and expansion resulting from hydrocarbon generation. The pressure evolution of the Chang 7 member has been reconstructed based on the identification of its paleo-overpressure origin. The distribution characteristics of paleo-pressure recovered based on hydrocarbon generation expansion exhibit a strong correlation with the reservoir. The reliability of the correction method for organic matter influence is demonstrated. The proposed method is not only applicable for the investigation of paleo-pressure, but also holds significant implications for the assessment of pressure within organic-rich intervals.
1 Introduction
Overpressure is a prevalent geological phenomenon in petroleum basins, posing persistent challenges to researchers in the field of petroleum geology regarding its genesis and spatial distribution. (Hunt, 1990; Fu, et al., 2000; Chen and Wang, 2001; Zha, et al., 2002; Mohsin, et al., 2023). The initial research on formation pressure primarily caters to engineering requirements in ensuring the safety of drilling operations. The analysis of overpressure has emerged as a pivotal focus in the investigation of oil and gas reservoir formation, as our comprehension of this phenomenon continues to deepen. (Cao, et al., 2006). Historically, the focus of oil and gas exploration endeavors has predominantly revolved around the prevailing distribution characteristics of formation pressure. The proposal and successful application of various quantitative models for overpressure calculation have been witnessed across multiple disciplines. (Zhang, et al., 2013; Fan, et al., 2015; Su, et al., 2019; Qiu, et al., 2020a; Shabani, et al., 2022; Shabani, et al., 2023; Su, et al., 2023; Tang, et al., 2023). However, it appears that the paleo-pressure characteristics during the period of hydrocarbon accumulation exert a more pronounced influence on the distribution of hydrocarbons. It is crucial to develop a quantitative model for the recovery of paleo-overpressure. Currently, the predominant models utilized for reconstructing paleo-overpressure are predominantly forward models that necessitate a comprehensive understanding of the origins of overpressure (Zhao, et al., 2017; Nazemi, et al., 2021). The conventional approaches for identifying the origins of overpressure are based on the atypical response exhibited by various logging parameters within the interval of overpressure. The logging parameters, however, exhibit strong multi-solution due to various factors such as rock composition, fluid properties, and borehole diameter expansion. (Meyer and Nederlof, 1984; Zhang et al., 2002). The identification of overpressure origins can be significantly influenced in dark mudstones with hydrocarbon generation potential, particularly due to the low density and velocity of organic matter (Chen, 1996).
The Chang 7 member of the Yanchang Formation constitutes the primary source rock interval for the Triassic in the Ordos Basin, characterized by a suite of semi-deep or deep lacustrine facies dark mud shale (Guo and Li, 2016). Although the current formation pressure of the Chang 7 member is equal to or less than the hydrostatic pressure at the corresponding depth (Wang, 2012; Zhang, 2017), anomalies in log data such as velocity and density indicate a high likelihood of paleo-overpressure. Many scholars posited that the paleo-overpressure of the Chang 7 member is attributed to imbalanced compaction, as evidenced by significant anomalies in logging data. However, the author considered this case to be a prototypical example illustrating how the composition of organic matter can influence the identification outcomes of overpressure origins.
This paper presented a quantitative approach to assess the impact of organic matter content on overpressure analysis. Using Chang 7 Member as a case study, the pressure evolution process is reconstructed by identifying the origins of paleo-overpressure. The distribution characteristics of paleo-pressure recovered through origin analysis exhibit a strong correlation with the oil reservoirs. This confirms the robustness of the correction method in accounting for organic matter effects. This method is not only applicable for paleo-pressure analysis, but also holds significant implications for pressure assessment of organic-rich formations.
2 Geological background
The Ordos Basin is located in the central part of mainland China and the west of North China Platform. It is the second largest sedimentary basin in China. It was once a constituent of the Great North China Basin during the Paleozoic era, and subsequently transformed into a depression basin in the late Mesozoic period, exhibiting typical craton sedimentary basin characteristics. The basin margin deformation exhibits a high degree of intensity, while the main part of the basin displays a relatively simple structure. The regional structure of the basin is characterized by a gentle and broad monocline dipping towards the west. According to the fundamental geological conditions of the basin, including gravity, magnetic and electric characteristics, basement burial depth and current structure, as well as tectonic evolution, the basin can be classified into six second-order structural units: Yimeng uplift, Weibei uplift, Jinxi flexural fold belt, Yishan slope, Tianhuan depression and western margin thrust belt (Figure 1).
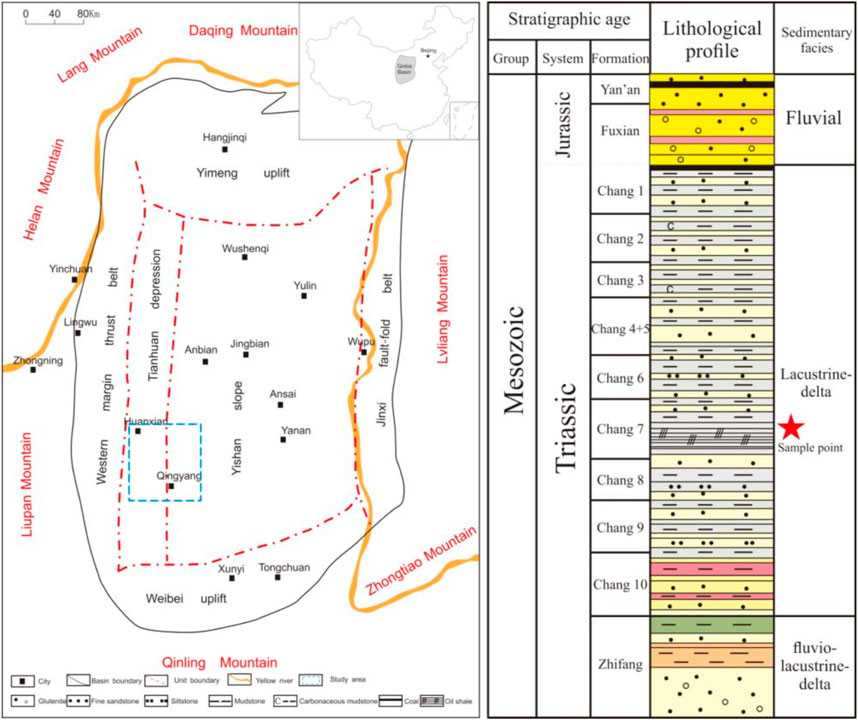
FIGURE 1. Simplified geological map of Ordos Basin and location of study area in the Ordos Basin.
The Chang 7 member studied in this paper was deposited during the maximum lacustrine transgression, resulting in a vast water body with interbedded dark mudstones and oil shales of shallow-deep lacustrine facies (Yang, et al., 2017). The study area is situated in the southwestern part of the basin, the Chang 7 member and the Chang 8 Member formed a high-quality source rock-reservoir combination (Yao, et al., 2014) (Figure 1). As a significant source rock segment, the current formation pressure of Chang 7 Member in this area is predominantly normal or negative (Yao, et al., 2013). However, the significant amount of oil and gas present in the shallower formation indicates that the Chang 7 member possesses high excess pressure, which serves as a driving force for oil and gas migration. Additionally, the presence of acoustic time differences and density anomalies in Chang 7 provides further evidence for the existence of paleo-overpressure.
3 Background of methods for analyzing the origins of overpressure
The primary origins of overpressure that receive significant attention in the field include disequilibrium compaction, hydrocarbon-generating expansion, conduction, chemical compaction, and tectonic action (Dickinson, 1953; Hubbert and Rubey, 1959; Barker, 1972; Magara, 1975; Law and Dickinson, 1985; Freed and Peacor, 1989; Swarbrick and Osborne, 1998; Yardley and Swarbrick, 2000). The origins of overpressure are directly related to the choice of a palaeo-pressure recovery model, and therefore a method for identifying the origins has been continuously explored and summarised. In general, abnormal pressure segments are often accompanied by regular abnormal changes in logging curves. Hermanrud et al. noted that the overpressure section causes significant anomalies in logging data closely related to porosity, such as acoustic time difference, density, resistivity and neutrons (Hermanrud, et al., 1998). Although he noted the abnormal response of some geophysical parameters to overpressure, he did not distinguish the origins of overpressure.
When studying the response characteristics of abnormal high-pressure logging in the Not formation in Haltenbanken area, Bowers divided the logging data into volume properties (density, neutron) and conductivity properties (acoustic time difference, resistivity) according to the different sensitivities of density, acoustic time difference, neutron and resistivity (Bowers, 2002). He emphasized that the overpressure formed when the compaction stops or slows down, such as disequilibrium compaction, often alters both volumetric and conductivity properties. The overpressure formed under the internal pressure of fluid expansion often has little effect on the volume properties, but it changes the structural characteristics of the pores and causes obvious anomalies in the conductivity properties. The pressure generated by fluid expansion can obviously change the throat in the pore throat structure, and with the increase of expansion pressure, the width of the throat becomes larger, and the number of throat decreases, which will lead to the increase of resistance and the decrease of acoustic velocity.
3.1 Log combination contrast method
Comparing the anomaly amplitudes of different logging parameters can often pose challenges due to their varying physical interpretations To address this problem, Bowers in 2002 summarized log data maps to distinguish between disequilibrium compaction and fluid expansion (Bowers, 2002). As depicted in Figure 2, the overpressure resulting from disequilibrium compaction causes an inversion of resistivity, acoustic velocity, and density. In the process of burial, once the geological body located at point A is sealed and undergoes disequilibrium compaction, it will eventually reach state C. For this kind of disequilibrium compaction, obviously the same electrical properties and similar lithology correspond to the same vertical effective stress, which is also the basic principle of the equilibrium depth method to predict formation pressure. Therefore, a simple method for identifying the origin of overpressure is obtained, that is, the resistivity, acoustic time difference and density at the same depth are read in the reverse section, while extending vertically up to the normal trend line. If the intersection point of the extension line of the log data and the normal trend line is basically at the same depth, then the overpressure at the reverse section is caused by disequilibrium compaction.
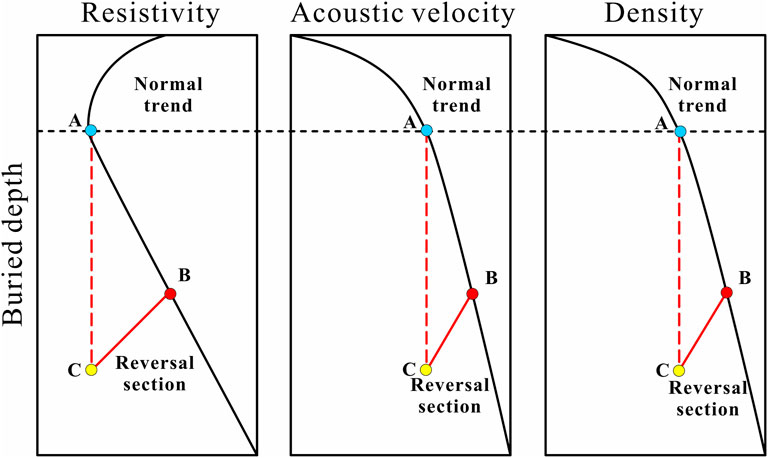
FIGURE 2. Response characteristics of disequilibrium compaction overpressure logging (Bowers, 2002).
Generally, elastic rebound does not occur under disequilibrium compaction. However, the overpressure caused by the fluid expansion tends to show elastic rebound. The occurrence of the rebound phenomenon often exerts a significant influence on individual logging data. The rebound of volume property is much smaller than that of conduction property. Thus, the resistivity, acoustic velocity, and density at the same depth are read in the reverse section, while extending vertically up to the normal trend line. If the resistivity and velocity extensions intersect with the normal trend line at basically the same depth, but the density extensions intersect with the normal trend line at a deeper depth than the other two data, then the overpressure at the inversion section is caused by fluid expansion (Figure 3).
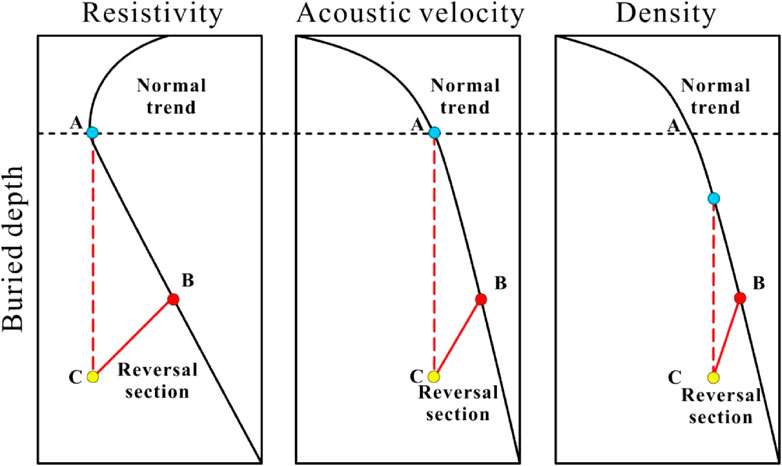
FIGURE 3. Response characteristics of fluid expansion overpressure logging.
3.2 Calculated porosity contrast method
Similarly, in order to compare the overpressure response of different physical parameters, Tingay simultaneously converted the acoustic time difference and density data into the corresponding porosity for comparative analysis (Tingay, et al., 2007). The amplitude of porosity anomaly, calculated based on volume and conduction properties, remains consistent in the overpressure section resulting from disequilibrium compaction. In the overpressure segment of fluid expansion, the anomaly amplitude of porosity calculated by volume properties is relatively low or almost no anomalies. This normalization method avoids subjective influence and is simple to operate, which has been recognized by many scholars.
This paper mainly compares the calculated results of porosity with density and acoustic time difference as the main parameters, and the calculation formula is as follows:
(Tingay, et al., 2007)where,
(Raymer, et al., 1980)where,
3.3 Velocity-density crossplot method
In addition to the above two methods, there is a more direct method, that is, to choose the velocity and density to compare, and draw the acoustic velocity - density crossplot plate (O'Connor and Lahann, 2011; Tingay and Morley, 2013; Dasgupta, et al., 2016) (Figure 4). During the loading process, the speed and density exhibit synchronous variations along the loading curve. Since disequilibrium compaction is only a pause in the compaction process, the speed and density still fall on the loading curve. Because the velocity variation is much greater than the density in the overpressure section caused by unloading, most of the data points fall under the loading curve.
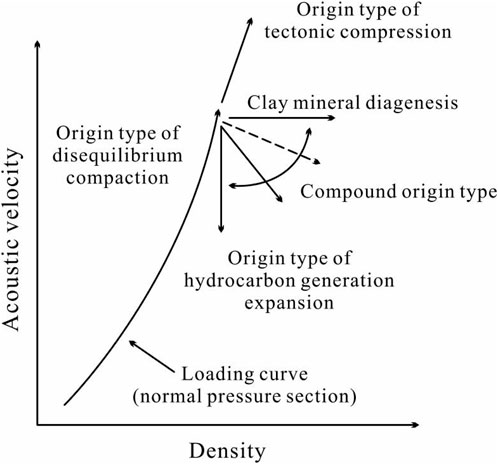
FIGURE 4. Acoustic velocity-density response characteristics corresponding to different overpressure mechanisms (O'Connor, et al., 2011; Tingay and Morley, 2013; Dasgupta, et al., 2016).
4 Materials and methods
4.1 Quantitative method for correction of organic matter content
In this paper, using unit volume as correction unit, the source rock is divided into four parts: rock skeleton, organic matter, hydrocarbon and formation water, and the non-source rock is divided into rock skeleton, hydrocarbon and formation water. By introducing organic matter into the multi-component equivalent volume model, the increment of acoustic time difference and density loss caused by organic matter in Chang 7 shale can be obtained. Ultimately, the acoustic time difference and density logging curves can be derived by eliminating the influence of organic matter.
The multi-component equivalent volume correction model of source rock is as follows (Li, et al., 2021):
where,
When the organic matter content of Chang 7 is quantitatively evaluated, the result is the mass percentage of organic carbon, but the volume percentage needs to be used in the correction. The mass percentage of TOC can be converted to the volume percentage of TOC according to the conversion coefficient of organic matter mass volume (Tang and Sun, 2019), that is:
where,
The rock components in non-source rocks can be considered as the framework of the rock and the fluid filling its pores. Since the shale of Chang 7 non-hydrocarbon source rock does not have the ability to generate hydrocarbon, and the shale is relatively dense, the oil and gas outside the shale pores can rarely be injected into the shale, so the hydrocarbon content in the pore fluid can be ignored. The physical volume model of non-source rock only includes rock skeleton and formation water, which can be expressed as:
where,
The increase of acoustic time difference and decrease of acoustic density caused by organic matter are as follows:
4.2 Methods of calculating palaeo-pressure
4.2.1 For disequilibrium compaction
The current predominant approach for quantifying overpressure induced by disequilibrium compaction is the equilibrium depth method. This method is based on the absolute correspondence between porosity and effective stress, so it can be combined with the buried history recovered by PetroMod2014 basin simulation system to calculate the pressure. The specific calculation steps are as follows: 1) Record the burial depth of the formation at the beginning of the rapid sedimentation and the effective stress at the depth under normal pressure; 2) Record the buried depth of the formation at the end of rapid sedimentation and lithostatic pressure at this depth; 3) The difference value is taken as the pore pressure at the end of sedimentation, and the excess pressure caused by disequilibrium compaction is calculated further combined with the hydrostatic pressure at this depth.
4.2.2 For hydrocarbon-generating expansion
This time, the calculation model of hydrocarbon generation pressurization established by Guo Xiaowen according to the conservation of space and matter is adopted (Guo, 2010), and its formula is as follows:
where,
5 Results
5.1 The influence of organic matter
It is calculated that the increment of acoustic time difference caused by organic matter in Chang 7 shale is between 2.56 and 169.78 μs/m, mainly distributed in the range of 2.56–80 μs/m. The density decrement caused by organic matter ranges from 0.01 to 0.61 g/cm3, and the main distribution ranges from 0.01 to 0.4 g/cm3 (Figure 5).
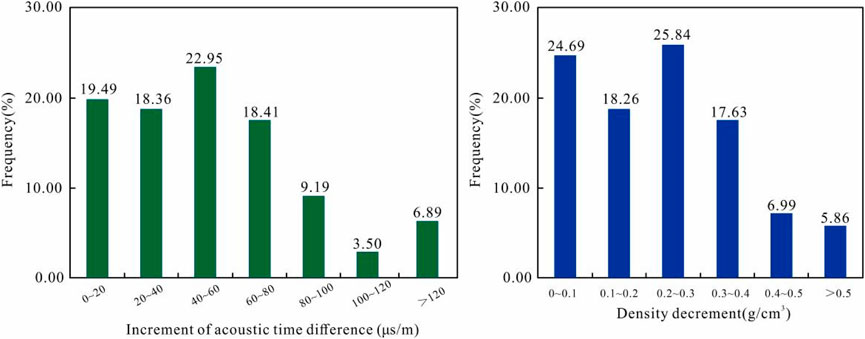
FIGURE 5. Quantitative effects of organic matter in Chang 7 on density and acoustic time difference.
5.2 Identification results of the origin of paleo-overpressure
Figure 6 shows the difference between density porosity and acoustic time difference of Chang 7 member before and after correction. Both kinds of porosity before correction deviate significantly from the normal trend of porosity change, and the difference between density porosity and acoustic time difference of porosity is small. The paleo-overpressure of Chang 7 member is caused by disequilibrium compaction. After correction, the density porosity reverts to the normal trend line, and the porosity undergoes compaction in accordance with standard procedures. Although the deviation degree of acoustic time difference porosity decreased, it still deviated from the normal trend, and the difference between density porosity and acoustic time difference porosity varied from little to obvious, indicating that the paleo-overpressure of Chang 7 member was not caused by undercompaction, but by fluid expansion mechanism.
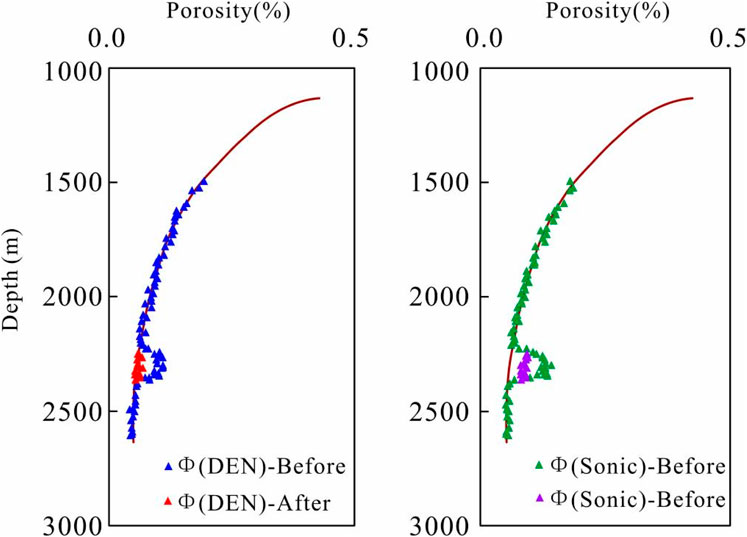
FIGURE 6. Difference in acoustic time difference porosity-density porosity before and after correction for organic matter.
5.3 Paleo-pressure recovery results
Based on the revised velocity and density response characteristics, the primary cause of paleo-overpressure formation in the study area is attributed to fluid expansion resulting from hydrocarbon generation within Chang 7 Member source rock. The hydrocarbon generation pressurization recovery model was employed to analyze the paleo-pressure recovery results of a reservoir in the study area, as illustrated in Figure 7. The hydrostatic pressure data comes from Li (Li and Guo, 2011). It can be seen that the source rocks of Chang 7 Member began to generate hydrocarbon in the early Cretaceous and reached the peak of hydrocarbon generation until 100 Ma ago. Simultaneously, the formation pressure gradually accumulated during the process of hydrocarbon generation. The maximum excess pressure is 10–15 MPa. During the period of 100 Ma∼2 Ma, with the continuous uplift of the strata, the hydrocarbon generation stopped, and the formation pressure also continued to lose, and finally formed the present distribution characteristics dominated by normal pressure.
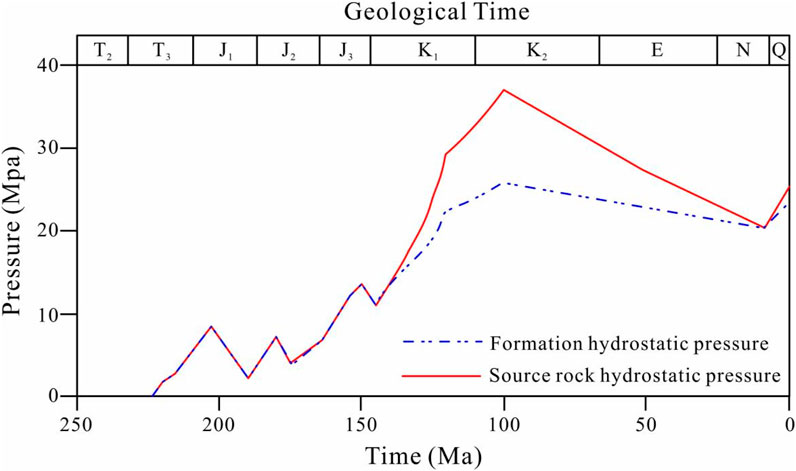
FIGURE 7. Diagram of formation pressure evolution process of source rock in Chang 7 member.
6 Discussion
6.1 The correction model can eliminate the influence of organic matter and determine the correct origin of paleo-overpressure
After correction of the multi-component rock equivalent volume correction model, the effect of high organic content on the acoustic time difference and density in the Chang 7 section was excluded, and the characteristics of the Chang 7 section logging curve were significantly different before and after correction. Before correction, as the burial depth increases, the acoustic time difference does not fit the normal compaction trend line and reverses, showing a right deflection anomaly increase; while the density also deviates from the normal compaction trend line and reverses, showing a left deflection anomaly increase. After correction, the acoustic time difference still deviates from the normal compaction trend line as the depth of burial increases, but shows a characteristic decrease in leftward deflection; while the density basically returns to the normal compaction trend line or its vicinity, without deflection (Figure 8).
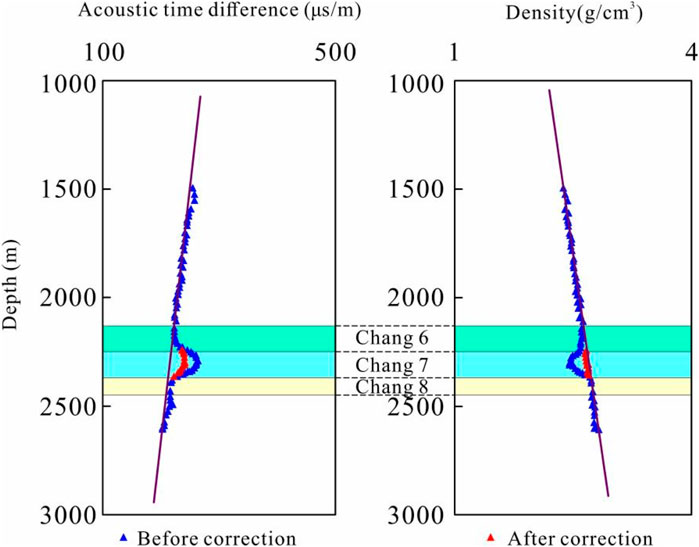
FIGURE 8. Log response characteristics before and after correction.
The acoustic velocity-density response characteristics of shale in the study area are shown in Figure 9, and the acoustic velocity-density crossplot before and after correction also presents different changing trends. Before correction, the subpoint of Chang 7 member segment fall on the loading curve of disequilibrium compaction and are distributed on or near the loading curve, indicating that the paleo-overpressure of Chang 7 member segment is caused by disequilibrium compaction. After correction, part of the paleo-overpressure is still located near the loading curve, but most of it is located near the hydrocarbon generation expansion trend line, indicating that the paleo-overpressure of Chang 7 member is not only caused by undercompaction, but also caused by the hydrocarbon generation expansion of mature organic matter. In short, after correction, the acoustic velocity is higher than that before correction, the density does not change significantly, and the acoustic velocity gradually decreases, which accords with the characteristics of hydrocarbon generation expansion. Through the method of acoustic velocity-density plate, it is found that the paleo-overpressure of Chang 7 member is caused by two compound origins: undercompaction and hydrocarbon generation expansion.
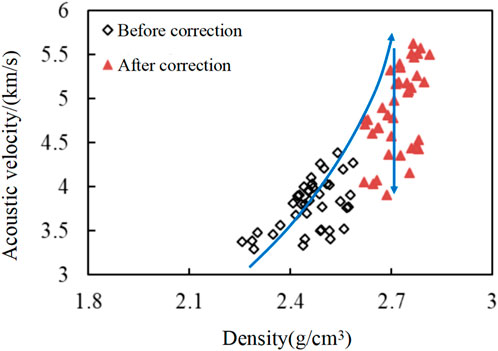
FIGURE 9. Acoustic velocity-density crossplot of Chang 7 shale in the study area.
6.2 It is difficult for the paleo-pressure caused by undercompaction to break through the resistance
According to the results of porosity simulation and recovery (Wang, et al., 2016) (Figure 10), although porosity evolved slowly between 200 Ma and 160 Ma, burial depth did not increase to a large extent during the same period. Therefore, the overpressure calculated based on the unbalanced compaction model will be smaller. Furthermore, numerous uplift events occurred during this period, posing challenges in preserving the accumulated excess pressure for subsequent oil and gas migration.
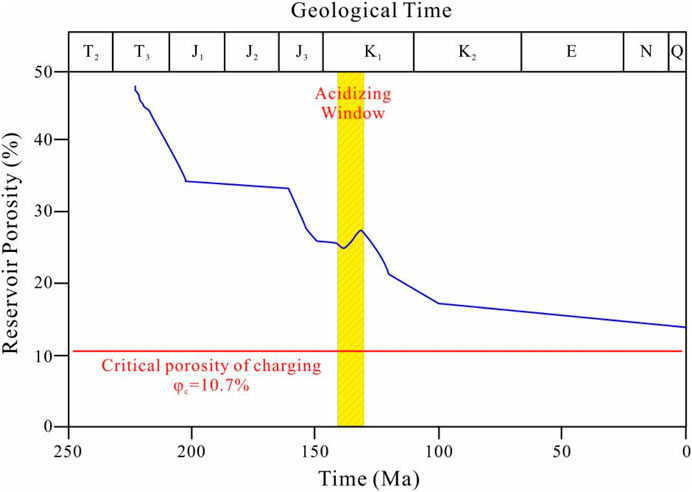
FIGURE 10. Evolution diagram of sandstone porosity in Chang 8 member (Modified by Wang, et al., 2016).
Through the comprehensive simulation of the evolution process of various hydrocarbon accumulation factors (Chen, et al., 2018), the time of hydrocarbon generation and pressurization is well matched with other factors. At the same time, the overpressure caused by hydrocarbon generation can reach up to 30MPa, while the highest charging resistance of the reservoir is less than 20 MPa. During the 140 Ma∼2 Ma period, the long-term stable sourced-reservoir pressure difference promotes the formation of a large favorable charging window (Figure 11). It is proved that the paleooverpressure is caused by hydrocarbon generation, and the supercharging of hydrocarbon generation is one of the important factors affecting the hydrocarbon accumulation in the target layer in the study area.
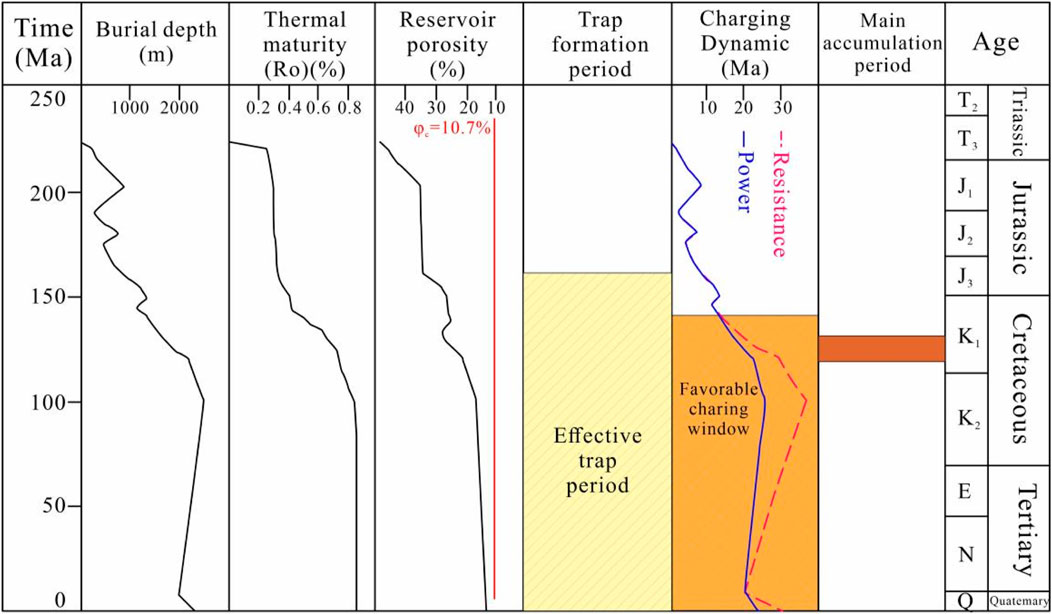
FIGURE 11. Comprehensive map of reservoir formation factors evolution.
6.3 The high structure with overpressure is a favorable area for reservoir distribution
The distribution characteristics of paleo-pressure in the mudstone of Chang 7 member have been determined by extrapolating the results of hydrocarbon generation pressurization model to the entire area. c. The pressure distribution is controlled by the sedimentary facies zone, and the more developed the mudstone, the greater the pressure, which is just opposite to the present trend. The mudstone formation experienced a general development of overpressure during the accumulation period, with a gradual decrease in overpressure amplitude from east to west. The reservoir is located in the transition area from high pressure to low pressure (Figure 12).
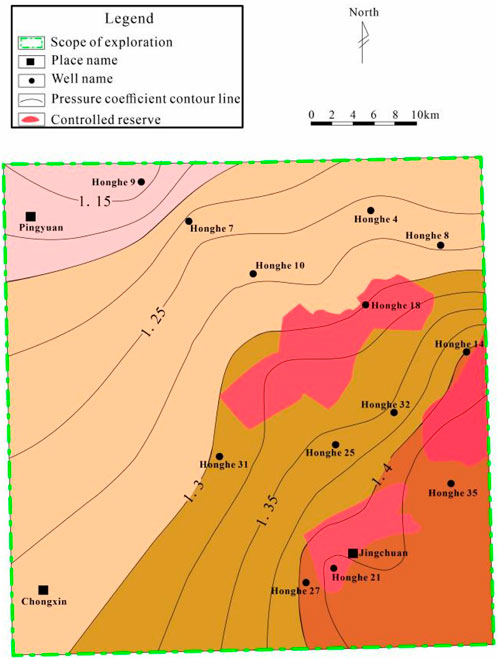
FIGURE 12. Contour map of pressure coefficient of Chang-7 during oil accumulation period and its relationship with oil reservoirs.
Based on the study on the fluid pressure characteristics of the Chang 7 mudstone formation, it is found that the fluid pressure characteristics of the present mudstone are obviously adjusted compared with the accumulation period, which is related to the regional tectonic inversion, geothermal decline and the evolution of overlying pressure. The oil reservoirs are primarily distributed in the transitional zone of mudstone pressure gradients during the accumulation period. The abnormal high pressure in mudstone is the main driving force of hydrocarbon migration and accumulation.
7 Conclusion
Paleo-overpressure is common in Chang-7 source rocks in the study area, and the content of organic matter will cause obvious deviation in logging response characteristics, which will affect the correct identification of the origin of paleo-overpressure.
The multi-component rock equivalent volume correction model can eliminate the influence of organic matter and determine the correct origin of paleo-overpressure. It is found that the origin of hydrocarbon generation expansion paleo-overpressure is dominant in the study area, and the correction model is effective.
The distribution characteristics of paleo-pressure recovered based on the analysis of hydrocarbon generation expansion have a good relationship with the reservoir, and the reservoir is mainly distributed in the high structure where the overpressure is relatively developed.
Data availability statement
The original contributions presented in the study are included in the article/Supplementary material, further inquiries can be directed to the corresponding author.
Author contributions
KX: Writing–original draft, Writing–review and editing. YH: Conceptualization, Data curation, Formal Analysis, Writing–original draft. MT: Funding acquisition, Investigation, Methodology, Writing–original draft. JW: Project administration, Resources, Software, Writing–review and editing. TM: Supervision, Writing–review and editing.
Funding
The author(s) declare that no financial support was received for the research, authorship, and/or publication of this article.
Conflict of interest
Authors KX, MT, and JW were employed by PetroChina Tarim Oilfield Company. Author YH was employed by China National Petroleum Corporation. Author TM was employed by PipeChina Group.
Publisher’s note
All claims expressed in this article are solely those of the authors and do not necessarily represent those of their affiliated organizations, or those of the publisher, the editors and the reviewers. Any product that may be evaluated in this article, or claim that may be made by its manufacturer, is not guaranteed or endorsed by the publisher.
References
Amyx, J. W., Bass, D. M., and Whiting, R. L. (1960). Petroleum reservoir engineering: physical properties. https://lmsspada.kemdikbud.go.id/pluginfile.php/679010/mod_resource/content/1/Amyx%20-%20Petroleum%20Reservoir%20Engineering_compressed.pdf.
Barker, C. (1972). Aquathermal pressuring-role of temperature in development of abnormal-pressure zones. AAPG Bull. 56, 2068–2071. doi:10.1306/819A41B0-16C5-11D7-8645000102C1865D
Cao, H., Gong, J. J., and Wang, G. F. (2006). The cause of overpressure and its relationship with reservoir forming. Nat. Gas. Geosci. 03, 422–425. doi:10.1007/s10552-013-0268-z
Chen, B. N., and Wang, N. (2001). Research advance and method practice of anomalous fluid pressure. Pet. Geol. Recovery Effic. 01, 35–37+3.
Chen, H. H., Zhu, X. M., Chen, C. F., Yin, W., and Shi, R. S. (2018). The coupling relationship of reservoir densification history and hydrocarbon emplacement in tight sandstone reservoir: a case study of the Chang8 oil member, Yanchang Formation, southern Ordos Basin. Acta Sedimentol. Sin. 36, 401–414. doi:10.7623/syxb201803001
Chen, Y. C. (1996). Using the logging data to study and evaluate the source rocks. Geophys. Prospect. Petroleum 01, 99–106.
Dasgupta, S., Chatterjee, R., and Mohanty, S. P. (2016). Magnitude, mechanisms, and prediction of abnormal pore pressure using well data in the Krishna–Godavari Basin, east coast of India. AAPG Bull. 100, 1833–1855. doi:10.1306/05131615170
Dickinson, G. (1953). Geological aspects of abnormal reservoir pressures in Gulf Coast Louisiana. AAPG Bull. 37, 410–432. doi:10.1306/5ceadc6b-16bb-11d7-8645000102c1865d
DuBow, J. (1984). “Temperature effects,” in Mechanics of oilshale [A]: london. Editors K. P. Chong, and J. W. Smith (Amsterdam, Netherlands: Elsevier Applied Science Publishers), 523–577.
Fan, C. Y., Wang, Z. L., Wang, A. G., Zhang, X., Zhang, Y. S., and Kong, H. X. (2015). Mechanisms for overpressure generation and origin of overpressured gas anaaquifer layers, Eboliang structure belt, northernQaidam Basin. Acta Pet. Sin. 36, 699–706+714. doi:10.7623/syxb201506006
Freed, R. L., and Peacor, D. R. (1989). Geopressured shale and sealing effect of smectite to illite transition. AAPG Bull. 73, 1223–1232. doi:10.1306/44b4aa0a-170a-11d7-8645000102c1865d
Fu, G., Lv, Y. F., Xue, Y. C., and Yang, M. (2000). Evolution characteristics of pressure sealing of mudstone caprock and its research significance. Acta Pet. Sin. 03, 41–44+109. doi:10.7623/syxb200003008
Guo, X. W. (2010). Overpressure evolution caused by hydrocarbon generation in petroliferous basins-two cases studies from dongying and baiyun depressions. Wuhan, China: China University of Geosciences.
Guo, Y. Q., and Li, W. H. (2016). Tight reservoir characteristics and reservoir enrichment rule of triassic Yanchang Formation in Ordos Basin. Beijing, China: Petroleum Industry Press.
Hermanrud, C., Wensaas, L., and Teige, G. M. (1998). Shale porosities from well logs on haltenbanken (offshore mid-Norway) show No influence of overpressuring. Australia: GeoScience.
Hubbert, M. K., and Rubey, W. W. (1959). Role of fluid pressure in mechanics of overthrust faultingi. mechanics of fluid-filled porous solids and its application to overthrust faulting. GSA Bull. 70, 115–166. doi:10.1130/0016-7606(1997)109<0643:CBQBFT>2.3.CO;2
Hunt, J. M. (1990). Generation and migration of petroleum from abnormally pressured fluid compartments. AAPG Bull. 74, 1–12. doi:10.1306/0c9b21eb-1710-11d7-8645000102c1865d
Law, B. E., and Dickinson, W. W. (1985). Conceptual model of origin of abnormally pressured gas accumulations in low permeability reservoirs. AAPG Bull. 69, 1295–1304. doi:10.1306/AD462BD7-16F7-11D7-8645000102C1865D
Li, C., Zhang, L. G., Luo, X. R., Zhang, L. Q., Hu, C. Z., Yang, P., et al. (2016). A quantitative method for revising abnormally high sonic data in rich-organic rock during compaction study. J. China Univ. Pet. Ed. Nat. Sci. 40, 77–87. doi:10.3969/j.issn.1673-5005.2016.03.010
Li, J., Zhao, J. Z., Hou, Z. Q., Zhang, S. P., and Chen, M. N. (2021). Origins of overpressure in the central Xihu depression of the East China Sea shelf basin. AAPG Bull. 105, 1627–1659. doi:10.1306/02262118112
Li, X. W., and Guo, X. W. (2011). Study on the characteristic of hydrocarbon accumulation mesozoic formation in zhenjing block,Ordos Basin. Chengdu, China: Chengdu University of Technology.
Liang, X. W., Guan, Z. X., Niu, X. B., Guan, P., Dan, W. D., Feng, S. B., et al. (2020). Reservoir characteristics of shale oil in Chang 7 member of Yanchang Formation Ordos Basin. Nat. Gas. Geosci. 31, 1489–1500.
Magara, K. (1975). Importance of aquathermal pressuring effect in Gulf coast. AAPG Bull. 59, 2037–2045. doi:10.1306/83d921db-16c7-11d7-8645000102c1865d
Meyer, B. L., and Nederlof, M. H. (1984). Identification of source rocks on wireline logs by density/resistivity and sonic transit time/resistivity crossplots. AAPG Bull. 68, 121–129. doi:10.1306/ad4609e0-16f7-11d7-8645000102c1865d
Mohsin, M., Tavakoli, V., and Jamalian, A. (2023). The effects of heterogeneity on pressure derived porosity changes in carbonate reservoirs, Mishrif formation in SE Iraq. Petroleum Sci. Technol. 41, 898–915. doi:10.1080/10916466.2022.2070210
Nazemi, M., Tavakoli, V., Rahimpour-Bonab, H., and Sharifi-Yazdi, M. (2021). Integrating petrophysical attributes with saturation data in a geological framework, Permian-Triassic reservoirs of the central Persian Gulf. J. Afr. Earth Sci. 179, 104203. doi:10.1016/j.jafrearsci.2021.104203
O'Connor, S., and Lahann, R. S. (2011). Geologically-driven pore fluid pressure models and their implications for petroleum exploration. Introduction to thematic set. Geofluids 11, 1468–8123. doi:10.1111/j.1468-8123.2011.00354.x
Qiu, N., Liu, Y., Liu, W., and Jia, J. (2020a). Quantitative reconstruction of formation paleo-pressure in sedimentary basins and case studies. Sci. China Earth Sci. 63, 808–821. doi:10.1007/s11430-019-9556-8
Qiu, N., Liu, Y., Liu, W., and Jia, J. (2020b). Quantitative reconstruction of formation paleo-pressure in sedimentary basins and case studies. Sci. China Earth Sci. 63, 808–821. doi:10.1007/s11430-019-9556-8
Raymer, L. L., Hunt, E. R., and Gardner, J. S. (1980). “An improved sonic transit time-to-porosity transform,” in SPWLA Annual Logging Symposium. SPWLA, Lafayette, Louisiana, July, 1980.
Shabani, F., Amini, A., Tavakoli, V., Chehrazi, A., and Gong, C. (2023). 3D basin and petroleum system modelling of the early cretaceous play in the NW Persian Gulf. Geoenergy Sci. Eng. 226, 211768. doi:10.1016/j.geoen.2023.211768
Shabani, F., Amini, A., Tavakoli, V., Honarmand, J., and Gong, C. (2022). 3D forward stratigraphic modeling of the Albian succession in a part of the northeastern margin of the Arabian Plate and its implications for exploration of subtle traps. Mar. Petroleum Geol. 145, 105880. doi:10.1016/j.marpetgeo.2022.105880
Su, A., Chen, H., Feng, Y. X., Zhao, J. X., Lei, M., and Nguyen, A. D. (2023). Distal accumulation of leaked gas from deep overpressured zone: the case of the Yanan Sag, Qiongdongnan Basin, South China Sea. Mar. Petroleum Geol. 151, 106181–181. doi:10.1016/j.marpetgeo.2023.106181
Su, A., Chen, H., Lei, M., Li, Q., and Wang, C. (2019). Paleo-pressure evolution and its origin in the pinghu slope belt of the xihu depression, east China sea basin. Mar. Petroleum Geol. 107, 198–213. doi:10.1016/j.marpetgeo.2019.05.017
Swarbrick, R. E., and Osborne, M. J. (1998). A review of mechanics for generation overpressure insedimentary basin. AAPG Mem. 70, 13–34.
Tang, T. Z., and Sun, L. D. (2019). Petroleum geophysical logging. Beijing: Petroleum Industry Press.
Tang, Y., Wu, Y., Wang, R., Huang, Y., Xue, Y., Chen, Z., et al. (2023). Fluid evolution and paleo-pressure recovery by Raman quantitative analysis in the Shahejie Formation of the western slope belt in Dongpu Sag, Bohai Bay Basin, China. Front. Earth Sci. 10, 1059–1909. doi:10.3389/feart.2022.1059909
Tingay, M. R. P., Hillis, R. R., Swarbrick, R. E., Morley, C. K., and Damit, A. R. (2007). ‘Vertically transferred’overpressures in Brunei: evidence for a new mechanism for the formation of high-magnitude overpressure. Geology 35, 1023–1026. doi:10.1130/g23906a.1
Tingay, M. R. P., Morley, C. K., Laird, A., Limpornpipat, O., Krisadasima, K., Pabchanda, S., et al. (2013). Evidence for overpressure generation by kerogen-to-gas maturation in the northern Malay Basin. AAPG Bull. 97, 639–672. doi:10.1306/09041212032
Wang, Y. (2012). Research on the relationship between abnormal pressureand hydrocarbon accumulation of lower YanchangFormation in the central and western erdos basin. Kirkland, Washington: Northwest University.
Wang, Y., Li, S. T., Mou, W. W., and Yan, C. C. (2016). Tight reservoir characteristics and porosity evolution of Chang8-1 in western Jiyuan area. Lithol. Reserv. 28, 59–66.
Wu, Y., Hou, Y. T., Li, H. G., and Xian, C. G. (2016). Application of high-precision formation elements logging to shale oil ReservoilEvaluationA case study of seventh member of Yanchang Formation, Ordos Basin. Unconv. Oil Gas 3, 1–10.
Xu, Z. Y., Zhao, J. Z., and Li, J. (2019). The impact of organic matter content on overpressure analysis and itscorrection method in the first member of Cretaceous Qingshankou Formation,Placanticline area, Songliao Basin. Oil Gas. Geol. (Beijing, China) 40, 938–946.
Yang, D. Q., Liu, B., Jia, M. C., Liu, T. X., Jin, L., and Wang, H. L. (2018). Misunderstandings of high organic matter abundance mudstone compaction and quantitative correction methods. Fault-Block Oil Gas. Field 25, 29–33.
Yang, H., Liang, X. W., Niu, X. B., Feng, S. B., and You, Y. (2017). Geological conditions for continental tight oil formation and the main controllingfactors for the enrichment: a case of Chang 7 Member, Triassic Yanchang Formation.Ordos Basin, NW China. Pet. Explor. Dev. 44, 11–19. doi:10.1016/s1876-3804(17)30003-4
Yao, T. L., Deng, X. Q., Zhao, Y. D., Han, T. Y., Chu, M. J., and Pang, J. L. (2013). Characteristics of tight oil in triassic Yanchang Formation,Ordos Basin. Pet. Explor. Dev. 40, 161–169. doi:10.1016/s1876-3804(13)60019-1
Yao, T. L., Duan, Y., Xu, L., Luo, A. X., Deng, X. Q., Zhao, Y. D., et al. (2014). Pressure evolution and oil-gas migration and accumulation in mesozoic palaeo-strata in longdong area of the Ordos Basin. Nat. Gas. Geosci. 25, 649–656.
Yardley, G. S., and Swarbrick, R. E. (2000). Lateral transfer: a source of additional overpressure? Mar. Petroleum Geol. 17, 523–537. doi:10.1016/s0264-8172(00)00007-6
Zha, M., Qu, J. X., and Zhang, W. H. (2002). The relationship between overpressure and reservoir forming mechanism. Pet. Explor. Dev. 01, 19–23. doi:10.0000/1000-0747-29-165
Zhang, F. Q., Wang, Z. L., Wu, Y. S., Yang, J. H., and Luo, X. R. (2002). A method for eliminating geology factors of affecting compaction trendline: an example from yinggehai basin. Acta Sedimentol. Sin. 02, 326–332.
Zhang, F. Q., Wang, Z. L., Zhong, H. L., Yang, C., and Wang, J. T. (2013). Recognition model and contribution evaluation of main overpressure FormationMechanisms in sedimentary basins. Nat. Gas. Geosci. 24, 1151–1158. doi:10.9774/GLEAF.978-1-909493-38-4_2
Zhang, H. Y. (2017). Overpressure by Hydrocarbon Generation as the dynamic for tight oil migration-A case of Yanchang tight oil from Ordos Basin. Chengdu, China: Southwest Petroleum University.
Keywords: origin identification of palaeo-overpressure, logging response, correction of organic matter content, Chang 7 member, Ordos Basin
Citation: Xu K, Huang Y, Tang M, Wu J and Ma T (2024) Origin analysis of paleo-overpressure in source rocks based on logging response characteristics: a case study of the Chang 7 member in the Triassic Yanchang formation, Longdong area, Ordos Basin, China. Front. Earth Sci. 12:1289510. doi: 10.3389/feart.2024.1289510
Received: 06 September 2023; Accepted: 30 January 2024;
Published: 15 February 2024.
Edited by:
Irene Cornacchia, Italian National Research Council, ItalyCopyright © 2024 Xu, Huang, Tang, Wu and Ma. This is an open-access article distributed under the terms of the Creative Commons Attribution License (CC BY). The use, distribution or reproduction in other forums is permitted, provided the original author(s) and the copyright owner(s) are credited and that the original publication in this journal is cited, in accordance with accepted academic practice. No use, distribution or reproduction is permitted which does not comply with these terms.
*Correspondence: Kaitong Xu, cGVpZHVuMTk5MjAzQDE2My5jb20=