 Yang Yang
 Sanxi Peng3
 Qinghua Peng
95% of researchers rate our articles as excellent or good
Learn more about the work of our research integrity team to safeguard the quality of each article we publish.
Find out more
ORIGINAL RESEARCH article
Front. Earth Sci. , 08 February 2024
Sec. Solid Earth Geophysics
Volume 12 - 2024 | https://doi.org/10.3389/feart.2024.1289469
This article is part of the Research Topic Advanced Methods for Interpreting Geological and Geophysical Data View all 36 articles
Transient electromagnetic method (TEM) is widely used in coalfield hydrogeological exploration and goaf investigation. However, given the limitations of the method, the vertical resolution of ground TEM is somewhat low for effectively detecting water-bearing coal goaf. Compared with ground TEM, ground-borehole TEM is characterized by a relatively better ability for detecting low-resistivity target bodies. In this study, a low-resistivity thin plate model was established, and the ground-borehole TEM electromagnetic responses of different points (within and without of the plate) were numerically simulated. We considered an exploration project in Datong City (Shanxi Province, China) as a study case, to conduct the field investigation, examine the characteristics of ground-borehole TEM electromagnetic responses under different situations, and validate the numerical model as well, including (a) water-bearing coal goaf and (b) solid coal. The result showed that, (a) the longer the sampling time is, the weaker the electromagnetic response of ground-borehole TEM will be; (2) ground-borehole TEM stands out with a high vertical resolution for water-bearing coal goaf; (c) the extreme points of the Z component and the polarity changing points of the X and Y components can indicate the interface where the physical properties alternated.
The ongoing socio-economic development has triggered the demand for efficient restoration and management of the mining environment practices. Such demand, in turn, has strongly promoted the exploration and management of goaf, thereby bringing the existing techniques to a new level. In particular, a fine detection of goaf is critical for rational planning of routes or targeted governance, especially in the locations, where roads and railways pass through the goaf.
To date, the detection of coal goaf is mainly based on geophysical exploration methods, where each method has its own advantages and disadvantages. For instance, the high-density resistivity method is characterized by speed and convenience in the data collecting process, while its results are notably intuitive. However, its detection depth is shallow, while the requirements for data collection conditions are strict (Lei et al., 2009). Liu et al. (2012) predetermine the low resolution of processing and inversion results of this method, thereby critically hindering the suppression of noise interference needed to meet the requirements of data interpretation. The seismic exploration method provides high resolution, but the goaf site environments are generally complex, the exploration depth of low-energy sources is limited, and the cost of high-energy sources is high (Wang, et al., 1998; Ezersky, 2011; Wei et al., 2014; Bai et al., 2019; Bai, 2022). Ground penetrating radar is highly effective and accurate for interpreting the results, but its detection depth is limited under the technical limitations of the method itself, for example, the transmitting power is relatively small compared to the MT method. As a result, one cannot address the goaf with the depth of >100 m by using GPR (Cheng et al., 2010; Klotzsche et al., 2019; Ozkaya et al., 2021). Compared with other methods, transient electromagnetic method (TEM) is notably advantageous for detecting water-bearing coal goaf. In particular, (a) the pure anomaly field of TEM is especially sensitive to low-resistivity targets, and (b) the network of surveying points is relatively dense. Thus, TEM can be used to control the boundary of the coal goaf effectively, while the rock layer on surface can be penetrated. As a result, the data of the deep coal goaf can be accurately collected by the receivers (Yang and Oldenburg, 2012; Xue and Yu, 2017; Bai et al., 2020; Bai et al., 2021; Cui et al., 2022).
In general, TEM can be divided into aerial TEM, ground TEM, and ground-borehole TEM depending on the location of the receiver. Notably, the work efficiency of TEM is high, its detection cost of ground is low, and it is less affected by the terrain. This allows penetrating the high-resistivity covering layers on the surface, thereby providing peculiar benefits for coal goaf exploration. Overall, these characteristics make TEM beneficial for the exploration of deep ore bodies. Numerous researchers have focused on processing and interpreting ground-borehole TEM. For instance, Meng and Pan (2012) examined the forward modeling characteristics of ground-borehole TEM under the influence of the earth medium. Zhang et al. (2014) studied the acquisition technology of transient electromagnetic data in the borehole and the technology from qualitative analysis to semi-quantitative interpretation and proposed the rapid positioning technology of abnormal vector intersection. Furthermore, Wu et al. (2017) analyzed the three-component response characteristics of electrical source ground-borehole TEM. In the Sudbury copper mine in Canada, a Linsley ore body and aVictoria copper-nickel deposit at a depth of 2400 m were discovered by the ground-well TEM (Ben, 2000). In addition, a high-grade floor deposit was found by using ground-borehole TEM below the mined deposit, making a significant contribution to the development of mine resources (King, 1996; Spicer, 2016). However, studies addressing the data processing of ground-borehole TEM by using the numerical simulation and electrical response characteristics are scarce.
To examine the effect of ground-borehole TEM on the detection for coal goaf, we introduced a geophysical model of low-resistivity thin plate to simulate the simplified model of a water-bearing coal goaf, and obtained the ground-borehole TEM responses of different points (within and without of the plate). The main objectives are to (a) construct electromagnetic response curves based on simulations and (b) determine the location and size of the anomalies, thereby providing theoretical fundament for the exploration of coal goaf by ground-borehole TEM. Carrying out an exploration project in Datong City (Shanxi Province, China) as a study case, the field investigation has been done, the characteristics of ground-borehole TEM electromagnetic responses under different situations (including water-bearing coal goaf and solid coal) were examined, and the numerical model was validated as well. The results showed that using ground-borehole TEM to detect the water-bearing coal goaf has an ideal effect.
For the ground-borehole TEM, the transmitting loop is normally organized on the ground, while a receiving probe collects data at fixed intervals in the borehole (Figure 1). During the data acquisition, the receiving probe in the ground-borehole TEM is located close to the geological body, thus producing anomalous response and potentially acquiring more useful information in the vertical direction than that in ground TEM (Zhang et al., 2015).
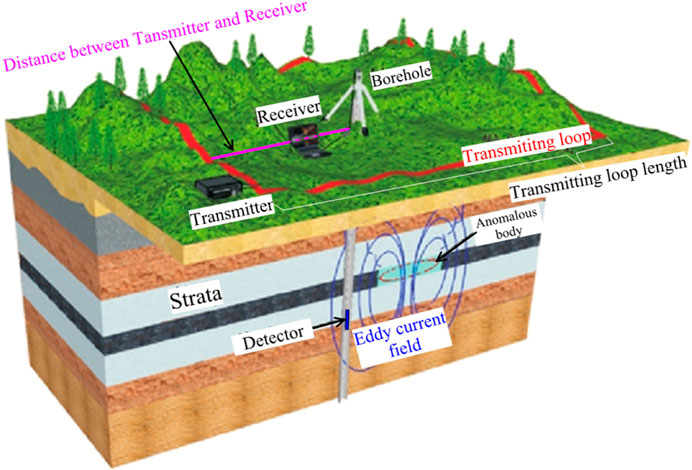
FIGURE 1. Schematic diagram of ground-borehole TEM working device.
To study the distribution characteristics of ground-borehole TEM electromagnetic responses under different coal goaf conditions, numerical simulations were performed using the finite difference method.
In a homogeneous isotropic medium, by neglecting the displacement current, the active Maxborehole Formulas can be formalized according to Xu et al. (2015) as follows:
where
Taking the curl on both sides of Eq. 1 and by substituting Eqs (2) and (3) into it, one can use the vector identity:
where
In the Cartesian coordinate system, the area, calculated by the forward modeling model is divided into several small cuboids using a non-uniform grid (Figure 2). In this way, the problem of solving the spatially continuous magnetic field in an infinite area can be transformed to the following task. One needs to solve the field value of each small cuboid discrete node in only a limited area.

FIGURE 2. Finite-difference network model in 3D half-space.
Thus, by taking the volume fraction on both sides of Eq. 7, we can get the following equation:
Furthermore, Eq. 8 can be simplified using the Gauss formula. The partial derivative of the magnetic field with respect to space and time is replaced by the intermediate difference quotient approximation, and the stable and convergent Dufort-Frankel method is used for differential discretization by getting the following expressions:
where
In the forward calculation, the initial conditions are generally substituted into the analytical solution of the field source in the uniform half-space. Thus, the form of the field source can be selected according to the actual needs. To this end, the loop source was selected as the initial condition to be substituted. The analytical solution of the loop source in the time domain in the uniform half-space can be obtained by inverse Laplace transformation of the analytical solution in the frequency domain. The analytical solution of the vertical component of the loop source magnetic field in the frequency domain is expressed as follows (Xu et al., 2015):
where
where
where
To study the electromagnetic response characteristics of ground-borehole TEM to the coal goaf, a simple uniform half-space model is established in the Cartesian coordinate system, and the numerical simulation is carried out using this model. In the model, the resistivity of the uniform half space is set to 100 Om, representing the surrounding rock of the coal seam. A horizontal thin plate with a side length of 100 m and a thickness of 20 m is set at a depth of 300 m, with a resistivity of 10 Om, representing a water-bearing coal goaf (Figure 3).
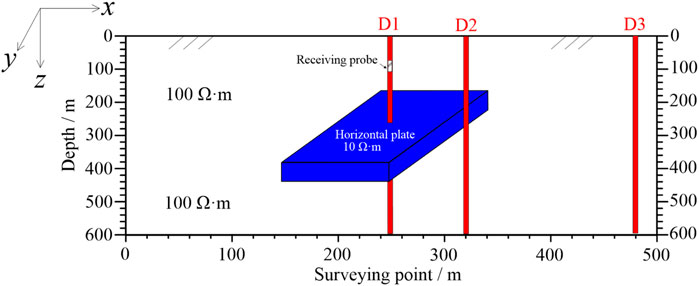
FIGURE 3. Schematic diagram of the numerical simulation model.
Furthermore, numerical simulations of ground-borehole TEM were performed using the geological model shown in Figure 3. The transmitting device was a square single-turn loop with the side length of 200 m with the center, located directly above the center of the plate (Figure 4). The receiving probe featured an axial coil (Z direction) with the equivalent area of 10,000 m2. The equivalent area of the radial coils (X and Y directions) was 2,500 m2, while the simulated borehole depth was 600 m, which virtually represented a straight hole. The receiving points were measured along the borehole, and the surveying point distance was 1 m.
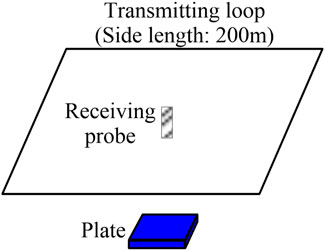
FIGURE 4. Schematic diagram of the transmitting and receiving devices.
The primary field and secondary field generated in the underground space were both vector fields. The ground-borehole TEM used a fixed transmitting source and a movable receiving probe to monitor the electromagnetic responses at different depths. Therefore, the directions of the electromagnetic responses, namely, the “positive” and “negative” signs of the response values, are the key parameters to be investigated.
Figures 5–7 illustrate the electromagnetic response curves of Z-component, Y-component, and X-component, respectively, at different positions. Note that different colors of the response curves in these figures represent different sampling times.
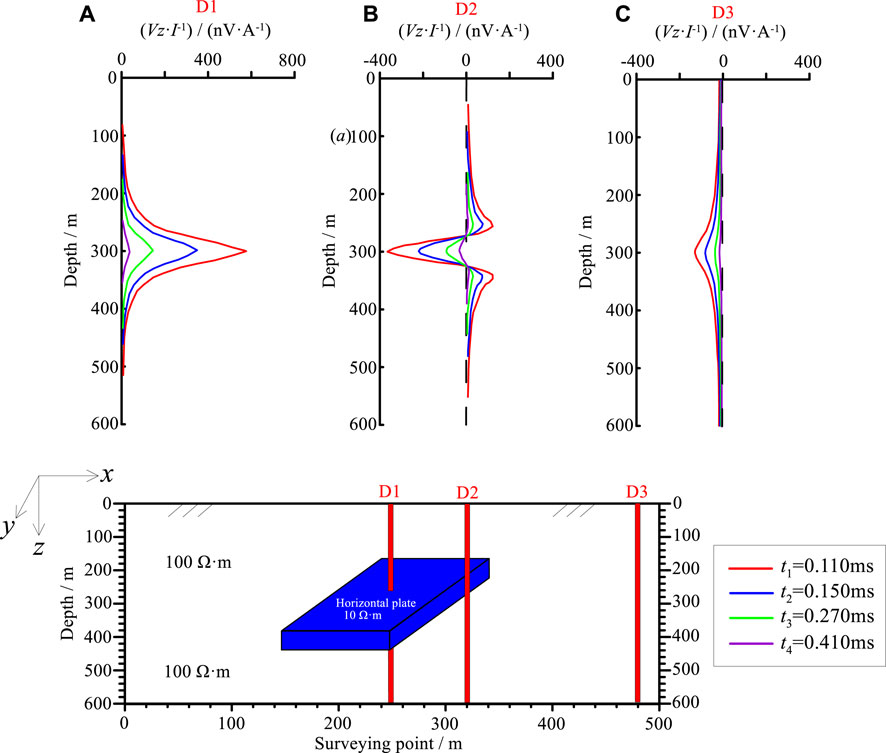
FIGURE 5. Electromagnetic responses of Z component under different offsets. Different colored lines in part labels represent responses at different times.
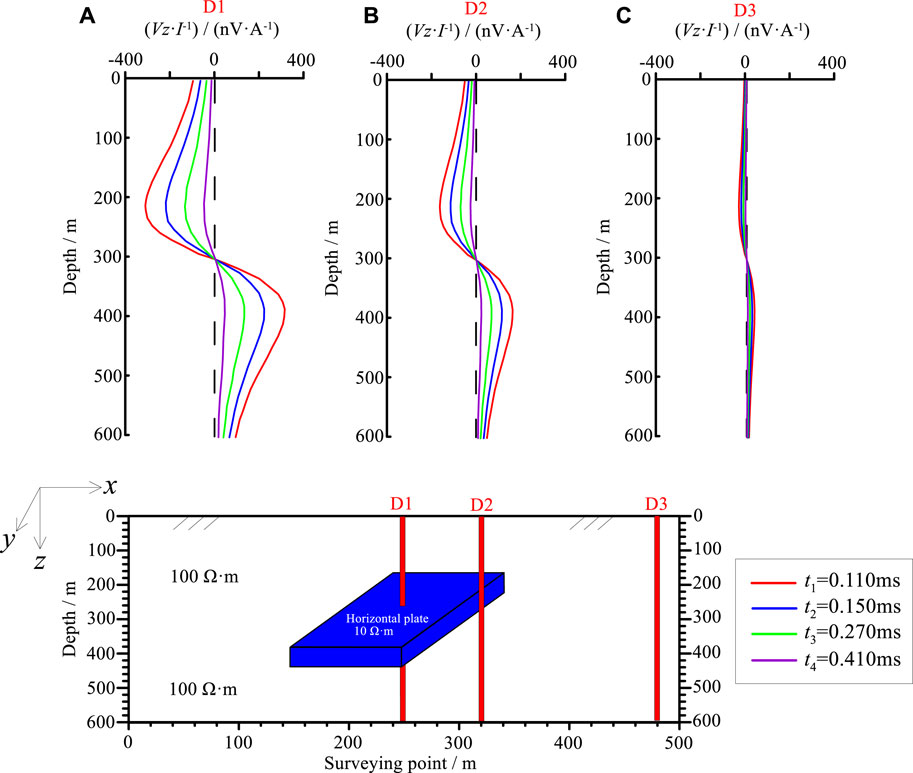
FIGURE 6. Electromagnetic responses of Y component under different offsets. Different colored lines in part labels represent responses at different times.
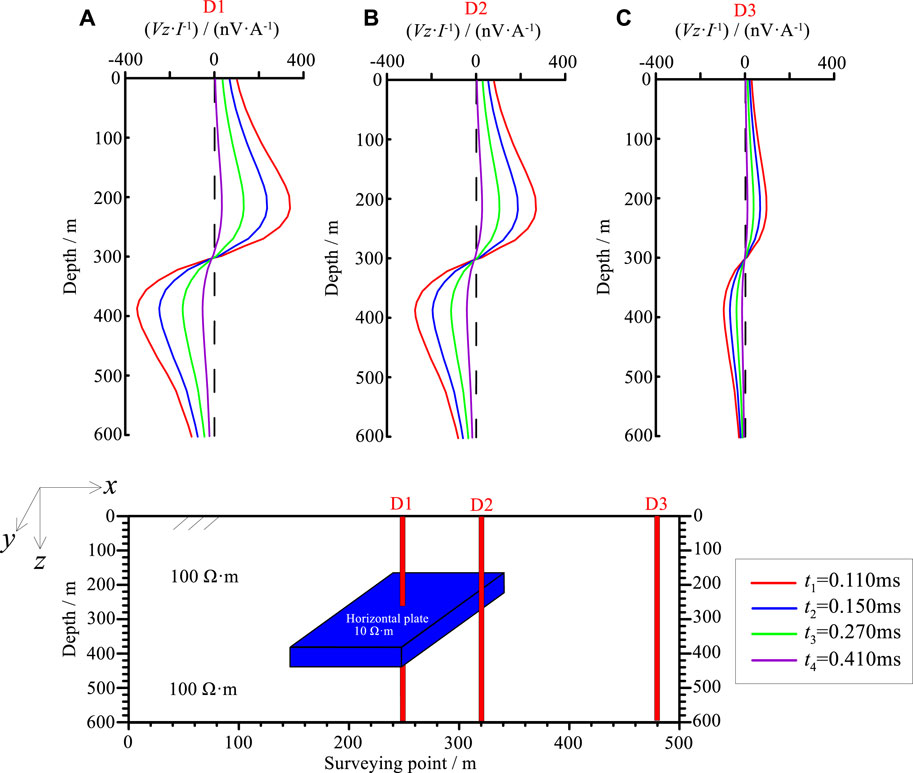
FIGURE 7. Electromagnetic responses of X component under different offsets. Different colored lines in part labels represent responses at different times.
Z-component: When the borehole is drilled through the thin plate, the electromagnetic response generally emerges as a single-peak positive anomaly, with the extreme value appearing near the center of the thin plate (Figure 5A). As the borehole offset increased, three-peak symmetrical positive and negative anomalies (one negative anomaly, two positive anomalies) were generated near the edge of the thin plate. Moreover, the anomaly peak exhibited a negative anomaly, precisely associated with the center of the sheet, located on the side close to the thin plate (Figure 5B). As the borehole offset continued increasing, the amplitude of the electromagnetic response gradually decreased. At the position far from the thin plate, the positive anomaly became nearly zero, and the electromagnetic response revealed a single-peak negative anomaly (Figure 5C).
Y component: In general, the electromagnetic response curves of the Y component are “s-shaped,” while the curves exhibit “double-peak anomaly,” and the positive and negative polarity transitions of the curves correspond to the center of the thin plate. The magnitude of the electromagnetic response curve was large when the borehole passes through the thin plate, indicating that the abnormal features were most dramatic at this location (Figure 6A). As the borehole offset increased, the amplitude of the curve exhibited stronger attenuation, compared to the borehole at the edge of the plate (Figure 6B). As the borehole offset continued increasing, the amplitude of the curve gradually decreased. At certain position, far from the thin plate, the amplitude nearly completely disappeared, showing that the abnormal features caused by the thin plate were not obvious (Figure 6C).
X component: In general, the electromagnetic response curve of the X component is “inverse s-type,” thereby signifying a totally opposite pattern to that of Y component. The curve exhibited a “double-peak anomaly” and the positive and negative polarity transition of the curve was attributed to the center of the thin plate. When the borehole passed through the thin plate, the magnitude of the electromagnetic response curve was large and nearly equal to that of the Y component (Figure 7A). As the borehole offset increased, the amplitude of the curve was slightly attenuated. However, its amplitude was larger than that of the Y component when the borehole was at the edge of the thin plate (Figure 7B). When the borehole offset continued increasing, the amplitude of the curve gradually decreased, showing that the electromagnetic response anomaly caused by thin plate was decreasing accordingly. At this moment, a relatively distinct amplitude was identified at the position far from the thin plate (Figure 7C). The electromagnetic response of the X component was larger than that of the Y component when the borehole was out of the plate. Hence, the decaying speed of the X component electromagnetic response was slower than that of the Y component.
The numerical simulations for electromagnetic response shows that, for a certain scale of low-resistivity horizontal thin plate, the earlier the sampling time is, the greater the amplitude of the abnormal response will be. Moreover, as time passes, the electromagnetic response gradually decays; on the other hand, with the offset between the borehole and the center of the thin plate increasing, the electromagnetic response gradually decreases, and the amplitude of the curve reduces accordingly. Importantly, the ground-borehole TEM is characterized by a high degree of recognition for low-resistivity horizontal thin plate.
The water-bearing coal goaf can be simplified as a low-resistivity thin plate. In this context, it is reasonable to suggest that the ground-borehole TEM can potentially allow the effective detection of the water-bearing coal goaf.
To evaluate the accuracy of ground-borehole TEM for detecting water-bearing coal goaf, we conducted TEM experiments near a working zone of the Tongxin Coal Mine (Shanxi, China).
The Tongxin Coal Mine is located on the northeast edge of the Datong Coalfield of the Shanxi Province, China (Figure 8). The basement stratum in this area is the Jining Formation of upper Archean, and all subsequent layers are successively deposited on this basis (Table 1). The main coal measure stratum of the region is the Permian Shiqianfeng Formation (including coal seams Nos. 3, 8, 9, 11 and 14). At present, coal seam No. 3 is being mined, with the depth of 280–350 m and thickness of 0–8.5 m.
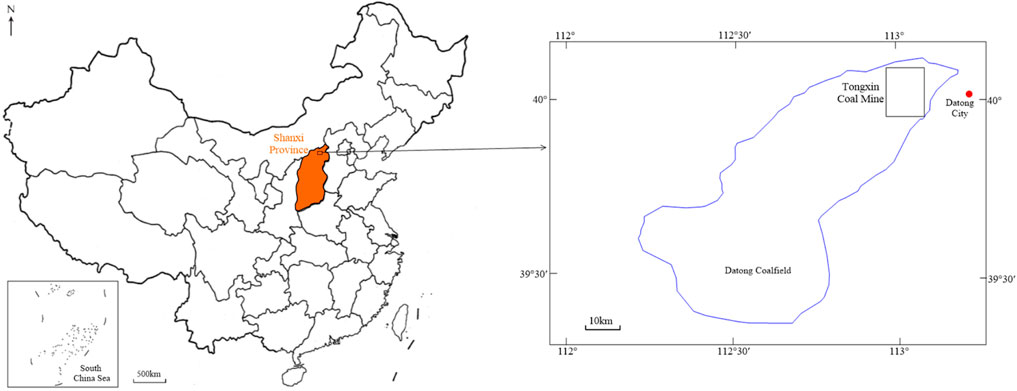
FIGURE 8. Location of Tongxin coal mine.
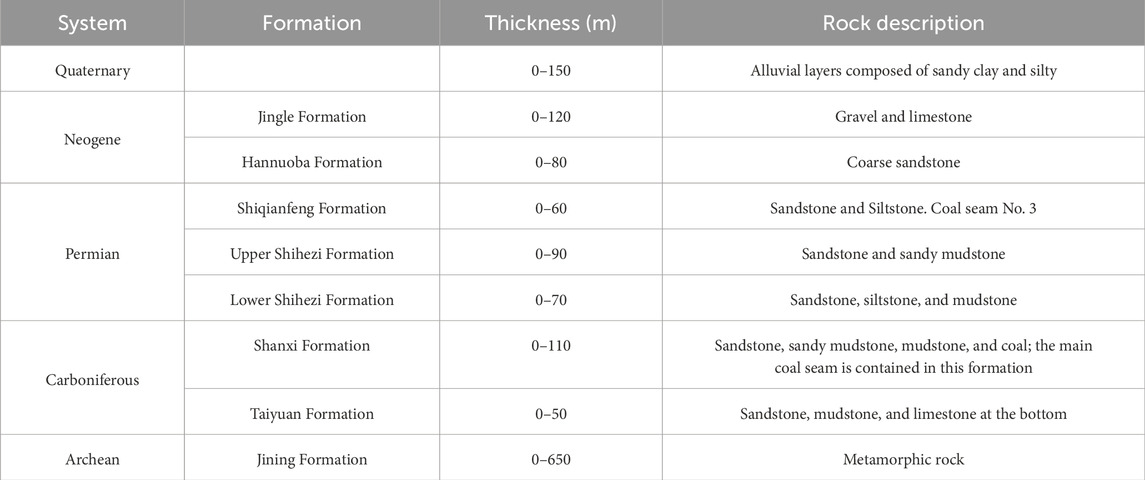
TABLE 1. Generalized stratigraphy of the study area.
The characteristics of the geological data indicate that the Quaternary stratum was 0–250 m, mainly containing sandy clay, silty sand, and sand layers. Moreover, there were gravel and gravel layers containing limestone in the Neogene stratum. The total thickness of the Neogene was estimated to be 0–200 m. Below the Neogene strata, the Permian strata, including Shiqianfeng Formation and some others, and the target coal seam No. 3, were in the Shiqianfeng Formation. Lastly, the lowest part was the Carboniferous coal-bearing strata.
The working procedures are described in detail in this section. First, ground TEM work was carried out in the study area using 18 TEM surveying lines and 1,980 surveying points. The dimensions of the working network was 20 × 20 m, implying that the line distance was 20 m, and the point distance was 20 m (Figure 10). After the inversion of the measured data, the resistivity profile of the testing line (Figure 9) and the resistivity slice map of the No. 3 coal seam, both, were drawn (Figure 10).
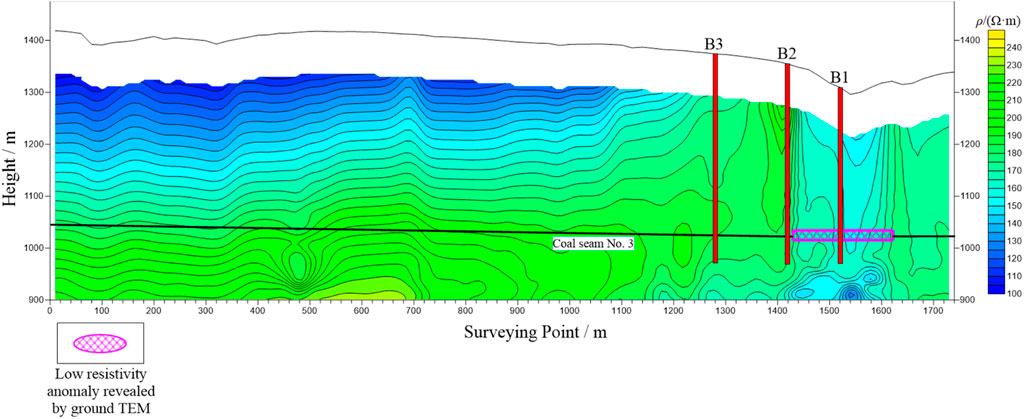
FIGURE 9. Resistivity profile of the testing line.
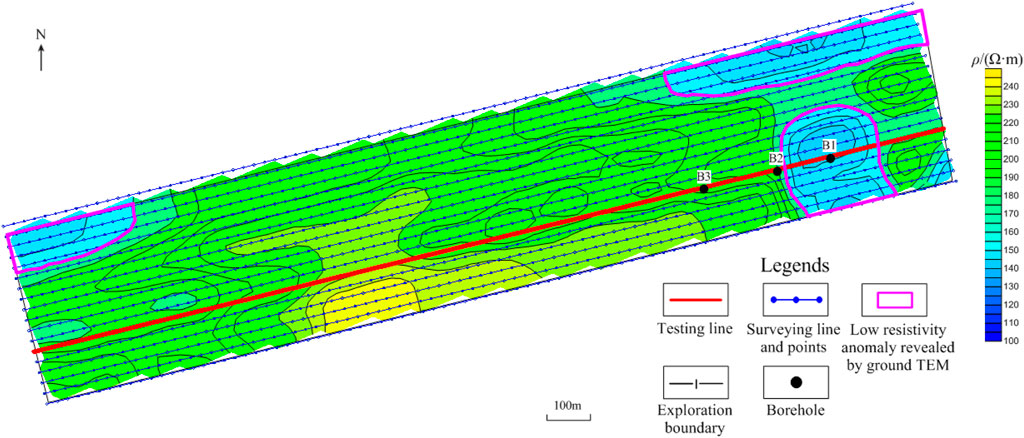
FIGURE 10. Resistivity slice map of the No. 3 coal seam.
Figure 9 shows the resistivity profile of the testing line. As seen, the 1,440–1,620 section, a prominent low-resistivity anomaly near the No. 3 coal seam was identified. The anomaly was signified by the resistivity value of <170 Ω m, as indicated in magenta range of Figure 8. This finding indicates that this section can be inferred as a low-resistivity anomaly area.
Figure 10 demonstrates the resistivity slice map of coal seam No. 3. We combined the resistivity characteristics of the No. 3 coal seam with the resistivity profile of the testing line. The combination yielded the three low-resistivity abnormal areas, as shown in the magenta range of Figure 10. Three boreholes B1, B2, and B3 were arranged near the low-resistivity anomaly area in the southeast of the study area. Interestingly, the borehole data revealed a goaf the B1 borehole, while solid coal was identified at the B2 and B3 boreholes.
Ground-borehole TEM measurements were conducted in boreholes B1, B2, and B3 using the ProTEM system by the receiving probe of BH43 and the measurement distance in the borehole of 1 m. The transmitting device was a square ungrounded loop with a side length of 100 × 100 m.
Figure 11A illustrates the simple filtered electromagnetic response curves for borehole B1. At the depth of 270–320, the X, Y, and Z components exhibited distinct electromagnetic response anomalies. Moreover, the Z component exhibited significant high-value distortion, and the X and Y components showed the polarity changing points near the depth of 285 m. All the electromagnetic responses were generally consistent with the anomalous characteristics of the point in the low-resistivity plate in the numerical simulation (borehole D1 in Figure 3, as described in Section 2.2). This finding confirms that the point was located in the water-bearing coal goaf.
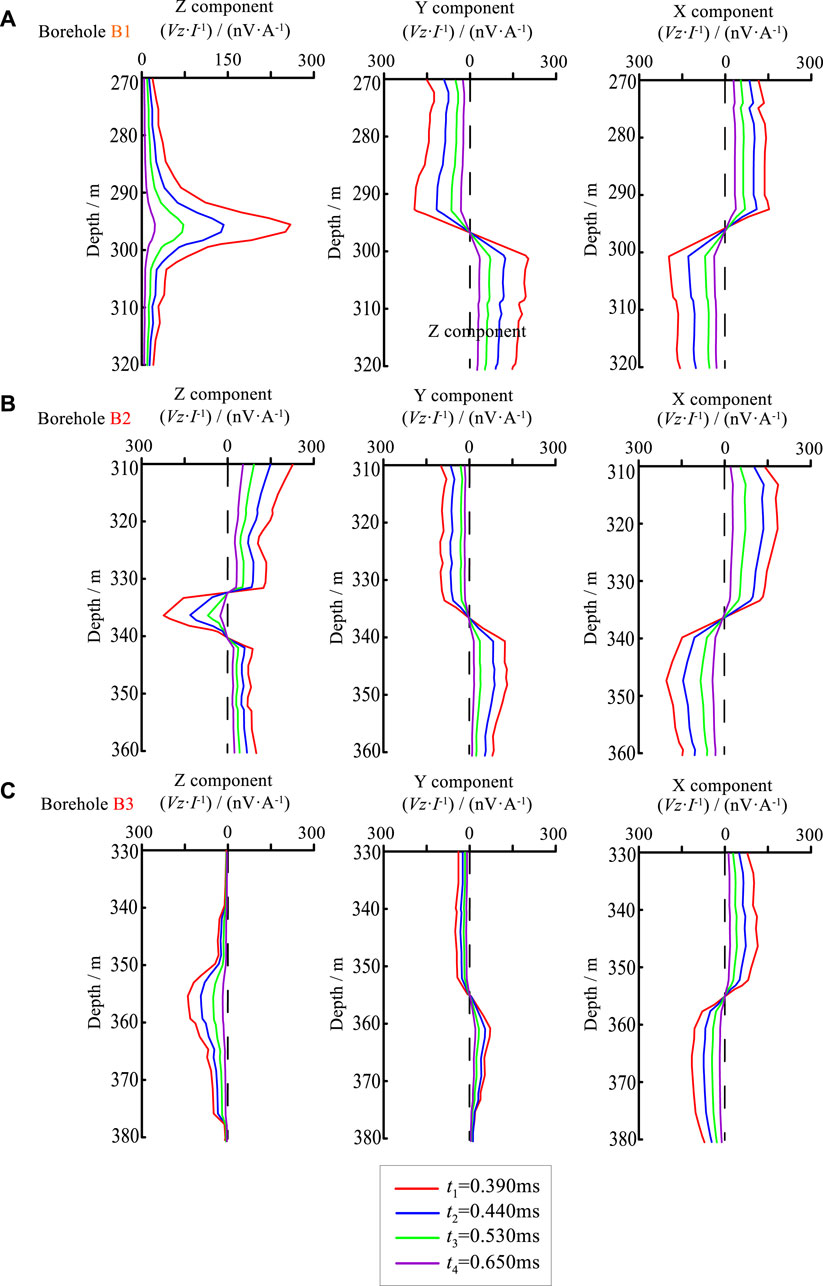
FIGURE 11. Electromagnetic responses of boreholes B1, B2, and B3. Different colored lines in part labels represent responses at different times.
Figure 11B displays the electromagnetic response curves of borehole B2. At the depth of 330–340 m, the X, Y, and Z components exhibited prominent electromagnetic response anomalies. The electromagnetic response of the Z component exhibited a negative extreme value near the depth of 335 m. At the same time, the X and Y components exhibited polarity changing points at this depth. Each component was consistent with the anomalous characteristics of the point on the outer edge of the low-resistivity plate in the numerical simulation (borehole D2 in Figure 3, as described in Section 2.2). This finding points outs that this point was located at the edge of the water-bearing coal goaf.
Figure 11C shows the electromagnetic response curves of borehole B3. At the depth of 350–360 m, the X, Y, and Z components somewhat experienced electromagnetic response anomalies. In particular, the Z component exhibited a small magnitude of negative electromagnetic response, and the X and Y components both exhibited a polarity changing point near the depth of 355 m. This finding is in line with the anomalous characteristics of the point far away from the low-resistivity plate (borehole D3 in Figure 3, as described in Section 2.2) in numerical simulation, thereby confirming that this point was out of the goaf and was, therefore, less affected.
Numerous studies have previously exerted substantial efforts to explore the principle and inversion problem of ground TEM (Hou and Xu, 2013; Li et al., 2015; Li et al., 2016; Chen et al., 2017; Yang et al., 2018; Zhou et al., 2018; Yang et al., 2022). Essentially, the ground TEM can accurately delineate the horizontal distribution range of the water-bearing coal goaf, thereby ensuring the safe production of coal mines. However, the detection accuracy of the ground TEM in the vertical direction needs to be improved.
We used the numerical simulations and demonstrated that the ground-borehole TEM is advantageous, compared to the ground TEM.
Simulations of low-resistivity thin plate model showed that the electromagnetic response curves of the X, Y, and Z components of the ground-borehole TEM were complex. Moreover, the signal of the vertical component (Z component) was stronger than that of the horizontal components (X and Y components), and the electromagnetic response amplitude of the Z component of the same surveying point was stronger than that of the X and Y components.
The ground-borehole TEM detection analysis indicated that the electromagnetic response curves of different time channels yield different shapes. Namely, the longer the sampling time, the weaker the electromagnetic response. However, as the sampling time increases, the attenuation of the Z component dwindles below that of the X and Y components, and the attenuation of X component is, therefore, smaller than that of the Y component.
The electromagnetic response of the ground-borehole TEM stands out with a high vertical resolution, which allows effective description of the changes of the layers in the vertical direction. The extreme points of the Z component, as well as the positive-negative polarity changing points of the X and Y components, can be used to identify the interface where the physical properties experienced significant alternations. Given this advantageous feature, the ground-borehole TEM can effectively identify low-resistivity thin plates such as water-bearing coal goaf in the vertical direction. This, in turn, alleviates the existing state-of-the-art shortcomings of ground TEM.
This study used numerical simulations for ground-borehole TEM response of the low-resistivity thin plate. Some conclusions can be drawn:
(1) Under the same transmitting and receiving conditions, the abnormal response characteristics of the three components (X, Y, and Z components) of the ground-borehole TEM are highly correlated with the position relationship of the anomalous body. Simultaneous observation of the three components in practical work will help to infer and interpret the anomalous location near the well.
(2) By analyzing the characteristics and amplitude of the anomaly response curve of the horizontal component, the approximate orientation of the anomaly center can be inferred. If the curved line is “S-type”, the anomaly center is located on the positive side of the component; if the curve is of the “inverse S-type”, it is located on the negative side of the component.
(3) The vertical component anomaly response curve can reflect the distance between the anomaly center and the borehole, and the borehole passes through the middle of the anomaly, and the vertical component anomaly curve is a positive anomaly; After passing through the edge of anomalous body, the trace reflected as positive anomaly in early stage and negative anomaly in middle and late stage. The anomaly curve is negative, and the anomaly half width is equal to the distance between the anomaly body and the borehole.
(4) The characteristics of ground-borehole TEM response are very complex, and the root cause of the change of response characteristics can be clearly understood by analyzing the coupling relationship between the primary field and the conductor. Therefore, the use of the primary field distribution diagram is helpful for the inference and interpretation of the complex model.
The original contributions presented in the study are included in the article/Supplementary material, further inquiries can be directed to the corresponding author.
YY: Conceptualization, Writing–original draft, Writing–review and editing. SP: Data curation, Formal analysis, Writing–original draft, Writing–review and editing. HS: Supervision, Writing–original draft, Writing–review and editing. QP: Writing–original draft, Writing–review and editing.
The author(s) declare financial support was received for the research, authorship, and/or publication of this article. This research is supported by the National Natural Science Foundation of China (Nos. 41877194, 41502232, and 42062015) and the Natural Science Foundation of Guangxi (No. 2018AD19204).
We gratefully acknowledge the Editors and Reviewers for providing thoughtful and useful suggestions.
The authors declare that the research was conducted in the absence of any commercial or financial relationships that could be construed as a potential conflict of interest.
All claims expressed in this article are solely those of the authors and do not necessarily represent those of their affiliated organizations, or those of the publisher, the editors and the reviewers. Any product that may be evaluated in this article, or claim that may be made by its manufacturer, is not guaranteed or endorsed by the publisher.
Bai, B. (2022). Special issue on advances in soil pollution and the geotechnical environment. Appl. Sci. 12, 12000. doi:10.3390/app122312000
Bai, B., Nie, Q., Zhang, Y., Wang, X., and Hu, W. (2021). Cotransport of heavy metals and SiO2 particles at different temperatures by seepage. J. Hydrology 597, 125771. doi:10.1016/j.jhydrol.2020.125771
Bai, B., Rao, D., Chang, T., and Guo, Z. (2019). A nonlinear attachment-detachment model with adsorption hysteresis for suspension-colloidal transport in porous media. J. Hydrology 578, 124080. doi:10.1016/j.jhydrol.2019.124080
Bai, B., Zhang, J., Liu, L., and Ji, Y. (2020). The deposition characteristics of coupled lead ions and suspended silicon powders along the migration distance in water seepage. Transp. Porous Media 134 (3), 707–724. doi:10.1007/s11242-020-01464-3
Ben, P. (2000). The role of borehole EM in the discovery and definition of the Kelly Lake Ni-Cu deposit, Sudbury, Canada. Seg. Tech. Program Expand. Abstr. 19 (1), 1063–1066.
Chen, W., Li, H., and Xue, G. (2017). 1D OCCAM inversion of SOTEM data and its application to 3D models. Chin. J. Geophys 60, 3667–3676.
Cheng, J., Pan, D., Li, W., Liu, S., Wang, Y., and Jiang, G. (2010). Study on the detecting of hazard abandoned workings by ground penetrating radar on strong electromagnetic interference area. J. China Coal Soc. 35, 227–231.
Cui, H., Shen, J., Ran, S., and Zhou, J. (2022). Application of 2D inversion of transient electromagnetic response and water bearing area detection in coal mine tunnel based on finite volume method. J. Jilin Univ. Earth Sci. Ed., 1–14. doi:10.13278/j.cnki.jjuese.20210241
Ezersky, M., Legchenko, A., Al-Zoubi, A., Levi, E., Akkawi, E., and Chalikakis, K. (2011). TEM study of the geoelectrical structure and groundwater salinity of the Nahal Hever sinkhole site, Dead Sea shore, Israel. J. Appl. Geophys. 75, 99–112. doi:10.1016/j.jappgeo.2011.06.011
Hou, Y., and Xu, Y. (2013). The effect of the transient electromagnetic method in detecting deep water-rich area under low resistivity layer. Phys. Geochem. Explor. 37, 715–719.
King, A. (1996). Deep drillhole electromagnetic surveys for nickel/copper sulphides at Sudbury, Canada. Explor. Geophys. 27 (3), 105–118. doi:10.1071/eg996105
Klotzsche, A., Vereecken, H., and Kruk, J. (2019). GPR full-waveform inversion of a variably saturated soil-aquifer system. J. Appl. Geophys. 170, 103823. doi:10.1016/j.jappgeo.2019.103823
Lei, X., Li, Z., and Ze, J. (2009). Applications and research of the high resolution resistance method in exploration of caves. Mined Regions Karst Region Process Geophys. (in Chinese) 24 (1), 340–347.
Li, H., Xue, G., Zhao, P., Zhou, N., and Zhong, H. (2016). Inversion of arbitrary segmented loop source TEM data over a layered earth. Journal of Applied Geophysics 128, 87–95. doi:10.1016/j.jappgeo.2016.03.017
Li, H., Xue, G., Zhou, N., and Chen, W. (2015). Appraisal of an array TEM method in detecting a mined-out area beneath a conductive layer. Pure and Applied Geophysics 172 (10), 2917–2929. doi:10.1007/s00024-015-1075-0
Liao, Z., Zhou, Z., and Zhang, Y. (2002). Stable implementation of transmitting boundary in numerical simulation of wave motion. Chinese Journal of Geophysics (in Chinese) 45 (04), 533–545.
Liu, J., Luo, X., and Tong, X. (2012). Joint analysis of Eh4 data in time-frequency domain and application in gob areas of coalmine. Process in Geophysics 27 (5), 2160–2167. doi:10.6038/j.Issn.1004-2903.2012.05.042
Meng, Q., and Pan, H. (2012). Numerical simulation analysis of surface-hole tem responses. Chinese Journal of Geophysics 55 (3), 1046–1053.
Ozkaya, U., Ozturk, S., Melgani, F., and Seyfi, L. (2021). Residual CNN+Bi-lstm model to analyze GPR B-scan images. Automation in Construction 123, 103525. doi:10.1016/j.autcon.2020.103525
Spicer, B. (2016). Geophysical signature of the victoria property, vectoring toward deep mineralization in the Sudbury basin. Interpretation 4 (3), 281–290. doi:10.1190/int-2014-0190.1
Wang, C., Zhao, Y., and Jin, H. (1998). Seismic tomography and its application to the investigation of buried worked-out area. Acta Geophysics Sinica (in Chinese) 41 (s1), 367–375.
Wei, H., Cha, W., and Feng, C. (2014). Analysis of characteristics of seismic section in goaf area. Progress in Geophysics (in Chinese) 29 (4), 1808–1814. doi:10.6038/pg20140443
Wu, J., Li, X., and Zhi, Q. (2017). Analysis of three component tem response characteristic of electric source dill hole TEM. Process in Geophysics 32 (3), 1273–1278.
Xu, Z., Yang, H., and Deng, J. (2015). Research on forward simulation of down-hole TEM based on the abnormal field. Geophysical and Geochemical Exploration 39 (6), 1176–1182.
Xue, G., and Yu, J. (2017). New development of TEM research and application in coal mine exploration. Progress in Geophysics 32, 319–326.
Yang, D., and Oldenburg, D. (2012). Three-dimensional inversion of airborne time-domain electromagnetic data with applications to a porphyry deposit. Geophysics 77, B23–B34. doi:10.1190/geo2011-0194.1
Yang, H., Li, F., Chen, S., Yue, J. H., Guo, F. S., Chen, X., et al. (2018). An inversion of transient electromagnetic data from a conical source. Applied Geophysics 15, 545–555. doi:10.1007/S11770-018-0691-8
Yang, Y., Xiong, B., Peng, S., Liu, S., Chen, H., and Zhang, T. (2022). Transient electromagnetic characteristics of coal seams intruded by magmatic rocks. PLoS ONE 17, e0263293. doi:10.1371/journal.pone.0263293
Zhang, J., Deng, X., and Tan, H. (2015). A study of vector interaction for borehole transmission transmission method. Geophysical and Geochemical Exploration 39, 572–579.
Zhang, J., Wang, X., and Deng, X. (2014). Borehole tem responses characteristics of the borehole-side plate-like conductor. Computing Technologies for Geophysical and Geochemical Exploration 36, 641–648.
Keywords: ground-borehole transient electromagnetic method, coal goaf, numerical simulation, resolution, geophysical exploration
Citation: Yang Y, Peng S, Shan H and Peng Q (2024) Numerical simulation of water-bearing coal goaf using ground-borehole TEM—a case study of Tongxin Coal Mine, Shanxi Provice, China. Front. Earth Sci. 12:1289469. doi: 10.3389/feart.2024.1289469
Received: 06 September 2023; Accepted: 29 January 2024;
Published: 08 February 2024.
Edited by:
Saulo Oliveira, Federal University of Paraná, BrazilReviewed by:
Bing Bai, Beijing Jiaotong University, ChinaCopyright © 2024 Yang, Peng, Shan and Peng. This is an open-access article distributed under the terms of the Creative Commons Attribution License (CC BY). The use, distribution or reproduction in other forums is permitted, provided the original author(s) and the copyright owner(s) are credited and that the original publication in this journal is cited, in accordance with accepted academic practice. No use, distribution or reproduction is permitted which does not comply with these terms.
*Correspondence: Huimei Shan, c2hhbmh1aW1laUBnbHV0LmVkdS5jbg==
Disclaimer: All claims expressed in this article are solely those of the authors and do not necessarily represent those of their affiliated organizations, or those of the publisher, the editors and the reviewers. Any product that may be evaluated in this article or claim that may be made by its manufacturer is not guaranteed or endorsed by the publisher.
Research integrity at Frontiers
Learn more about the work of our research integrity team to safeguard the quality of each article we publish.