 Sandrine Ritter
 Attila Balázs
 Julia Ribeiro
 Taras Gerya
94% of researchers rate our articles as excellent or good
Learn more about the work of our research integrity team to safeguard the quality of each article we publish.
Find out more
ORIGINAL RESEARCH article
Front. Earth Sci., 15 February 2024
Sec. Solid Earth Geophysics
Volume 12 - 2024 | https://doi.org/10.3389/feart.2024.1286468
Understanding the formation of new subduction zones is important because they have been proposed as the main driving mechanism for plate tectonics and they are crucial for geochemical cycles on Earth. However, the conditions needed to facilitate subduction zone initiation and the associated magmatic evolution are still poorly understood. Using a natural case study, we conducted a series of high-resolution 2D petrological-thermomechanical (i2VIS) subduction models assuming visco-plastic rheology. We aim to model the initiation and early stage of an intra-oceanic subduction zone connected to the gravitational collapse of a weak transform zone and compare it to the natural example of the Izu-Bonin-Mariana subduction zone. We also analysed the influence of low convergence rates on magmatic evolution. We propose a viable transition from initiation to mature subduction zone divided into distinct stages that include initiation by gravitational collapse of the subducting slab, development of a near-trench spreading centre, gradual build-up of asthenospheric mantle return flow, and maturation of a volcanic arc. We further show that mantle flow variations and shear instabilities, producing thermal perturbations and depleted interlayers, influence the temporal and spatial distribution of asthenospheric mantle composition and fertility in the mantle wedge. Our modelling results are in good agreement with geological and geochemical observations of the early stages of the Izu-Bonin-Mariana subduction zone.
Subduction is proposed to be a main driving mechanism for plate tectonics, a key process for the geochemical cycle, and crucial for the evolution of life (Forsyth and Uyeda, 1975; Zhong and Gurnis, 1995; Stern, 2002; Grove et al., 2012; Stern and Gerya, 2018). Our current understanding of subduction zones is based on rock samples, direct geological and geophysical observations and numerical modelling (e.g., Stern and Gerya, 2018). Our knowledge is mainly focused on the mature stage of subduction zones. However, subduction initiation and the processes that lead to their maturation are still highly debated. The main reasons are the limited possibilities for directly observing and sampling of an active incipient oceanic subduction zone (e.g., Stern et al., 2012). Rock samples presumably formed during the juvenile stage of an active subduction zone are mostly eroded or subducted (e.g., Reagan et al., 2010; Reagan et al., 2017; Reagan et al., 2019). Conceptual models of subduction zone initiation (SI) have been proposed integrating available geophysical, petrological and geochemical data (e.g., Stern and Gerya, 2018; Maunder et al., 2020). Two main categories are suggested (e.g., Stern, 2004; Stern and Gerya, 2018): induced (horizontally forced) (e.g., Gurnis et al., 2004) and spontaneous (vertically forced) subduction initiation for which several different mechanisms are proposed (c.f. Toth and Gurnis, 1998; Thielmann and Kaus, 2012; Crameri et al., 2020; Lallemand and Arcay, 2021). The former mode develops in a convergent system in which either one or both plates are pushed laterally towards each other. In the case of a spontaneous SI, the process is solely driven by buoyancy force differences (i.e., vertically forced), such as crustal loading (e.g., Erickson, 1993), the thermal gradient between two juxtaposed plates (e.g., Matsumoto and Tomoda, 1983; Stern and Bloomer, 1992; Hall et al., 2003; Nikolaeva et al., 2008; 2010; Leng and Gurnis, 2015; Baes and Sobolev, 2017) or plume penetration through the lithosphere (e.g., Cloetingh et al., 1982; Ueda et al., 2008). The concept of spontaneous subduction initiation (SI) has been tested with various analogue and numerical models (e.g., Mart et al., 2005; Arcay et al., 2020; Maunder et al., 2020; Lallemand and Arcay, 2021; Zhou and Wada, 2021). However, most numerical studies show that rather rare geodynamical conditions should be fulfilled for spontaneous subduction initiation, which are scarcely satisfied in modern plate tectonics (e.g., Nikolaeva et al., 2010; Nikolaeva et al., 2011; Arcay et al., 2020; Crameri et al., 2020; Lallemand and Arcay, 2021). Numerical models further show the importance of weakened lithosphere to permit subduction initiation, such as subduction-transform edge propagator (STEP) faults (e.g., Baes et al., 2011; Nijholt and Govers, 2015) or transform fault zones (e.g., Maunder et al., 2020; Zhou and Wada, 2022). While STEP faults are associated with a pre-existing subduction zone, the initiation of subduction at transform fault zones is not predetermined in the convergence setting.
During subduction, surface rocks penetrate into the asthenospheric mantle as one oceanic plate dives underneath the other, warm up and dehydrate. Intra-slab water carried as molecular water in pore fluids or incorporated into bounded minerals as hydroxyl in the slab plays an important role and contributes to forearc mantle hydration and subsequent fore-arc serpentinization at shallower depths (e.g., Hyndman and Peacock, 2003), subduction-related seismicity and arc magmatism at greater depths (Iwamori, 1998; Schmidt and Poli, 1998; Rüpke et al., 2004; Zheng and Hermann, 2014). Slab dehydration at sub-arc depths triggers melting of the overlying asthenospheric mantle by lowering the liquidus temperature, causing arc volcanism (Reagan et al., 2010; Ishizuka et al., 2011a). This fluid-induced melting process is often referred to as subduction flux melting (SFM) - the term we will use in this paper. A back-arc spreading centre can be formed by overriding plate extension and crustal thinning driven by slab roll-back. This produces adiabatic decompression mantle melts. During trench retreat, flux and decompression mantle melts can be mixed in the back-arc region (Corradino et al., 2022). Decompression mantle melting and SFM modify the regional abundance of compatible and incompatible elements in the mantle resulting in a shift from a relatively fertile (i.e., enriched in incompatible elements) to a relatively depleted mantle composition (McCulloch and Gamble, 1991; Grove et al., 2012; Zheng, 2019; Tucker et al., 2020). As the SFM evolves deeper and ascends through the mantle wedge, magma mixing with other melt sources, such as decompression melts from the back-arc spreading, can occur. As SFM reaches the surface, arc volcanoes are formed (e.g., Stern, 2002; Kelley et al., 2006; Grove et al., 2012).
One ideal natural laboratory for studying intra-oceanic subduction initiation is the Izu-Bonin-Mariana (IBM) subduction zone. The rock record that has been emplaced during subduction inception has been preserved in the IBM fore-arc (e.g., Ishizuka et al., 2006; Reagan et al., 2010; Ishizuka et al., 2011a; Stern et al., 2012; Reagan et al., 2019; Ribeiro et al., 2020; Ribeiro et al., 2022; Reagan et al., 2023). This intra-oceanic plate boundary is located in the Western Pacific, where mid-Jurassic to Early Cretaceous oceanic floor from the Pacific plate gets subducted underneath the Philippine Plate (Figure 1) (Stern, 2004). Due to the slab geometry, the IBM is separated into the Izu-Bonin segment to the north and the Mariana segment to the south. The Izu-Bonin segment reaches 660 km depth and bends onto the 660 km discontinuity (e.g., Fukao and Obayashi, 2013). The Mariana slab segment is only connected with the Izu-Bonin segment at a depth of 300–400 km and enters the lower mantle (e.g., Wu et al., 2016). The oldest rock found at IBM are fore-arc basalts (FABs) and are dated back to 51.34 ± 0.78 Ma (Reagan et al., 2019). They formed at 52 to 48 Ma (Cosca et al., 1998; Reagan et al., 2010; Reagan et al., 2017; Reagan et al., 2019; Ribeiro et al., 2022). Fore-arc basalts have low abundances in fluid-mobile elements and in water, and they exhibit similar geochemical trends as mid-ocean ridge basalts. Because of this similarity, FABs are assumed to be generated from decompression mantle melting in a presumably extensional regime just above the nascent Pacific slab which dehydrated a little during subduction inception (Stern and Bloomer, 1992; Reagan et al., 2010; Reagan et al., 2019; Ribeiro et al., 2022). As the incipient slab continues descending, FABs are rapidly followed by boninites which are generated from an increasingly depleted harzburgitic mantle source that was metasomatized by the slab fluids (Stern and Bloomer, 1992; Reagan et al., 2010; Resing et al., 2011; Li et al., 2019; Reagan et al., 2019; Ribeiro et al., 2022). Sediments were proposed to be first accreted, and they began to be subducted at about 48 Ma (Li et al., 2019). An infant arc formed at 45–41 Ma and reached maturation at about 40 Ma (Ishizuka et al., 2011a; Reagan et al., 2019; Ribeiro et al., 2022). Geochemical markers suggest that the slab derived fluid addition peaks during the boninite formation (Reagan et al., 2010; 2019; Ribeiro et al., 2022). Rocks with a similar geochemical signature to FAB were also found in the back-arc basin of IBM (Hickey-Vargas et al., 2018). We will refer to this kind of rocks in our models as back-arc-basalts (BAB).
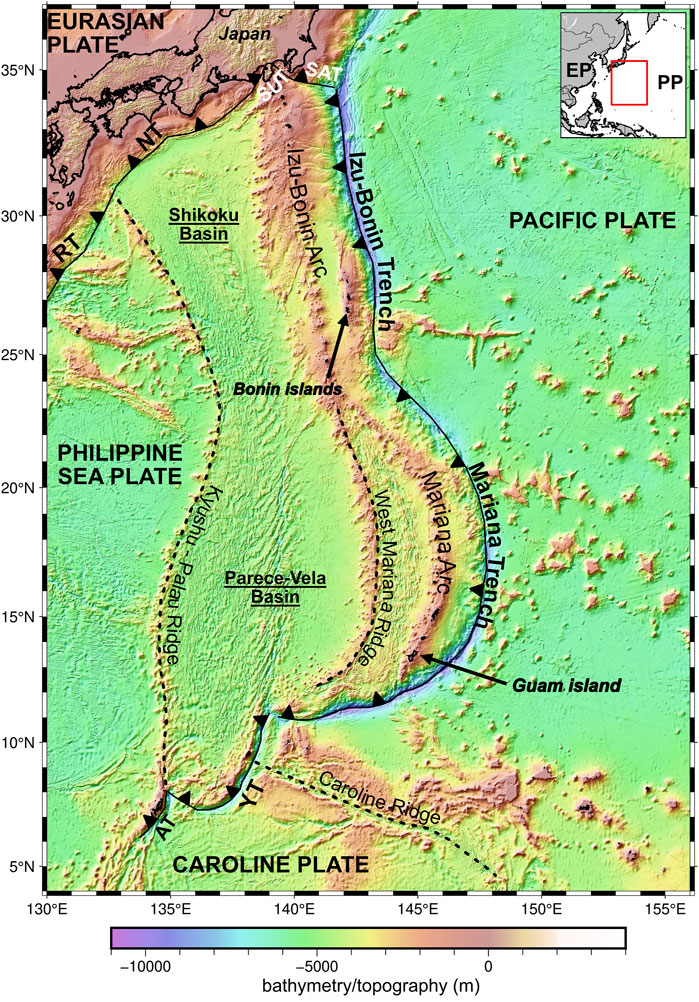
FIGURE 1. Map of IBM subduction zone. AT = Ayu through, EP = Eurasian Plate, NT = Nankai trench, PP = Pacific Plate, RT = Ryukyu trench, SAT = Sagami through, SUT = Suruga through, YT = Yap trench, map is made by PyGMT.
Only a few numerical studies of fluid- and melt-induced tectono-magmatic processes associated with the earliest stages of intra-oceanic subduction initiation have been carried out so far (e.g., Nikolaeva et al., 2008; Maunder et al., 2020). The evolution and initiation of the IBM have been addressed by recent studies, and different driving forces have been proposed, including horizontal forcing or pure vertical transform collapse (c.f. Maunder et al., 2020; Lallemand and Arcay, 2021). Most of these previous studies focus on the end member models of spontaneous or forced subduction initiation, or on processes occurring during subduction maturity. However, the interaction between horizontal and vertical forcing needs to be further explored. Our study is in first order not site-specific, however we are linking and comparing our model to the natural case study of the IBM subduction zone as the data abundance, such as the preserved rock record, is well established. In this study, we present regional-scale 2D high resolution petrological-thermomechanical models that simulate intra-oceanic subduction initiation across a weak zone (WZ). The aim of this study is to better understand the processes that modulate the juvenile stages of subduction, including the stages of partial melting and the evolution of volcanism, and their links to the kinematics, thermal structure, composition and geometry of the transform fault zone and oceanic plates. We particularly aim to assess the controls of plate convergence on transform collapse, magmatism and the evolution of juvenile subduction zones, such as the IBM case.
All models were performed using the petrological-thermo-mechanical code I2VIS (Gerya and Yuen, 2003; Gerya and Yuen, 2007). The setup is inspired by previous studies (e.g., Gerya et al., 2008; Maunder et al., 2020). The code is based on finite-differences and marker-in-cell methods. It solves the mass, energy and momentum conservation equations on an Eulerian frame. Physical properties are transported by Lagrangian markers. We specify here the most important processes for the presented subduction models. A more detailed description of the numerical approach can be found in Gorczyk et al. (2007); Vogt et al. (2012) and in the Supporting Material file A and B.
Hydration and partial melting processes follow previous parametrization presented in, e.g., Baitsch-Ghirardello et al. (2014). Details about the implementation of hydration processes are provided in previous studies (Faccenda et al., 2009; Gerya and Meilick, 2011). The (de)hydration model is linked with a precomputed thermodynamic database (Connolly, 2005; Gerya et al., 2006). However, reactions below 300°C are excluded. Therefore, a linear decrease of connate water content is approximated from the surface to 75 km depth for the upper oceanic crust and sediments (Eq. 1).
where
where vx,water and vy,water are the velocity components of the fluid markers, vy,percolation the reference percolation velocity and kx and ky (non-dimensional constants, Eq. 3) are given by:
where ρcrust, ρfluid are the reference crustal and fluid densities (ρcrust = 2,300 kg/m3 and ρfluid= 1,000 kg/m3, respectively). gy is the gravity acceleration for Earth in y-direction. The upper limit for kx and ky is set to 2. The density of the mantle is linked with the amount of dehydration whereas the density of crustal rocks is independent on the dehydration. Thereby, the hydrated rock density is reduced depending on the amount of water traced by the rock markers.
Following previous models (e.g., Gerya et al., 2008; Nikolaeva et al., 2008; Nikolaeva et al., 2010; Nikolaeva et al., 2011), it is assumed that the degree of both hydrous and dry melting is a function of pressure and temperature (e.g., Gerya and Yuen, 2007). The ascent of melt is simulated by extracting all melts (based on Eq. 4) (Katz et al., 2003; Vogt et al., 2012). The mantle solidus lies between the wet and dry peridotite solidi and the degree of melting of the mantle is computed with the model of Katz et al. (2003) based on local P, T and H2O content. The standard (i.e., without melt extraction) volumetric degree of melting (M0) of oceanic crust and sediments in the model is computed with simplified linear melting approach.
with Tsolidus and Tliquidus being the solidus respectively liquidus temperature (Vogt et al., 2012). The amount of melt extracted within the simulation is defined on markers. The total amount of extracted melt M is given by Eq. 5.
where ∑nMext is the amount of extracted melt from the previous n extraction episodes. At each time step the model tests if melt will be extracted. If ∑nMext > M0 the rock has a higher melt temperature than the current and is then considered as a non-molten rock (i.e., refractory). However, if M exceeds a certain threshold Mmax (Mmax = 4%), Mext = M - Mmin is extracted, where Mmin defines the minimum residual amount of melt which cannot be extracted (Mmin = 2%). After this calculation ∑nMext is updated. The extracted melt (Mext) is assumed to propagate vertically to the surface to create new volcanic and plutonic crust in which the volume and composition of the source melt are preserved.
By using the sediment transport equation (Eq. 6) for the internal erosion/sedimentation surface, approximated by the a sticky air approach (cf., Crameri et al., 2012), erosion and sedimentation are simulated (Gorczyk et al., 2007):
where yes is a function of the horizontal distance and defines the vertical position of the Earth’s surface, vy and vx are the corresponding vertical and horizontal velocities of the velocity vector. vs is the sedimentation rate and ve the erosion rate. The topography (i.e., the interface between ocean and crust) is initially defined 11 km from the upper model boundary and can evolve through the model evolution. At this level, low rates are implemented differently, depending if the marker is situated above (Eq. 7).
or below (i.e., in the ocean, comparable with natural pelagic environments characterized by low sedimentation rate, Eqs 8, 9; e.g., Dutkiewicz et al., 2016).
Since the topography is not uniform, erosion/sedimentation rate are adapted for regions with increased steepness (
The 2D model is defined on a rectangular non-uniform grid of 1,000 x 3,000 km resolved by 1,261 x 311 nodes on which ca. 4.6 million markers are randomly distributed (Figure 2A). A 1 km resolution is set in a 1,000 km wide domain covering the subduction interface. With increasing depth and at the sides of the model, the resolution is coarsened to 10 km. The thermal boundaries are set to 0°C at the top, no heat flux (δT/δx = 0) at the sides and constant 1794°C at the lower boundary. The mechanical boundary conditions are free slip for all sides. Furthermore, a 7 km low viscosity (1018 Pa s), low density (1 kg/m3) sticky air layer (Crameri et al., 2012) with a heat capacity of 3.33 × 10⁶ J/kg is defined on top of the model. The sticky air layer is underlain by a 3 km low viscosity (1018 Pa s), low density (1,000 kg/m3) sticky water layer (Crameri et al., 2012) with a heat capacity of 3.33 × 10³ J/kg to account for an inter-oceanic geological setting. Both uppermost layers enables accurate topographic evolution. For all models, the evolution starts with two juxtaposed oceanic plates of different ages. The age of the older, subducting plate varies between 30 and 60 Myr whereas the age of the younger, overriding plate varies between 1 and 10 Myr (Table 1). The temperature gradient in the oceanic plates has been defined according to a half-space cooling model (Parsons and Sclater, 1977). The asthenospheric mantle temperatures are defined based on an adiabatic gradient of 0.5°C/km.
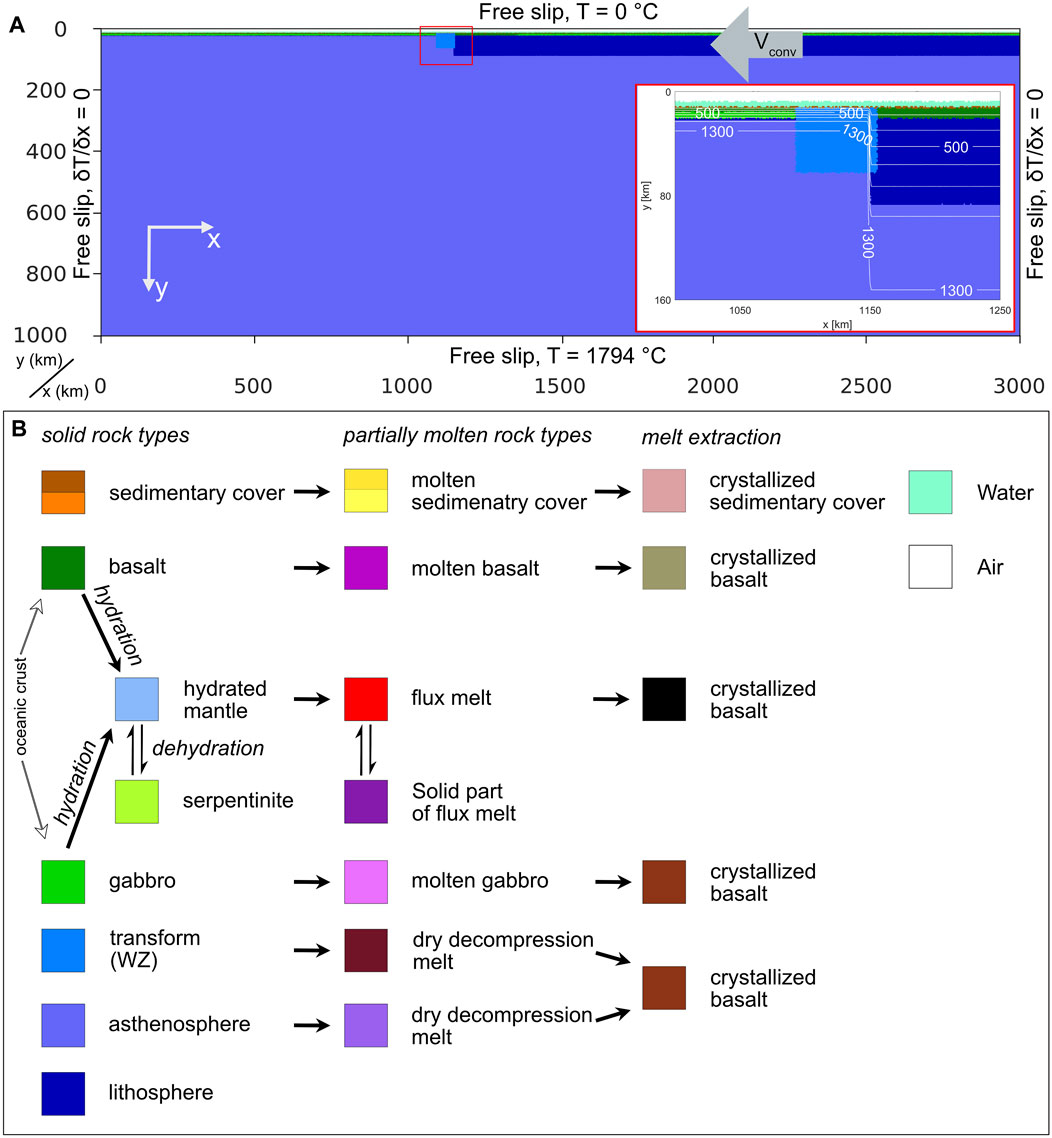
FIGURE 2. Initial configuration of the model, vconv = initial convergence velocity implemented within the old subducting plate (grey arrow), red rectangle defined the zoomed area. All rock compositions that can occur during the model evolution are coded with a specific colour which is shown in (B). Note that not all colours are visible in (A) but in later stages (Figure 3; Figure 4; Figure 6; Figure 7; Figures 8; Figure 10).
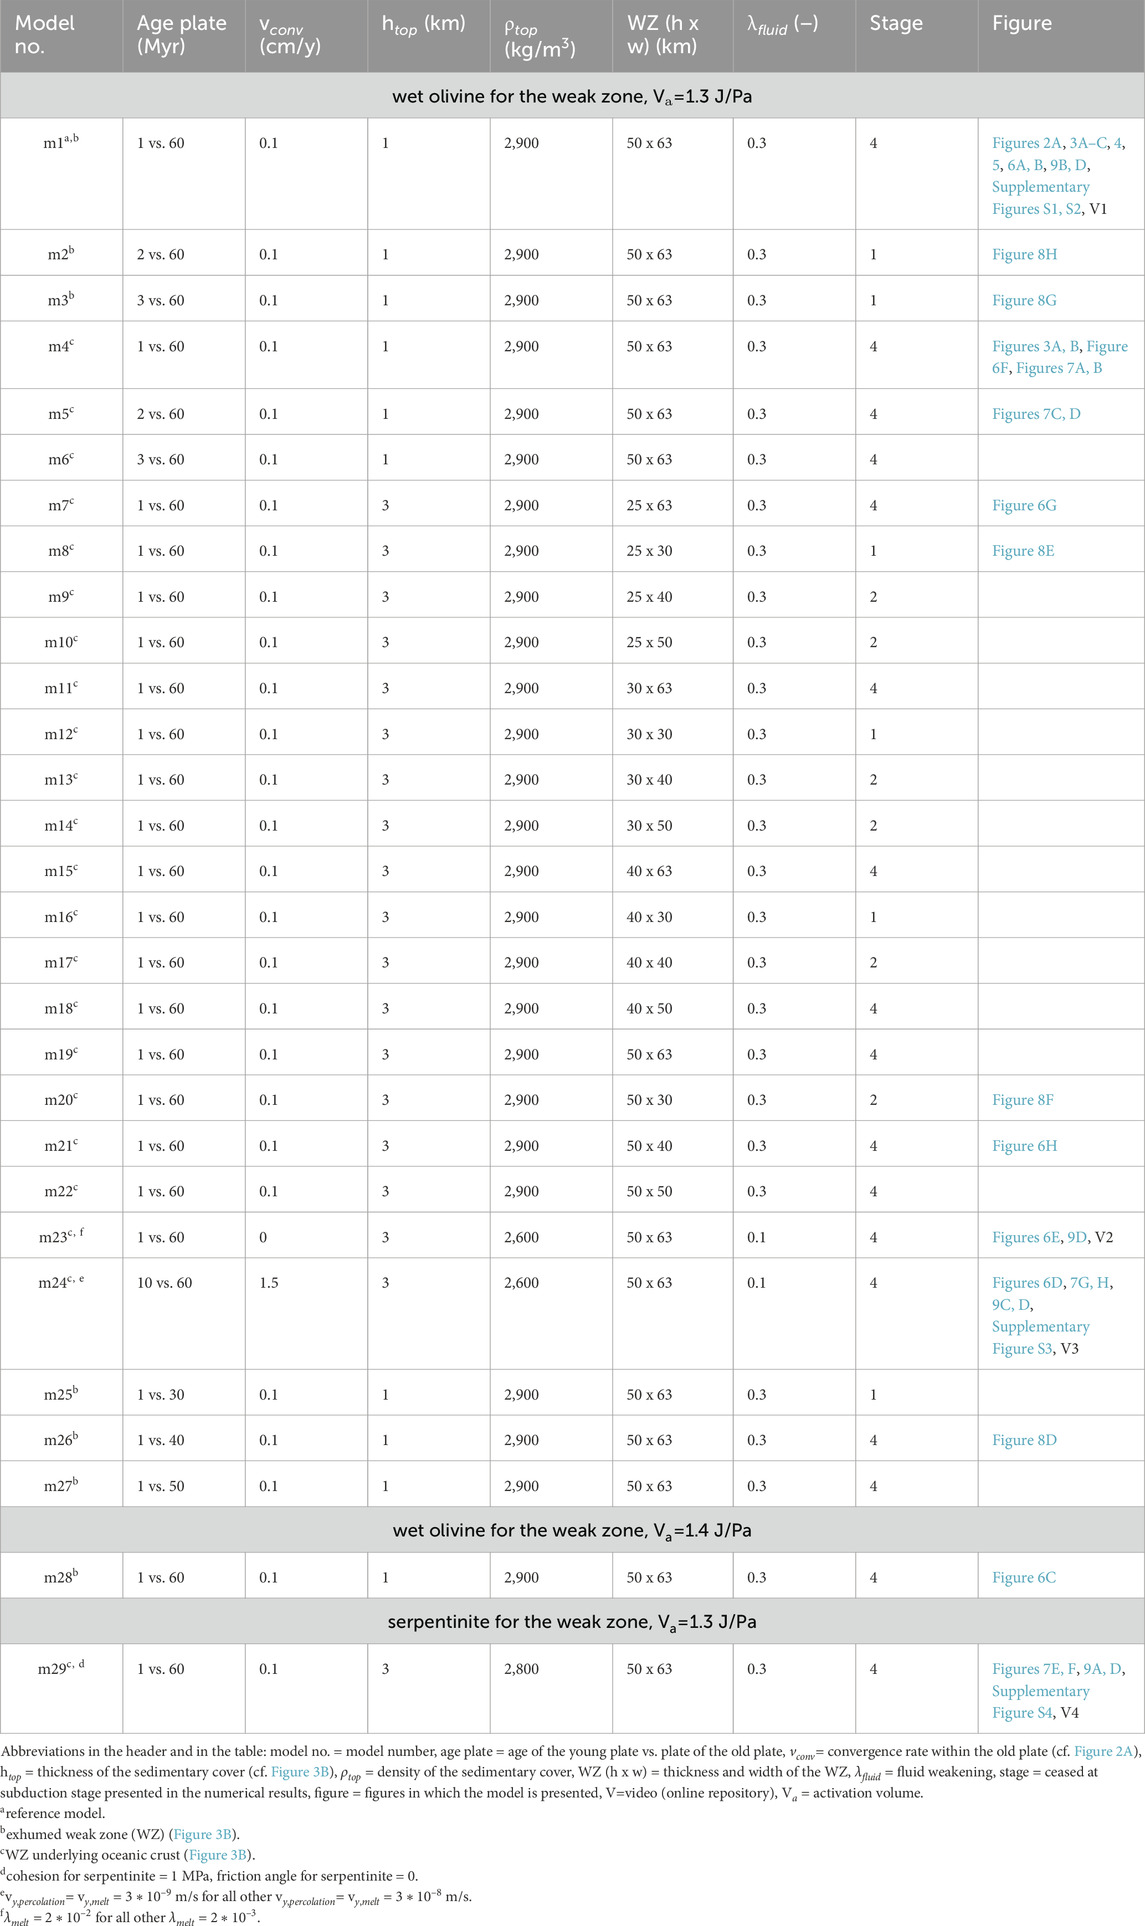
TABLE 1. List of model setup parameters that are modified from the reference model (model 1) and list of observed subduction stages for each model (cf. Figure 4; Figure 8).
A sedimentary cover, consisting of sediments and crust, is included over the entire model domain. The applied density, i.e., mostly 2,900 kg/m3 resembles an altered upper crustal and sedimentary cover (Table 1). In our model series, the imposed thickness of the sedimentary cover (0–3 km) had no effect on the overall model evolution. The oceanic plates consist of a 3 km basaltic upper crust overlying a 5 km gabbroic lower crust (Figure 2A). For the mantle, dry olivine rheology is used (Ranalli, 1995). The model includes the 410 km and 660 km mantle discontinuity (Ueda et al., 2012) implemented as phase transitions in the mantle and subducted oceanic crust (Gerya et al., 2021). A rheologically weak zone (wet olivine or serpentinite rheology; Ranalli, 1995; Hilairet et al., 2007) is defined for the plate contact zone simulating a transform fault zone. Hence, the 2D model simulates the evolution of a cross section through a transform fault zone, where the overriding (i.e., younger) plate is near the mid-oceanic ridge and the subducting plate (i.e., older) plate is at a larger horizontal distance from the mid-oceanic ridge. In this manuscript we refer to the transform fault zone as the weak zone (WZ) (Figure 3). Similar setup has been used in previous numerical studies (e.g., Gerya et al., 2008; Zhou and Wada, 2022; Arcay et al., 2023) and it is in agreement with geochemical constraints (e.g., Li et al., 2019; Ishizuka et al., 2020; Reagan et al., 2023). The overall shape and dimension of the WZ in our model setup is supported by natural observations (e.g., Hensen et al., 2019; Gregory et al., 2021). All nomenclature used in the manuscript is summarized in Figure 3. We call FAB as fore-arc basalts in our model results as they are observed in the (proto-) fore-arc region. In nature, not all subduction zones show FAB like found at the actual IBM subduction zone (Crameri et al., 2020). While the wet olivine WZ is assumed to contain negligible amount of water, the water content of serpentinites is assumed to be 2 wt%, which corresponds to partly hydrated peridotite. The geometry of the WZ varies for different models. Subduction is supported by a low horizontal convergence velocity imposed on the older subducted oceanic crust (from 0 cm/yr up to 1.5 cm/yr). All models are listed in Table 1 with their corresponding model parameters. All constants and characteristic flow laws are listed in the supplementary file A (Supplementary Table S1).
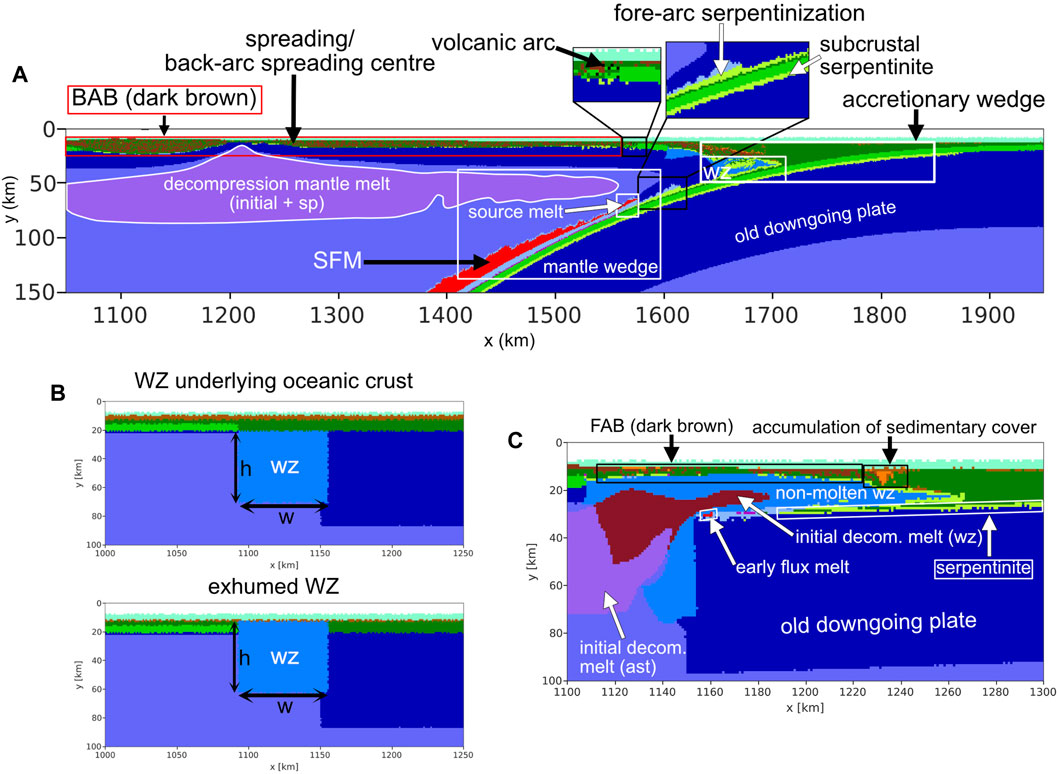
FIGURE 3. Nomenclature used to describe the results. ast = asthenosphere, BAB=back-arc basalts, decom. melt = decompression melt, FAB = fore-arc basalt (referred here as product of decompression mantle melting from the WZ and asthenosphere), h = thickness, SFM = subduction flux melting, sp = spreading, w = width, WZ = weak zone (i.e., transform fault zone). (A) Reference model (model 1), 10.8 Myr numerical time. (B) Initial WZ geometries in the numerical models. The WZ is overlain by basaltic crust in models, 4–24, 29, while the WZ and its sedimentary layer is exhumed on the surface in model 1–3, 25–28, upper and lower panels, respectively. (C) Reference model (model 1), 1.9 Myr numerical time. Colour code is shown in Figure 2.
The models show the following main stages of juvenile subduction: 1) SI driven by the negative buoyancy of the older, subducted plate fostered by slow plate convergence, 2) incipient subduction and the development of a spreading ridge on the overriding plate, 3) slab steepening and slab-induced poloidal mantle flow, 4) mature subduction and volcanic arc maturation. Not all of these stages are simulated in all models, as the subduction process can sometimes stall (i.e., lack of vertical velocity of the slab) after relatively short initial activity (cf. Table 1).
The reference model (model 1 in Table 1) includes a young overriding plate with an age of 1 Myr juxtaposed to a 60 Myr old subducting plate (Figure 2). For the latter, a convergence rate of 0.1 cm/y is imposed on the right boundary of the model within the lithosphere. The WZ boundary separating the older and younger oceanic plates is defined as a 63 km wide, 50 km deep hydrated mantle weak zone (WZ) overlain by a 1 km thick sedimentary cover of basalt and sediments.
Stage 1 marks subduction initiation until the formation of a spreading centre by ca. 2 Myr. This stage of SI starts with decompression mantle melting below the younger, overriding plate and below the WZ (Figures 4A, B; Figure 3C). This leads to FAB emplacement on the surface underlain by depleted asthenospheric mantle (Figure 5A; Figure 3C). Due to the initial, high temperature gradient, the tip of the sinking plate undergoes an early stage of flux melting after 1.4 Myr (Figure 3C). As the older plate starts sinking, partially molten asthenospheric mantle is gradually emplaced along the downgoing plate and a layer of subcrustal serpentinite of ca. 2 km thickness forms (cf. Figure 3C; Figure 4A). During SI, shear zones form within the WZ and conjugated shear zones develop at the hinge zone of the bending older plate (Figure 4B). At this stage the slab sinks at an average velocity of ca. 1.4 cm/yr.
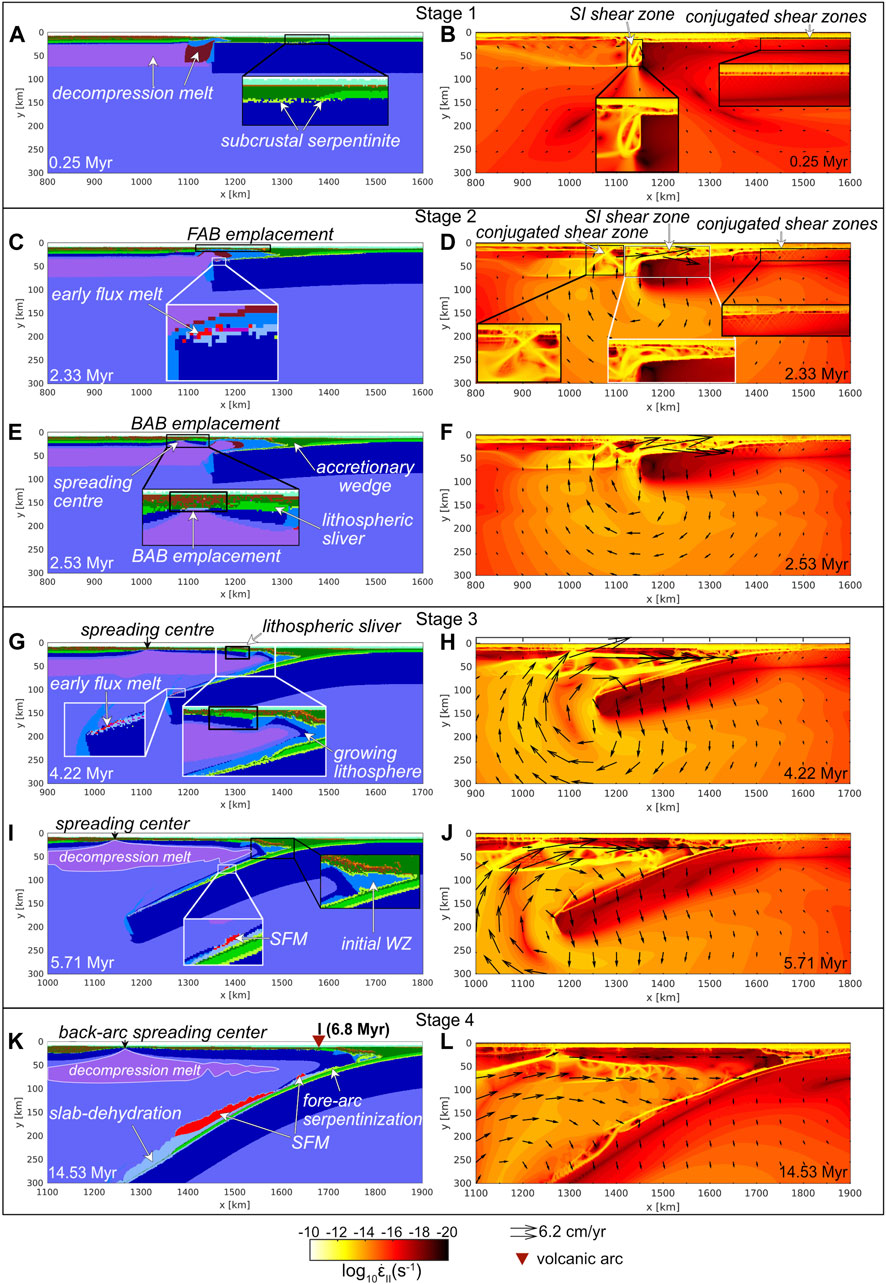
FIGURE 4. Reference model evolution shown by rock composition and the second invariant of the deviatoric strain rate superimposed by the velocity field (black arrows). The red triangle in stage 4 shows the position of the volcanic arc formed after 6.7 Myr. The thickened basaltic layer in the overriding plate is not related to subduction initiation and caused by initially present decompression melting under the young plate. The BAB are formed by the decompression melt of the spreading centre which becomes a back-arc spreading centre after the volcanic arc is formed. AST = asthenosphere, BAB = back-arc basalt, FAB = fore-arc basalt, SFM = subduction flux melting, WZ = weak zone. Colour code is shown in Figure 2. (A,B) Situation for stage 1 (detailed zoom of stage 1 and stage 4 can be found in Figures 3A, C, respectively), (C–F) for stage 2, (G–J) for stage 3 and (K,L) for stage 4.
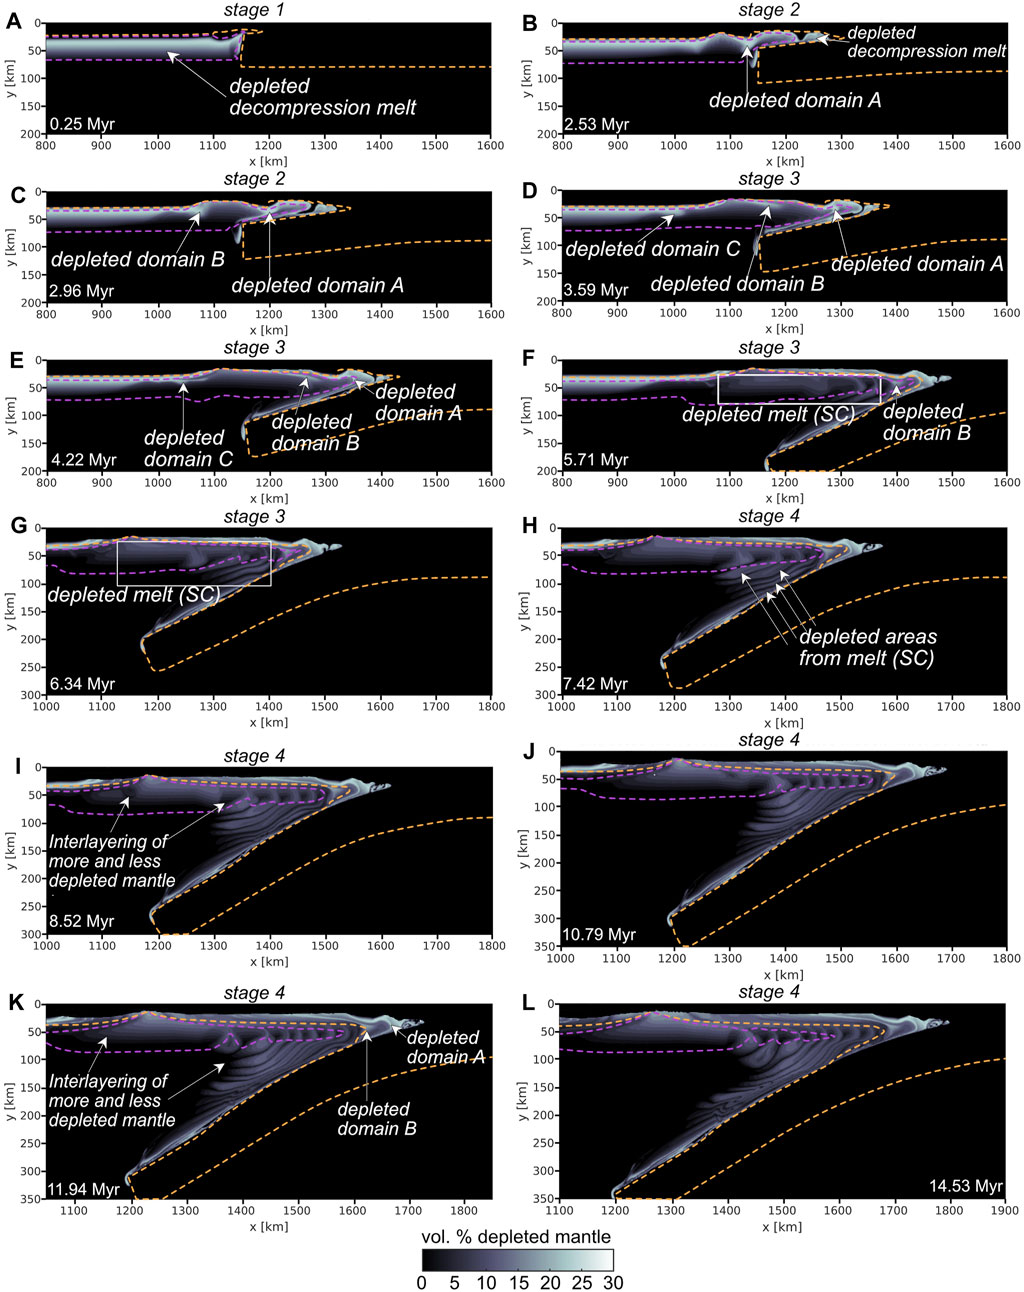
FIGURE 5. Temporal variability of distribution of partially depleted mantle in the reference model (cf. Figure 4). FAB = fore-arc basalt, SC = spreading center, WZ = weak zone. The orange dashed line represents the boundary between the lithosphere and the asthenosphere, the purple dashed line represents the decompression melt area. (A) corresponds to stage 1 (cf. Figures 4A, B) and (B, C) corresponds to stage 2 (cf. Figures 4C–F). Stage 3 is shown by (D–G) (cf. Figures 4G–J) and (H–L) corresponds to stage 4 (cf. Figures 4K, L).
Stage 2 (Figures 4C–F), between ca. 2–3.2 Myr after SI, is linked to the formation of the spreading centre in the gradually cooling overriding plate, at ca. 150 km horizontal distance from the slab tip (ca. 2.5 Myr after SI). Two pronounced conjugated shear zones (Figure 4D) form within the area of the developing spreading centre, controlling its position. The juvenile spreading centre accommodates trench retreat (Figures 4E, F). Decompression mantle melts generated below the initial plate boundary are transported to the forming mantle wedge overlying the sinking slab and consequently increase its degree of depletion (Figures 4C, E, cf. Figures 5A, B). The upper plate spreading centre bounds a ca. 100 km wide lithospheric sliver that is drifting towards the gradually retreating trench (Figure 4E). A distinct depleted mantle zone is present between this drifting lithospheric sliver and the mantle wedge overlying the slab interface (Figures 5B, C, depleted domain A). The slab sinking rate gradually increases to an average of 3.1 cm/yr by this time. Finally, at this stage, a second distinct domain of depleted lithospheric mantle is formed, connected to the evolution of the spreading ridge in the overriding plate and which gradually migrates towards the mantle wedge in the next stage (cf. Figures 5C–E, depleted domain B).
Stage 3 (Figures 4G–J) is distinguished from the previous stage by the maturation of the poloidal mantle flow and the onset of SFM. It has a duration of ca. 3 Ma. At the beginning of stage 3, the leading edge of the slab reaches a depth of ca. 150 km and becomes progressively steeper during this subduction stage, being accompanied by a larger wavelength poloidal mantle flow circulation. The slab sinking velocity drops to ca. 2.0 cm/yr on average (cf. Figures 4H, J). Accompanying slab steepening, the rocks from the initial WZ are dragged downwards with the sinking slab and are sheared within the mantle wedge and along the upper slab boundary (Figure 4I). Decompression mantle melting gradually ceases. However, the spreading centre continuously accommodates slab retreat, driving another cycle of decompressional melting. A third distinct depleted mantle domain forms as the spreading centre matures (Figures 5D, E, depleted domain C). Small-scale shear instabilities, producing thermal perturbations and depletion layering in the upper part of the mantle wedge, arise 5 Myr after SI (e.g., Supplementary Figure S2). Part of the depleted mantle domains (domains A, B, C cf. Figures 5D–H) are affected by the mantle flow and by the small-scale shear instabilities during stage 3 and 4. Depleted mantle below the overriding plate is transported towards the mantle wedge, leading to the spatial variation of more depleted and more fertile mantle in the wedge. The subduction flux melt (SFM) arises spontaneously from ca. 5.7 Myr at 80 km depth (Figure 4I). Flux melting is driven by continuous slab dehydration and subsequent hydration of the mantle wedge. The partially molten flux melt rises, decreasing the adjacent mantle viscosity and lubricating the mantle wedge and the overlying lithosphere.
Stage 4 corresponds to the gradual accumulation of the SFM and the formation of a juvenile volcanic arc between the trench and the spreading centre by 6.8 Myr following SI (Figures 4K, L; Figures 6A, B). With the maturation of the volcanic arc front, the subduction zone progressively reaches maturity. Decompression mantle melting continues beneath the spreading centre, i.e., in the back-arc. This contributes to mantle depletion (Figures 5H–L). Continuous mantle melting is sustained by the upwelling of the non-depleted mantle beneath the back-arc basin, also facilitated by the slab-induced mantle flow. An active volcanic arc forms 6.8 Myr after SI, while both decompression mantle melt and SFM melt overlie in the mantle wedge (Figure 6A). The location of the active volcanic arc migrates laterally towards the trench, driven by the migration of the underlying melt source region and the overriding plate. By this time, the volcanic arc is no longer overlying the SFM area, so that no active volcanism occurs (Figure 6B) since melt content within the SFM area remains below the imposed extraction threshold of 4%. During this final stage, the slab sinks at an average rate of 1.6 cm/yr.
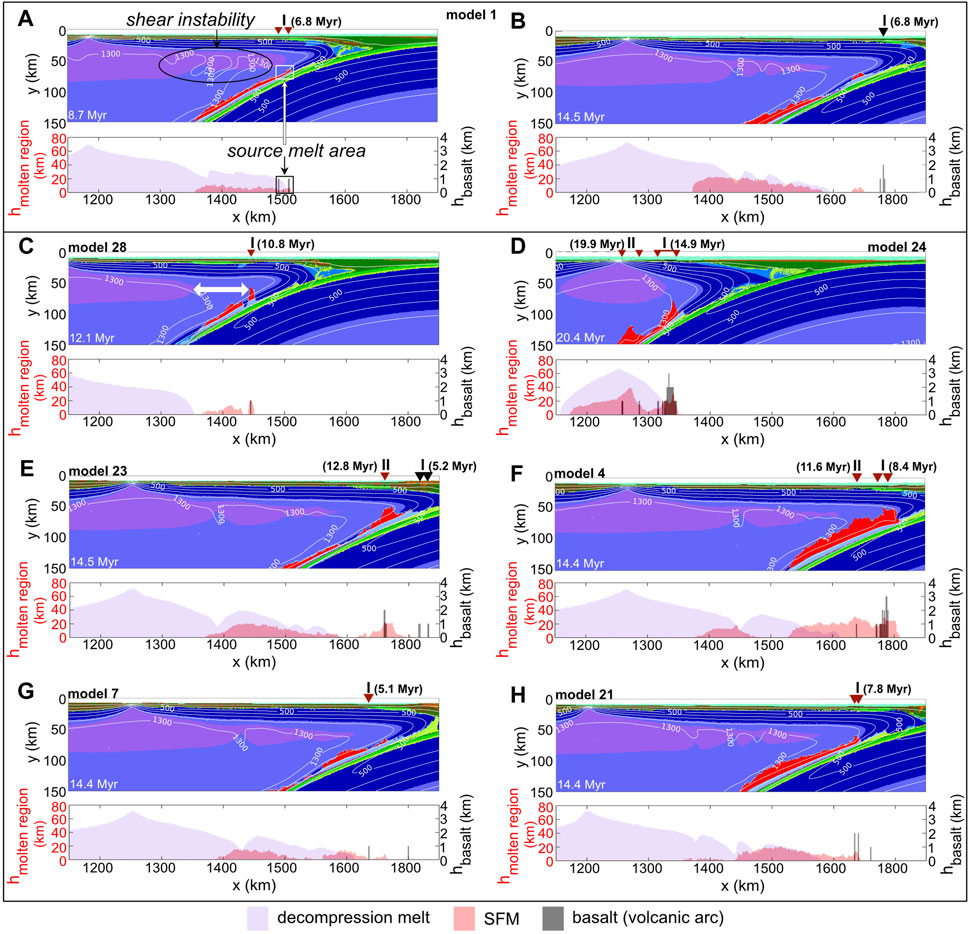
FIGURE 6. Model comparison shown at the main stages of flux mantle melting. The top part shows the rock type distribution (colour code can be found in Figure 2). The position of the volcanic arc is shown by a red triangle, whereas the black triangle shows the position of a remnant volcanic arc (i.e., it does not overlap with the current flux melt). The labeled time above the volcanic arc represents the time of formation whereas several locations can correspond to the same time representing a volcanic arc generation. The histogram in the lower part shows in shaded colour the distribution of (i) partly molten region due to decompression melt in purple, (ii) partly molten region due to SFM in red and (iii) basalt as product of SFM in shaded grey. Note that also partial melt which occurs below 150 km depth is included in the histogram. The source melt area of SFM can be identified when SFM (red bars) and basalt (grey bars) overlap (indicated in A). The decompression mantle melt (purple bars) influences the basaltic composition if it overlies the flux melt. Small-scale shear instabilities in the mantle wedge which influence the area of depleted mantle are visible at the 1,300°C isotherm in (A) (cf. indication), (B), (E–H). Different models reach this mature stage at different times driven by different initial conditions (summarized in brackets following the model number and listed in more detail in Table 1). (A) Reference model (model 1, exhumed WZ (cf. Figure 3B), 1 Myr overriding plate, vconv = 0.1 cm/yr) within 2 Myr after the formation of the volcanic arc. (B) Reference model (model 1), mature stage. (C) model 28 (increased activation volume Va = 1.4 J/Pa), within 2 Myr after the formation of the volcanic arc. The white arrow indicates the early separation of the decompression melt and the flux melt compared to (A). (D) model 24 (10 Myr overriding plate), mature stage. (E) model 23 (vconv = 0 cm/yr, i.e., spontaneous subduction zone), mature stage. (F) model 4 (WZ underlying oceanic crust (cf. Figure 3B) with 1 Myr overriding plate), mature stage. (G) model 7 (dimension of the WZ underlying oceanic crust (cf. Figure 3B): thickness = 25 km, width = 63 km), mature stage. (H) model 21 (dimension of the WZ underlying oceanic crust (Figure 3B): thickness = 50 km, width = 40 km), mature stage.
We assess the influence of the imposed horizontal convergence velocity by showing a model without any horizontal forcing (model 23, Table 1; Figure 6E) and comparing this evolution with the reference model. The ongoing discussion on spontaneous versus forced SI inspired a model setup without any imposed velocities. When no velocity is imposed, SI starts with a sole vertical motion, that is followed by the gradual acceleration of the (horizontal) plate convergence, reaching values higher than the previously imposed constant velocity (e.g., Arcay et al., 2020; Lallemand and Arcay, 2021). The model goes through all four stages in a similar way as in the reference model (c.f. Figure 4). Subduction initiation and evolution seems to be accelerated in the absence of imposed far-field plate convergence in term of melting and formation of volcanic arc. As a result, the individual stages are advanced with respect to the reference model. The spreading centre forms ca. 1.8 Myr after SI (2.5 Myr in the reference model), the first SFM evolves after 4.7 Myr at depth of ca. 60 km (5.7 Myr at depth of ca. 80 km in the reference model) and a first volcanic arc forms after 5.2 Myr (6.8 Myr in the reference model). This arc migrates towards the trench and becomes a remnant volcanic arc while a second volcanic arc forms at 12.8 Myr and remains active 15 Myr after SI.
The rheological properties of serpentinite include a moderately elevated water content of 2 wt% (Ranalli, 1995). This rock type was used for the WZ (model 29, Figures 7E, F). The first three stages of evolution in this model are comparable to those in the reference model. During the first stage, increased depleted flux melting is generated from the entire WZ as a result of the increased water content in the serpentinite (Figure 10A). Therefore, (proto-arc) mantle melt products, which can be interpreted as boninites, are formed at the surface. The spreading ridge evolves directly above the forming slab tip and the young plate fragment. The corresponding depleted mantle domain is smaller than in the reference model (cf. Figure 4G; Supplementary Figure S4 in the supplementary file A). No volcanic arc is formed during the first 15 Myr of SI although SFM is present during all four stages of juvenile evolution. The mantle wedge is slightly more depleted after 15 Myr compared to the reference model and shows the similar layering of more and less depleted mantle.
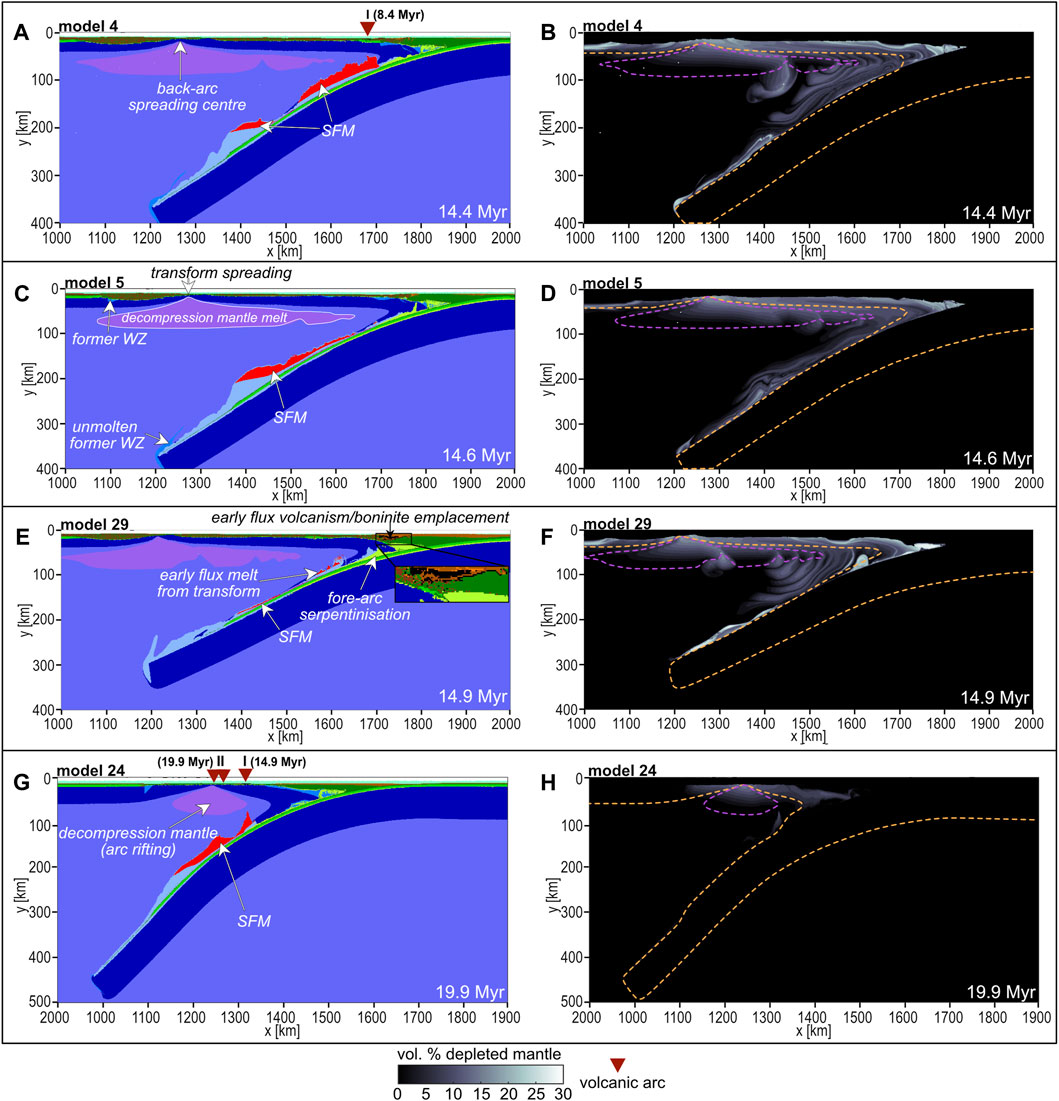
FIGURE 7. Model comparison of the distribution of the rock type (left) and the temporal variability of distribution of partially depleted mantle driven by different degrees of decompressional and flux melting influenced by different initial conditions: (A), (B) model 4, WZ underlying oceanic crust (Figure 3B) and 1 Myr overriding plate; (C), (D) model 5, WZ underlying oceanic crust and 2 Myr overriding plate; (E), (F) model 29, WZ underlying oceanic crust with serpentinite rheology; (G), (H) model 24, WZ underlying oceanic crust with 10 Myr overriding plate. SFM = subduction flux melting, SC = spreading centre, orange dashed line = lithosphere-asthenosphere boundary, purple dashed line = decompression melt, colour code visible in Figure 2.
In Table 1 a compilation of models with variable size of the WZ is listed (cf. Figure 3B). Depending on its width and thickness, the model ceases at different stages as presented in the reference model description (Figure 8A). Models with a too narrow and too thin WZ (i.e., width of 30 km and thickness of 25–40 km) tend to show SI, but the amount of decompression mantle melt is too small to generate an asthenospheric mantle emplacement event large enough to accommodate and enhancing the sinking of the incipient slab (Figure 8E). In models that cease after stage 2 (Figure 8F), instead of continuous slab sinking, the slab stalls within the uppermost mantle. Because of the restricted subduction, mantle flow velocities are much lower and as a result of the gradual cooling of the mantle the lithosphere above the slab thickens early and, the decompression melt solidifies faster. Seven models with widths of 40–63 km and thicknesses of 25–50 km reach the mature subduction stage (Figure 8A; Figures 6G, H).
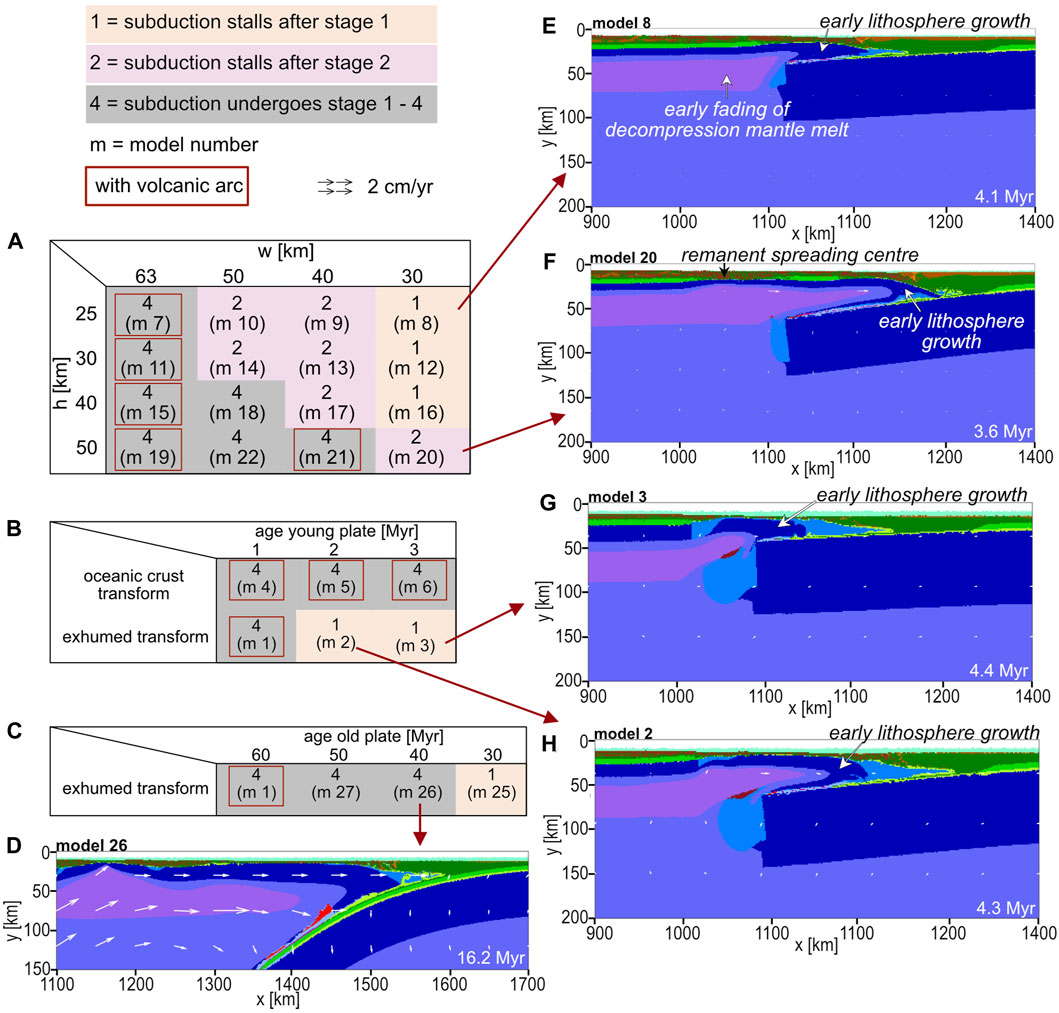
FIGURE 8. (A–C) Model summary on which stage is reached in the distinct models. The numbers are referring to the observed stages according to the reference model (cf. Figure 4). Models labeled in grey (i.e., labeled with a number four) are showing a similar evolution as described for the reference model. Note that not all models form a volcanic arc. Simulations with wider and thicker WZ reach all the four evolution stages of subduction. While other models stall earlier at different stages. (D–H) Are example snapshots for various models (colour code is shown in Figure 2).
Different scenarios are simulated depending on the position of the WZ, i.e., whether the model contains a WZ underlying oceanic crust (Figure 3B; 8B, model 4; Figures 7A, B) or an exhumed WZ (i.e., covered only by the sedimentary cover, reference model). When the WZ underlies the oceanic crust, and is thus located deeper at higher temperature, the amount of decompression melt is higher. Additionally, the flooding of the molten asthenosphere occurs ca. 0.5 Myr earlier than in the reference model and is more intense. The spreading centre and first SFM evolve earlier (at ca. 1.8 and 3.9 Myr respectively at 80 km depth in model 4, 2.5 Myr and 5.7 Myr respectively at 80 km depth in the reference model). Two generations of volcanic arc form, starting at 8.4 Myr (6.8 Myr in the reference model) followed by a second generation at 11.6 Myr (Figure 6F). When the thermo-tectonic age of the overriding plate is 2 Myr (Figure 8B, model 2 for exhumed transform; Figure 8H and model 5 for WZ underlying oceanic crust; Figures 7C, D), the WZ accommodates slab retreat and in contrast to the reference model a transform spreading develops (i.e., the spreading forms within the WZ so that no lithospheric sliver is formed). The spreading centre evolves at ca. 2.5 Myr and 3.1 Myr after SI for exhumed WZ (model 2) and WZ underlying oceanic crust (model 5) respectively. The transform spreading centre in model 2 is short-lived and the lithosphere grows early, leading to the cessation of the subduction zone.
Models with lower plate age differences (model 2, 3, 5, 6) were tested and are shown in Figure 8. Model 3 (3 Myr overriding plate) and model 24 (10 Myr overriding plate, i.e., model with the oldest overriding plate) will be discussed in more details. In model 3 (Figure 8G), a convergence velocity of 0.1 cm/yr is imposed and is, therefore, directly comparable with the reference model. This model stalls within stage 1 due to the lower amounts of melt and the stronger lithosphere. For model 24 (Figures 7G, H) a convergence rate of 1.5 cm/y is imposed. There is no decompression melt beneath the young plate and a small amount of the WZ undergoes melting. Similar to model 3, the lithosphere thickens so that the supply of decompression mantle melt is limited. A transform spreading forms after ca. 10 Myr. The higher imposed convergence rate maintains subduction and surface rock influx so that SFM forms after ca. 12.9 Myr. Two main generations of the volcanic arc can be observed (14.9 Myr and 19.9 Myr, Figure 6D, Supplementary Figure S3).
In models 25–27 (Table 1; Figure 8C) we varied the thermal age of the old plate in order to test whether SI occurs with a lower age gradient, i.e., closer to a mid-ocean ridge. A similar juvenile subduction evolution as in the reference model can be observed in the models with a subducting plate age of 40 Myr (model 26, Figure 8D) and 50 Myr (model 27). However, both models 26 and 27 with 40 Myr, respectively 50 Myr old plate, do not form enough SFM to form a volcanic arc within 15 Myr.
For model 28 (Figure 6C) a higher activation volume for the crust, lithosphere and the asthenosphere has been used (cf. Table 1). As a consequence, the effective viscosity increases, so that the individual stages of subduction are longer. Therefore, the volcanic arc starts to form 10.8 Myr after SI (6.8 Myr in the reference model) and the small-scale thermal perturbation is weaker than in the reference model. The decompression melt and the SFM are displaced laterally before the formation of the volcanic arc (Figure 6C, white arrow).
We discuss the petrological-thermo-mechanical model results in the context of the available observational constraints from the IBM subduction zone and results from previous numerical studies. The overall evolution and the main stages from initiation to mature oceanic subduction are summarized in Figure 9.
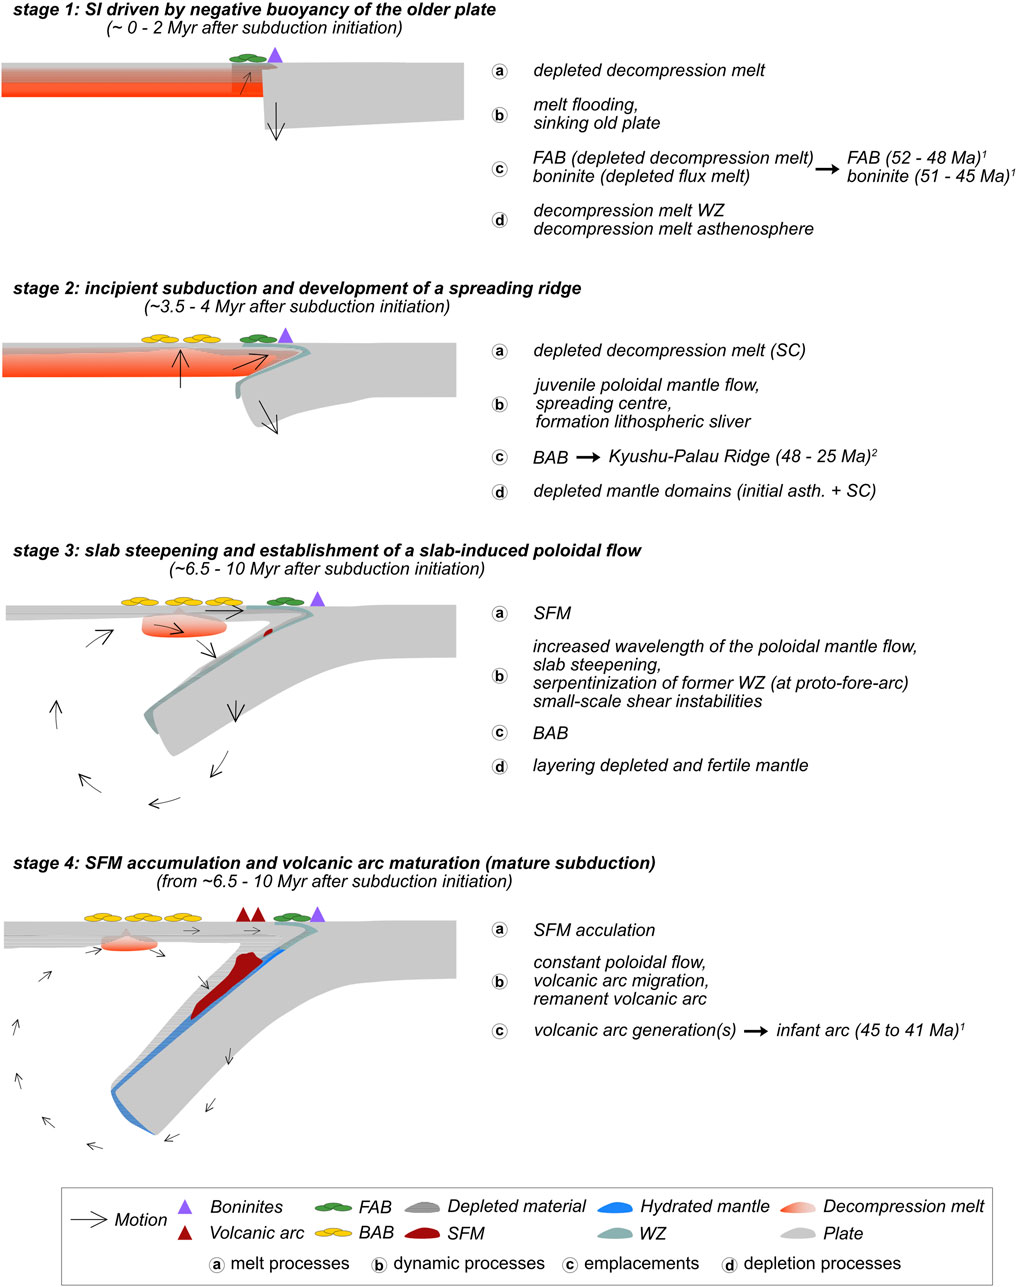
FIGURE 9. Left: schematic sketch of main events within each stage with their observed duration (not only based to the reference model). Right: summary of the main characteristics sorted by melt processes, dynamic processes, emplacements and depletion processes in the mantle wedge. FAB = fore-arc basalt, WZ = weak zone (i.e., transform fault zone), SC = spreading centre, BAB = back arc basalts, asth. = asthenosphere, SFM = subduction flux melt. 1 summarized by Ribeiro et al. (2022), 2 Ishizuka et al. (2011b).
Subduction initiation observed in the model, i.e., the bending of the older plate is supported by the negative buoyancy of the older plate, the rise of the partially molten mantle material and the low convergence rate within the old plate (Figure 4). Slab bending affects the distribution of subcrustal serpeninization which gradually spreads over the bending plate (Figures 4A, C), as studied by Faccenda et al. (2009). Two different rock types from different melt sources can be interpreted in the model during this early evolution: FAB formation is linked to moderately to highly depleted decompression mantle melting (Figure 4; 5, Figures 10A–C), while boninite formation is associated with melting from the initial WZ that was characterized by higher initial water content (Figure 10A) which only occurs in model 29 using serpentinite rheology for the WZ. The boninites in model 29 represent an early volcanic event as a consequence of melt emplacement above the nascent slab and are only preserved in the proto-forearc regions because they formed within one event and were affected by the lateral push of the spreading (Figure 7E; Supplementary Figure S4). In general, melt emplacement can be interpreted as a near-trench spreading centre and is observed in all models. Different to the boninites found at IBM, which represent the onset of arc volcanism (e.g., Reagan et al., 2017; Reagan et al., 2019, and references therein), no further volcanic events are observed in model 29 (Figure 7E). The FAB, formed as partially molten mantle material, is emplaced at the plate interface and the overriding plate. This decompression mantle melting event can be connected to FAB formation located in the fore-arc-region (Figure 4C). The proportion of this first FAB emplacement in our models is connected to the degree of decompressional mantle melting and this is linked to the thermal age of the overriding plate, i.e., an older overriding plate results in a less efficient FAB emplacement (cf. Figures 7A, C, G). In nature, therefore, the amount of FAB emplacement is controlled by the distance of the WZ to the mid-ocean ridge on the overriding plate. Model 24 is an end member model due to the relatively high thermal age of the overriding plate, and therefore the only occurrence of decompression mantle melt is at the WZ (Supplementary Figure S3). The comparison with the reference model clearly shows the low presence of FAB in model 24 (cf. Figures 10B, C). The BAB emplacement forms in the proto-back-arc basin at a later stage as a consequence of the formation of the spreading centre (Figure 4E).
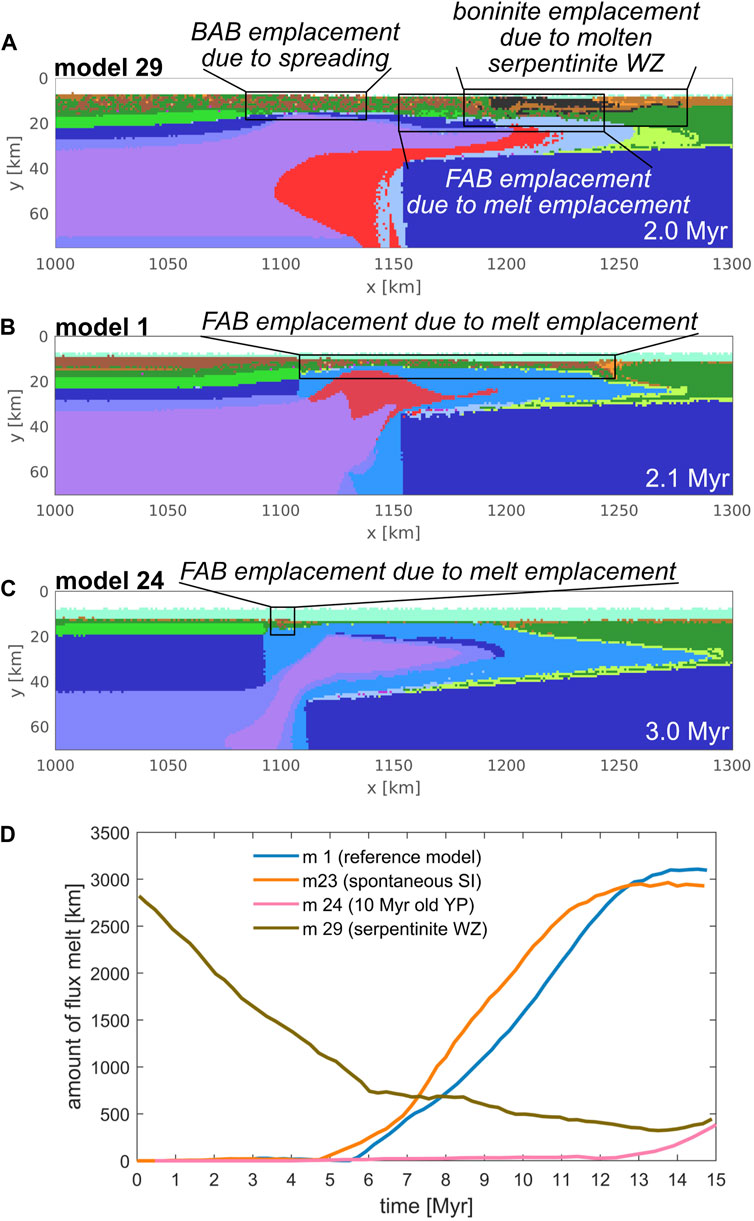
FIGURE 10. WZ = weak zone, FAB = fore-arc basalt, BAB = back-arc basalt, YP = young plate. (A) Zoomed image of the model with a serpentinite WZ. Note the emplacement of boninites (in black) formed from the melting of the serpentinite WZ, FAB and BAB (in dark brown) formed from asthenospheric melt emplacement above the sinking plate. (B) Zoomed image of the reference model. Note the larger area of FAB emplacement compared to (C) which shows a zoomed area of model 24 (10 vs. 60 Myr juxtaposed plate age). Colour code shown in Figure 2. (D) evolution of the flux melt for four different end member models for the first 15 Myr.
In the reference model at stage 4, the SFM depth is simulated between ca. 80–200 km (at ca. 15 Myr after SI, Figure 4K). This model result is in agreement with the study of van Keken et al. (2011) who reported a similar ca. 80–190 km slab dehydration depth in the case of the IBM. The source of melt for the volcanic arc varies with time and depth. At the first appearance of the volcanic arc, 6.8 Myr after SI, the source melt area is at a depth of ca. 70–80 km (Figure 6A). These depth ranges are somewhat lower than the values proposed by England et al. (2004) and Syracuse and Abers (2006).
Our model series can be grouped into four distinct evolutionary scenarios (c.f. reference model, model 23, 24 and 29). Their flux melt evolution is shown in Figure 10D. In model 29, we simulated the WZ by a serpentinized mantle zone with higher initial water content and thus, this model showed larger melt fluxes (Figure 10D; Supplementary Figure S4). As the model progresses (up to ca. 14 Myr), the amount of flux melt decreases due to solidification of the partially molten regions. Up to 15 Myr, the amount of flux melt increases as SFM is formed. The other three models start without fluid-assisted melting of the WZ due to the lower water content in the WZ. However, the crustal rocks near the WZ get hydrated, leading to early flux melting (cf. Figure 3C) at the front of the foundering plate, which explains the low amount at the beginning of the evolution in model 1, 23, 24 in Figure 10D. As Figure 10D shows, the increased flux melt starting at ca. 5.7 Myr for the reference model signifies the onset of the SFM melt. By 13 Myr, a quasi steady-state condition is reached and solidification and melting become balanced. The purely spontaneous SI model shows a similar curve to that of the reference model but the evolution starts earlier and with less flux melt in the mature phase. Therefore, the subduction zone stabilizes earlier than in the reference model. This time-shift (Figure 10D, c.f; Figures 6B, E) indicates that horizontal forcing does not primarily accelerate the subduction evolution. No significant amount of SFM is formed in model 24 within the first 12 Myr as a result of the higher initial thermal age of the overriding lithosphere. Because the stages of juvenile subduction are delayed compared to the reference model, model 24 shows the lowest amount of flux melt 15 Myr after SI and does not reach the mature stage within this period of time.
Based on our model series, we have separated three distinct scenarios for the evolution of the volcanic arc. i) Initial volcanic arc formation is followed by its lateral migration driven by trench retreat (e.g., Figures 6A, B for the reference model, 6 C, G, H for further model examples). In this scenario, slab rollback triggers trench retreat and thinning of the overriding crust, i.e., the formation of a spreading centre. Because not enough SFM is formed, no second volcanic arc forms in these kind of models within 15 Myr. For the first Myr after the formation of the volcanic arc, the partial decompression melt overlies the area of the SFM (i.e., the source melt area of the volcanic arc, Figure 6A). As the SFM percolates through the mantle wedge to the surface, it passes through the area of partial decompression mantle melt. Therefore, the basaltic composition of the juvenile active volcanic arc is influenced by the overlying decompression melt and depleted mantle wedge. Small-scale shear instabilities (Supplementary Figure S2; Figure 6A), linked to the viscosity and velocity contrast in the mantle wedge, and resulting in thermal perturbations starting before the volcanic arc, restrict the area of decompression mantle melt. Consequently the influence on the composition of the decompression mantle melt decreases as the volcanic arc evolves. This melt mixing is not observed in model 28 because of the earlier cooling of the subduction zone as a consequence of the initially higher viscosity chosen by the higher activation volume (cf. Figures 6A, C). ii) Several generations of volcanic arc form as a consequence of early or concentrated flux melt accumulation (e.g., Figures 6D–F). Models 22 (spontaneous SI) and 23 (10 Myr overriding plate) show in contrast to the reference model two generations of volcanic arc. According to the flux melt evolution (Figure 10D) SFM accumulates earlier in model 23 than in the reference model so that more SFM is formed in the same amount of time in the uppermost source melt area to form the second volcanic arc (cf. Figures 6B, E). Instead of spreading along the slab, SFM accumulates in a narrow region between 100–230 km depth in model 24 due to slab steepening driven by the increased convergence rate and the thermal age of the overriding plate (Figure 7G). Therefore, the imposed extraction threshold is exceeded and a second volcanic arc forms within 20 Myr. iii) No arc volcanism - In this last case (e.g., model 29, Figure 7E), no juvenile volcanic arc is formed. The low influx of surface rocks, the low convergence rate and the solidification limit the amount of SFM.
Fore-arc basalts are traditionally interpreted as proxies of SI. They are formed at IBM 52–48 Ma (Seno and Maruyama, 1984; Reagan et al., 2010) while our model reports emplacement related to FAB within ca. 2 Myr after SI (e.g., Figure 3C; Figures 10A–C). The modelled FAB locations are in a good agreement with observations from the IBM, as they form along the WZ that becomes the later fore-arc region (e.g., Figures 4C, E). Boninites formed after the FAB (51–45 Ma; Ishizuka et al., 2006; Reagan et al., 2019) exhibit sediment- and fluid-mobile elements. Because the sedimentary cover in our models does not subduct due to model limitations, basalt with sedimentary melting fingerprint cannot be observed and does, therefore, not exist in our reference model. However, model 29 results in fluid-rich melting at the onset so that boninites are formed simultaneously with the FAB in the model (e.g., Figure 10A). It is not possible to observe a clear chronological transition between FAB and boninites, such as it is reported from the rock record by, e.g., Ishizuka et al. (2011a). Reagan et al. (2010) Shervais et al. (2019) and Shervais et al. (2021) concluded that the degree of mantle depletion observed from FAB to boninites increased with time. The BAB in the model is formed by the spreading center in the overriding plate (i.e., the Philippine Sea Plate) during stage 2, i.e., ca. 2.5 Myr after SI. The timing of the spreading centre and the BAB emplacement can be compared with the Kyushu-Palau Ridge which was active between 25 Ma and 48 Ma (Ishizuka et al., 2011b). Geochemical interpretations of Ishizuka et al. (2013) and Reagan et al. (2023) point out that SI at IBM can be supported by a density gradient linked to a long transform fault zone (i.e., the WZ in our model setup), a mantle plume and by far field plate reorganisation (i.e., low convergence velocity in our model set up) (Wu et al., 2016; Wu et al., 2022). However, according to Reagan et al. (2023) it is unclear whether the mantle plume was still active during SI of IBM due to the rapid timescale within the first 2 Myr after SI. The arrival of the mantle plume likely rejuvenated the Philippine Sea Plate leading to the initial set up of our models with a significant age gradient between the plates (Ishizuka et al., 2013; Reagan et al., 2023). Decompression mantle melting beneath the young overriding plate supports the subduction initiation process as it floods over the foundering plate, enhancing the sinking.
Our new models suggests that the variable degree of depletion of the mantle wedge is the result of two processes: i) previously depleted mantle is flowing from the overriding plate spreading region and from the initial WZ into the mantle wedge; ii) mantle fertilization is driven by the dehydration of the downgoing plate. The degree of mantle depletion is influenced by the amount of initial decompression melt, i.e., the thermal age of the plates (cf. Figures 7B, D) as well as by the water content in the molten phases (cf. Figure 5L; Figure 7F). The layering of more and less depleted mantle material is linked to small-scale thermal perturbations as a consequence of small-scale shear instabilities in the mantle wedge (Supplementary Figure S2; Figures 6A, B). Shear instability, i.e., mantle flow perturbation is driven by the viscosity contrast between the partially molten decompression melt from the spreading centre and the underlying asthenosphere. Spatial and temporal heterogeneities in mantle fertility for subduction zones in general have been observed by Pearce and Stern (2006) and Magni (2019). Based on trace element and isotopic data, heterogeneities in fluid-mobile elements between the arc basalts and the BAB (Hochstaedter et al., 2001; Pearce et al., 2005; Pearce and Stern, 2006) and between different arc volcanoes (Tamura et al., 2011) can be observed in IBM. Our new results suggest further, that these mantle heterogeneities can be due to shear instability in the mantle that arises by the end of the third stage of the juvenile evolution. Overall it is in agreement with the study of Li et al. (2019) who concluded the magmatic source of the IBM proto-arc magmas comes from the Indian/Philippine isotopic domain, i.e., from the overriding plate in our model. At the onset of SFM formation, the asthenospheric mantle wedge is already depleted which can influence the chemical signature of the resulting volcanic rocks, as suggested by Magni (2019). This previous study showed that melting and mantle depletion are only influenced by the overall mantle flow and not by additional small-scale thermal perturbations as our models suggest. Furthermore, we observe models with and without melt mixing of SFM and decompression melt, depending on the choice of the activation volume. Based on geochemical constraints on the IBM rock record, one could distinguish between the infant arc, formed 41–45 Ma (i.e. 7–11 Myr after the formation of FAB at IBM) and the mature arc formed 40–42 Ma (i.e. 12 Myr after formation of FAB at IBM) (Ishizuka et al., 2006; Reagan et al., 2010; Ishizuka et al., 2011b; Reagan et al., 2017; Reagan et al., 2019; Ishizuka et al., 2020; Ribeiro et al., 2022). As our models do not trace any geochemistry, one can only distinguish the evolution of the volcanic arc in the model regarding its location and the magmatic source with potential melt mixing and cannot differ between infant and mature arc. The timing of the first appearance of the volcanic arc in the reference model (6.8 Myr after SI, Figure 6A) lies within the potential age range observed for the juvenile volcanic arc of the IBM subduction zone (45–41 Ma, i.e., 7–11 Myr after the formation of the FABs; Ishizuka et al., 2006; Reagan et al., 2010; Ishizuka et al., 2011a; Reagan et al., 2017; Reagan et al., 2019; Ribeiro et al., 2022). Agard et al. (2020) concluded based on joint analyses of natural data and modelling techniques a similar multi-stage division of the juvenile evolution for IBM as our numerical models suggest.
Arcay et al. (2020) tested the case of spontaneous SI with a similar approach, with their main conclusion that an initiation under such conditions is not possible for modern Earth without assuming unrealistic values. Comparing their parameter choices with the ones from this study it turns out that our models are successful with realistic (e.g., Va, density of the upper crust) to extreme values (e.g., density of the WZ, plate age difference) according to their rating scheme. In contrast to Arcay et al. (2020), also discussed in Lallemand and Arcay (2021), our study shows SI with subduction maturation within reasonable timescale and uses a sticky air layer which enables more realistic evolution of the model surface. Lallemand and Arcay (2021) suggested that plate ages of the IBM subduction zone during initiation was between 40–60 Myr which does not overlap with our initial setup. However, the study of Zhou and Wada (2022) showed that purely spontaneous SI with more realistic plate age differences can be obtained by assuming visco-elasto plastic rheology instead of visco-plastic rheology as it is in our models. Arcay et al. (2023) conducted a study of numerical modelling on SI in which they analysed the plate age difference of the juxtaposed plates linked to the depth of the WZ with a cumulative convergence rate of 1 cm/yr. A comparable model for their study is model 24 in which the plate age difference is 50 Myr and the depth of the WZ is 50 km. By comparing models m2, m3 and m25 (Figure 8, Supplementary File B) which have initially lower plate age contrast than the reference model, the results show that an initial horizontal velocity condition was needed to initiate subduction and to observe a magmatic evolution similar to the reference model (cf. Supplementary Figure S3 in supplementary file A and Supplementary Figure S1 in supplementary file B). The width of the WZ in our models varied between 30 km and 63 km which is realistic when comparing it with Hensen et al. (2019).
The process of spontaneous SI in nature is debated (e.g., Stern, 2004; Stern et al., 2012; Arcay et al., 2020; Maunder et al., 2020; Arcay et al., 2023). Our models indicate that an initial stage of slow plate convergence supports SI. Following this initial slow plate convergence, the subduction zone evolution is primarily driven by the sinking slab and rising serpentinized and partially molten rocks along the WZ. Furthermore, SI with an imposed horizontal convergence rate does not evolve faster than spontaneous SI. Subduction initiation in nature is likely to be a process that combines both horizontally and vertically forced end member models. A comparison between spontaneous and induced SI has been made by Maunder et al. (2020) where they conclude that FAB and boninites are only formed in their spontaneous SI models. However, our models with an ultra-slow or slow plate convergence also simulate an early stage of volcanism in case the upper plate is young enough, representing the close proximity of a mid-ocean ridge and transform corner.
Our 2D study aimed to analyse the transition from SI to mature subduction zone. We did not impose any proposed trench motion or subduction velocities, but trench retreat and thus the subduction velocity was driven by the forces within the system. Future 3D studies could focus on different plate convergence, mantle flow and subduction velocities. The processes we discuss are not site specific in first order in an attempt to address the main driving forces. Nevertheless, we can compare the models with the evolution of the well-studied IBM system, despite the model simplifications. Fluid and melt migrate according to a simplified fluid pressure gradient. Since we are using a regional model domain, one cannot include any influence of global scale mantle convection. Our 2D setup excludes complex 3D effects, such as the toroidal mantle flow component. This would have an effect on the evolution of the juvenile subduction zone such as on the melting and degree of depletion in the mantle wedge (e.g., Magni, 2019). Different thermal age gradients and 3D geometries of the WZ, i.e., the transform fault zone, need to be considered in future studies. The role of sediment subduction is not assessed on our models. Elastic rheology is not implemented, that would influence the stress-field evolution (e.g., Zhou and Wada, 2022).
The formation and juvenile evolution of intra-oceanic subduction zones were analysed by 2D petrological-thermo-mechanical numerical modelling and our results led to the following conclusions:
• Our models, in agreement with plate reconstructions in the Western Pacific (Wu et al., 2016; Reagan et al., 2019; Wu et al., 2022; Reagan et al., 2023), highlight the importance of plate convergence for intra-oceanic SI. Even small-rate convergence, i.e. 0.1 cm/yr, can facilitate transform collapse, sinking of the older and denser oceanic plate and extension of the overriding plate.
• Four stages of SI and juvenile evolution are inferred by our model series: i) SI triggered by the negative buoyancy of the older plate, ii) juvenile subduction accompanied by the development of a spreading ridge on the overriding plate within a few kilometers from the trench, iii) steepening of the slab and evolution of a poloidal mantle flow and iv) formation of a juvenile volcanic arc with subsequent arc maturation leading to mature subduction. Thereby, models without imposed horizontal force evolve faster than models that include a horizontal convergence velocity.
• Subduction initiation is linked to the collapse of the WZ contrasting thermal ages. Subduction persists when the WZ is wide and weak, while too narrow WZ only accommodate the early stage of convergence, but subduction then stalls.
• The depletion of the mantle wedge varies in time from subduction initiation to subduction maturation driven by the following processes: 1) previously depleted mantle flows from the mantle region below the spreading region and from the initial WZ to the gradually developing mantle wedge; 2) mantle fertilization is driven by the dehydration of the downgoing plate. The mantle material is pushed into the mantle wedge due to the poloidal flow and mixed with less depleted material due to small-scale thermal perturbations.
• The small-scale thermal perturbations observed in the models are generated by shear instabilities, being developed by the viscosity contrast between the partially molten decompression mantle melt of the spreading centre and the underlying asthenosphere.
• Driven by slab rollback, the distance between the spreading ridge and the mantle wedge gradually increases over time. Therefore, the two mantle domains affected by decompressional mantle melting and flux melting become laterally shifted as subduction progresses.
• A volcanic arc is formed ca. 5–15 Myrs after SI. Its initial source region is affected by both the depleted mantle flowing from the spreading centre and by the gradual hydration from the underlying slab. The composition of the juvenile volcanic arc is influenced by the partially decompressional molten region.
• Our model results are in a first order agreement with the spatial and temporal evolution proposed for the IBM and reconstruct the rock record of IBM.
• General factors preventing the formation of a mature and long-lasting subduction process are i) too low convergence rate together with too low thermal age contrast between the subducting and overriding plate, ii) too narrow WZ, preventing decompression mantle melt that is linked to the rise and exhumation of serpentinized and partially molten rocks, iii) cooling and early formation of lithosphere above the nascent slab and iv) too rapid cooling and strengthening of the juvenile mantle wedge.
• Weak zones such as transform fault zones are ideal locations for SI. However, despite their abundance, SI is rarely observed along such structures, implying the need of additional processes supporting the continuous sinking of the oceanic plates. Mantle plumes or slow plate convergence perpendicular to the strike to transforms are proposed to support transform collapse.
The datasets presented in this study can be found in online repositories. The names of the repository/repositories and accession number(s) can be found below: https://doi.org/10.5281/zenodo.8301270.
SR: Conceptualization, Visualization, Writing–original draft, Writing–review and editing. AB: Conceptualization, Supervision, Writing–review and editing. JR: Conceptualization, Supervision, Writing–review and editing. TG: Conceptualization, Funding acquisition, Supervision, Writing–review and editing.
The author(s) declare financial support was received for the research, authorship, and/or publication of this article. Open access funding by ETH Zurich. SR, AB, and TG acknowledge the financial support from SNSF grant no 192296.
All models were run on the Euler cluster at ETH Zurich. The visualization was performed with MATLAB and PyGMT. We acknowledge the editor for his work, Iris van Zelst and Bernhard Steinberger for their constructive and detailed comments.
The authors declare that the research was conducted in the absence of any commercial or financial relationships that could be construed as a potential conflict of interest.
The author(s) declared that they were an editorial board member of Frontiers, at the time of submission. This had no impact on the peer review process and the final decision.
All claims expressed in this article are solely those of the authors and do not necessarily represent those of their affiliated organizations, or those of the publisher, the editors and the reviewers. Any product that may be evaluated in this article, or claim that may be made by its manufacturer, is not guaranteed or endorsed by the publisher.
The Supplementary Material for this article can be found online at: https://www.frontiersin.org/articles/10.3389/feart.2024.1286468/full#supplementary-material
Agard, P., Prigent, C., Soret, M., Dubacq, B., Guillot, S., and Deldicque, D. (2020). Slabitization: mechanisms controlling subduction development and viscous coupling. Earth-Science Rev. 208, 103259. doi:10.1016/j.earscirev.2020.103259
Arcay, D., Abecassis, S., and Lallemand, S. (2023). Subduction initiation at an oceanic transform fault experiencing compression: role of the fault structure and of the brittle-ductile transition depth. Earth Planet. Sci. Lett. 618, 118272. doi:10.1016/j.epsl.2023.118272
Arcay, D., Lallemand, S., Abecassis, S., and Garel, F. (2020). Can subduction initiation at a transform fault be spontaneous? Solid earth. 11, 37–62. doi:10.5194/se-11-37-2020
Baes, M., Govers, R., and Wortel, R. (2011). Subduction initiation along the inherited weakness zone at the edge of a slab: insights from numerical models. Geophys. J. Int. 184, 991–1008. doi:10.1111/j.1365-246x.2010.04896.x
Baes, M., and Sobolev, S. V. (2017). Mantle flow as a trigger for subduction initiation: a missing element of the wilson cycle concept. Geochem. Geophys. Geosystems 18, 4469–4486. doi:10.1002/2017gc006962
Baitsch-Ghirardello, B., Gerya, T. V., and Burg, J.-P. (2014). Geodynamic regimes of intra-oceanic subduction: implications for arc extension vs. shortening processes. Gondwana Res. 25, 546–560. doi:10.1016/j.gr.2012.11.003
Cloetingh, S. A. P. L., Wortel, M., and Vlaar, N. (1982). Evolution of passive continental margins and initiation of subduction zones. Nature 297, 139–142. doi:10.1038/297139a0
Connolly, J. (2005). Computation of phase equilibria by linear programming: a tool for geodynamic modeling and its application to subduction zone decarbonation. Earth Planet. Sci. Lett. 236, 524–541. doi:10.1016/j.epsl.2005.04.033
Corradino, M., Balazs, A., Faccenna, C., and Pepe, F. (2022). Arc and forearc rifting in the Tyrrhenian subduction system. Sci. Rep. 12, 4813. doi:10.1038/s41598-022-08562-w
Cosca, M., Arculus, R. J., Pearce, J., and Mitchell, J. G. (1998). 40Ar/39Ar and K–Ar geochronological age constraints for the inception and early evolution of the Izu–Bonin - mariana arc system. Isl. Arc 7, 579–595. doi:10.1111/j.1440-1738.1998.00211.x
Crameri, F., Magni, V., Domeier, M., Shephard, G. E., Chotalia, K., Cooper, G., et al. (2020). A transdisciplinary and community-driven database to unravel subduction zone initiation. Nat. Commun. 11, 3750. doi:10.1038/s41467-020-17522-9
Crameri, F., Schmeling, H., Golabek, G., Duretz, T., Orendt, R., Buiter, S., et al. (2012). A comparison of numerical surface topography calculations in geodynamic modelling: an evaluation of the ‘sticky air’method. Geophys. J. Int. 189, 38–54. doi:10.1111/j.1365-246x.2012.05388.x
Dutkiewicz, A., Müller, R. D., Hogg, A. M., and Spence, P. (2016). Vigorous deep-sea currents cause global anomaly in sediment accumulation in the southern ocean. Geology 44, 663–666. doi:10.1130/g38143.1
England, P., Engdahl, R., and Thatcher, W. (2004). Systematic variation in the depths of slabs beneath arc volcanoes. Geophys. J. Int. 156, 377–408. doi:10.1111/j.1365-246X.2003.02132.x
Erickson, S. G. (1993). Sedimentary loading, lithospheric flexure, and subduction initiation at passive margins. Geology 21, 125–128. doi:10.1130/0091-7613(1993)021-0125:SLLFAS2.3.CO;2
Faccenda, M., Gerya, T. V., and Burlini, L. (2009). Deep slab hydration induced by bending-related variations in tectonic pressure. Nat. Geosci. 2, 790–793. doi:10.1038/ngeo656
Forsyth, D., and Uyeda, S. (1975). On the relative importance of the driving forces of plate motion. Geophys. J. Int. 43, 163–200. doi:10.1111/j.1365-246X.1975.tb00631.x
Fukao, Y., and Obayashi, M. (2013). Subducted slabs stagnant above, penetrating through, and trapped below the 660 km discontinuity. J. Geophys. Res. Solid Earth 118, 5920–5938. doi:10.1002/2013JB010466
Gerya, T. V., Bercovici, D., and Becker, T. W. (2021). Dynamic slab segmentation due to brittle–ductile damage in the outer rise. Nature 599, 245–250. doi:10.1038/s41586-021-03937-x
Gerya, T. V., Connolly, J. A., and Yuen, D. A. (2008). Why is terrestrial subduction one-sided? Geology 36, 43–46. doi:10.1130/g24060a.1
Gerya, T. V., Connolly, J. A., Yuen, D. A., Gorczyk, W., and Capel, A. M. (2006). Seismic implications of mantle wedge plumes. Phys. Earth Planet. Interiors 156, 59–74. doi:10.1016/j.pepi.2006.02.005
Gerya, T. V., and Meilick, F. (2011). Geodynamic regimes of subduction under an active margin: effects of rheological weakening by fluids and melts. J. Metamorph. Geol. 29, 7–31. doi:10.1111/j.1525-1314.2010.00904.x
Gerya, T. V., and Yuen, D. A. (2003). Characteristics-based marker-in-cell method with conservative finite-differences schemes for modeling geological flows with strongly variable transport properties. Phys. Earth Planet. Interiors 140, 293–318. doi:10.1016/j.pepi.2003.09.006
Gerya, T. V., and Yuen, D. A. (2007). Robust characteristics method for modelling multiphase visco-elasto-plastic thermo-mechanical problems. Phys. Earth Planet. Interiors 163, 83–105. doi:10.1016/j.pepi.2007.04.015
Gorczyk, W., Willner, A. P., Gerya, T. V., Connolly, J. A., and Burg, J.-P. (2007). Physical controls of magmatic productivity at Pacific-type convergent margins: numerical modelling. Phys. Earth Planet. Interiors 163, 209–232. doi:10.1016/j.pepi.2007.05.010
Gregory, E. P., Singh, S. C., Marjanović, M., and Wang, Z. (2021). Serpentinized peridotite versus thick mafic crust at the romanche oceanic transform fault. Geology 49, 1132–1136. doi:10.1130/g49097.1
Grove, T. L., Till, C. B., and Krawczynski, M. J. (2012). The role of H2O in subduction zone magmatism. Annu. Rev. Earth Planet. Sci. 40, 413–439. doi:10.1146/annurev-earth-042711-105310
Gurnis, M., Hall, C., and Lavier, L. (2004). Evolving force balance during incipient subduction. Geochem. Geophys. Geosystems 5. doi:10.1029/2003GC000681
Hall, C. E., Gurnis, M., Sdrolias, M., Lavier, L. L., and Müller, R. (2003). Catastrophic initiation of subduction following forced convergence across fracture zones. Earth Planet. Sci. Lett. 212, 15–30. doi:10.1016/S0012-821X(03)00242-5
Hensen, C., Duarte, J. C., Vannucchi, P., Mazzini, A., Lever, M. A., Terrinha, P., et al. (2019). Marine transform faults and fracture zones: a joint perspective integrating seismicity, fluid flow and life. Front. Earth Sci. 7, 39. doi:10.3389/feart.2019.00039
Hickey-Vargas, R., Yogodzinski, G., Ishizuka, O., McCarthy, A., Bizimis, M., Kusano, Y., et al. (2018). Origin of depleted basalts during subduction initiation and early development of the izu-bonin-mariana island arc: evidence from iodp expedition 351 site u1438, amami-sankaku basin. Geochimica Cosmochimica Acta 229, 85–111. doi:10.1016/j.gca.2018.03.007
Hilairet, N., Reynard, B., Wang, Y., Daniel, I., Merkel, S., Nishiyama, N., et al. (2007). High-pressure creep of serpentine, interseismic deformation, and initiation of subduction. Science 318, 1910–1913. doi:10.1126/science.1148494
Hochstaedter, A., Gill, J., Peters, R., Broughton, P., Holden, P., and Taylor, B. (2001). Across-arc geochemical trends in the izu-bonin arc: contributions from the subducting slab. Geochem. Geophys. Geosystems 2. doi:10.1029/2000gc000105
Hyndman, R. D., and Peacock, S. M. (2003). Serpentinization of the forearc mantle. Earth Planet. Sci. Lett. 212, 417–432. doi:10.1016/S0012-821X(03)00263-2
Ishizuka, O., Kimura, J.-I., Li, Y. B., Stern, R. J., Reagan, M. K., Taylor, R. N., et al. (2006). Early stages in the evolution of Izu–Bonin arc volcanism: new age, chemical, and isotopic constraints. Earth Planet. Sci. Lett. 250, 385–401. doi:10.1016/j.epsl.2006.08.007
Ishizuka, O., Tani, K., Reagan, M. K., Kanayama, K., Umino, S., Harigane, Y., et al. (2011a). The timescales of subduction initiation and subsequent evolution of an oceanic island arc. Earth Planet. Sci. Lett. 306, 229–240. doi:10.1016/j.epsl.2011.04.006
Ishizuka, O., Taylor, R. N., Ohara, Y., and Yuasa, M. (2013). Upwelling, rifting, and age-progressive magmatism from the oki-daito mantle plume. Geology 41, 1011–1014. doi:10.1130/g34525.1
Ishizuka, O., Taylor, R. N., Umino, S., and Kanayama, K. (2020). Geochemical evolution of arc and slab following subduction initiation: a record from the bonin islands, Japan. J. Petrology 61, egaa050. doi:10.1093/petrology/egaa050
Ishizuka, O., Taylor, R. N., Yuasa, M., and Ohara, Y. (2011b). Making and breaking an island arc: a new perspective from the oligocene kyushu-Palau arc, philippine sea. Geochem. Geophys. Geosystems 12. doi:10.1029/2010gc003440
Iwamori, H. (1998). Transportation of H2O and melting in subduction zones. Earth Planet. Sci. Lett. 160, 65–80. doi:10.1016/S0012-821X(98)00080-6
Katz, R. F., Spiegelman, M., and Langmuir, C. H. (2003). A new parameterization of hydrous mantle melting. Geochem. Geophys. Geosystems 4. doi:10.1029/2002GC000433
Kelley, K. A., Plank, T., Grove, T. L., Stolper, E. M., Newman, S., and Hauri, E. (2006). Mantle melting as a function of water content beneath back-arc basins. J. Geophys. Res. Solid Earth 111. doi:10.1029/2005JB003732
Lallemand, S., and Arcay, D. (2021). Subduction initiation from the earliest stages to self-sustained subduction: insights from the analysis of 70 Cenozoic sites. Earth-Science Rev. 221, 103779. doi:10.1016/j.earscirev.2021.103779
Leng, W., and Gurnis, M. (2015). Subduction initiation at relic arcs. Geophys. Res. Lett. 42, 7014–7021. doi:10.1002/2015GL064985
Li, H.-Y., Taylor, R. N., Prytulak, J., Kirchenbaur, M., Shervais, J. W., Ryan, J. G., et al. (2019). Radiogenic isotopes document the start of subduction in the Western Pacific. Earth Planet. Sci. Lett. 518, 197–210. doi:10.1016/j.epsl.2019.04.041
Magni, V. (2019). The effects of back-arc spreading on arc magmatism. Earth Planet. Sci. Lett. 519, 141–151. doi:10.1016/j.epsl.2019.05.009
Mart, Y., Aharonov, E., Mulugeta, G., Ryan, W., Tentler, T., and Goren, L. (2005). Analogue modelling of the initiation of subduction. Geophys. J. Int. 160, 1081–1091. doi:10.1111/j.1365-246X.2005.02544.x
Matsumoto, T., and Tomoda, Y. (1983). Numerical simulation of the initiation of subduction at the fracture zone. J. Phys. Earth 31, 183–194. doi:10.4294/jpe1952.31.183
Maunder, B., Prytulak, J., Goes, S., and Reagan, M. (2020). Rapid subduction initiation and magmatism in the Western Pacific driven by internal vertical forces. Nat. Commun. 11, 1874. doi:10.1038/s41467-020-15737-4
McCulloch, M. T., and Gamble, J. (1991). Geochemical and geodynamical constraints on subduction zone magmatism. Earth Planet. Sci. Lett. 102, 358–374. doi:10.1016/0012-821x(91)90029-h
Nijholt, N., and Govers, R. (2015). The role of passive margins on the evolution of subduction-transform edge propagators (steps). J. Geophys. Res. Solid Earth 120, 7203–7230. doi:10.1002/2015jb012202
Nikolaeva, K., Gerya, T. V., and Connolly, J. A. D. (2008). Numerical modelling of crustal growth in intraoceanic volcanic arcs. Phys. Earth Planet. Interiors 171, 336–356. doi:10.1016/j.pepi.2008.06.026
Nikolaeva, K., Gerya, T. V., and Marques, F. O. (2010). Subduction initiation at passive margins: numerical modeling. J. Geophys. Res. Solid Earth 115. doi:10.1029/2009JB006549
Nikolaeva, K., Gerya, T. V., and Marques, F. O. (2011). Numerical analysis of subduction initiation risk along the Atlantic American passive margins. Geology 39, 463–466. doi:10.1130/g31972.1
Parsons, B., and Sclater, J. G. (1977). An analysis of the variation of ocean floor bathymetry and heat flow with age. J. Geophys. Res. 82, 803–827. doi:10.1029/jb082i005p00803
Pearce, J. A., and Stern, R. J. (2006). “Origin of back-arc basin magmas: trace element and isotope perspectives,” in Geophysical monograph series. Editors D. M. Christie, C. R. Fisher, S.-M. Lee, and S. Givens (Washington, D. C.: American Geophysical Union), 63–86. doi:10.1029/166GM06
Pearce, J. A., Stern, R. J., Bloomer, S. H., and Fryer, P. (2005). Geochemical mapping of the mariana arc-basin system: implications for the nature and distribution of subduction components. Geochem. Geophys. geosystems 6. doi:10.1029/2004gc000895
Reagan, M. K., Heaton, D. E., Schmitz, M. D., Pearce, J. A., Shervais, J. W., and Koppers, A. A. (2019). Forearc ages reveal extensive short-lived and rapid seafloor spreading following subduction initiation. Earth Planet. Sci. Lett. 506, 520–529. doi:10.1016/j.epsl.2018.11.020
Reagan, M. K., Ishizuka, O., Stern, R. J., Kelley, K. A., Ohara, Y., Blichert-Toft, J., et al. (2010). Fore-arc basalts and subduction initiation in the Izu-Bonin-Mariana system. Geochem. Geophys. Geosystems 11. doi:10.1029/2009GC002871
Reagan, M. K., Pearce, J. A., Petronotis, K., Almeev, R. R., Avery, A. J., Carvallo, C., et al. (2017). Subduction initiation and ophiolite crust: new insights from iodp drilling. Int. Geol. Rev. 59, 1439–1450. doi:10.1080/00206814.2016.1276482
Reagan, M. K., Pearce, J. A., Shervais, J., and Christeson, G. L. (2023). Subduction initiation as recorded in the izu-bonin-mariana forearc. Earth-science Rev. 246, 104573. doi:10.1016/j.earscirev.2023.104573
Resing, J. A., Rubin, K. H., Embley, R. W., Lupton, J. E., Baker, E. T., Dziak, R. P., et al. (2011). Active submarine eruption of boninite in the northeastern Lau Basin. Nat. Geosci. 4, 799–806. doi:10.1038/ngeo1275
Ribeiro, J., MacLeod, C., Lissenberg, J., Ryan, J., and Macpherson, C. (2022). Origin and evolution of the slab fluids since subduction inception in the Izu-Bonin-Mariana: a comparison with the southeast Mariana fore-arc rift. Chem. Geol. 601, 120813. doi:10.1016/j.chemgeo.2022.120813
Ribeiro, J. M., Ishizuka, O., Lee, C.-T. A., and Girard, G. (2020). Evolution and maturation of the nascent Mariana arc. Earth Planet. Sci. Lett. 530, 115912. doi:10.1016/j.epsl.2019.115912
Rüpke, L. H., Morgan, J. P., Hort, M., and Connolly, J. A. (2004). Serpentine and the subduction zone water cycle. Earth Planet. Sci. Lett. 223, 17–34. doi:10.1016/j.epsl.2004.04.018
Schmidt, M. W., and Poli, S. (1998). Experimentally based water budgets for dehydrating slabs and consequences for arc magma generation. Earth Planet. Sci. Lett. 163, 361–379. doi:10.1016/S0012-821X(98)00142-3
Seno, T., and Maruyama, S. (1984). Paleogeographic reconstruction and origin of the philippine sea. Tectonophysics 102, 53–84. doi:10.1016/0040-1951(84)90008-8
Shervais, J. W., Reagan, M., Haugen, E., Almeev, R. R., Pearce, J. A., Prytulak, J., et al. (2019). Magmatic response to subduction initiation: Part 1. fore-arc basalts of the izu-bonin arc from iodp expedition 352. Geochem. Geophys. Geosystems 20, 314–338. doi:10.1029/2018gc007731
Shervais, J. W., Reagan, M. K., Godard, M., Prytulak, J., Ryan, J. G., Pearce, J. A., et al. (2021). Magmatic response to subduction initiation, part ii: boninites and related rocks of the izu-bonin arc from iodp expedition 352. Geochem. Geophys. Geosystems 22, e2020GC009093. doi:10.1029/2020gc009093
Stern, B. (2004). Subduction initiation: spontaneous and induced. Earth Planet. Sci. Lett. 226, 275–292. doi:10.1016/j.epsl.2004.08.007
Stern, R., Reagan, M., Ishizuka, O., Ohara, Y., and Whattam, S. (2012). To understand subduction initiation, study forearc crust: to understand forearc crust, study ophiolites. Lithosphere 4, 469–483. doi:10.1130/L183.1
Stern, R. J., and Bloomer, S. H. (1992). Subduction zone infancy: examples from the Eocene Izu-Bonin-Mariana and Jurassic California arcs. Geol. Soc. Am. Bull. 104, 1621–1636. doi:10.1130/0016-7606(1992)104<1621:szieft>2.3.co;2
Stern, R. J., and Gerya, T. (2018). Subduction initiation in nature and models: a review. Tectonophysics 746, 173–198. doi:10.1016/j.tecto.2017.10.014
Syracuse, E. M., and Abers, G. A. (2006). Global compilation of variations in slab depth beneath arc volcanoes and implications. Geochem. Geophys. Geosystems 7. doi:10.1029/2005GC001045
Tamura, Y., Ishizuka, O., Stern, R., Shukuno, H., Kawabata, H., Embley, R., et al. (2011). Two primary basalt magma types from northwest rota-1 volcano, mariana arc and its mantle diapir or mantle wedge plume. J. Petrology 52, 1143–1183. doi:10.1093/petrology/egr022
Thielmann, M., and Kaus, B. J. (2012). Shear heating induced lithospheric-scale localization: does it result in subduction? Earth Planet. Sci. Lett. 359-360, 1–13. doi:10.1016/j.epsl.2012.10.002
Toth, J., and Gurnis, M. (1998). Dynamics of subduction initiation at preexisting fault zones. J. Geophys. Res. Solid Earth 103, 18053–18067. doi:10.1029/98JB01076
Tucker, J. M., van Keken, P. E., Jones, R. E., and Ballentine, C. J. (2020). A role for subducted oceanic crust in generating the depleted mid-ocean ridge basalt mantle. Geochem. Geophys. Geosystems 21, e2020GC009148. doi:10.1029/2020gc009148
Ueda, K., Gerya, T., and Sobolev, S. V. (2008). Subduction initiation by thermal-chemical plumes: numerical studies. Phys. Earth Planet. Interiors 171, 296–312. doi:10.1016/j.pepi.2008.06.032
Ueda, K., Gerya, T. V., and Burg, J.-P. (2012). Delamination in collisional orogens: thermomechanical modeling. J. Geophys. Res. Solid Earth 117. doi:10.1029/2012JB009144
van Keken, P. E., Hacker, B. R., Syracuse, E. M., and Abers, G. A. (2011). Subduction factory: 4. Depth-dependent flux of H2O from subducting slabs worldwide. J. Geophys. Res. Solid Earth 116, B01401. doi:10.1029/2010JB007922
Vogt, K., Gerya, T. V., and Castro, A. (2012). Crustal growth at active continental margins: numerical modeling. Phys. Earth Planet. Interiors 192-193, 1–20. doi:10.1016/j.pepi.2011.12.003
Wu, J., Lin, Y.-A., Flament, N., Wu, J. T.-J., and Liu, Y. (2022). Northwest pacific-izanagi plate tectonics since cretaceous times from western pacific mantle structure. Earth Planet. Sci. Lett. 583, 117445. doi:10.1016/j.epsl.2022.117445
Wu, J., Suppe, J., Lu, R., and Kanda, R. (2016). Philippine Sea and East Asian plate tectonics since 52 Ma constrained by new subducted slab reconstruction methods. J. Geophys. Res. Solid Earth 121, 4670–4741. doi:10.1002/2016JB012923
Zheng, Y.-F. (2019). Subduction zone geochemistry. Geosci. Front. 10, 1223–1254. doi:10.1016/j.gsf.2019.02.003
Zheng, Y.-F., and Hermann, J. (2014). Geochemistry of continental subduction-zone fluids. Earth, Planets Space 66, 93–16. doi:10.1186/1880-5981-66-93
Zhong, S., and Gurnis, M. (1995). Mantle convection with plates and mobile, faulted plate margins. Science 267, 838–843. doi:10.1126/science.267.5199.838
Zhou, X., and Wada, I. (2021). Differentiating induced versus spontaneous subduction initiation using thermomechanical models and metamorphic soles. Nat. Commun. 12, 4632. doi:10.1038/s41467-021-24896-x
Keywords: subduction initiation, subduction evolution, volcanic arc, numerical modelling, Izu-Bonin-Mariana
Citation: Ritter S, Balázs A, Ribeiro J and Gerya T (2024) Magmatic fingerprints of subduction initiation and mature subduction: numerical modelling and observations from the Izu-Bonin-Mariana system. Front. Earth Sci. 12:1286468. doi: 10.3389/feart.2024.1286468
Received: 31 August 2023; Accepted: 25 January 2024;
Published: 15 February 2024.
Edited by:
Nibir Mandal, Jadavpur University, IndiaReviewed by:
Iris Van Zelst, German Aerospace Center (DLR), GermanyCopyright © 2024 Ritter, Balázs, Ribeiro and Gerya. This is an open-access article distributed under the terms of the Creative Commons Attribution License (CC BY). The use, distribution or reproduction in other forums is permitted, provided the original author(s) and the copyright owner(s) are credited and that the original publication in this journal is cited, in accordance with accepted academic practice. No use, distribution or reproduction is permitted which does not comply with these terms.
*Correspondence: Sandrine Ritter, c2FuZHJpbmUucml0dGVyQGVyZHcuZXRoei5jaA==
Disclaimer: All claims expressed in this article are solely those of the authors and do not necessarily represent those of their affiliated organizations, or those of the publisher, the editors and the reviewers. Any product that may be evaluated in this article or claim that may be made by its manufacturer is not guaranteed or endorsed by the publisher.
Research integrity at Frontiers
Learn more about the work of our research integrity team to safeguard the quality of each article we publish.