
94% of researchers rate our articles as excellent or good
Learn more about the work of our research integrity team to safeguard the quality of each article we publish.
Find out more
ORIGINAL RESEARCH article
Front. Earth Sci., 03 July 2024
Sec. Sedimentology, Stratigraphy and Diagenesis
Volume 12 - 2024 | https://doi.org/10.3389/feart.2024.1277642
This article is part of the Research TopicChemostratigraphy of Carbonate Systems Through Time and Space: From Continental to Deep-Water RecordsView all 4 articles
 E. J. Biebesheimer*
 M. B. Suarez*
Introduction: The Yucca Formation is a Lower Cretaceous sedimentary unit present in West Texas. Based on its relative stratigraphic position in the Cretaceous succession of West Texas, it is expected that the Yucca Formation is of Albian and/or Aptian age. It is also expected that the carbon isotope excursions associated with OAE 1a and OAE 1b should be identified in the Yucca Formation. The goals of this project are to 1. construct a carbon isotope chemostratigraphic record of the Yucca Formation, and 2. correlate the Yucca Formation with strata of similar age using chemostratigraphy.
Methods: 163 samples were collected from Big Bend Ranch State Park (BBRSP) to determine the δ13C value of bulk sedimentary organic matter.
Results: C-isotope values range from −27.02‰ to −18.42‰.
Discussion: Carbon isotope excursions (CIEs) that are associated with the Aptian-Albian Boundary are identified as well as CIEs associated with Oceanic Anoxic Events (1a and 1b). This allows us to conclude that the Aptian-Albian boundary is recorded within the Yucca Formation strata at about 71 m above the base of the section exposed in the Lower Shutup of the Solitario in Big Bend Ranch State Park. Regional correlation of the Yucca Formation to other chemostratigraphic records from other Cretaceous strata suggests that the Yucca Formation in BBRSP is time equivalent to the Sligo, Pine Island, James, Bexar, and a portion of the lower Glen Rose Formation on the Comanche Platform and to a portion of the lower Glen Rose Formation in Big Bend National Park.
The Cretaceous Period is known as a time of great change in Earth history, with major evolutionary advances (expansion of angiosperms, marine Mesozoic revolution, major paleogeographic and tectonic changes) (Jenkyns, 2003; Lloyd et al., 2008; Föllmi, 2011; Hay and Ploegel, 2017; Gale et al., 2020). Cretaceous marine rocks are characterized by widespread carbonate deposition interrupted by periodic episodes of organic carbon-rich deposition. These episodes are manifested lithologically as laminated organic rich shales and limestones and are thought to represent oceanic anoxic events (OAEs).
Such dramatic changes to the carbon cycle resulted in changes to the carbon isotope values of the different carbon reservoirs and, potentially, climatic changes. Previous work has shown that there were indeed large, drastic changes to paleoclimate throughout the Cretaceous (Jenkyns, 2003; Jenkyns, 2010; Föllmi, 2011; McAnena et al., 2013; Hay and Ploegel, 2017), many of which are coincident with large positive or negative carbon isotope excursions (CIEs) in the stratigraphic record of marine and terrestrial carbonate carbon or bulk organic carbon. These excursions are currently thought to have been caused by a rapid influx of CO2 from methanogenic and/or volcanic forces (negative excursion) and the following increase in organic carbon production and burial from increased nutrient runoff due to increased weathering rates (positive excursion) (Jenkyns, 2010; Wang et al., 2022). How such climate changes affected the ecology and organisms on a more regional level requires time constrained paleoclimate records. A better understanding of the timing, triggers, and responses of climate shifts during an overall greenhouse climate may help us better predict how current changes in climate may affect life on Earth in the coming decades.
The Yucca Formation is one of the most southern edges of Cretaceous strata in Laramidia (the western landmass of North America in the Cretaceous) (Figure 1). It is a Lower Cretaceous sedimentary unit found throughout West Texas (Herrin, 1957; Amsbury, 1958; Campbell, 1980; Corry et al., 1990; Li, 2014) that is thought to be late Aptian and/or early Albian in age (Herrin, 1957; Campbell, 1980; Li, 2014). However, this is still unconfirmed, and the assignment is based primarily on its position within the sequence of Cretaceous marine strata in the region. The Yucca Formation overlies the locally deposited Shutup Conglomerate and underlies the widespread Glen Rose Formation (Amsbury, 1958; Maxwell et al., 1967; Smith, 1970; Campbell, 1980; Corry et al., 1990; McCormick et al., 1996; Scott et al., 2007). Traditional correlations using biostratigraphy are not resolved for the Yucca Formation because to date, few biostratigraphically significant fossils have been identified (McCormick et al., 1996). The Cretaceous ammonite Dufrenoyia justinae has been found in the Yucca Formation and is attributed to the Aptian stage, representing ∼13 million years (Stoyanow, 1949; Young, 1974; Renz, 1982; Emerson et al., 1994; Henry and Muehlberger, 1996; Barragán, 2001; Barragán and Maurrasse, 2008; Barragán et al., 2021), but otherwise, no other biostratigraphically constrained taxa have been identified. While this is consistent with the inferred age based on the overlying Glen Rose Formation, this study aims to provide greater relative age resolution for the Yucca Formation. In addition, the Yucca Formation is lithologically and depositionally diverse as it represents terrestrial to marine environments, which complicates attempts at stratigraphic correlation through both lithology and biostratigraphy. This is further compounded by the fact that no absolute dates have been published for any outcrops of the Yucca Formation across West Texas to this point.
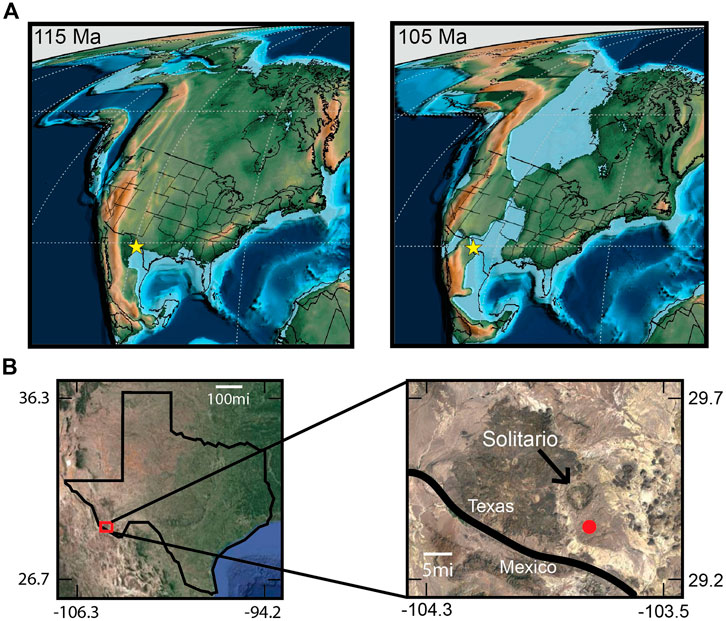
Figure 1. Maps marking the study location. (A) Paleogeographic map of the North American during the Aptian (left) and Albian (right) with the study location marked by a yellow star. Modified from Scotese, 2021. (B) Modern day map of the state of Texas. The pop-out box shows a closer view of the study area in Big Bend Ranch State Park. The sampling location is marked with a red dot, the arrow points at the Solitario, and the black line represents the United States of America–Mexico border.
The primary goal of this project is to produce a stable isotope chemostratigraphic record for the Yucca Formation to improve its overall age constraint. This chemostratigraphic record can then be compared to other, better time constrained strata of the Cretaceous Period. Carbon isotope chemostratigraphy offers a means of relative correlation between depositional systems (for example,: Scholle and Arthur, 1980; Herrle et al., 2004; Ludvigson et al., 2010; Ludvigson et al., 2015). Scholle and Arthur (1980) was one of the first studies to recognize the utility of carbon isotope chemostratigraphy, especially in Cretaceous strata. Since then, many have utilized chemostratigraphic records to improve stratigraphic correlations, especially when other means of correlation are lacking (Ludvigson et al., 2010; Saltzman and Thomas, 2012; Ludvigson et al., 2015). This is common practice for strata in the Cretaceous due to the lack of useful fossils for biostratigraphic correlation between marine and terrestrial strata and the geologic synchroneity of carbon isotope signature in various sedimentary basins, regardless of lithologic differences (Scholle and Arthur, 1980; Herrle et al., 2004; Ludvigson et al., 2010; Ludvigson et al., 2015). In combination with biostratigraphy and/or geochronology, the carbon isotope chemostratigraphic record of different localities can greatly improve relative age constraints, especially if correlations can be made to time constrained carbon isotope records. Based on its lithostratigraphic position and the limited biostratigraphy, we hypothesize that CIEs associated with OAE 1a and the OAE 1b set should be resolvable in this section.
Along with the underlying Shutup Conglomerate, the Yucca Formation represents some of the oldest Cretaceous strata in Big Bend Ranch State Park near the structural feature (an exposed volcanic dome) known as the Solitario (Figure 2). During the time of deposition in the early Cretaceous, this area existed along the Northeast margin of the Chihuahua trough (Muehlberger, 1980; Reck, 1980) (Figure 3). The Chihuahua Trough was a Mesozoic rift basin formed in the Jurassic that occupied the northeastern Mexican states of Chihuahua and Sonora in Mexico and parts of the Trans-Pecos Texas and New Mexico regions in the U.S. (Muehlberger, 1980; Smith, 1981; Haenggi, 2002). It was related to displacement along the Mojave-Sonora megashear and the opening and subsidence of the Gulf of Mexico basin in the late Jurassic (Muehlberger, 1980; Smith, 1981; Anderson and Schmidt, 1983; Salvador, 1987). In the late Jurassic and Early Cretaceous, it was connected to the Sabinas basin to the southeast and joined the Bisbee basin to the northwest (Haeggi, 2002). During the Aptian and Albian stages, the area was being flooded by the Jurassic-Cretaceous transgression that occurred across the North American Craton (Salvador, 1987) and resulted in the formation of the Mid-Cretaceous Interior Seaway. By Early Aptian, the ancient shoreline was in a place such that marine sedimentation had begun in the area, and carbonate sedimentation shortly began to dominate (McCormick et al., 1996). The area of Big Bend Ranch State Park was located along the tectonic hinge line between the Chihuahua trough and the Texas Craton (Salvador, 1987), and the strata was deposited primarily on the flank of the Chihuahua trough (Muehlberger, 1980).
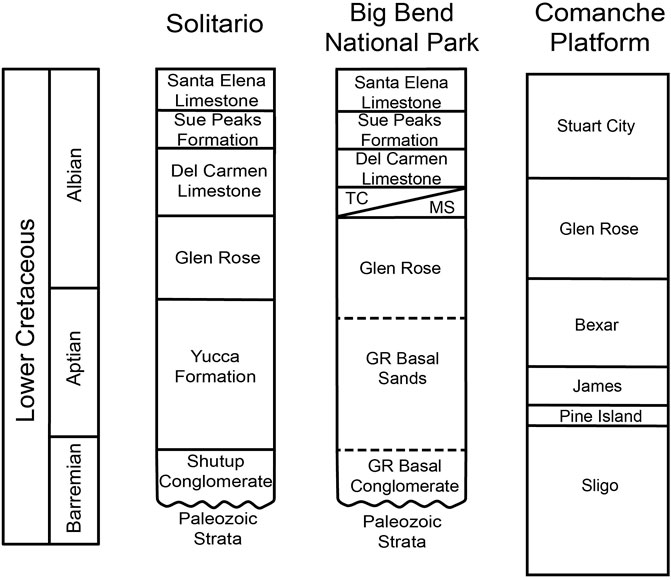
Figure 2. Correlation of Lower Cretaceous formations throughout Southern Texas. Solitario stratigraphic column edited from McCormick et al. (1996), Big Bend National Park stratigraphic column from Maxwell et al. (1957), and Comanche Platform stratigraphic column edited from Phelps et al. (2015). In the Big Bend National Park stratigraphic column, TC stands for ‘Telephone Canyon’ unit, MS stands for ‘Maxon Sandstone’ unit, GR stands for Glen Rose.
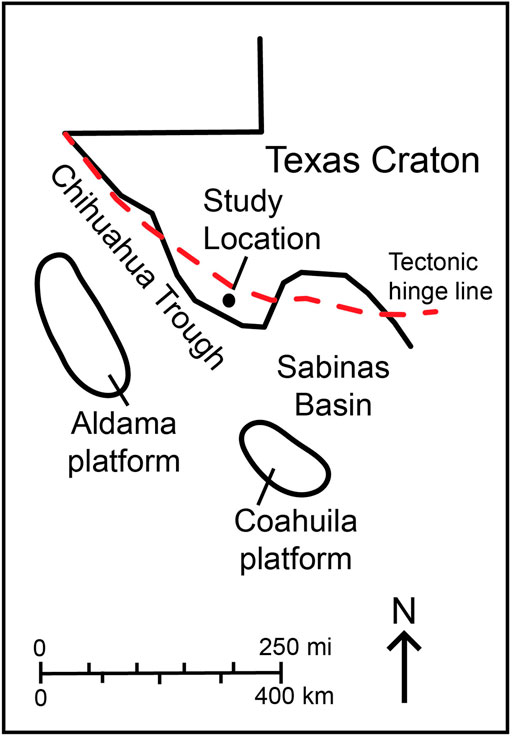
Figure 3. Early Cretaceous tectonic elements and paleogeography of West Texas and Northern Mexico. The black line unclosed represents the modern day border of Texas. The red dashed line represents the edge of the Texas craton. Edited from McCormick et al. (1996).
We sampled 142.78 m of Yucca Formation strata from an outcrop located in the Lower Shutup (a southward drainage) of the Solitario within Big Bend Ranch State Park (Figure 1). Sampling began 2 m above the top of the Shutup Conglomerate on the eastern side of the Shutup as it was easier to traverse, had a clear starting point, and better exposure. The aim was to collect samples every 25 cm up section in the dip direction, but this interval was often adjusted due to cover or accessibility issues. During sampling, observations including color, lithology, sedimentary structures, fossils, and any other noteworthy features, were recorded. Field descriptions (visual observations with the unaided eye and aided by hand lens), supplemented by thin section analyses were used to identify facies within the studied outcrop. Figure 4 shows the line of section from which samples were collected. Sampling of the Yucca Formation occurred along five sections: Sections 21-1, 21-2, 21-3, 22-1, and 22-2 (Figure 4; Figure 5). These sections were sampled during two field seasons, one in winter of 2021 (sections 21-1, 21-2, and 21-3) and the other in winter of 2022 (sections 22-1 and 22-2). Section numbers were based on sampling groupings of continuous section. Where section became covered or in-accessible, new section numbers were designated and sampling resumed either by side-stepping along marker beds or skipping covered intervals. The contact between the Yucca Formation and the overlying Glen Rose Formation was measured at 173.48 m above the base of the section (contact between the Shutup Conglomerate and Yucca Formation). Due to accessibility, exposure, and time constraints, sampling stopped at 142.78 m.
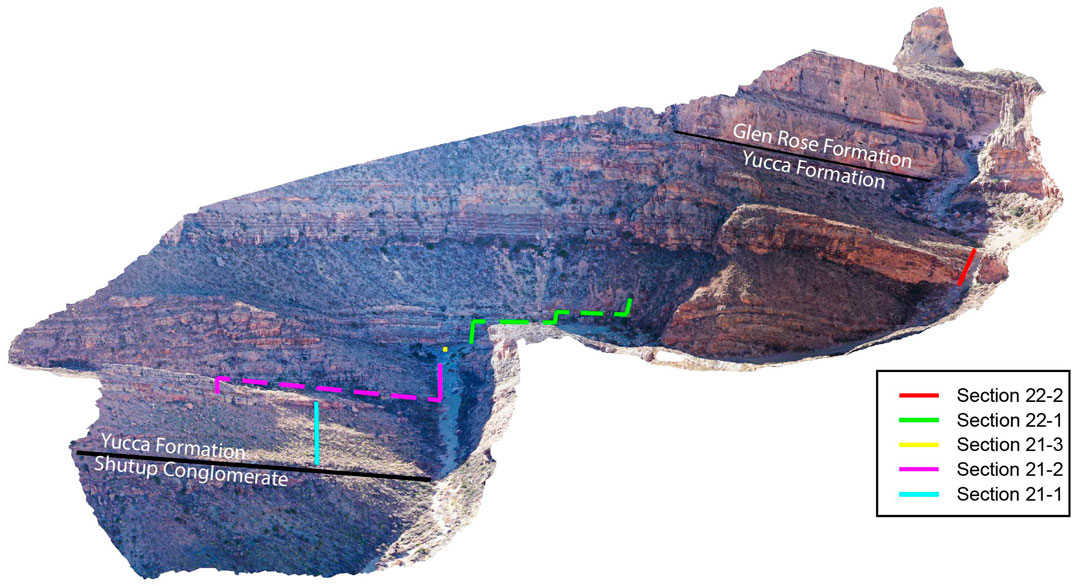
Figure 4. Aerial drone photo of the Yucca Formation outcrop in the Lower Shutup of Big Bend Ranch State Park. Colored lines denote the paths taken for sampling of each section. Dashed lines indicated where beds were traversed to reach better exposure. Black lines denote contacts between formations.
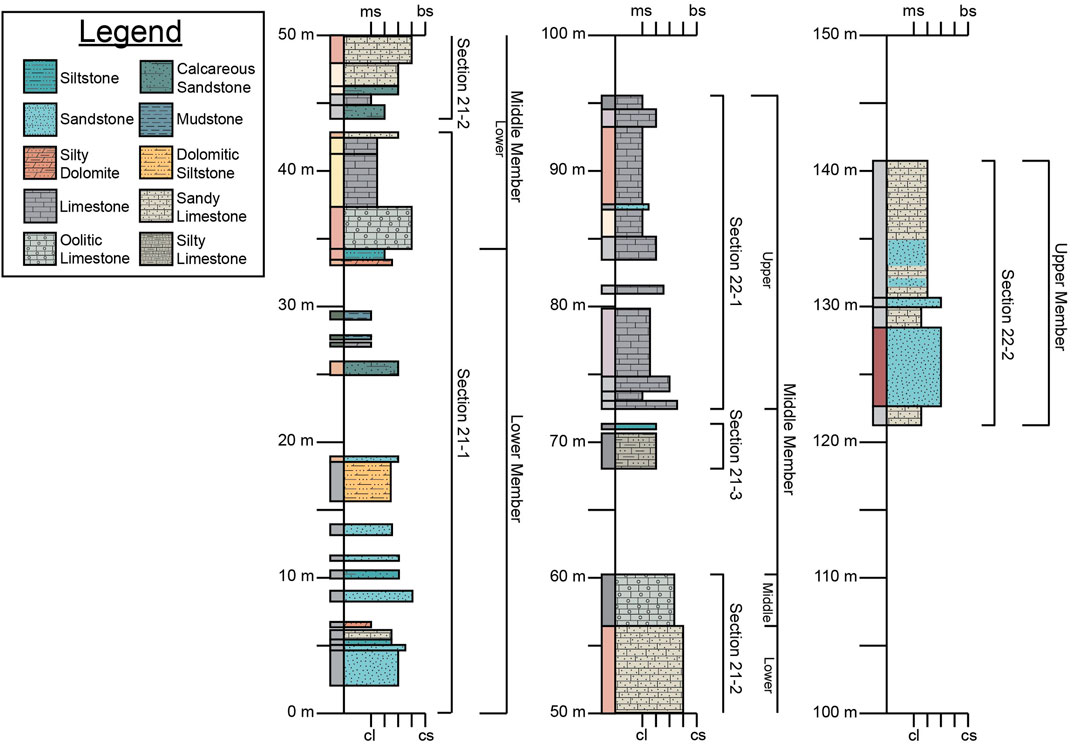
Figure 5. Lithostratigraphic column of the Yucca Formation in the Lower Shutup of Big Bend Ranch State Park. Boxes to the left of the vertical axis show hand sample coloration whereas the boxes to the right are colored and patterned based on lithology (see legend). Gaps in the column indicated unsampled strata due to high amounts of cover, float, and/or inaccessibility. Lower x-axis scale is for siliciclastic grain size from claystone (cl) to coarse sandstone (cs). Upper x-axis scale is for carbonates based on the Dunham classification from mudstone (ms) to boundstone (bs). The brackets to the right of the lithostratigraphy are our measured sections (Sections 21-1, 21-2, 21-3, 22-1, and 22-2) and the interpreted informal members of McCormick et al. (1996). Detailed sample descriptions are available in the Supplementary Material.
Samples were cut with a water-cooled rock saw to expose fresh surfaces. Depending on sample hardness, the samples were powdered by either drilling with aluminum carbide or diamond coated drill bits or by grinding using a mortar and pestle. The resulting powders were weighed and placed into 50 mL centrifuge tubes. Samples were decarbonated with approximately 30 mL of 0.5 Molar HCl for 24 h. Samples were centrifuged and acid decanted, after which fresh acid was added to determine if the samples were fully decarbonated. If samples continued to react, they were left to continue to decarbonate until all carbonate was fully removed. Samples were rinsed by adding approximately 40 mL of deionized water to the centrifuge tubes and shaking them until the water and sediment were fully mixed. After full mixing, samples were rinsed repeatedly by centrifuging for approximately five to 10 minutes and decanting at least three times. After the third rinse, the pH of the water in the sample was tested. Rinsing continued until the water in the sample was no longer more acidic than the rinse water. Samples were dried in a low temperature oven (∼65°C) and weighed to determine carbonate mass loss. Samples were re-homogenized into a fine powder using a mortar and pestle. The finished sample powders were stored in individual borosilicate vials until it was time to analyze them.
163 bulk organic carbon samples were measured for δ13Corg values throughout the entire measured Yucca Formation. The samples were analyzed at the Keck Paleoenvironmental and Environmental Stable Isotope Lab (KPESIL) at the University of Kansas. Samples were weighed into 4 mm x 6 mm or 5 mm x 8 mm tin capsules (depending on how much sample was needed) and combusted on a Costech 4,010 Elemental Analyzer, and the resulting CO2 was analyzed on a Thermofinnigan MAT 253 isotope ratio mass spectrometer (IRMS). Sample sizes ranged from 1.4 mg to 80.7 mg depending on the amount of organic carbon necessary to produce measurable CO2 determined by analyses of a set of pilot samples. Isotope ratios were corrected to VPDB (Vienna Pee Dee Belemnite) scale using internal and international standards: IAEA-600 (caffeine, δ13C = −27.77‰), ANU Sucrose (newly named IAEA-C6, sucrose, δ13C = −10.80‰), USGS-24 (graphite, δ13C = −16.05‰), MT Soil (Montana soil, δ13C = −17.20‰), and Peach Leaf (δ13C = −26.20‰). The reproducibility was monitored by repeated analyses of Dogfish muscle (DORM) and Costech Atropine and is reported as+/-0.1‰.
During carbon isotopic analyses, the weight percent of organic carbon in the samples was measured. This percentage was then used to calculate the total mass of carbon in the decarbonated sample. First, the mass of organic carbon in the decarbonated sample was calculated using the measured weight percent of organic carbon in the analyzed sample and the decarbonated sample mass.
The mass of organic carbon in the decarbonated sample was then used with the initial sample mass to calculate the percentage of total organic carbon (% TOC).
Percent carbonate (% CaCO3) was calculated using the measured weights before and after decarbonation.
19 samples were analyzed separately to determine δ15N on the Costech 4,010 Elemental Analyzer connected to the Thermofinnigan MAT 253 at KPESIL. The limited number of samples analyzed is due to the small amount of nitrogen present in each sample and the large amount of sample needed to produce measurable nitrogen peaks. 100 mg of samples were weighed into 9 mm x 10 mm tin boats, combusted, and the resulting CO2 and N2 measured. Of these 19 samples, only 14 produced large enough N2 peaks for accurate analysis. Isotopic ratios were corrected to VPDB (δ13C) and AIR (δ15N) using internal and international reference standards: IAEA-600 (caffeine, δ13C = −27.771‰, δ15N = +1.0‰), USGS-25 (Ammonium Sulfate, δ15N = −30.41‰), USGS-26 (Ammonium Sulfate, δ15N = +53.75‰), and ANU Sucrose (newly named IAEA-C6, sucrose, δ13C = −10.80‰). The reproducibility was monitored by repeated analyses of Dogfish muscle (DORM) and Costech Atropine and is reported as+/-0.1‰.
Lithostratigraphic observations are shown in Figure 5 and detailed sample descriptions are available in the Supplementary Material. The base of the Yucca Formation is primarily composed of fine-grained siliciclastic sand- and siltstones. These rocks fine up section until there is a transition to primarily calcareous rocks (at 34.5 m). These rocks are packstones and wackestones with varying amount of allochems, primarily bioclasts. The stratigraphically first calcareous units contain sand and silt as well as the bioclasts, but siliciclastic grains gradually disappear up section while the bioclasts remain. Above these fossiliferous mud-to packstone beds (34.5 m–56.95 m) are beds of oolitic packstones (56.95 m–60.95 m). Above these oolitic limestones, there was a significant amount of cover that prevented sampling between 60.95 m and 68 m. After this gap, the rocks sampled are again fossiliferous pack- and wackestones. However, the concentration of fossils varies bed by bed, and there are beds of mudstones with few fossil fragments as well. The fossils included in these units are oysters, gastropods, serpulids, foraminifera, and unidentified fossil fragments. Above this interval of pack- and wackestones, there was again a thick succession of cover (95.68 m–122.78 m) from which we did not collect samples. The uppermost portion of the Yucca Formation that we sampled (122.78 m–144.78 m) was composed primarily of alternating beds of sandy limestones and fine-grained quartz sandstones. Fossils, mainly whole and fragmented oyster shells, are present in both lithologies.
Our descriptions of the Yucca Formation are consistent with previous works at this location (McCormick et al., 1996). This work utilized the informal members (both for naming and distinguishing members) that has been applied to the Yucca Formation throughout West Texas (Smith, 1940; Amsbury, 1958; Campbell, 1980; Li, 2014; Fox, 2016). Using this convention, the Yucca Formation is split into three informal members: lower, middle, and upper. While our initial sections (Sections 21-1, 21-2, 21-3, 22-1, and 22-2) were not originally determined based on the informal members as applied by McCormick et al. (1996) to this location, we can still apply these informal members to our measured section (Figure 5). The lower member of the Yucca Formation as described by MCormick et al. (1996) is equivalent to our measured section of 0 m–34.5 m, which is the bottom portion of our Section 21-1. The middle member includes Sections 21-1, 21-2, 21-3, and 22-1. It encompasses 34.50 m–95.68 m, however due to gaps in sampling resulting from cover, the top most extent could be higher. The upper member of the Yucca Formation is equivalent to our measured section between 122.78 m and 173.48 m (base of the overlying Glen Rose), which is the entirety of Section 22-2 and the unsampled strata above it.
The bulk organic carbon isotope values range between a minimum δ13Corg value of −27.02‰ and a maximum value of −18.42‰. The average δ13Corg value for the Yucca Formation is −23.01‰. Figure 6 shows the composite δ13Corg record with a line representing a running three-point average.
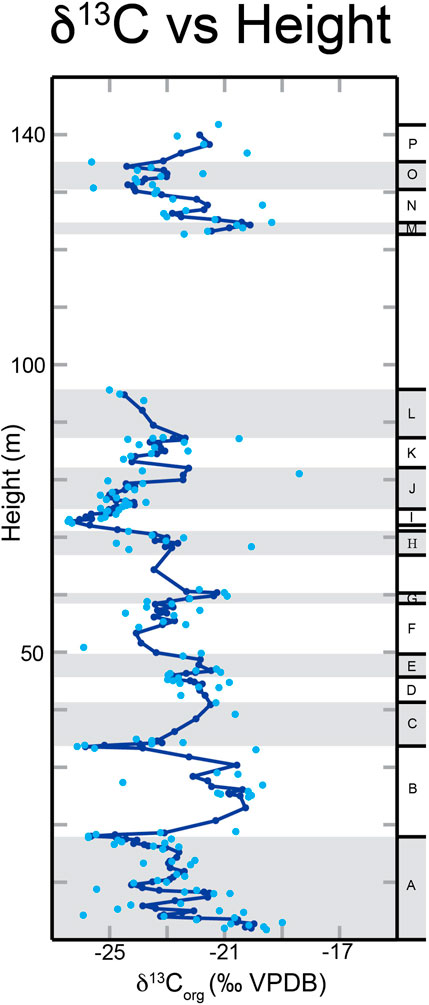
Figure 6. Graph of δ13Corg values vs. height (m) of the Yucca Formation. Light blue dots are the measured δ13Corg values, and the dark blue line is a running three-point average. Lettered intervals are labeled along the right hand side. Reproducibility is+/-0.10‰.
To more easily discuss the δ13Corg values, we have broken the curve down into 16 intervals labeled A-P, as seen in Figure 6. Interval A is from 2 m to 18.5 m above the base of the section. There is a general decreasing trend throughout this interval with a minimum value of −25.72‰. B occurs from 18.5 m to 33.75 m. It has four distinct trends that make up an overall positive excursion. From 18.5 m to 25 m there is an increase in δ13Corg values to a maximum of −19.68‰. There is then a small decrease from 25 m to 28.5 m that is followed by another increase up to −19.91‰. Finally, there is a decrease from 30.5 m to 33.75 m with a minimum value of −26.12‰. C is from 33.75 m to 42.65 m with a positive trend that reaches a maximum value of −20.63‰. Interval D has an overall decreasing trend from 43.95 m to 46.2 m, reaching a minimum value of −22.99‰. E covers the interval from 46.2 m to 49.95 m. There is an increase in δ13Corg values up to a maximum value of −21.28‰. F has a decreasing trend from 49.95 m to 58.45 m. The minimum δ13Corg value in this interval is −25.89‰, however this value is significantly more negative than the other δ13Corg values in this interval and creates a dip in the trendline that makes the overall negative trend harder to see. The next interval, G, spans 58.45 m–60.95 m. There is an increasing trend throughout this interval up to a maximum δ13Corg value of −20.92‰. Interval H is from 68.0 m to 71.12 m, and δ13Corg values fluctuate around −23‰ throughout the entire interval. Interval I, from 72.63 m to 76.13 m is an increasing trend in δ13Corg values, up to a maximum value of −23.73‰. Interval J is from 76.13 m to 82.13 m and includes both a decrease followed by an increase in δ13Corg values. From 76.13 m to 77.38 m there is a decrease in δ13Corg values down to −25.32‰. This is followed by an increase to a maximum value of −18.42‰ through the rest of J (77.38 m–82.13 m). K encompasses 82.13 m–87.38 m and has a similar trend to J. From 82.13 m to 83.63 m there is a decrease with a minimum value of −24.51‰. This is then followed by an increase from 83.63 m to 87.38 m up to a maximum value of −20.5‰. The interval L ranges from 87.38 m to 95.68 m. Through this interval, δ13Corg values again decrease to a minimum value of −24.99‰.
Between intervals L and M (95.68 m–122.78 m), there was a significant amount of cover, and thus no samples were collected, which explains the gap in data in Figure 6. The sampling and intervals resume with interval M which encompasses 122.78 m–124.78 m. Throughout this interval there is an increase in δ13Corg values up to a maximum of −19.36‰. The next interval is N which encompasses 124.78 m–130.78 m. The δ13Corg values in this interval decrease, then increase, and once again decrease. The first decrease occurs from 124.78 m to 126.28 m to a minimum δ13Corg value of −23.12‰. This is followed by an increase up to −19.69‰ through 126.28 m–127.78 m. The rest of N is from 127.78 m to 130.78 m, and δ13Corg values decrease to −25.55‰. O is the next interval from 130.78 m to 135.28 m. From 130.78 m to 133.28 m, δ13Corg values increase to −21.76‰. This is followed by a decrease in values to −25.62‰ from 133.28 m to 135.28 m. The final interval is P, and it encompasses 135.28 m to the top of our sampled section, 142.78 m. Throughout P, there is an increase in δ13Corg with the highest value of −20.23‰.
Percent total organic carbon (% TOC) and percent calcium carbonate (% CaCO3) were calculated for 156 of the 163 samples (Figure 7). % TOC values ranged between 0.002% and 0.36% with an average value of 0.066%. In general, the % TOC decreases up section with areas of higher % TOC corresponding to areas with lower %CaCO3. % CaCO3 values range between 1.13% and 99.86% with an average value of 68.28%.
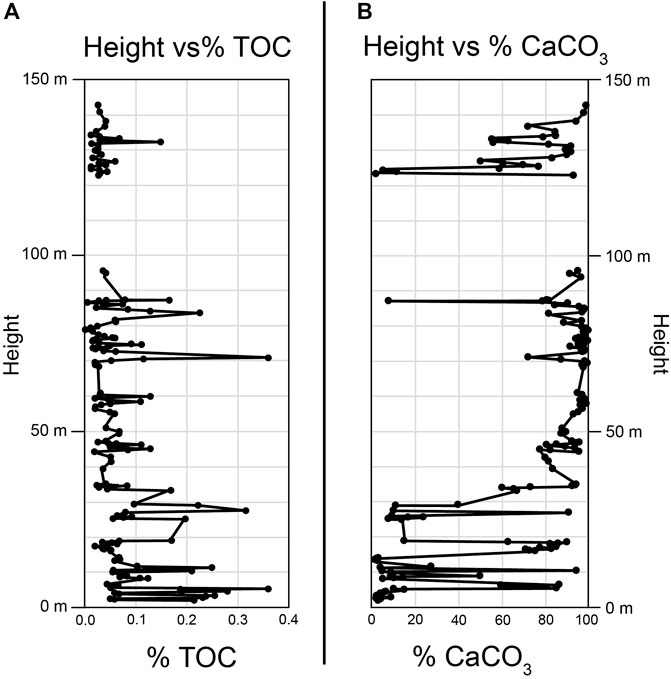
Figure 7. (A) Graph of %TOC vs. height. (B) Graph of %CaCO3 vs. height.
Values for δ15N, % Ν, and C/N of are provided in the Supplementary Material. δ15N values range from 0.43‰ to 7.93‰ with an average value of 3.55‰. C/N ratios range from 3.71 to 27.59 with an average value of 10.27. There are two samples, Yucca21-2750 and Yucca21S2-550, that have much higher C/N ratios than the other samples (21.65 and 27.598 respectfully).
Prior depositional environment interpretations of the Yucca Formation range from more continental environments in the west and more transitional to marine environments in the east. In Big Bend Ranch State Park, we identified four distinct facies groups in the rocks of the Yucca Formation: fine grained clastic with varying carbonate percentages, ooid pack/grainstones, fossiliferous calcareous mud-to packstones, and sandy, calcareous beds with oysters. We interpret these to represent shallow marine depositional environments that include lagoonal/intertidal, ooid baffles, and subtidal environments. This is consistent with previous interpretations in this area (Reck, 1980; McCormick et al., 1996), and likely records the rise in sea level and encroachment of the Mid Cretaceous Interior Seaway.
The stratigraphically lowest (and therefore oldest) facies in our study section is the fine grained clastic rocks with varying carbonate percentages. Multiple sedimentary structures are present within these rocks including ripple marks, burrows, thin beds, and wavy contacts along with iron oxide staining along some bedding planes (Figure 8). These rocks are indicative of an intertidal and/or lagoonal depositional environment with the percentage of carbonate lithologies increasing with distance from shoreline and potential fluvial inputs of clastic material (McCormick et al., 1996). Around 34.35 m the lagoonal deposits transition to more calcareous mudstones, but clastic grains are still present. Overall, this would have been a low energy depositional environment that was protected by the next depositional environment represented by the ooid pack- and grainstones facies (Figure 8). This facies is characterized by massively bedded ooid grainstones and packstone and represent high energy ooid shoals (McCormick et al., 1996). These ooid shoals would have acted as a protective baffle for the previously discussed lower energy lagoon/intertidal area.
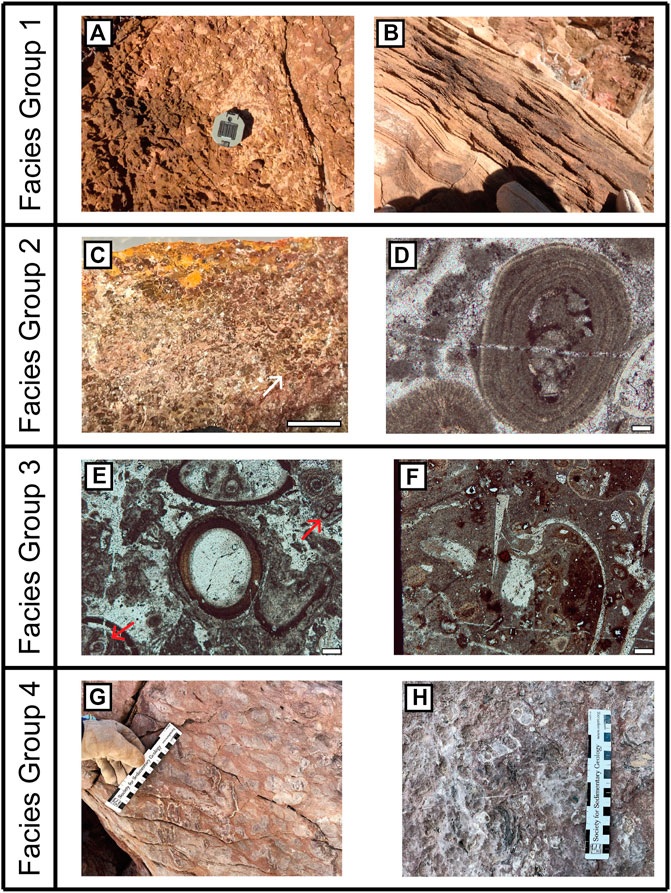
Figure 8. Photographs and photomicrographs of sedimentary structures and fossils that are representative of the four facies groups. All thin section photos are in plane polarized light (ppl). Facies Group 1: (A) Outcrop photograph of burrows on a bedding plane; (B) Outcrop photograph of ripple marks. Facies Group 2: (C) Photograph of hand sample of fossiliferous ooid packstone, white arrow indicates area of abundant ooids (scale bar = 1 cm); (D) photomicrograph of ooids in thin section (scale bar = 200 microns). Facies Group 3: (E) photomicrograph of fossils, including foraminifera (arrows) and serpulids in the center (scale bar = 200 microns); (F) photomicrograph of fossil fragments in thin section, including a bivalve shell (scale bar = 200 microns). Facies Group 4: (G) outcrop photograph of sand filled burrows (lighter coloration); (H) outcrop photograph of gastropods and oyster shells.
The overlying facies (fossiliferous calcareous mud-to packstones) is representative of a subtidal/shallow marine depositional environment (Wilson and Jordan, 1983). These rocks represent periods of time where carbonate production was the dominant sedimentary process over clastic input. A reduction in terrigenous sediment supply likely aided an increase in carbonate production. The identifiable bivalves were found, but fragments that could have been bivalve or gastropod were also found and hence these are described as “indeterminate” mollusks (Figure 8). The amount fossils present in any give bed can vary, but fossils and/or fragments are found in all beds. The final facies group, calcareous sandstones and sandy limestones, represents subtidal/shallow marine environments as well (Wilson and Jorda, 1983), but clastic input has dramatically increased. This increase in clastic input (likely due to uplift and erosion in sediment source areas (McCormick et al., 1996)) would have made it hard for sediment sensitive organisms to survive, reducing carbonate production. Oysters, being more tolerant of turbidity, become the dominant bioclast. These rocks vary from sandy limestones to calcareous sandstones, but oysters are present in all, along with burrows in the sandstones (Figure 8). This interpretation is supported by the presence of large rudist reefs at the base of the overlying Glen Rose Formation, as a reef would be the next depositional environment seaward following these subtidal/shallow marine deposits (Wilson and Jordan, 1983).
For accurate correlation of the δ13Corg record of the Yucca Formation to others, we need to ensure that variation in δ13C is a function of global changes and not local changes in preservation of carbon or changes in lithology (as represented by the amount of carbonate material). To investigate this, we looked at graphs of %TOC vs. δ13Corg and %CaCO3 vs. δ13Corg (Figure 9) to determine if any correlation is present between δ13C and either %CaCO3 and %TOC (Hollander and McKenzie, 1991; Suarez et al., 2013; Suarez et al., 2018; Hennhoefer et al., 2019). Visually, there appears to be no strong correlation between either %TOC or %CaCO3 and δ13Corg. This is corroborated by the R2 values of both graphs, which are 0.067 and 0.21 for %TOC and %CaCO3 respectively. Both of these R2 values are closer to 0 than 1, indicating that any variations in δ13Corg are not likely due to changes in the amount of organic material or the lithology of the sample. This supports our assumption that the changes we see in δ13Corg are global signatures as opposed to local changes in environment that would affect the organic carbon preservation or lithologic variation.
Figure 9. Graphs of %TOC vs. δ13Corg and %CaCO3 vs. δ13Corg. Best fit lines (solid blue lines) and associated R2 values are marked on each graph. Reproducibility is+/-0.10‰. (A) Graph of %TOC vs. δ13Corg. (B) Graph of %CaCO3 vs. δ13Corg.
Due to the potential for terrestrial input during the deposition of the Yucca Formation (as represented by the influxes of clastic material discussed in Section 4.1), it is possible that terrestrial organic matter may have been introduced and mixed with marine organic material. This could potentially alter δ13Corg as terrestrial organic matter and marine organic matter have different fractionation processes resulting in varying δ13Corg values (Sharp, 2017). To determine whether δ13Corg values and the changes in them reflect global carbon cycle fluctuations and not local changes in organic matter source material, the δ15N and C/N of a subset of samples were analyzed.
C/N ratios can be used to distinguish the source of organic matter in sediment, specifically whether the organic matter is from algal or land-plant sources (Meyers, 1994). C/N ratios for aquatic plants and algae are lower than those of terrestrial plants due to the lack of cellulose in aquatic plants and algae. When C/N are used in combination with δ13Corg, different organic matter sources can be identified (Meyers, 1994). Figure 10A shows where Yucca Formation bulk sedimentary organic matter C/N vs. δ13Corg data plot in relation to common ranges for different organic matter sources. Most of our samples plot within or near the range for marine algae. Two samples (Yucca21-2750 and Yucca21S2-550) plot closer to the expected range of values for terrestrial material due to their higher C/N ratios. Neither sample represent trends in carbon isotope stratigraphy that we have identified as major CIEs. One samples (Yucca21S2-5,500) does have an anomalously low δ13Corg value compared to surrounding samples. As this is only a single outlier, it is interpreted that major shifts (consisting of multiple data points) in the carbon isotope record through the Yucca Formation at this locality are not the result of shifting organic matter source material, but rather major shifts are attributed to changes in atmospheric δ13C from global carbon cycle perturbations.
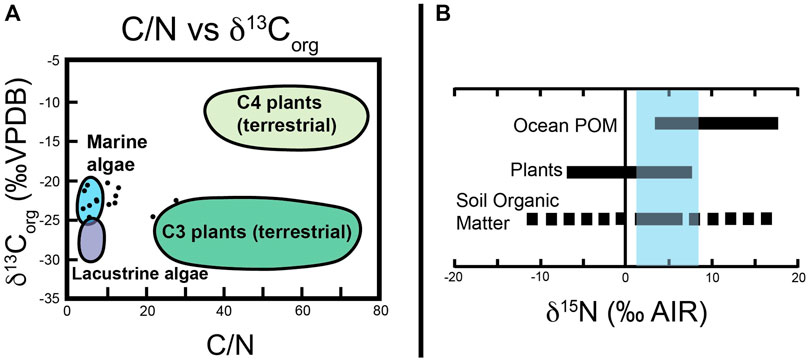
Figure 10. (A) Graph of C/N vs. δ13Corg of Yucca Formation. Colored areas represent common ranges of various organic carbon sources. After Meyers (1994). (B) δ15N ranges of three common organic matter sources. The blue rectangle highlights the range of δ15N values of 14 samples from the Yucca Formation. Edited from Sharp (2017).
In addition to C/N, bulk sedimentary organic matter δ15N values from Yucca Formation plot close to or within the expected range of δ15N values for ocean particulate organic matter (POM). Figure 10B shows the range of measured δ15N values with respect to other organic matter sources. Some δ15N values do also overlap with the range of δ15N for soil organic matter, suggesting some limited terrestrial input, but again these samples do not correspond with major shifts in the δ13Corg chemostratigraphic record. This again support the interpretation that major shifts of multiple data points in the δ13Corg record through the Yucca Formation are the result of changes in atmospheric δ13C from global carbon cycle perturbations.
The δ13Corg profile produced by Bralower et al. (1999) from hemipelagic sections deposited in the Sierra Madre in northeastern Mexico was one of the first bulk organic carbon chemostratigraphic profiles from the Americas. We compared our profile first to that of Bralower et al. (1999) because, like our profile, it is constructed from organic carbon (δ13Corg). While records of δ13Corg and δ13Ccarb do show similar trends, magnitude of changes should be more similar when comparing similar material. Secondly, the Bralower profile distinctly shows the major δ13C changes and all of the major carbon isotope segments (C1-C15) that are likely in the Yucca Formation. Finally, other studies (Herrle et al., 2004; Phelps et al., 2015) have correlated δ13C profiles (often with higher resolution carbon isotope segments) to the Bralower et al. (1999) profile. Therefore, by correlating to Bralower et al. (1999), it will be possible to correlate to other sections that may not distinctly show all the excursions or changes that are present in the Yucca Formation δ13C curve. The full correlation to Bralower et al. (1999) is presented in Figure 11. While there are differences in the exact δ13Corg values between our data and Bralower et al. (1999), the general trends, structure, and amplitudes are very similar, and it is the trends in these records that have been shown to be the basis of correlation (Scholle and Arthur, 1980; Ferreri et al., 1997; Herrle et al., 2004). Differences in absolute values of δ13C of different locations could arise from factors such as differences in depositional environment and hence sources of organic matter, or differences in location that could result in enhanced primary productivity leading to varying amounts of enrichment in δ13C of DIC (Hennhoefer et al., 2019). For δ13Corg specifically, differences are primarily due to differences in organic carbon sources. As discussed in the previous section, the sources of organic carbon within the Yucca Formation in Big Bend Ranch State Park is marine organic matter as indicated by C and N analyses. Ranges in terrestrially derived organic matter vary relative to marine organic matter, but they overlap significantly (Meyers, 1994), so differing amount of terrestrial input may explain variations in absolute δ13Corg between our data and other δ13Corg records. However, the similarities in general trends, structure, and amplitudes are again the important characteristics for correlation between our data and that of Bralower et al. (1999).
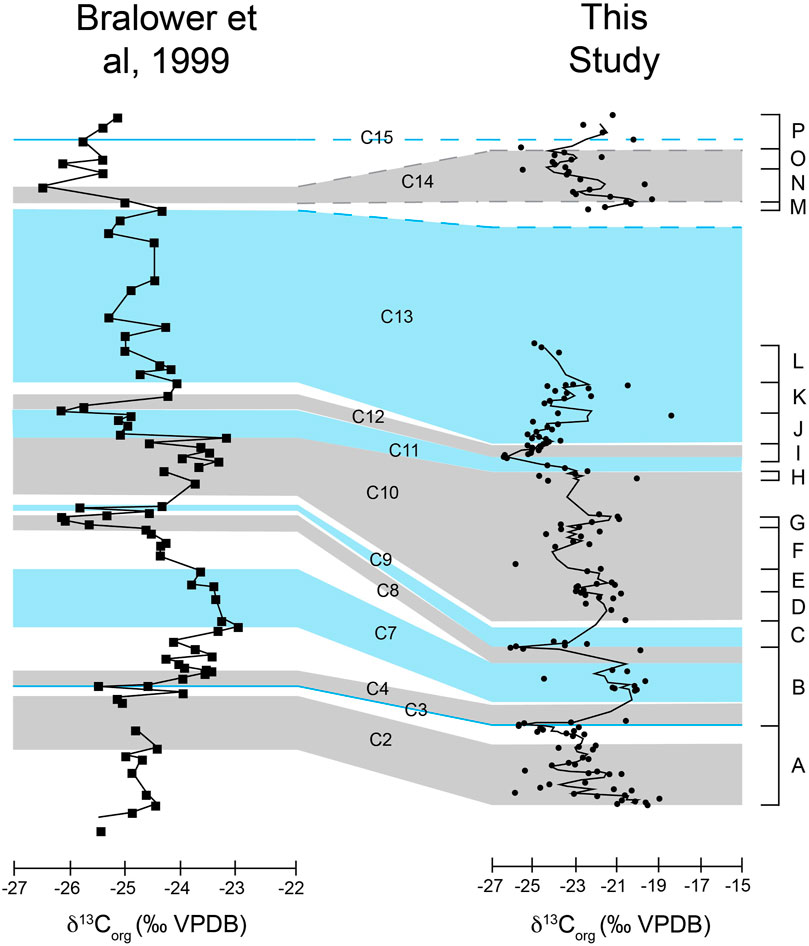
Figure 11. Correlation between the Yucca Formation δ13Corg curve and that of Bralower et al. (1999). Lettered intervals (as explained in the results section) are along the right-hand side. The chemostratigraphic segments (C2-C15) of Bralower et al. (1999) are in the middle. The y-axis represent height, but not at the same scale so as to make correlation easier. The Yucca Formation in the Lower Shutup is 142.78 m thick and the San Angel Limestone, La Peña Formation, and Tamaulipas Limestone in the Santa Rosa Canyon of Bralower et al. (1999) is approximately 220 m thick.
At the base of the Yucca section δ13Corg profile, there is a decrease in δ13C values (interval A), and this decrease is interpreted to correspond to the C2 interval of Bralower et al. (1999) that culminates in the C3 negative isotope excursion, corresponding to most negative isotope value at the end of A. There is then a large increase which is labeled as C4 that is correlated to the lowest portion of segment B. Intervals C5 and C6 are not well represented in our data. C7 is an interval of more positive δ13Corg values that are seen in the middle portion of segment B. The negative trend at the end of B corresponds to C8. The following positive trend, C9, is correlated to our segment C. This is the followed by a series of δ13Corg values that remain positive but do have some variation. This is interpreted as the C10 interval and encompasses all of our D, E, F, and G isotope segments. The following large, abrupt decrease that is C11 corresponds to the top portion of our segment H and the base of I. The majority of I is equivalent to C12. J, K, and L, are all within C13.
The topmost portion of our profile (122.78 m–142.78 m) is more difficult to correlate due to the large data gap from 95.68 m to 122.78 m. There are two potential correlations for this section. The first is that intervals M, N, and O are equivalent to C14 and interval P is the beginning of C15. The second interpretation is that M, N, O, and P are all continuations of C13. Of these two options, the first seems more likely due to the stratigraphic thickness, and therefore time, between the rest of the Yucca Formation data and this portion.
Identification of the carbon isotope segments of Bralower et al. (1999) and the subsequent correlation by Herrle et al. (2004) to reference sections of the Vocontian Basin of Europe is important because it provides the opportunity to correlate the Yucca Formation to biostratigraphically and age calibrated chemostratigraphy from these reference sections (Figure 12). Importantly, two major CIEs are of significance. That includes the C3 negative excursion which is associated with the initiation of OAE 1a and the C11 (which Herrle et al. (2004) defines as “Al1”). This is part of a set of short negative excursions associated with OAE 1b set. It is important to note that lithologically we do not see evidence to suggest increased organic matter preservation or changes in lithology associated with the carbon isotope excursion within the Yucca Formation, but rather we only observed the associated carbon isotope fluctuations. These OAEs have often been associated with increased continental run off, however, in our section, the increase in siliciclastics are not correlated with these C-isotope events suggesting local changes (possibly increased uplift in a source area) are responsible (McCormick et al., 1996) and not climate changes.
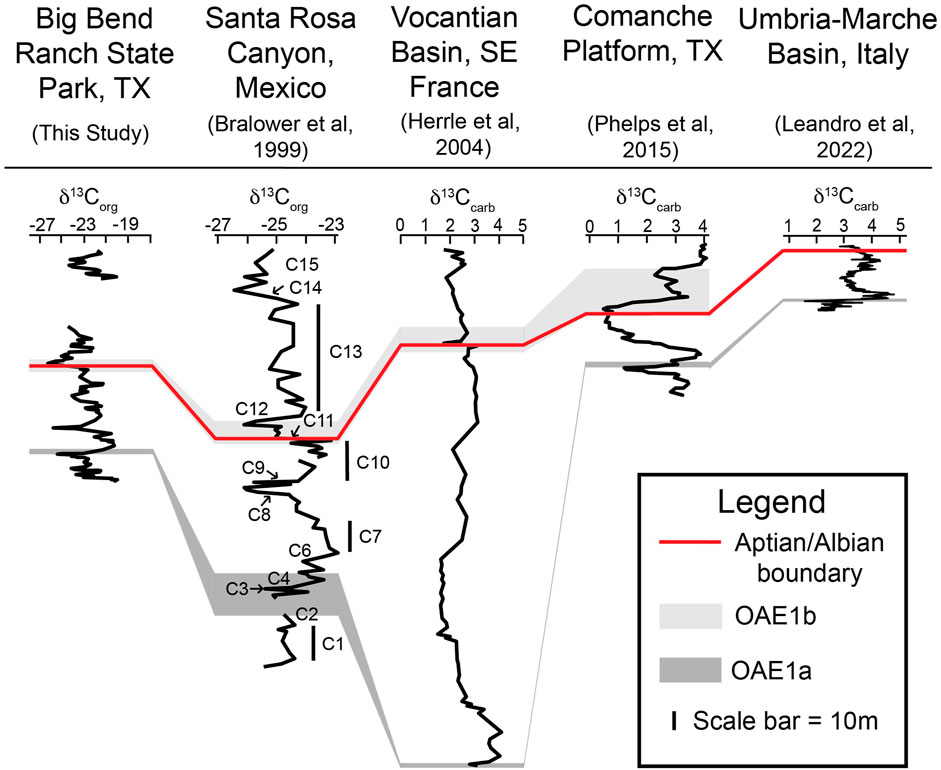
Figure 12. Correlation of this study’s Yucca Formation δ13Corg curve to other δ13C curves from local to global locations. All δ13C values are measured vs. ‰VPDB. The lower, dark gray boxes denote OAE 1a. The upper, light gray boxes denote some portion of the ‘OAE 1b set’. The red line marks the Aptian/Albian boundary. The placement of OAE 1a, ‘OAE 1b set’, and the Aptian/Albian boundary is determined by the δ13C curves’ respective authors. The y-axis represents height or depth and have been rescaled to match (see scale bar in the Legend). The numbered carbon isotope segments are labeled on the curve of Bralower et al. (1999).
Attempts to provide time-calibrated carbon isotope records are ongoing, but progress over the last decade has provided some time constraint. The C11 isotope segment is associated with OAE 1b. ‘OAE 1b’ is not well defined and is made up of a cluster (‘OAE 1b set’) of mostly negative excursions that span the Aptian/Albian boundary (Gale et al., 2020). OAE 1b may include the Jacob, the Kilian, the Paquier, the Leenhardt, and/or the l’Arboudeyesse Events depending on an author’s designation. In the case of the Yucca Formation, we clearly see a large negative excursion that correlates to the C11 isotope segment, which is associated with the Kilian Event specifically (Coccioni et al., 2014; Bodin et al., 2023; Bornemann et al., 2023). Carbon isotope excursions associated with the Jacob, Paquier, Leenhardt, and l’Arboudeyesse are not clearly resolved in our chemostratigraphic record and so are not identified. Recently the basal Albian boundary was designated as the first appearance datum (FAD) of the planktonic foraminifera Microhedbergella renilaevis at the GSSP (Col de Pré-Guittard section, Arnayon, Drôme, Frace) (Kennedy et al., 2014; Kennedy et al., 2016). It is also associated with a negative excursion in the carbon isotope record (Herrle et al., 2004; Gale et al., 2020) associated with the Kilian Event in the OAE 1b set (Bornemann et al., 2023) and to which we correlate our segment H. The Aptian/Albian boundary is placed at 113.2 Ma based on a U-Pb radioisotopic date from an ash bed at Vörhum in northern Germany that has been correlated to the GSSP (Selby et al., 2009). There have been recent studies that suggest the Kilian Event, and therefore the Aptian-Albian boundary, may occur slightly before the Vörhum boundary tuff and placing it around 113.65 Ma (Bornemann et al., 2023). However, this has not been officially ratified, so we have chosen to use the date of 113.2 Ma for the Aptian/Albian boundary. This allows us to interpret that the Aptian/Albian boundary in the Yucca Formation occurs at a height of approximately 71 m above the contact with the Shutup Conglomerate.
The distinctive C3 negative isotope excursion followed by the C4-6 positive excursion is often identified in early Cretaceous C-isotope chemostratigraphy (Menegatti et al., 1998; Bralower et al., 1999; Gröcke et al., 1999; Herrle et al., 2004; Ando et al., 2008; Herrle et al., 2015), however, an age calibration for this excursion associated with OAE 1a (also known as the Selli Event) remains elusive. Leandro et al. (2022) produced an astronomically-tuned age model of the Aptian from the Poggio le Guaine core of the Umbria-Marche Basin, Italy that provide estimates of ages for the black shale events of the Aptian (which are often accompanied by CIEs). In this study, Leandro et al. (2022) places the age of the Selli event (or OAE 1a) at 118.8 Ma. The CIE associated with OAE 1a spans the C3-C6 intervals as defined by Bralower et al. (1999). We have identified these intervals in our data as the upper part of segment A and lower part of segment B (Figure 11; 18.5 m to approximately 21 m), and can relatively date this span of the Yucca Formation to approximately this age. While the entirety of OAE 1a is not clearly recorded (C5 and C6 are not distinguishable), the event itself is present. This event appears to be synchronous with the main eruption of the Ontong Java Plateau, a large igneous province (Li et al., 2016; Gale et al., 2020).
Identification of the C3-6 carbon isotope segments and the C11 isotope segment allow us to confidently constrain the Yucca Formation to the Aptian and lower Albian stages. While we cannot directly assign precise numerical ages to the Yucca Formation, the age constraints of these isotope segments to date from other locations suggest deposition of the Yucca Formation occurred before the Selli Event (at approximately 118.8 Ma (Leandro et al., 2022)) to somewhat after the Kilian Event (113.2 Ma (Selbey et al., 2009)).
Based on the estimated ages of the identified carbon isotope events (118.8 Ma–113.2 Ma) spanning from 18.5 m to 71 m, the average sedimentation rate for this area during deposition would be approximately 9.3 m per million years, or 9.3 mm per thousand years. This is a lower rate than expected for analogous depositional environments as other estimates of sedimentation rates for carbonate platforms in the Cretaceous range from 20 mm/kyr to 155 mm/kyr (Wilson, 1975; Enos, 1977; Sarg, 1988; Ferreri et al., 1997). Explanations for this lower rate can be potentially explained by a combination of compaction and/or periods of erosion (or non-deposition) through the sequence (Enos, 1991).
Having identified the carbon isotope segments of Bralower et al. (1999), the Yucca Formation chemostratigraphic record can be compared to various other records from throughout Texas. One such record is the extensive compilation of chemostratigraphic records for the Cretaceous Comanche Platform of central Texas by Phelps et al. (2015) (Figure 12). This correlation suggests that the Yucca Formation at Big Bend Ranch State Park is time equivalent to the Sligo, Pine Island, James, Bexar, and lowest portion of the Glen Rose Formation on the Comanche Platform (Figure 13). Recent geochemical work by Godet et al. (2023) in Big Bend National Park (East of Big Bend Ranch State Park) at the Persimmon Gap and Santa Elena Canyon sections provides another opportunity for regional correlation. Godet et al. (2023) identified the presence of chemostratigraphic segments Al2 - Al5 (Herrle et al., 2004) in the composite of their two Big Bend National Park δ13C records. These chemostratigraphic segments (Al2 - Al5) are time equivalent to a portion of C13 (Herrle et al., 2004) as well as a portion of the OAE 1b set (Phelps et al., 2015). As both a portion of C13 and the OAE 1b set are identified in the chemostratigraphic record of the Yucca Formation at Big Bend Ranch State Park (Figure 11; Figure 12), it can be concluded that the upper Yucca Formation is time equivalent to some portion of the lower Glen Rose in Big Bend National Park to the east or our study locality (Figure 13).
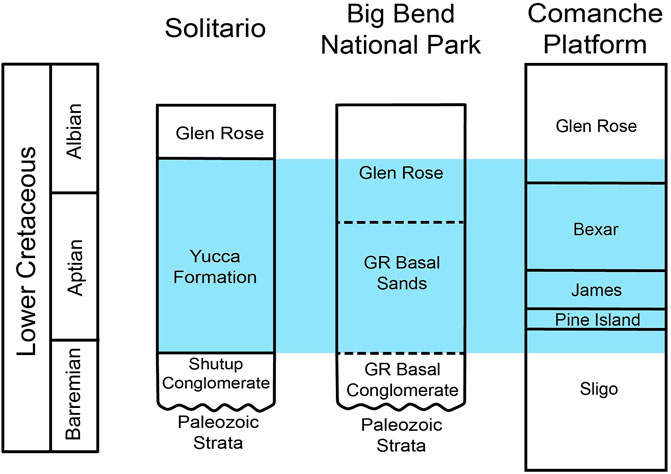
Figure 13. Revised correlation of Lower Cretaceous Formations of southern Texas. Based on our interpretation of chemostratigraphic data, the boundary between the Yucca Formation and the Glen Rose occurs above the Aptian/Albian boundary. The blue highlighted areas represent strata that correlate to the Yucca Formation based on our chemostratigraphic interpretations. The Solitario and Big Bend National Park columns are edited from McCormick et al. (1996), and the Comanche Platform column is edited from Phelps et al. (2015).
This study provides the first stable organic carbon isotope chemostratigraphic record for the Yucca Formation in Big Bend Ranch State Park. The record allows for correlation across multiple localities including Sierra Madre, NE Mexico (Bralower et al., 1999); Comanche Platform, West Texas (Phelps et al., 2015); Vocontian Basin, SE France (Herrle et al., 2004); Umbria-Marche Basin, Italy (Leandro et al., 2022)); and Big Bend National Park (Godet et al., 2023) to accurately determine the relative age of the Yucca Formation. The stable carbon isotope record also shows the presence of two carbon isotope excursions (CIE) that are associated to two major geochemical events related to global palaeoceanographic events: OAEs 1a and 1b. The presence of the CIE associated with OAE 1a better constrains the timing of the earliest strata to approximately 118.8 Ma (Leandro et al., 2022). The identification of CIEs associated with OAE 1b (specifically the Kilian Event) is consistent with the previously assumed age of the Yucca Formation and the presence of the Aptian/Albian boundary (113.2 Ma).
The results of this study provide a strong basis for future work on the Yucca Formation. Future work could expand on the chemostratigraphic record and employ numerical age constraints in order to better understand the Yucca Formation and the paleoclimatic conditions during its deposition.
The datasets presented in this study can be found in online repositories. The names of the repository/repositories and accession number(s) can be found below: https://doi.org/10.26022/IEDA/112924 EarthChem library Interdisciplinary Earth Data Alliance (IEDA).
EB: Writing–original draft, Writing–review and editing, Data curation, Formal Analysis, Investigation, Methodology, Visualization. MS: Conceptualization, Formal Analysis, Funding acquisition, Project administration, Resources, Supervision, Writing–review and editing.
The author(s) declare that financial support was received for the research, authorship, and/or publication of this article. Funding for this research was provided by the National Science Foundation via the Frontiers in Earth Sciences program (NSF Grant EAR 1925942).
Thank you to Bruce Barnett for helping to run samples at the W.M. Keck Paleoenvironmental and Environmental Stable Isotope Laboratory at the University of Kansas, to Peter Makovicky, Celina Suarez, Glenn Sharman, Blaine Hall, Jack Fekete, and Matthew Allen for their help in the field, and the staff and park rangers at Big Bend Ranch State Park, especially park superintendents Nathanael Gold and Craig Howell. Work was conducted under Texas Parks and Wildlife Scientific Permit no. 54–20. Finally, thank you to the National Science Foundation for helping to fund this project via the Frontiers in Earth Sciences program (EAR 1925942).
The authors declare that the research was conducted in the absence of any commercial or financial relationships that could be construed as a potential conflict of interest.
All claims expressed in this article are solely those of the authors and do not necessarily represent those of their affiliated organizations, or those of the publisher, the editors and the reviewers. Any product that may be evaluated in this article, or claim that may be made by its manufacturer, is not guaranteed or endorsed by the publisher.
The Supplementary Material for this article can be found online at: https://www.frontiersin.org/articles/10.3389/feart.2024.1277642/full#supplementary-material
Amsbury, D. L. (1958). Geology of the pinto Canyon area, presidio county, Texas. Austin: University of Texas, 360. Bureau of Economic Geology Geologic Quadrangle Map No. 22, scale 1:63.
Anderson, T. H., and Schmidt, V. A. (1983). The evolution of Middle America and the Gulf of Mexico-Caribbean Sea region during Mesozoic time. Geol. Soc. Am. Bull. 94, 941–966. doi:10.1130/0016-7606(1983)94<941:teomaa>2.0.co;2
Ando, A., Kaiho, K., Kawahata, H., and Kakegawa, T. (2008). Timing and magnitude of early Aptian extreme warming: unraveling primary δ18O variation in indurated pelagic carbonates at Deep Sea Drilling Project Site 463, central Pacific Ocean. Palaeogeogr. Palaeoclimatol. Palaeoecol. 260, 463–476. doi:10.1016/j.palaeo.2007.12.007
Barragán, R. (2001). Sedimentological and paleoecological aspects of the Aptian transgressive event of Sierra del Rosario, Durango, northeast Mexico. J. S. Am. Earth Sci. 14, 189–202. doi:10.1016/s0895-9811(01)00021-9
Barragán, R., and Maurrasse, F. J. M. (2008). Lower aptian (lower cretaceous) ammonites from the basal strata of the La Peña Formation of nuevo león state, northeast Mexico: biochronostratigraphic implications. Rev. Mex. Ciencias Geol. 25 (1), 145–157.
Barragán, R., Moreno-Bedmar, J. A., Núñez-Useche, F., Álvarez-Sánchez, L. F., and Delanoy, G. (2021). Ammonite biostratigraphy of two stratigraphic sections of the La Peña Formation (aptian, lower cretaceous) in nuevo león state, northeast Mexico. Cretac. Res. 125, 104862. doi:10.1016/j.cretres.2021.104862
Biebesheimer, E. J., and Suarez, M. B. (2023). Organic C-isotope chemostratigraphy of the Yucca Formation, Big Bend Ranch State Park, Texas, U.S.A., Version 1.0. Interdiscip. Earth Data Alliance (IEDA). doi:10.26022/IEDA/112924
Bodin, S., Charpentier, M., Ullmann, C. V., Rudra, A., and Sanei, H. (2023). Carbon cycle during the late Aptian-early Albian OAE 1b: A focus on the Kilian-Paquier levels interval. Glob. Planet. Change 222, 104074. doi:10.1016/j.gloplacha.2023.104074
Bornemann, A., Erbacher, J., Blumenberg, M., and Voigt, S. (2023). A first high-resolution carbon isotope stratigraphy from the Boreal (NW Germany) for the Berriasian to Coniacian interval – implications for the timing of the Aptian-Albian boundary. Front. Earth Sci. 11, 1173319. doi:10.3389/feart.2023.1173319
Bralower, T. J., CoBabe, E., Clement, B., Sliter, W. V., Osburn, C. L., and Longoria, J. (1999). The record of global change in the mid-Cretaceous (Barremian-Albian) sections from the Sierra Madre, Northeastern Mexico. J. Foraminifer. Res. 29 (4), 418–437.
Campbell, D. H. (1980). “The Yucca Formation – Early Cretaceous continental and transitional environments, southern Quitman Mountains, Hudspeth County, Texas,” in New Mexico geological soceity 31st annual fall field conference guidebook, Trans pecos region (West Texas). Editors P. W. Dickerson, J. M. Hoffer, and J. F. Callender (Socorro, New Mexico: New Mexico Bureau of Geology and Mineral Resources), 159–168.
Coccioni, R., Sabatino, N., Frontalini, F., Gardin, S., Sideri, M., and Sprovieri, M. (2014). The neglected history of Oceanic Anoxic Event 1b: insights and new data from the Poggio le Guaine section (Umbria-Marche Basin). Stratigraphy 11 (3-4), 245–282. doi:10.29041/strat.11.3.03
Corry, C. E., Herrin, E., McDowell, F. W., and Phillips, K. A. (1990). Geology of the Solitario. Trans-Pesos Tex. Geol. Soc. Am. Special Pap. 250, 122p. doi:10.1130/SPE250
Emerson, B. L., Emerson, J. H., Akers, R. E., and Akers, T. J. (1994). Texas Cretaceous ammonites and nautiloids. Tex. Paleontol. Ser. 5, 1–439.
Enos, P. (1977). “PART I: Holocene Sediment Accumulations of the South Florida Shelf Margin,”. Quaternary sedimentation in south Florida. Editors P. Enos, and R. D. Perkins (Boulder, Colorado: Geological Society of America. Memoir), 147, 1–130. doi:10.1130/mem147-p1
Ferreri, V., Weissert, H., D’Argenio, B., and Buonocunto, F. P. (1997). Carbon isotope stratigraphy: a tool for basin to carbonate platform correlation. Terra nova. 9, 57–61. doi:10.1111/j.1365-3121.1997.tb00002.x
Föllmi, K. B. (2011). Early Cretaceous life, climate and anoxia. Cretac. Res. 35, 230–257. doi:10.1016/j.cretres.2011.12.005
Fox, M. R. (2016). Sedimentologic and stratigraphic analysis of synrift siliciclastic fluvial and lacustrine strata in the Lower Cretaceous Upper Yucca Formation. in Indio mountains, West Texas [master’s thesis]. El Paso, Texas: University of Texas at El Paso, 138.
Gale, A. S., Mutterlose, J., Batenburg, S., Agterberg, F., Ogg, J. G., and Petrizzo, M. R. (2020). “The Cretaceous Period,”. Geologic time scale 2020. Editors F. M. Gradstein, J. G. Ogg, M. B. Schmitz, and G. M. Ogg (Amsterdam, Netherlands: Elsevier), 2, 1023–1086. doi:10.1016/b978-0-12-824360-2.00027-9
Godet, A., Suarez, M. B., Price, D., Lehrmann, D. J., and Adams, T. (2023). Paleoenvironmental constraints on shallow-marine carbonate production in central and West Texas during the Albian (Early Cretaceous). Cretac. Res. 144, 105462. doi:10.1016/j.cretres.2022.105462
Gröcke, D. R., Hesselbo, S. P., and Jenkyns, H. C. (1999). Carbon-isotope composition of Lower Cretaceous fossil wood: Ocean-atmosphere chemistry and relation to sea-level change. Geology 27 (2), 155–158. doi:10.1130/0091-7613(1999)027<0155:cicolc>2.3.co;2
Haenggi, W. T. (2002). Tectonic history of the Chihuahua trough, Mexico and adjacent USA, Part II: Mesozoic and Cenozoic. Bol. Soc. Geol. Mex. 55 (1), 38–94. doi:10.18268/bsgm2002v55n1a4
Hay, W., and Floegel, S. (2012). New thoughts about the Cretaceous climate and oceans. Earth-Science Rev. 115, 262–272. doi:10.1016/j.earscirev.2012.09.008
Hennhoefer, D., Al Suwaidi, A., Bottini, C., Helja, E., and Steuber, T. (2019). The Albian to Turonian carbon isotope record from the Shilaif Basin (United Arab Emirates) and its regional and intercontinental correlation. Sedimentology 66, 536–555. doi:10.1111/sed.12493
D. C. Henry, and W. R. Muehlberger (1996). Geology of the Solitario dome, trans-pecos Texas: paleozoic, mesozoic, and cenozoic sedimentation, tectonism, and magmatism (Austin, Texas: Bureau of Economic Geology, Report of Investigations), 240, 109–120.
Herrin, E. T. (1957). Geology of the Solitario area, trans-pecos Texas. [Ph.D. Dissertation]. Cambridge(MA): Harvard University.
Herrle, J. O., Kößler, P., Friedrich, O., Erlenkeuser, H., and Hemleben, C. (2004). High-resolution carbon isotope records of the Aptian to Lower Albian from SE France and the Mazagan Plateau (DSDP Site 545): a stratigraphic tool for paleoceanographic and paleobiologic reconstruction. Earth Planet. Sci. Lett. 218, 149–161. doi:10.1016/s0012-821x(03)00646-0
Herrle, J. O., Schröder-Adams, C. J., Davis, W., Pugh, A. T., Galloway, J. M., and Fath, J. (2015). Mid-Cretaceous High Arctic stratigraphy, climate, and Oceanic Anoxic Events. Geology 43 (5), 403–406. doi:10.1130/g36439.1
Hollander, D. J., and McKenzie, J. A. (1991). CO2 control on carbon-isotope fractionation during aqueous photosynthesis: a paleo-pCO2 barometer. Geology 19, 929–932. doi:10.1130/0091-7613(1991)019<0929:ccocif>2.3.co;2
Jenkyns, H. C. (2003). Evidence for rapid climate change in the Mesozoic–Palaeogene greenhouse world. Philosophical Trans. Math. Phys. Eng. Sci. 361 (1810), 1885–1916. doi:10.1098/rsta.2003.1240
Jenkyns, H. C. (2010). Geochemistry of oceanic anoxic events. Geochem. Geophys. Geosystems 11 (3), 1–30. doi:10.1029/2009GC002788
Kennedy, J. W., Gale, A. S., Huber, B. T., Petrizzo, M. R., Brown, P., and Jenkyns, H. C. (2016). The Global Boundary Stratotype Section and Point (GSSP) for the base of the Albian Stage, of the Cretaceous, the Col de Pré-Guittard section, Arnayon, Drôme, France. Episodes 40 (3), 177–188. doi:10.18814/epiiugs/2017/v40i3/017021
Kennedy, W. J., Gale, A. S., Huber, B. T., Petrizzo, M. R., Bown, P., Barchetta, A., et al. (2014). Integrated stratigraphy across the Aptian/Albian boundary at Col de Pré-Guittard (southeast France): A candidate Global Boundary Stratotype Section. Cretac. Res. 51, 248–259. doi:10.1016/j.cretres.2014.06.005
Leandro, C. G., Savian, J. F., Kochhann, M. V. L., Franco, D. R., Coccioni, D. R., Frontalini, F., et al. (2022). Astronomical tuning of the Aptian stage and its implications for age recalibrations and paleoclimatic events. Nat. Commun. 13 (2941), 2941. doi:10.1038/s41467-022-30075-3
Li, J., Hu, X., Zhao, K., Cai, Y., and Sun, T. (2016). Paleoceanographic evolution and chronostratigraphy of the Aptian Oceanic Anoxic Event 1a (OAE1a) to oceanic red bed 1 (ORB1) in the Gorgo a Cerbara section (central Italy). Cretac. Res. 66, 115–128. doi:10.1016/j.cretres.2016.04.016
Li, X. (2014). “Sedimentologic, Stratigraphic, and Diagenetic Analysis of Microbialite-Bearing Lacustrine Rift Sequence within the Lower Cretaceous Yucca Formation,” in Indio mountains, West Texas. [M.S. Thesis]. (El Paso, Texas: The University of Texas at El Paso).
Lloyd, G. T., Davis, K. E., Pisani, D., Tarver, J. E., Ruta, M., Sakamoto, M., et al. (2008). Dinosaurs and the Cretaceous Terrestrial Revolution. Proc. R. Soc. B 275, 2483–2490. doi:10.1098/rspb.2008.0715
Ludvigson, G. A., Joeckel, R. M., Murphy, L. R., Stockli, D. F., González, L. A., Suarez, C. A., et al. (2015). The emerging terrestrial record of Aptian-Albian global change. Cretac. Res. 56, 1–24. doi:10.1016/j.cretres.2014.11.008
Ludvigson, G. A., Joekel, R. M., González, L. A., Gulbranson, E. L., Rasbury, E. T., Hunt, G. J., et al. (2010). Correlation of Aptian-Albian Carbon Isotope Excursions in Continental Strata of the Cretaceous Foreland Basin, Eastern Utah, U.S.A. U.S.A. J. Sediment. Res. 80 (11), 955–974. doi:10.2110/jsr.2010.086
Malott, V. E., and Reaser, D. F. (1993). “Facies and depositional environments of the Lower Cretaceous (Middle Albian) Finlay Limestone, western Trans-Pecos Texas (abs.),” in American association of petroleum geologists transactions (Fort Worth, Texas: Southwest Section), 77, 140.
Maxwell, R. A., Lonsdale, J. T., Hazzard, R. T., and Wilson, J. A. (1967). Geology of the Big Bend national park, brewster county. Texas: The University of Texas at Austin, Bureau of Economic Geology Publication 6711, 320p.
McAnena, A., Flögel, S., Hofmann, P., Herrle, J. O., Griesand, A., Pross, J., et al. (2013). Atlantic cooling associated with a marine biotic crisis during the mid-Cretaceous period. Nat. Geosci. 6 (7), 558–561. doi:10.1038/ngeo1850
McCormick, C. L., Smith, C. I., and Henry, C. D. (1996). “Cretaceous Stratigraphy,” in Geology of the Solitario dome, trans-pecos Texas: paleozoic, mesozoic, and cenozoic sedimentation, tectonism, and magmatism. Editors D. C. Henry, and W. R. Muehlberger (Austin, Texas: Bureau of Economic Geology, Report of Investigations), 240, 30–46.
McCulloh, R. P. (1977). Geology of the yellow hill quadrangle, brewster county, Texas. (Austin, TX: The University of Texas at Austin). [Ph.D. Dissertation].
Menegatti, A. P., Weissert, H., Brown, R. S., Tyson, R. V., Farrimond, P., Strasser, A., et al. (1998). High-resolution δ13C stratigraphy through the early Aptian “Livello Selli” of the Alpine Tethys. Paleoceanography 13 (5), 530–545. doi:10.1029/98pa01793
Meyers, P. A. (1994). Preservation of elemental and isotopic source identification of sedimentary organic matter. Chem. Geol. 114, 289–302. doi:10.1016/0009-2541(94)90059-0
Muehlberger, W. R. (1980). ““Texas lineament revisited” in Trans-Pecos region, southwestern New Mexico and West Texas,” in New Mexico geological society 31st field conference guidebook. Editors P. W. Dickerson, and J. M. Hoffer, 113–121.
Phelps, R. M., Kerans, C., Da-Gama, R. O. B. P., Jeremiah, J., Hull, D., and Loucks, R. G. (2015). Response and recovery of the Comanche carbonate platform surrounding multiple Cretaceous oceanic anoxic events, northern Gulf of Mexico. Cretac. Res. 54, 117–144. doi:10.1016/j.cretres.2014.09.002
Reck, D. F. (1980). The lower cretaceous stratigraphic sequence in the Chihuahua trough, presidio county, Texas. Alpine, TX: Sul Ross State University. [Master’s thesis].
Saltzman, M. R., and Thomas, E. (2012). “Carbon Isotope Stratigraphy,”. The geologic time scale 2012. Editors J. G. Gradstein, M. D. Schmitz, and G. M. Ogg (Oxford, England: Elsevier), 2, 207–232. doi:10.1016/b978-0-444-59425-9.00011-1
Salvador, A. (1987). Late Triassic-Jurassic paleogeography and origin of Gulf of Mexico Basin. Am. Assoc. Petroleum Geol. Bull. 71, 419–451. doi:10.1306/94886ec5-1704-11d7-8645000102c1865d
Sarg, J. F. (1988). “Carbonate sequence stratigraphy” in sea-level changes – an integrated approach, eds. C. K. Wilgus, B. S. Hastings, C. G.St. C. Kendall, H. W. Posamentier, C. A. Ross, and J. C. Van Wagoner (Tulsa, Oklahoma: Society of Economic Paleontologists and Mineralogists. Special Publication) 42, 155–181.
Scholle, P. A., and Arthur, M. A. (1980). Carbon isotope fluctuation in Cretaceous pelagic limestones: potential stratigraphic and petroleum exploration tool. Am. Assoc. Petroleum Geol. Bull. 64 (1), 67–87.
Scott, R. W., Molineux, A. M., Löser, H., Mancini, E. A., Texas, U. S. A., and Scott, R. W. (2007). “Lower Albian Sequence Stratigraphy and Coral Buildups: Glen Rose Formation,” in Cretaceous rudists and carbonate platforms: environmental feedback (Tulsa, Oklahoma: SEPM Special Publication), 87, 181–192.
Scotese, C. R. (2021). An atlas of Phanerozoic paleogeographic maps: the seas come in and the seas go out. Annu. Rev. Earth Planet. Sci. 49 (1), 679–728
Selby, D., Mutterlose, J., and Condon, D. J. (2009). U–Pb and Re–Os geochronology of the Aptian/Albian and Cenomanian/Turonian stage boundaries: Implications for timescale calibration, osmium isotope seawater composition and Re–Os systematics in organic-rich sediments. Chem. Geol. 265, 394–409. doi:10.1016/j.chemgeo.2009.05.005
Smith, C. I. (1970). “Lower Cretaceous sedimentation and tectonics on the Coahuila and West Texas platforms,” in Geologic framework of the Chihuahua tectonic belt. Editors K. Seewald, and D. Sundeen, 75–82. (Midland, Texas: West Texas Geological Society Publication 71-59.
Smith, C. I. (1981). in “Review of the geologic setting, stratigraphy, and facies distribution of the Lower Cretaceous in northern Mexico” in Lower Cretaceous stratigraphy and structure, northern Mexico. Editors S. B. Katz, and C. I. Smith, 1–27. (Midland, Texas: West Texas Geological Society Publication 81-74.
Smith, J. F. (1940). Stratigraphy and structure of the Devil Ridge area, Texas. GSA Bull. 51 (4), 597–637. doi:10.1130/gsab-51-597
Stoyanow, A. (1949). Lower Cretaceous stratigraphy in southeastern Arizona, 38. (Boulder, Colorado) Geological Society of America Memoir.
Suarez, M. B., Ludvigson, G. A., González, Al, Suwaidi, A. H., and You, H. L. (2013). “Stable isotope chemostratigraphy in lacustrine strata of the Xiagou Formation, Gansu Province, NW China,”. Isotopic studies in cretaceous research. Editors A.-V. Bojar, M. C. Melinte-Dobrinescu, and J. Smit (London: The Geological Society) Special Publications), 382, 143–155.doi:10.1144/sp382.1
Suarez, M. B., Milder, T., Peng, N., Suarez, C. A., You, H., Li, D., et al. (2018). Chemostratigraphy of the Lower Cretaceous Dinosaur-Bearing Xiagou and Zhonggou Formations, Yujingzi Basin, Northwest China. Mem. Soc. Vertebrate Paleontology 18, 12–21. doi:10.1080/02724634.2018.1510412
Wang, Y., Bodin, S., Blusztian, J. S., Ullmann, C., and Nielsen, S. G. (2022). Orbitally paced global oceanic deoxygenation decoupled from volcanic CO2 emission during the middle Cretaceous Oceanic Anoxic Event 1b (Aptian-Albian transition). Geology 50 (11), 1324–1328. doi:10.1130/G50553.1
Wilson, J. E., and Jordan, C. (1983). “Middle Shelf,” in Carbonate depositional environments. Editors P. A. Scholle, D. G. Bebout, and C. H. Moore (Tulsa, Oklahoma: The Amperican Association of Petroleum Geologists), 297–343.
Keywords: stable isotope, carbon, chemostratigraphy, Yucca formation, cretaceous, west Texas
Citation: Biebesheimer EJ and Suarez MB (2024) Carbon isotope chemostratigraphy of the Yucca Formation from the Solitario, Big Bend Ranch State Park, Texas. Front. Earth Sci. 12:1277642. doi: 10.3389/feart.2024.1277642
Received: 15 August 2023; Accepted: 27 May 2024;
Published: 03 July 2024.
Edited by:
Yadong Sun, University of Erlangen Nuremberg, GermanyReviewed by:
Luigi Jovane, University of São Paulo, BrazilCopyright © 2024 Biebesheimer and Suarez. This is an open-access article distributed under the terms of the Creative Commons Attribution License (CC BY). The use, distribution or reproduction in other forums is permitted, provided the original author(s) and the copyright owner(s) are credited and that the original publication in this journal is cited, in accordance with accepted academic practice. No use, distribution or reproduction is permitted which does not comply with these terms.
*Correspondence: Biebesheimer, E. J., ZWxsaWUtYmllYmVzaGllbWVyQGt1LmVkdQ==; M. B. Suarez, bWIuc3VhcmV6QGt1LmVkdQ==
Disclaimer: All claims expressed in this article are solely those of the authors and do not necessarily represent those of their affiliated organizations, or those of the publisher, the editors and the reviewers. Any product that may be evaluated in this article or claim that may be made by its manufacturer is not guaranteed or endorsed by the publisher.
Research integrity at Frontiers
Learn more about the work of our research integrity team to safeguard the quality of each article we publish.