 Ana Lillian Martin-Del-Pozzo
 César Alberto Santos Morales
- 1Instituto de Geofísica, Universidad Nacional Autónoma de México, Ciudad Universitaria, Mexico City, Mexico
- 2Posgrado en Ciencias de la Tierra, Universidad Nacional Autónoma de México, Ciudad Universitaria, Mexico City, Mexico
Transitions from effusive to explosive activity can increase hazards making it crucial to define early indicators such as changes in the magnetic signals. After more than 80 cycles of crater-dome extrusion and destruction from 1996 on, Popocatépetl volcano (Mexico) experienced changes in its behavior from March 15 to 18 July 2019, when no lava domes were observed. Some of the domes behaved as contained lava flows within the crater floor (pancakes) while others were more irregular-shaped. Activity decreased considerably over this 2019 interval except for the unexpected explosions in March and June, that produced ash plumes reaching up to 14,000 m a.s.l. In order to investigate the causes of the transition from effusive to explosive behavior in March and June, we analyzed the time series from the magnetic monitoring network at Popocatépetl volcano between October 2018 and December 2019. The raw signals were analyzed by weighted differences (WD) based on the elimination of non-local changes from the total intensity values of the geomagnetic field and the discrete-time continuous wavelet transform was used to evaluate the local variations of energy within the time series. The high energy periods (linked to negative magnetic anomalies) are induced by magma ascent associated with movement within the conduit. They indicate that the sudden explosions were due to the ascent of several magma batches that were slowed during ascent and were not able to reach the surface. Changes in the rheology of the lava are linked to the influx of several batches of magma with different compositions as well as to compaction by gas loss when ascending andesitic magma pushed out overlying more viscous degassed magma clearing the conduit, which can explain why these sudden explosions were more energetic. Several geophysical data sets as well as tephra compositions were integrated to support this conclusion. The correlated multiparameters also confirm that geomagnetic volcano monitoring has been essential in understanding the processes that drive the observed changes in eruptive behavior. We present new evidence for the detection of transient events produced by magma ascent and changes in the feeding system of Popocatépetl volcano with wavelet analysis. Detailed vulcanomagnetic processing, especially when it is correlated with other monitoring parameters, provides information on ascending magma and several conduit processes that would otherwise be camouflaged. Ascending batches may precede an eruption but they can also ascend in several pulses indicating how dome growth occurs.
1 Introduction
Changes in eruptive behavior of a volcano are influenced by complex volcanic processes such as magma ascent, changes in conduit conditions and variation in magma composition (Martin-Del-Pozzo et al., 2003; Preece et al., 2016; Nakada et al., 2019). Popocatépetl volcano (5,452 m a.s.l) is a large andesitic stratovolcano in central Mexico that after its reawakening in December 1994 entered a phase of repetitive crater-dome building and destruction episodes. From 1996 to 2018, 80 successive crater domes were formed. Some of the crater domes were pancake-type domes that filled the crater floor but others had steeper fronts and irregular topography associated with more viscous flow. However, from March 15 to 18 July 2019, the eruptive style changed from these more effusive domes to only intermittent degassing with periods of quiescence which were interrupted by sudden explosive eruptions. During reconnaissance flights over the crater carried out on April 8 and 26, May eight and 11 June 2019, no lava domes were observed in the crater.
The transition from effusive to explosive activity at Popocatépetl volcano has also been observed in other open volcanic systems such as at Colima volcano, Mexico (Varley et al., 2010), Merapi, Indonesia (Preece et al., 2016) and in closed systems such as at Sinabung, Indonesia (Nakada et al., 2019). In the case of Sinabung, the explosive behaviour at a time when growth of the lava dome/flow had almost stopped was explained by limited degassing of the magma within the upper conduit. A semi-permeable dome system seems to be a more appropriate term for Popocatépetl’s behavior during these last decades. To understand the driving forces behind the eruptive style and the factors influencing changes in activity, textural and compositional analyses of ash have also been carried out (e.g., Miwa et al., 2013; Preece et al., 2016). At Popocatépetl, compositional and textural analysis of ash and other ejecta accompanying explosive eruptions has focused on investigating the compositional variations and textural characteristics associated with the eruptive activity (Straub and Martin-Del-Pozzo, 2001; Martin-Del-Pozzo et al., 2008a). They reported that the Popocatépetl, mafic end member is a magnesian andesite. Ash has variable, but high SiO2 contents of ≈55–62 wt% leading the authors to infer that the volcano was fed by batches of mafic magma that during their repeated ascent over periods of days, crystallized and mixed with more evolved magma during ascent.
Previous studies have shown that by analyzing the variations of the local magnetic field, which can be small or even reach tens of nanoteslas depending on rock magnetization, it is possible to obtain information about different volcanic process (e.g., Yukutake et al., 1990; Zlotnicki et al., 1993; Zlotnicki and Bof, 1998; Currenti et al., 2005). For example, a positive change of 9 nT that occurred during the 18 May 1980, eruption at Mount St. Helens was explained as an elastic strain release (Johnston et al., 1981). Large geomagnetic changes (both positive and negative) of more than 80 nT during the early stages of a new dike intrusion and dome extrusion at the Unzen volcano were associated with thermal demagnetization and electrokinetic effects caused by strain/stress, rotation, displacement and removal of magnetic materials (Tanaka, 1995).
Yukutake et al. (1990) observed a significant decrease in the total geomagnetic intensity 5 years (−5.3 nT/year) and 6 months (about −2.2 nT/month) before the eruption of Oshima volcano in 1986. They considered that these decreases in total intensity were associated with thermal demagnetization caused by the intrusion of magma through the vent of the central cone. Sasai et al. (2002) also carried out magnetic field observations during the 2000 activity of Miyake-jima volcano, and reported a decrease in the local total geomagnetic intensity of tens of nT, caused by the thermal demagnetization at a shallow depth by the temperature rise within the volcano during the formation of a new caldera.
At Etna, Del Negro and Currenti (2003) recognized total geomagnetic intensity changes related to different volcanic events during the 2001 flank eruption. Among them, they observed that the total intensity decreased by about 7 nT during the propagation of eruptive fissures in the southern flank, which was attributed to piezomagnetic effects caused by stress redistribution due to magmatic intrusions at different depths. In the 2002–2003 eruption of Mt Etna, decreases from 1 to 5 nT in the local magnetic field were interpreted as magma injection to a depth of 3–4 km below the summit craters (Del Negro et al., 2004).
The magnetic monitoring results from Merapi volcano during 1995 that ended with the growth of a dome in July 1996, showed that the magnetic changes of short, medium-and long-term lasting months to years (1.5–15 nT) correlated well with seismic activity and piezomagnetic and thermomagnetic effects, respectively (Zlotnicki et al., 2000). At Etna, negative anomalies lasting one to 5 h preceded the 2008 eruption (Napoli et al., 2008). The amplitudes of these magnetic changes are similar to those reported at Popocatépetl volcano in 2006 (Martin-Del-Pozzo et al., 2008b).
Volcanomagnetic anomalies at Popocatépetl are caused by magma injection and gas pressure build up which is sensitive to vent morphology and clearing during eruption (Martin-Del-Pozzo et al., 2002). Most are short time duration negative anomalies that precede eruptions by 1–8 days. According to their duration and characteristics, Martin-Del-Pozzo et al. (2002) associated sharp increases in the processed magnetic signal with piezomagnetic effects (stress release) caused by explosions. Other types of anomalies were linked to seismicity and longer step-like increases to magma cooling and dome oxidation (weeks to months). Explosions disrupt this trend (Martin-Del-Pozzo et al., 2002).
Precursory negative magnetic anomalies of up to −5 nT at Popocatépetl volcano were associated with ascent of the several batches of magma before the subPlinian eruption in December-January 2000–2001 (Martin-Del-Pozzo, 2012). Multiparameter monitoring showed negative magnetic anomalies occurred 2 months before, preceding increases in seismicity by several days (Martin-Del-Pozzo et al., 2003).
During the 2006 activity at Popocatépetl, decreasing magnetic signals between −1.1 and −15 nT, accompanied by harmonic tremor were associated with magma ascent and dome emplacement (Martin-Del-Pozzo et al., 2008b). The authors reported that these negative anomalies were followed by increasing magnetic signals lasting one to more than 3 months indicating cooling and magnetization of the lava domes.
In this paper we present the study of the time series recorded by the Popocatépetl magnetic monitoring network from October 2018 to December 2019 during which, in addition to the change from effusive to explosive behavior, the activity was also characterized by the extrusion of lava domes 81, 82, 83, 84 and 85 (Figures 1, 2). To investigate the cause of the transition from effusive to explosive activity, we processed the magnetic data of the entire period of study using the weighted difference technique (WD) that eliminates most of the external field. The resulting volcanomagnetic signal (or WD signal) was divided into 3 periods of 5 months with the goal of obtaining more detailed information about the local time variation of energy before, during and after the eruptive transition in the spring of 2019. The local variations of energy within the magnetic signal were analyzed by means of a wavelet transform using the Morlet basis function in order to investigate the causes of the transition from effusive to explosive activity that occurred in summer 2019 at Popocatépetl volcano.
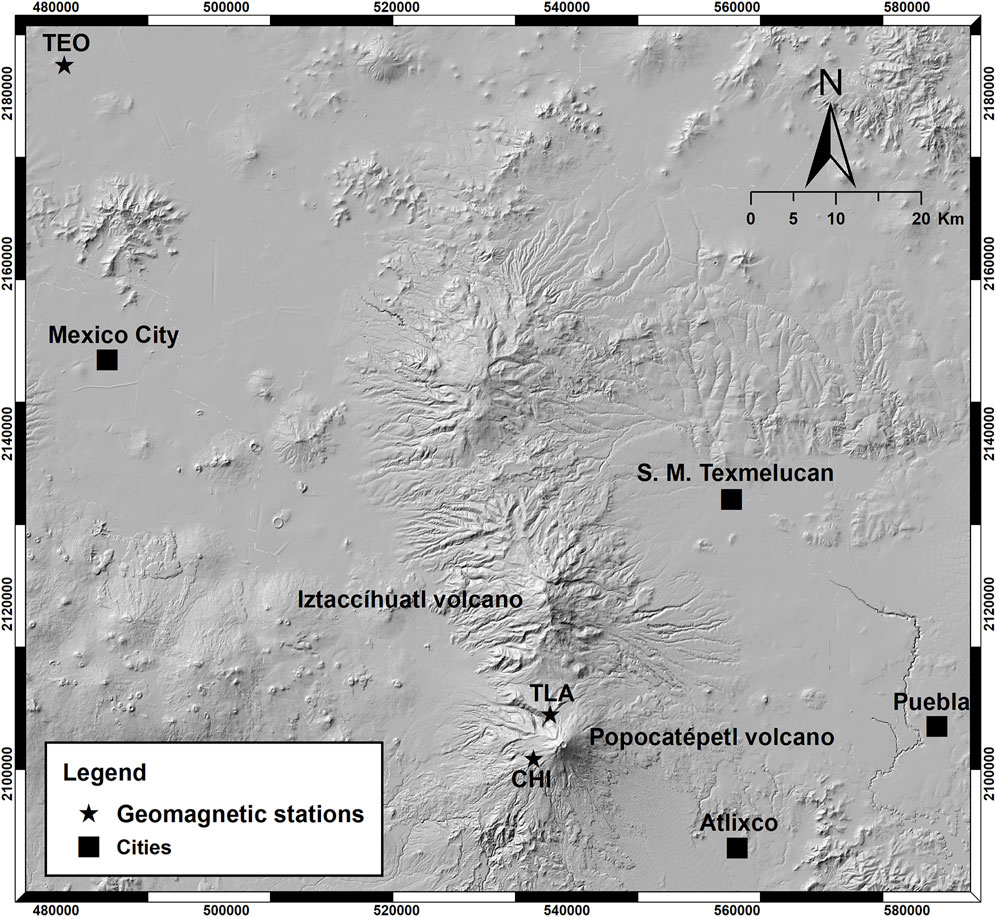
Figure 1. Location map of the permanent magnetic stations on Popocatépetl volcano (Digital elevation Model, INEGI). Large cities such as Mexico City and Puebla are less than 60 km from the volcano.
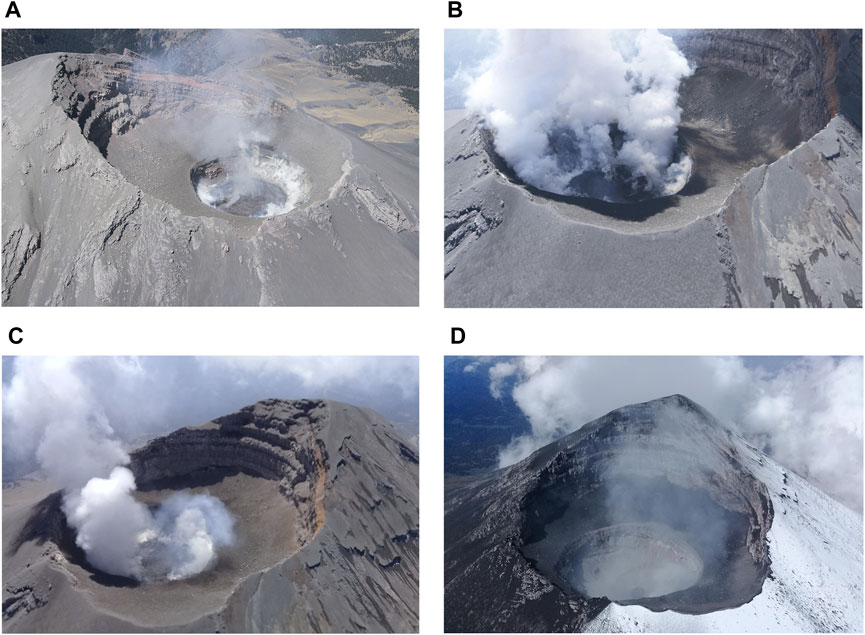
Figure 2. Popocatépetl´s crater-domes. (A) Early crater-dome 82 on 21 February 2019, (B, C) Crater-dome 82 on 28 February 2019, and (D) Small dome 84 on 27 September 2019. Courtesy of Angel Gomez and Robin Campion.
2 Methodology
The magnetic time series used in this paper were collected from the permanent Popocatépetl magnetic network from October 2018 to December 2019 (Figure 1). This network consists of three stations, two placed on the volcano (CHI y TLA) and a reference station (TEO) installed about 91 km NNW from the volcano, away from the influence of the volcano´s field. The CHI and TLA stations are located at 3,990 and 4,029 m a.s.l., respectively. The reference station (TEO) is located at 2,280 m a.s.l. The magnetometer at the CHI station (Overhauser POS1 N129) at ∼3 km from crater has a ± 0.1 nT accuracy and a 0.01 nT resolution while the TLA station (Geometrics G856) is located 5 km from the crater and has an accuracy of 0.4 nT and a 0.1 nT resolution. The TEO station (Overhauser POS1 N129) operates with a ± 0.1 nT accuracy and 0.01 nT resolution. The total field data from the three stations are sampled synchronously every 30s and sent by telemetry to the Geophysics Institute of the Universidad Nacional Autónoma de México (UNAM) in Mexico City. For this work, TEO and CHI data were used because both have the same precision and resolution, thus allowing the detection of small anomalies.
The raw magnetic data were processed with the weighted difference method proposed by Rikitake (1966) to reduce the effects of the variations of the non-local external geomagnetic field (magnetic storms, micropulsations, etc.) and point out the magnetic changes associated with the volcanic activity.
The weighted differences value (WD) was averaged over 1-min periods to reduce noise in the differential data. The WD is considered in terms of peak to peak amplitude and descending and ascending signals are termed anomalies that are relative to each other. The anomalies are not modeled quantitatively but are correlated with geochemical and geophysical parameters (Martin-Del-Pozzo et al., 2002). The negative anomalies (and also positive anomalies) are defined as variations or changes in the volcanic geomagnetic field that in most cases can reach amplitudes between one and ∼10 nT (Del Negro et al., 2004). We focused mainly on identifying the negative magnetic anomalies of the WD signal at Popocatépetl because they have been previously associated with magma movement (Martin-Del-Pozzo et al., 2003). The term negative anomaly is given here when the value of the weighted differences decreases gradually or sharply based on its shape and amplitude. The magnetic field drifts over time. For this reason, we consider the baseline directly in relation to the previous points. The negative anomaly is measured from where the signal begins to descend to the lowest point and the positive anomaly from where it begins to increase to the highest point (Supplementary Figure S1). The anomaly begins when the processed signal shows a descending trend that is statistically significant. The morphology of the signal and duration has been reported previously (Martin-Del-Pozzo et al., 2002). The geomagnetic signals are monitored continuously and compared with other monitoring parameters. The signal is processed at least twice a week and when possible in real time depending on the volcanic activity.
The data were divided into three, 5-month periods in order to study the magnetic signal, before, during and after the period of no dome growth in 2019 and the effusive to explosive transition. Once the magnetic anomalies were identified, we evaluated the energy of the WD signal during these periods based on the wavelet transform and the Morlet wavelet function, the latter because it provides a good balance between accurate time localization and high frequency resolution (Grinsted et al., 2004; Tamburello et al., 2013). Details of the Morlet function are in Soon et al. (2014). To carry out the wavelet analyses we used the method proposed by Torrence and Compo (1998) because it allows studying the local variations of energy within the time series by means of a similar process to the short-time Fourier transform (Beecham and Chowdhury, 2010). A detailed description of wavelet analysis can be found in Lapins et al. (2020). Following Torrence and Compo (1998), we obtained the time–frequency distribution of energy or wavelet power spectrum (WPS) for the three periods: from October 2018 to February 2019, from March to July and from August to December 2019.
We also performed a scale-averaged wavelet power spectrum (SAWP) in order to further examine fluctuations in power over specific ranges of wavelet periods (bands) (Coulibaly and Burn, 2004). In other words, the SAWP represents the average variance (σ2) over a desired band, in this case, of the WPS. In order to implement this average variance analysis, it was necessary to define a confidence or significance level for the SAWP. A common parameter is the 95% confidence level, which is equivalent to the 5% significance level. More information on the computation and application of such significance level for the SAWP can be found in Fedi et al. (2003). Thus, the SAWP computation allows the examination of the changes in power over a selected range of scales, with respect to the 95% confidence level and at the same time provides an efficient way to evaluate the significant zones of the volcanomagnetic signal, specifically the WD values of the negative magnetic anomalies (nT). The power spectra computed so far comprise a large variety of signal structures and not all of them encode significant changes (Jänicke et al., 2009). To distinguish between significant and random structures, a significance test was performed using a red spectrum as the background to determine the 95% significance level and the corresponding cone of influence, as recommended by Torrence and Compo (1998). Thus, if a peak in the WPS is above this background noise spectrum, then it is assumed to be a true feature with a certain level of confidence (95% confidence interval). A much more detailed description of all procedural details used to compute the significance of the spectrum can be found in Torrence and Compo (1998). The significant zones of the WD signal were identified above this SAWP threshold.
To enhance the anomalies, we also reprocessed with a smaller time frame (less than the 5-month periods). We tried several different scales in order to better show the results of both the magnetic processing and the correlation with the volcanic activity and other monitoring parameters shown in the subplots that correspond to the SAWP (scale-averaged wavelet power spectrum). This allows one to examine the energy changes over the selected range of scales, with respect to the 95% confidence level. The scale ranges were selected based on time-frequency distribution of the high energy areas shown in the wavelet power spectrum (WPS).
The resulting wavelet spectrum were compared in time with the date of observation and destruction of lava domes, height of eruptive columns and with other geophysical data such as minutes of volcanic tremor, number of long-period (LP) earthquakes, number of volcano-tectonic (VT) earthquakes, SO2 emission rates and volcanic heat flux values. The dome observations were made mainly from overflights. Column heights were obtained by direct observation, cameras and from satellite data, seismic data from the CENAPRED (Centro Nacional de Prevencion de Desastres) reports, SO2 emission data from the MOUNTS website (http://www.mounts-project.com) and heat flux data from the MODVOLC website (http://modis.higp.hawaii.edu/contents.html). A detailed description of the MOUNTS volcano monitoring platform (Monitoring Unrest from Space) can be found in Valade et al. (2019). Ash and ejecta are sampled with the Popocatépetl ash monitoring network and are analyzed and correlated weekly (daily during periods of increased activity) with the geophysical and geochemical parameters mentioned above (e.g., Martin-Del-Pozzo et al., 2003; Martin-Del-Pozzo et al., 2008a).
3 Results
Two new lava domes grew in the crater from October 2018 to February 2019 (domes 81 and 82) but from March to July 2019 no visible domes were detected. The activity that preceded dome 83 was characterized by a period of low activity with sudden unexpected explosive eruptions, the first of which occurred in March 2019. Explosive eruptions at Popocatépetl normally are preceded by a marked increase in seismicity and sometimes gas emission that did not occur during this period. This marked a transition from the previous behavior with dome formation to the explosive eruptions with no evident precursory seismic activity and then back to the formation of the next lava dome. From August to December 2019, effusive activity resumed with the formation of two new domes, 84 and 85. After the formation of these domes, each was destroyed by an explosive eruption preceding the next dome constructive phase. Wavelet power spectrum (WPS) results show components with high power values for three successive 5-month periods that are include negative magnetic anomalies that preceded the formation of domes 81–85 by approximately six to 30 days (and possibly even 45) but also occurred in the transition period when domes were not visually detected.
3.1 The first period
The first 5-month period began on 1 October 2018 and ended on 28 February 2019 (Figure 3). At the beginning of this period, Popocatépetl volcano had explosions with small to moderate-sized ash plumes (0.2–3.5 km above the crater, Figure 3A). Most of the ash was made up of blocky particles of glassy dome lithics with plagioclase and pyroxene crystals. From October 8 to 10, 2018, the WD signal had a −2.54 nT negative anomaly (anomaly 1, Figure 3B; Table 1). There was also a positive anomaly associated with an increase in column height between October 3 and 9, 2018, that probably was caused by the clearing away of the remnants of a previous dome (Figure 3). The wavelet power spectrum (WPS) shows that the energy within the WD signal centered in the 256–16384 min band. The SAWP indicates that the areas of high energy were statistically significant during most of this period (Figures 3C–F). The energy increased from October 17 to 12 November 2018, 1 month prior to the growth of dome 81 while the WD signal had four negative anomalies (anomalies 2–5) with amplitudes from −1.40 to −3.48 nT. From November 16 to 23, 2018 preceding this same dome 81, activity was characterized by pre-extrusion explosions. They produced column heights between 0.6 and 2.1 km represented by small positive peaks in WD as well as two negative anomalies with amplitudes of −1.82 and −1.51 nT and durations from 84 to 78 h (anomalies 6 and 7, Table 1; Figure 3B, Supplementary Table S1; Supplementary Figure S2). Therefore, the magma that fed the dome had probably risen to fairly shallow depths about a month before the observation of dome 81 on 22 November 2018 (Figure 3).
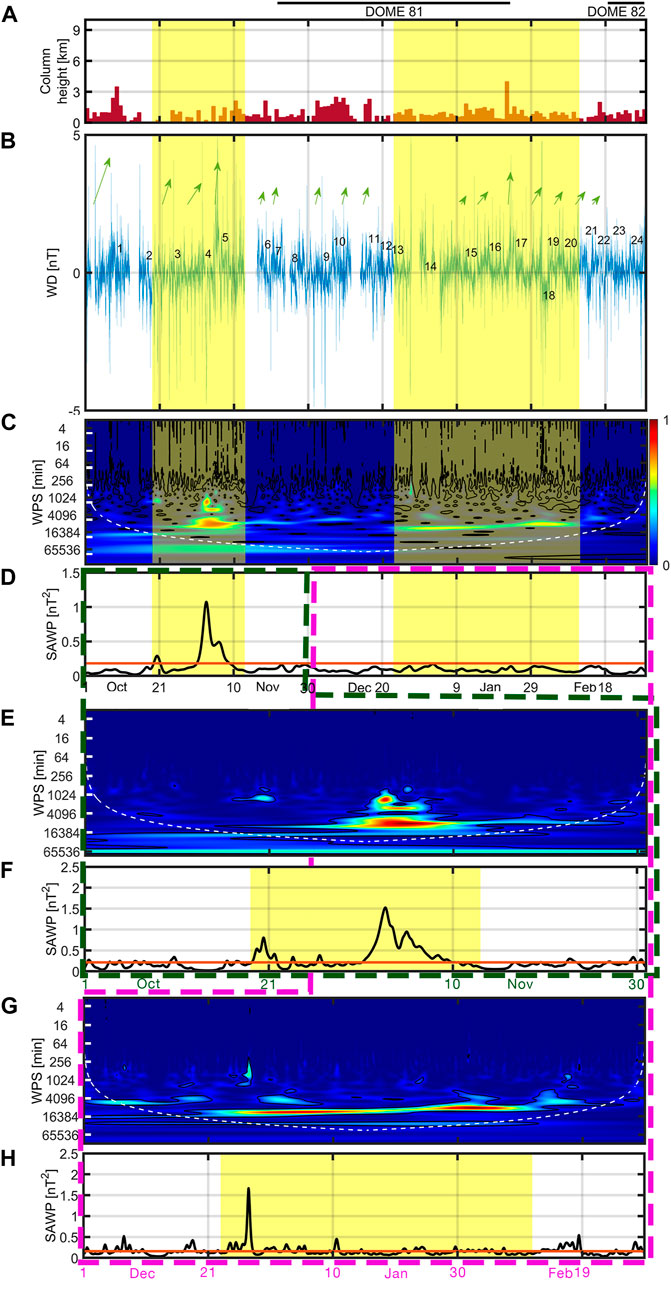
Figure 3. Period from October 2018 through February 2019 showing crater-domes 81 and 82 (top, solid and hyphenated line), (A) column heights and (B) numbered negative magnetic anomalies (WD). Arrows indicate increasing signal correlated with explosions. (C) Wavelet power spectrum (WPS) with color coded intensity. The white dashed line is the cone of influence. (D) Statistical significance (SAWP) of the WD signal for the period is shown in the lower graph. The red horizontal line indicates the 95% confidence level. Peaks above the confidence level are significant zones of the WD signal. Yellow shadowing indicates proposed periods of magma injection. (E) Close up of the WPS from October 1 to 30 November 2018, shown in green dotted line. (F) Close up of the SAWP from October 1 to 30 November 2018, shown in green dotted line. (G) Close up of the WPS from 1 December2,018 to 28 February 2019, shown in pink dotted line. (H) Close up of the SAWP from 1 December2,018 to 28 February 2019, shown in pink dotted line.
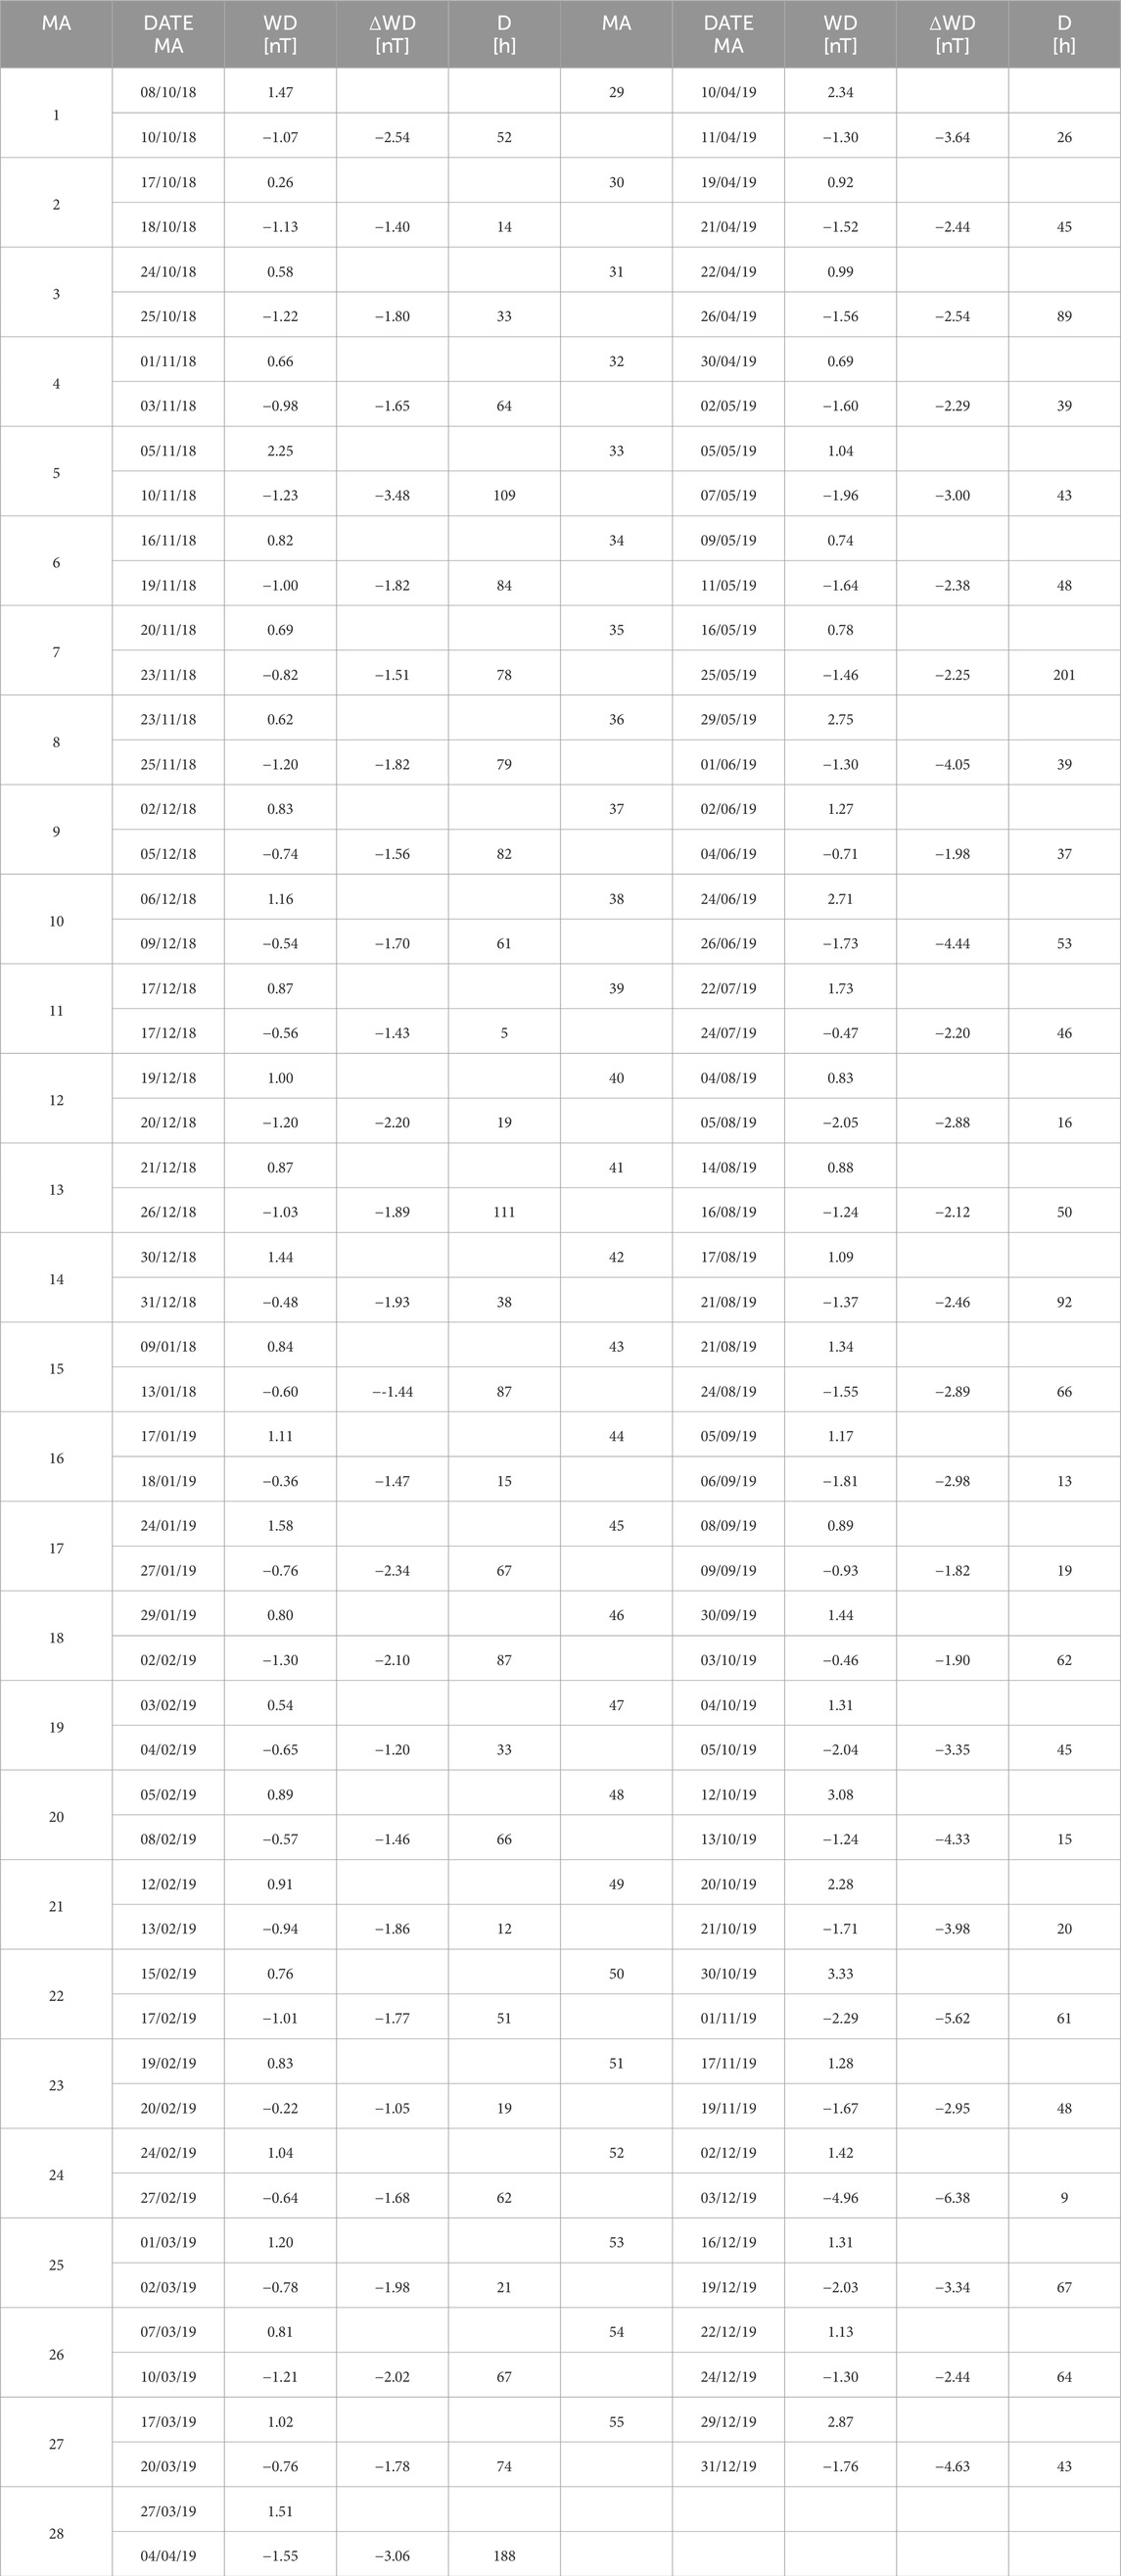
Table 1. Popocatépetl negative magnetic anomalies from October 2018 to December 2019. Magnetic Anomaly (MA), Weighted Differences (WD), Relative changes (ΔWD) and Duration (D).
From the observation date of dome 81 on November 22 to 21 December 2018, the volcano produced ash plumes varying from 0.35 to 2 km high. Also, during this first stage of the growth of dome 81, the WD signal between November 23 and 20 December 2018, had at least five small negative anomalies (anomalies 8–12), which reached amplitudes from −1.43 to −2.20 nT with durations between 5 and 82 (Figure 3B; Table 1).
Ejecta was mostly made up of dense juvenile dome rocks. In mid-December fresh ballistics showed two different degassed components in sharp contact (no vesicles nor streaking that would indicate mixing between them) with 62 and 66 wt% SiO2.
During the last phase of dome 81, explosions with column heights of 0.34–4 km partially destroyed the dome. The WD signal from 21 December 2018 to 18 January 2019, showed at least four negative anomalies (anomalies 13–16) with amplitudes from −1.44 to −1.93 nT lasting 15–111 h (Figure 3B; Table 1). Positive anomalies correlated with the explosions up to 22 January 2019, which destroyed dome 81 (Figure 3A; Table 1).
The Wavelet Power Spectrum (WPS) began to increase from the last stages of dome 81 to the precursory activity of dome 82, that is, from 21 December 2018 to 8 February 2019. The SAWP indicates it is also statistically significant when this shorter period is considered (Figures 3G, H). This increase in the energy of signal formed a horizontal periodic component in the 256 16,384 min band that coincided with eight negative anomalies. The first four anomalies (−1.44 to −1.93 nT) lasting 15–111 h, occurred during the last phase of dome 81 and the other four before the extrusion of dome 82, with amplitudes from −1.20 to −2.34 nT lasting 33–87 h (Figure 3B; Table 1). Despite low wavelet power values from February 12 to 17, 2019 when the signal is reprocessed at a smaller time scale the wavelets become significant. Two more negative anomalies (−1.86 to −1.77 nT) were identified (Figure 3B; Table 1). Low-level pre-dome 82 extrusion explosions resulted in column heights between 0.4 and 1.1 km (Figure 3A).
During the early stages of dome 82 growth, from February 19 to 27, 2019, small intermittent explosions continued (Figure 3A). During this time span the WPS did not show areas of high energy although reprocessing at shorter time spans shows two areas of significance (SAWP) as well as the WD signal had two small negative anomalies (anomalies 23 and 24, -1.05 and −1.68) (Figures 3B–D, G, H; Table 1).
3.2 The transition period
The second 5-month period from March 1 to 31 July 2019, began with the last stages and partial destruction of dome 82 that lasted from March 1 to 14, 2019. From mid-February to mid-March 2019, the ash contained a lower percentage of dome lithics. The March explosions that destroyed dome 82 produced ash plumes reaching up to 5 km above the crater that were recorded as positive anomalies (Figures 4A, B). During the last stages of dome 82, negative anomalies 25 and 26 with amplitudes of −1.98 and −2.02 nT and duration of 21 and 67 h occurred (Table 1).
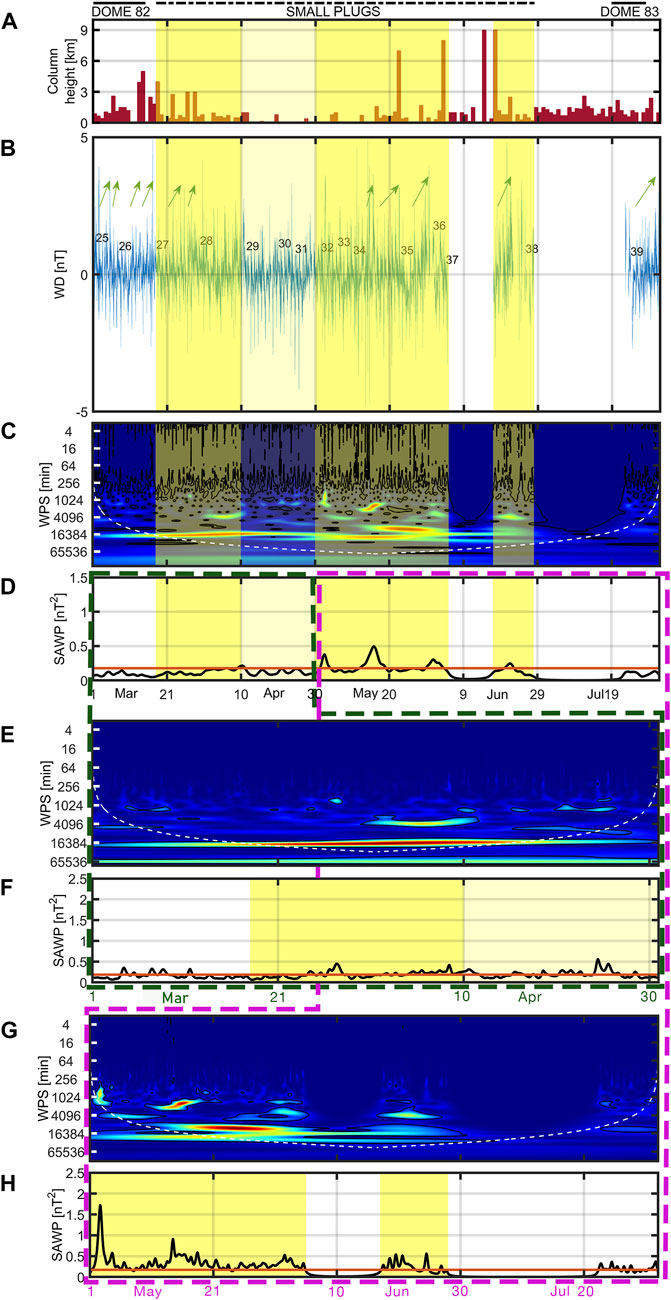
Figure 4. Transition period from March to July 2019 showing crater-domes 82, the period of sudden large explosions with no visible domes (possibly small plugs), crater-dome 83 (top, solid and hyphenated line), (A) column heights and (B) numbered negative magnetic anomalies (WD). Arrows indicate increasing signal correlated with explosions. (C) Wavelet power spectrum (WPS), color code intensity same as in Figure 3. The white dashed line is the cone of influence. (D) Statistical significance (SAWP) of the WD signal for the period is shown in the lower graph. The red horizontal line indicates the 95% confidence level. Peaks above the confidence level are significant zones of the WD signal. Yellow shadowing indicates proposed periods of magma injection. (E) Close up of the WPS from March 1 to 30 April2019, shown in green dotted line. (F) Close up of the SAWP from March 1 to 30 April 2019, shown in green dotted line. (G) Close up of the WPS from 1 May 2019 to 31 July 2019, shown in pink dotted line. (H) Close up of the SAWP from 1 May 2019 to 31 July 2019 shown in pink dotted line.
The WPS also shows a region of high energy in the last stages of dome 82 that continued through June, although it was concentrated mostly from March 17 to April 10, from April 30 to June 4 and from June 18 to 26 June 2019 (256–23988 min band) (Figures 4C–F). Positive anomalies lead up to the explosions associated with partial destruction of dome 82 especially on March 14 and 17, 2019 while most positive anomalies peak with the explosions as in June (Figures 4A, B). We infer that they are related here with how the stress is released.
After the destruction of dome 82, from March 15 to 18 July 2019, the volcano experienced a change in its usual behavior, when no evident crater domes were observed and with very low seismic activity and few emissions, that was eventually interrupted by sudden explosions apparently without lava extrusion. During this period of transition from effusive domes to explosive activity, there were at least 12 negative anomalies (anomalies 27–38) which reached amplitudes of −1.78 to −4.44 nT with durations ranging between 26 and 201 h (Figure 4B; Table 1).
Negative magnetic anomaly 27 (−1.78 nT) in mid-March occurred during the first stage of the eruptive style change when the first sudden explosions occurred, generating ash plumes from 3 to 4 km high on March 18, 22, 26 and 28, 2019 (Figure 4). This change in the behavior of the volcano prompted the Popocatépetl Scientific Committee to raise the alert level on 28 March 2019. Unfortunately, from June 5 to 16 and from June 28 until 22 July 2019, part of the signal was lost because of voltage problems but most of the gaps lasted only hours. However, the magnetic data recorded during the transition period were sufficient to recognize negative magnetic anomalies occurring before the first sudden explosions and the largest explosion of the study period since the (9 km above the crater). For example, negative magnetic anomaly 27 (17–20 March) which began to form on 17 March 2019 preceded the first sudden explosions by 1 day. The positive anomalies on the other hand, coincide with the explosions of March 14 and 17 and the explosions of June 2019, the largest of the entire study period (Figure 5).
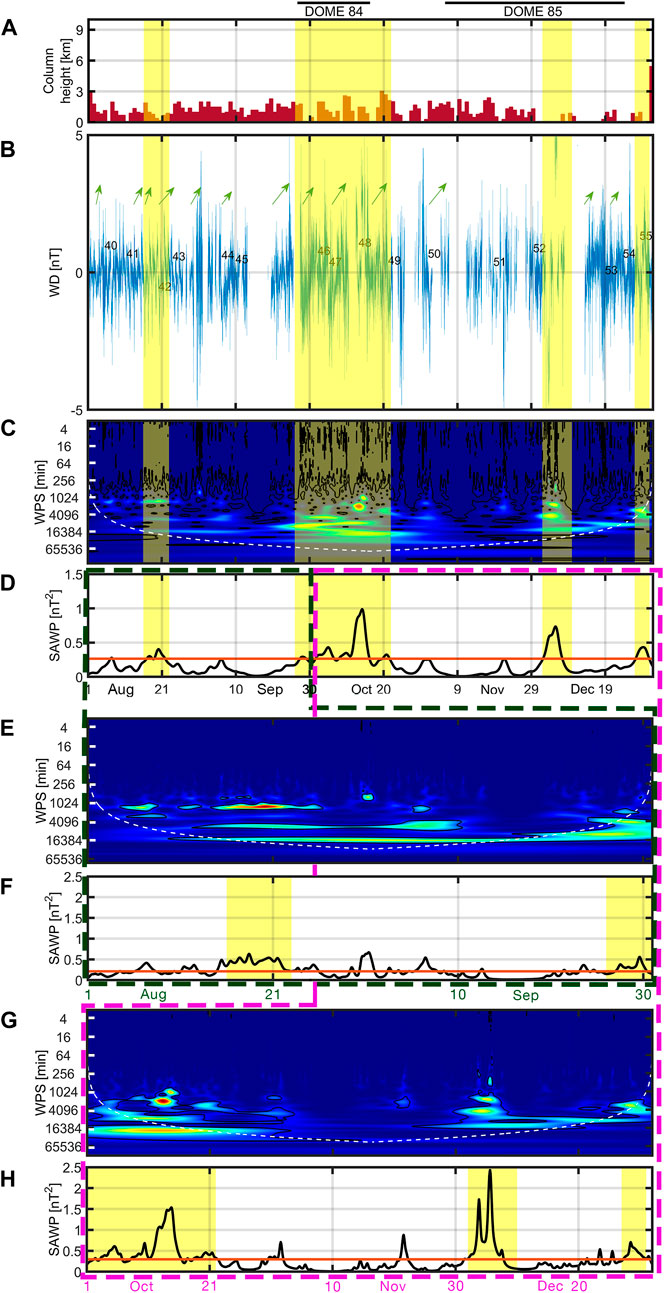
Figure 5. Period from August 2019 to December 2019. Crater-domes 84 and 85 (top, solid line), (A) column heights and (B) numbered negative magnetic anomalies (WD). Arrows indicate increasing signal correlated with explosions. (C) Wavelet power spectrum (WPS), color code intensity same as in Figure 3. The white dashed line is the cone of influence. (D) Statistical significance (SAWP) of the WD signal for the period is shown in the lower graph. The red horizontal line indicates the 95% confidence level. Peaks above the confidence level are significant zones of the WD signal. Yellow shadowing indicates proposed periods of magma injection. (E) Close up of the WPS from August 1 to 30 September 2019, shown in green dotted line. (F) Close up of the SAWP from August 1 to 30 September 2019, shown in green dotted line. (G) Close up of the WPS from 1 October 2019 to 31 December 2019, shown in pink dotted line. (H) Close up of the SAWP from 1 October 2019 to 31 December 2019, shown in pink dotted line.
Negative anomalies 28, 29, 30 and 31 with amplitudes of −2.44 to −3.64 nT and durations between 26 and 188 h were observed in the WD signal in April 2019 (Figure 4B). They occurred when the volcano was in an apparent quiescent stage characterized by only-fumarolic activity with little ash but we consider that they are linked to magma ascent that would otherwise have passed unnoticed if it were not for the reprocessing of the shorter time series with more detail (Figures 4A–F). The SAWP indicated that the WD signal was significant, between April 1 and 10, 2019 (Figure 4F). Negative anomalies (32–38) with amplitudes from −1.98 to −4.44 nT and durations from 37 to 201 h occurred in May and June 2019, during which the SAWP shows four areas of significance (Figures 4B–D, G, H). At that time, Popocatépetl again had sudden explosions that were more energetic than those at the end of March. These sudden or unexpected explosions occurred on June 3, 14 and 17, 2019, producing ash plumes up to 9 km above the crater (Figure 4A). From June 18 to 18 July 2019, the volcano had frequent small explosions.
The period of transition from effusive to explosive activity concluded after the large June eruptions and was confirmed on 19 July 2019, with the growth of dome 83 indicating that Popocatépetl’s usual activity had resumed. During the construction stage of dome 83, from July 19 to 27, no high energy areas were observed in the WPS and only one −2.20 nT negative magnetic anomaly (39) was detected. The positive magnetic anomaly was associated with the destruction of dome 83 (Figure 4; Table 1).
3.3 The last period
The third 5-month period lasted from August 1 to 31 December 2019. The first part of this period precedes dome 84, from August 1 to 26 September 2019 during which Popocatépetl volcano had frequent small–moderate explosions with ash plumes up to 3 km high (Figure 5A). During this period of low explosive activity, the WD signal had at least six negative anomalies (anomalies 40–45) with amplitudes of −1.82 to −2.98 nT, lasting from 13 to 92 h (about 4 days) (Figures 5A, B). The WPS and SAWP 256–16384 min band shows that from August 1 to 26 September 2019, there were several zones of statistical significance (on August 7, from August 16 to 18, from August 18 to 21 and on 6 September 2019), in which the negative anomalies occurred (Figures 5C, D; Table 1). When the data are reprocessed over the shorter time scale, the significance (SAWP) increases just before the appearance of dome 84 (Figures 5E, F). This preceded crater-dome 84 by 21–51 days.
During the growth and destruction of dome 84 from September 27 to October 15–20, 2019, the volcano continued with explosive activity producing ash plumes reaching altitudes of 0.5–3 km above the crater. The WD signal from September 30 to 13 October 2019 had at least three negative anomalies (46–48 anomalies) with amplitudes from −1.90 to −4.33 nT that lasted 15–62 h (Table 1). The WPS and SAWP in the 256–16384 min band showed that these high-power values were statistically significant in three zones of the WD signal (from September 28 to 30, from October 1 to six and from October 7 to 13, 2019) which coincided with the time intervals in which negative anomalies 46–48 were observed (Figures 5B–H; Table 1).
During the activity that preceded dome 85, from October 16 to 4 November 2019, the volcano produced small to moderate explosions with column heights between 0.3 and 3 km above the crater. During this activity, anomalies 49 and 50 occurred (−3.98 and −5.62 nT) lasting 20 and 61 h, respectively (Table 1). The WPS shows an area of high-energy centered on the period 1,024–16384 min band from October 16–23, 2019 (Figure 5C). The SAWP 256–16384 min band indicates that an area of high energy was significant in two zones that correlate with the intervals when anomalies 49 and 50 were observed (Figures 5B–D, G and 5H; Table 1). The energy within the WD signal started to increase between 6–18 days before the observation of dome 85, on 5 November 2019.
Dome 85 lasted from November 5 to 23 December 2019. From November 5 to 28, 2019, the volcano continued to have small to moderate explosions with ash plumes ranging from 0.3 to 2.2 km height. Due to the gaps in the magnetic records from November 5 to 28, 2019, only one negative magnetic anomaly could be identified (51) with an amplitude of −2.95 nT and duration of 48 h. From November 29 to 23 December 2019 the column heights again began to decrease, from 0.3 to 1.3 km. From December 2 to 24, 2019, three negative anomalies (anomalies 52–54 with amplitudes from −2.44 nT to −6.38 nT and durations between 9 and 67 h) were identified (Figure 5B; Table 1). The WPS increased in the 1,024–16384 min band from late November to late December 2019 (Figures 5C, D). The SAWP graph that the high-power values indicate in the 256–16384 min band that were detected in the last stages of dome 85 were statistically significant from December 2 to 3, 2019, during the period in which 52 was detected (Figures 5B–D, G, H; Table 1).
From December 29 to 31, 2019, the volcano had small explosions between 0.5 and 0.8 km high (Figure 5A). During this period, negative anomaly 55 occurred with an amplitude of −4.63 nT and duration of 43 h (Figure 5B; Table 1). The WPS showed an area of high energy centered on the 1,024–16384 min band from December 24 to 31, 2019 (Figures 5C, G). The SAWP shows it was significant from December 27 to 30, 2019 in the period in which the negative anomaly 55 was identified (Figures 5B, D, H; Table 1).
4 Discussion
Volcanomagnetic signals are the sum of a series of superimposed thermomagnetic and piezomagnetic processes that indicate what is occurring at the volcano. Processing of the signal has enhanced the negative anomalies that are related to ascent of different magma batches of varying compositions accompanied by hot gases. Positive anomalies here are mostly associated with pressure release leading up to explosions. In previous studies these types of anomalies have been associated with magma ascent through the conduit system (e.g., Del Negro and Ferrucci, 2000; Martin-Del-Pozzo et al., 2002; Martin-Del-Pozzo et al., 2003; Martin-Del-Pozzo et al., 2008a). This interpretation is supported by the increase in long period seismic events and volcanic tremor. Arciniega-Ceballos et al. (2003) and Arámbula-Mendoza et al. (2016) have previously discussed these types of seismic events at Popocatépetl volcano. There are positive anomaly peaks associated with the explosions and some leading up to them, indicating that this more detailed processing shows increases in the stress before some of the explosions. Some of the explosions do not release all the pressure and seldomly other smaller explosions follow.
4.1 The period before the change in eruptive behavior
The wavelet analysis of the first 5-month period (October 2018 to February 2019) indicates that the first area of high energy detected during magnetic precursory activity to dome 81 (between October 20 and 12 November 2018) was related to the influx of new magma (Figure 3C). The WD signal recorded two zones of statistical significance between October 17 and 10 November 2018, which coincided with four negative magnetic anomalies with amplitudes from −1.40 to −3.48 nT but influx probably continued through December 2018, as suggested by the negative anomalies (Figure 3B). Of these four anomalies (anomalies 2–5) negative anomaly five was the longest in duration at 109 h (about 5 days), suggesting that in the span of November 5–10, 2018, the upward movement of another, perhaps larger volume of magma occurred or that it paused in the conduit because of the obstruction of a more degassed previous batch of magma (Table 1).
Based on the time of occurrence of the WPS zones of significance (between October 17 and 10 November 2018), as well as increasing VT earthquakes and LP events, the influx of new magma probably started around 20 days to 1 month before dome 81 appeared (Figure 6A, 6B, 6C, 6D, 6E and 6F). The second area of high energy observed in WPS occurred during the late growth of dome 81 (December 21 to 27 January 2019), but negative magnetic anomalies suggest that influx continued as a precursor to dome 82 (January 28 to 15 February 2019). This was possibly produced by thermomagnetic effects caused by another magma batch, which began to rise during the last growth phase of dome 81 and reached the uppermost part of the conduit during the precursor activity to dome 82, even before the increase in tremor. It appears that there were several periods of magma ascent that fed dome 82 also seen in the SO2 fluxes in December (Figure 6G). Fresh ballistics from mid-December 2018, showing two distinct degassed components (62 and 66 wt% SiO2) were associated with different magma batches extruded during growth of dome 81. Increases in LP events from December 2018 to 28 January 2019, seem to confirm this interpretation since the numerical modelling of gas slugs accompanying ascent and degassing of new batches has shown that this process is capable of generating LP signals (O’Brien and Bean, 2008). The explosion associated with the destruction of dome 81 could have resulted from the gas overpressure generated by rise of gas. Nadeau et al. (2011) investigated the degassing and eruption dynamics of Fuego volcano, Guatemala, and reported progressive decreases in emissions prior to explosions, which was attributed to gas collected beneath the stiffened layer resulting in ash-rich explosions and release of accumulated gas pressurization of the upper conduit beneath a lava plug that quickly sealed after releasing its pressure by explosive degassing. Campion et al. (2018) investigated the conduit processes at Popocatépetl volcano and concluded that the vulcanian explosions are caused by the gas accumulation below a dome that is cooling until it plugs the conduit. The degassing occurring from ascending magma may produce explosive events, varying from gas puffs to strong explosions (Tamburello et al., 2011; Zobin et al., 2020).
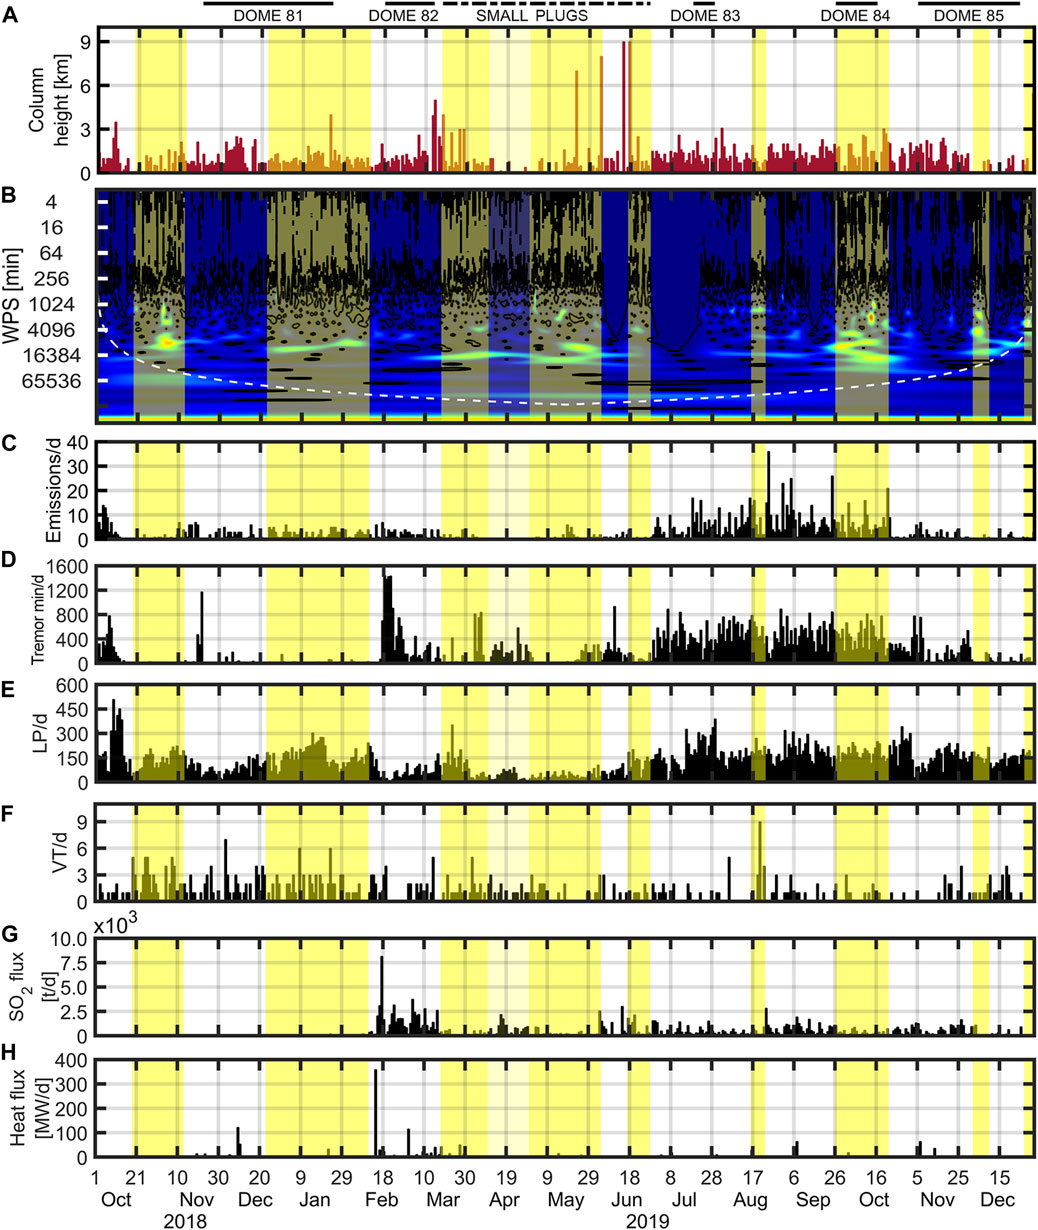
Figure 6. Integrated multiparameters from October 2018 to December 2019 (including periods before during and after the eruptive transition). Crater-domes 81–85 (upper lines). (A) Column heights, (B) WPS colors and curves are the same as those in Figure 3, (C) Number of emissions/day, (D) Minutes of tremor/day, (E) Number of LP events/day, (F) Number of VT events/day, (G) SO2 flux and (H) Heat flux.
The high energy observed during precursory activity to dome 82 (January 28 to 15 February 2019) could have been caused by magma ascent to the upper parts of the conduit at the end of December 2018. This interpretation is supported by five negative anomalies (from −1.20 to −1.86 nT) from January 28 to 15 February 2019, and by observation of tremor 15 days later, on 18 February 2019 (Figure 6D). The increases in LP events in early to mid-February and in tremor between February 17 and 22, 2019, are other indicators of fluids and gas movement within the volcanic edifice (Figure 6E).
4.2 The transition of dome construction to unexpected sudden large explosions
This was a period of unusual behavior for Popocatépetl volcano since it changed from forming crater domes, to unexpected explosive events. The results of the wavelet analysis for this second 5 months period (from March to July 2019) revealed that the transition from the pause in lava effusion and punctuated by explosive activity was marked by a continuous concentration of energy distributed from March 15 to 27 June 2019 (Figure 6B). We suggest that this high concentration of energy had a thermomagnetic origin as a direct consequence of the multiple ascent periods of separate magma batches of which some degassed near the surface and others degassed within the conduit at greater depth. We consider that the more degassed viscous magma was emplaced since December and partially plugged the conduit from March to June 2019, until the less degassed magma displaced and cleared away the plug in the June eruptions. From mid-February to mid-March 2019, the ash contained fewer dome lithics, as also mentioned previously, which could be related to the inefficient clearing of the conduit during explosions.
From the middle to the end of March 2019, the WD signal presented at least two negative anomalies (anomalies 27 and 28) with amplitudes of −1.78 and −3.06 nT which were relatively similar to the amplitudes of the four negative anomalies that preceded the extrusion of dome 81 (−1.40 to −3.48 nT). In fact, the shape of anomaly 28, which had a duration of 188 h (about 8 days), was slightly similar to anomaly 5 (Table 1).
The high energy detected in the early stages of the eruptive style change period (i.e., March 15–31, 2019) probably was caused by the ascent of magma batches that degassed near the surface acting as a shallow impermeable cap that allowed pressure to accumulate in between the sudden explosions recorded at Popocatépetl volcano on March 18, 22, 26 and 28, 2019. They were preceded by a progressive decrease in the rate of effusion. Ejecta were mostly glassy non-vesicular particles which suggest rapid cooling and lower permeability. The subsequent absence of effusive activity and the variable permeability of the shallow conduit system of Popocatépetl volcano could promote rheological stiffening of magma (e.g., Nadeau et al., 2011; Campion et al., 2018; Valade et al., 2023). The interpretation of pressurization beneath a shallow cap is also supported by the fact that between March 15 and 31, 2019, there were slight increases in seismic precursors (tremor and LPs). The SO2 emission rates (from 500 to 2,500 t/day) and heat flux are indicators of degassing near the surface (Figures 6C, D, G, H, respectively). The higher flux was related to clearing of dome 82. Deeper magma is generally more gas rich and pushes out the overlying plug.
In April 2019, eruptive activity was very low but the WD signal had four negative anomalies (anomalies 28–31) (Figure 4B). Negative anomalies 28 and 29 (−3.06 and −3.64 nT) coincided with a statistically significant zone of the WD signal recorded between April 1 and 9, consistent with an interpretation that magma ascent resumed. Some of the Popocatépetl magma batches have higher gas content and other batches are more degassed by stalling which is also complicated by the semi-permeable behavior of the conduit system (Figure 6G; Table 1). At Mount Etna volcano, sudden increase of CO2/SO2 ratios occurred paralleling the resumption of effusive activity in August 2006 (Aiuppa et al., 2007).
SO2 flux and number of LP events were lower in April 2019 than those observed during the sudden explosions at the end of March 2019, and thermal anomalies were absent suggesting that magma ascent was slower, smaller in size or less gas rich than the magma ascent associated with the sudden explosions of late March 2019 (Figure 6A). Anomalies 30 and 31 (−2.44 and −2.54 nT, respectively) seem to confirm that the area of high energy detected in April caused by the slow movement of more viscous magma. These negative changes correlate with a slight increase in the number of LPs recorded in mid to late April, which could be indicating degassing accompanying from ascending magma pulses. Varley et al. (2010) investigated the LP seismicity associated with the vulcanian explosions at Colima volcano, and reported that the formation of LP events was related to the magma movement, crystallization and fracturing, associated with enhanced strain rates close to the conduit (or fracture) margin. They established this relationship based on a model of the 2005 activity that showed how the onset of the LP swarms occurs once a certain threshold level of the effusion or magma ascent rate is exceeded.
From May to June 2019, the volcano again resumed explosive activity with sudden eruptions in late May and early to mid-June, where the most powerful explosion (on 17 June 2019) generated an ash plume 9 km-high, (Figure 6A). During this renewed explosive activity, the WD signal presented seven negative anomalies (anomalies 33–39) with amplitudes of −1.98 to −4.44 nT, which correlate with areas of significance distributed between May 1 and 21 June 2019. This correlation between the observed negative anomalies and the significance zones of the WD signal suggests that a second period of magma ascent occurred between May and June 2019. In June, another more mafic magma batch made its way through the plugs by clearing the conduit during the large June explosions as shown by ash compositions that are less evolved (59–60 wt% SiO2) compared with the more dacitic compositions of the December 2018 ejecta. Ash composition during July and August 2019, was also andesitic (59–60 wt% SiO2) and was associated with the more mafic magma in dome 83. We infer that small plugs obstructed rising magma batches from March to July 2019, until the more gas-rich and mafic batch displaced the plugs and formed dome 83 (Figure 7). This argument is consistent with the hypothesis that the eruptions may develop by fragmentation of multiple ascending magma batches (Scandone et al., 2007). The lower LPs and SO2 fluxes than those observed in April 2019 together with the absence of volcanic tremor and thermal anomalies at Popocatépetl, seem to confirm our interpretation that the area of high energy detected from May to June 2019 was related to the ascent of more volatile rich magma that pushed out the degassed viscous magmatic batches, which were not able to reach the surface or formed only small plugs (Figures 6, 7).
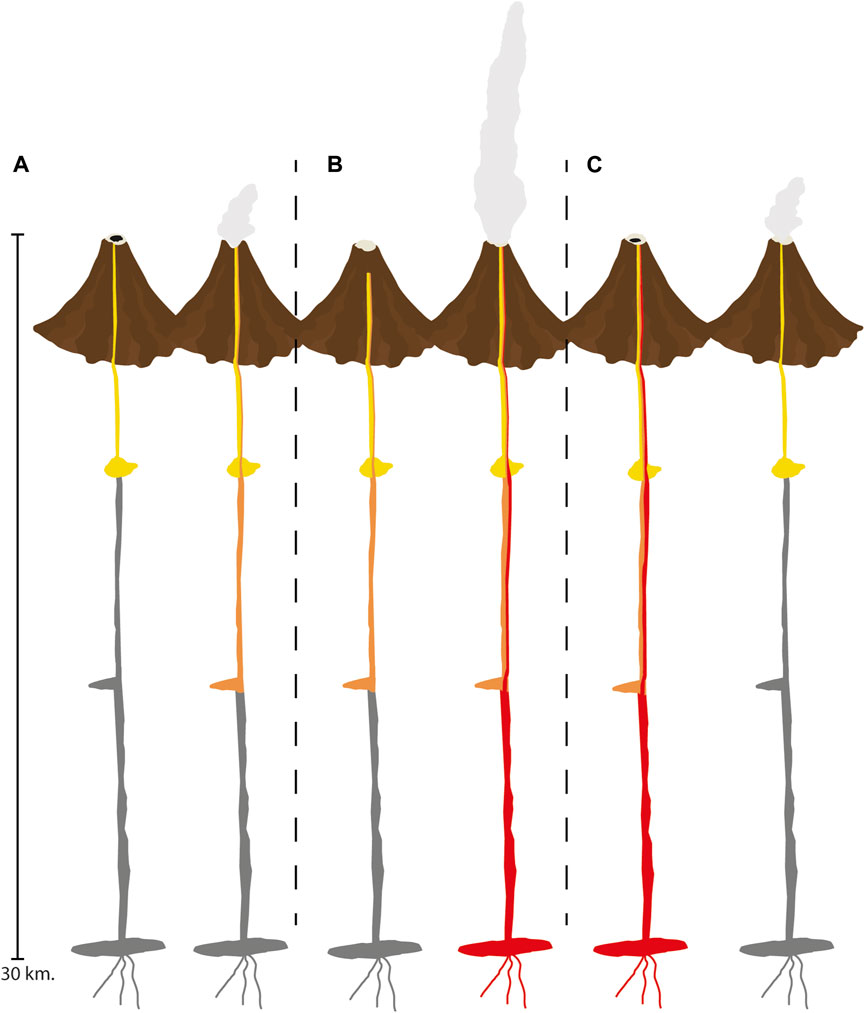
Figure 7. Simplified model of the eruptive behavior from October 2018 until December 2019: (A) Period from October 2018 to February 2019 with dacitic (yellow) and high silica andesites (orange) (B) that eventually partially plug the crater until more gas-rich mafic andesitic magma during transitional period from March to July 2019, (red) pushes the plugs out and resumes building domes from July to December 2019. (C) Shading in grey indicates it is inactive.
The transition back to effusive activity occurred on 19 July 2019, when a new crater dome (dome 83) was seen, although after the June 2019 eruptions that cleared the conduit, it returned to a semi-permeable condition again. During the construction phases of dome 83 (from July 19 to 27, 2019), a negative anomaly in the WD signal (anomaly 39) occurred with an amplitude of −2.20 nT. This marked decrease in weighted difference values observed between July 22 and 24 was followed by a positive anomaly that grew until 31 July 2019 (Figure 4). The positive anomalies or increasing signals that are marked as arrows are explained as increasing stress accompanying or directly before the explosions.
4.3 The return to usual activity at popocatépetl
Explosive activity became intermittent after dome 83, producing ash emissions reaching from 0.5 to 3 km height from August 1 to 15 September 2019 (Figure 5A). During this period of explosive activity, the WD signal had negative anomalies with amplitudes between of −2.12 and −2.89 nT, that coincided with zones of statistical significance in the WD signal between August 6 and 5 September 2019 (Figures 5B, F). This could also be related with the frequent ascent of magma batches with slightly different compositions (Straub and Martin-Del-Pozzo, 2001; Martin-Del-Pozzo et al., 2008a). The increases in minutes of tremor and number of LP events also are indicative of the movement of magma. Thus, we consider that the area of high energy is related to thermomagnetic effects caused by the input of numerous successive batches magma into the feeding system (Figure 6).
As mentioned above, explosive activity continued from September 16 to 23 October 2019, that is, before, during and after the construction phase of dome 84. During this period the WD signal also recorded four negative anomalies (anomalies 46–49) with amplitudes from −1.9 to −3.35 nT, which coincided with zones of the WD signal above the 95% confidence level distributed between September and October 2019. The correlation between the four negative anomalies and the zones of statistical significance of WD signal could indicate that the magma supply continued during the precursory activity to dome 84, the construction phase and days after the destruction of this dome.
Gaps of several weeks recorded during the precursor activity of dome 85 and in the first phases of construction of this dome between October 24 and 24 November 2019, prevented evaluation of the WPS (Figure 5C). However, in the last phases of construction of dome 85 during which the volcano had low magnitude explosions, the WPS showed high energy from November 25 to 23 December 2019. This occurred when the WD signal presented a decrease of −6.38 nT (anomalies 52–54) and a zone of significance between December 1 and 6, 2019 (Figures 5B, D).
The simultaneous occurrence of a zone of significance and two negative anomalies with amplitudes relatively similar to those recorded during the last construction phases of previous dome 84, suggest that the area of high energy detected between November 25 and 23 December 2019, could be related again to thermomagnetic effects caused by the ascent of another new magma batch (e.g., Martin-Del-Pozzo et al., 2003; Martin-Del-Pozzo et al., 2008b). As with during the construction phase of dome 84, increases in LPs and a gradual increase in tremor in November 2019 occurred during the last construction phases of dome 85. This would confirm that the period of high energy detected from late November to late December 2019 is the result of thermomagnetic effects caused by the ascent of magma pulses that fed dome 85. After the destruction of dome 85 from December 24 to 31, 2019, activity was characterized by sporadic explosions (Figure 6A). During this low-magnitude explosive activity, a negative anomaly with amplitude −4.63 nT was observed, which coincided with a significance zone between December 26 and 29, 2019 (Figures 5B, D, H). This correlation between the negative anomalies and the signal significance zone (Figure 6E) could be related to thermomagnetic effects caused by the ascent of magma with high-temperature gases released by a slowly ascending magma (e.g., Sasai et al., 1990; Kanda et al., 2010). This interpretation is supported by an increase in the number of LP events that could be signaling degassing of still another magma batch from December 24 to 31, 2019 (Figure 6E).
Different studies have shed some light on the processes involved during the changes of eruptive style from effusive to explosive and vice versa. Most have been associated with magma ascent and shallow conduit degassing. Varley et al. (2010) argued that gas accumulation was involved in the transition between effusive and explosive during the 2005 activity at Colima volcano. This conclusion was deduced from the low gas fluxes during the extrusion of degassed magma and from the large volumes of gas that had to accumulate to generate the large vulcanian explosions in May and June 2005 that produced pyroclastic flows of variable size. Zobin et al. (2021) on the other hand, considered that the transition from passive degassing to slow dome growth in January-February 2016 at Colima volcano resulted from magma ascent responsible for the explosions that cleared the vent and allowed dome growth to resume. Preece et al. (2016) also concluded that transitions between explosive and effusive phases during the eruption of Merapi volcano in 2010 were driven primarily by the dynamics of magma ascent in the conduit, with degassing and crystallization responsible for the changes in eruptive style. They suggested that the explosive behaviour was triggered by a plug in the conduit that closed the system and lead to explosions which in turn temporarily opened the system. Nakada et al. (2019) also suggested that the explosive behavior of Sinabung volcano was controlled by degassing which became more restricted because of the reduced diameter of the upper conduit.
5 The processes
During the first 5-month period from October 2018 to February 2019, activity at Popocatépetl was characterized by crater-dome formation associated with the ascent of degassed dacites and high-silica andesites (Figures 6, 7A). The transition from effusion to the cessation of effusive activity punctuated by explosive eruptions was caused by the formation of shallow plugs that blocked the ascent of deeper more mafic magmas (Figure 7B) until explosions cleared the conduit sufficiently to reset the crater-dome building phase again (Figure 7C).
The eruption has been fairly on going for 30 years and several magma batches have clogged and been cleared away explosively in the conduit. Some batches are more silicic and others more degassed, making the resulting conduit system semi permeable. This is further complicated by the complex feeding system under the conduit that appears to be made up of a series of interconnected dikes and sills (Martin-Del-Pozzo et al., 2008a; Berger et al., 2011).
Besides the degassing process, which occurs in the upper conduit, we infer that variations in the magnetic behavior are related to the ascent of multiple magma batches, some of which are more mafic. Ascent of more viscous magma that stalls in the partially obstructed conduit causes the plugs to form.
The viscosity of andesites according to the 37 experiments with high temperature and pressure phases (<500 MPa, about 20 km) carried out by Takeuchi (2015), ranges between 100–1,000 Pa s. This is consistent with viscosities calculated for undegassed (104 Pa s) and degassed magma (105 Pa s) from Popocatépetl using a model based on exsolving water from a mixed magma melt (Valade et al., 2023). They consider that the magma column exsolves most of its gas in the upper part of the conduit, then drains back and continues to degas and crystallize. Water contents measured in melt inclusions varied from 3-5 wt% in recent more explosive eruptions to 0.3–0.8 wt% in the more degassed ejecta (Atlas et al., 2006; Roberge et al., 2009). Campion et al. (2018) distinguished two types of explosions based on SO2 flux (45 kg/s average from 2013–2016), one associated with passive degassing and the other with stronger explosions preceded by a sharp descent in SO2 flux that were caused by gas accumulation below a rapidly compacting permeable dome. Variations in shallow magma viscosity are related to degassing in the upper part of the conduit and the different silica contents of the ascending batches. During the transition phase from 2019 when Popocatépetl stopped forming crater domes, we believe that the conduit became plugged with degassing crystallizing magma but another batch of more mafic ascending magma gas accumulated below it, cracked the plug and produced the large explosions letting the more mafic magma out. This contrasts with the model by Wadsworth et al. (2020) for rhyolites that proposes that explosive-effusive transitions during silicic eruptions are a consequence of progressive sintering of fragmented material that begins to flow after sufficient accumulation on the surface. We see cracks filled with magma of different compositions in the ejecta that do not have the same tephra characteristics. The transition from explosive to effusive eruptions at Popocatépetl are not due to progressive sintering, but to sufficient clearing of the conduit by large explosions.
Explosions between late May and mid-June 2019, were triggered by the ascent of less degassed, more mafic andesitic magma that pushed up the more viscous degassed batches and explosively reopened the conduit. In our previous work (e.g., Martin-Del-Pozzo et al., 2002) tectonic earthquakes and other stress related phenomena produced sharper and more abrupt signals which we think is similar to the last phase of the positive anomalies that we saw ended sharply in 2019. Previous studies on seismic precursors also are also consistent with this interpretation (Quezada-Reyes et al., 2013). Strong degassing also affects the signal but the volcanomagnetic signal is a result of all the processes that coexist at the time (Martin-Del-Pozzo et al., 2002; Martin-Del-Pozzo et al., 2003; Martin-Del-Pozzo et al., 2008b).
Understanding the timing of the different processes is crucial for forecasting. The negative magnetic anomalies and the analyses of the magnetic time series give insight into the ascent of magma batches and conduit processes that are associated with the ascent of multiple magma batches and may precede dome formation or even explosive eruptions as occurred in 2018.
6 Conclusion
We were able to reconstruct the ascent dynamics of the shallow conduit magma feeding system based on magnetic measurements correlated with other geophysical and geochemical data, both during dome extrusion and when no lava domes grew but strong explosions occurred.
This is the first-time wavelet analyses has been applied to geomagnetic data to study the activity transitions in volcanic activity although fluctuations in seismic and thermal data have been analyzed previously with wavelets at Santiaguito and Colima volcano (Massaro et al., 2019; Lapins et al., 2020).
Monitoring the volcanomagnetic signal can give insight not only on the ascent of magma batches but also on different processes occurring in the conduit. The Morlet wavelet power spectrum of the volcanomagnetic series revealed high-power regions with good correlation with the other monitoring techniques such as chemical composition and ash components reported during the study period. These areas of high energy are consistent with multiple periods of magma ascent and dome formation that helped us frame the change in eruptive style from March through June-July 2019.
The first high-wavelet power that began to appear approximately 1 month before extrusion of dome 81 was explained as a thermomagnetic effect caused by upward movement of magma. A second WPS area with high power values occurred from 23 December 2018, to 15 February 2019, was also associated thermomagnetic effects and feeding of the dome with several batches of magma. The December 2018 ejecta from dome 81 clearly showed two different high silica (62–66 wt% SiO2) compositions.
The ascent of the more volatile-rich rising magma from January 28 to 15 February 2019, triggered magma movement to form dome 82. Volcanic tremor, LP seismic events, SO2 concentration and heat flux increased sharply on 18 February 2019, which are also considered indicators of ascent of new magma batches which probably pushed part of the previous more degassed viscous magma upward.
During the time of the transition from effusion to quiescence punctuated by explosive activity, which lasted from March 15 to 18 July 2019, a strong and significant wavelet power was recorded. The correlation between the negative anomalies and the zones of significance of the WPS from March 15 to 31, 2019 suggests that the area of high energy detected in the early stages of the transition period were caused by the ascent of separate magma pulses that degassed near the surface and eventually led to closed system conditions until the sudden explosions occurred. The area of high energy detected in the WPS from May to June 2019, when the volcano resumed its explosive activity was also caused by a new period of ascent of less degassed more mafic magma batches generating the sudden explosions of June 3, 14 and 17, 2019. From Mid-July to mid-October 2019, volcanic tremor and LP seismic events increased and silica content of the ash decreased associated with the ascent of a slightly more mafic magma (59–60 wt% SiO2).
After the partial destruction of dome 83, i.e., from August 1 to 15 September 2019, the WPS showed an area with relatively high-power values, which showed a close relationship with thermomagnetic and piezomagnetic effects caused by rising magma into the feeding system. Based on the observed correlation between the negative anomalies and the zones of significance of the WPS recorded from September 16 to 23 October 2019, we infer that upward magma movement continued and hence occurred before, during and after the construction of dome 84.
Another high-energy area was detected in the WPS between November 25 and 31 December 2019, during the last phases of growth of dome 85 and after the partial destruction of this dome (from December 24 to 31, 2019). The simultaneous occurrence of a zone of significance SAWP and two negative anomalies with amplitudes relatively similar to those recorded during the last construction phases of dome 84, suggest that the area of high energy detected in the last stages of growth of dome 85 was related to thermomagnetic effects caused by the ascent of another new magma. The correlation between a negative anomaly and a significance zone of the WPS from December 24 to 31, 2019, was associated to thermomagnetic effects caused by the ascent of high-temperature gases released by a new ascending magma.
Activity at Popocatépetl volcano is controlled by a complex feeding system that is visualized through multiparametric monitoring. The magnetic signatures and specifically the wavelet analyses of the WD and tephra monitoring has enhanced the identification of different magma batches with varying compositions. Wavelet processing allowed us to evaluate the significant zones of the volcanomagnetic signal, specifically the WD values of the negative magnetic anomalies (nT). The wavelet analyses provided accurate time location and high frequency distribution of the WD signal. This correlation has been vital in identifying the process related with the change in activity during late 2018 and 2019. We have outlined periods of multiple feeding periods for the domes and identified periods of ascent when extrusion was not clear.
In conclusion, we consider that monitoring the volcanomagnetic signal and processing with the wavelet power spectrum technique helps visualize the influx of new magma through the conduit system, which is of importance to study dome growth-destruction phases and relates to a crucial problem as is the change in eruptive style.
Data availability statement
The original contributions presented in the study are included in the article/Supplementary Material, further inquiries can be directed to the corresponding author.
Author contributions
AM-D-P Head of the Magnetic and Ash monitoring network at Popocatepetl. Interpreted the data and its correlation with the other multiparameters that are monitored at Popocatepetl volcano. Responsible for writing up of the manuscript. CS Processed magnetic data with the wavelets and wrote a preliminary manuscript. All authors contributed to the article and approved the submitted version.
Funding
The author(s) declare financial support was received for the research, authorship, and/or publication of this article. UNAM funded the magnetic monitoring network. DGAPA-PAPIIT IG101023 (UNAM) partially funded the reserch and this publication.
Acknowledgments
Authors wish to thank Gerardo Cifuentes and Mario Diaz, who were indispensable in maintaining the magnetometers and recording their signals. We give special thanks to Alicia Martinez Bringas and Angel Gomez for helping with the photographs, to Sebastien Valade who graciously shared his web page data with us and to Robin Campion for the discussions and helping sample the ballistics. Sandra Gonzalez helped process information from the ash monitoring network and Mariana Sandoval, Marcela Errasti and Catalina Armendariz assisted with editing. The manuscript was much improved thanks to the comments by Gabriel Ureta, Dr. Kenderes, Heather Wright, Valerio Acocella and an reviewer.
Conflict of interest
The authors declare that the research was conducted in the absence of any commercial or financial relationships that could be construed as a potential conflict of interest.
Publisher’s note
All claims expressed in this article are solely those of the authors and do not necessarily represent those of their affiliated organizations, or those of the publisher, the editors and the reviewers. Any product that may be evaluated in this article, or claim that may be made by its manufacturer, is not guaranteed or endorsed by the publisher.
Supplementary material
The Supplementary Material for this article can be found online at: https://www.frontiersin.org/articles/10.3389/feart.2024.1204859/full#supplementary-material
References
Aiuppa, A., Moretti, R., Federico, C., Giudice, G., Gurrieri, S., Liuzzo, M., et al. (2007). Forecasting Etna eruptions by real-time observation of volcanic gas composition. Geology 35 (12), 1115–1118. doi:10.1130/G24149A.1
Arámbula-Mendoza, R., Valdés-González, C., Varley, N., Reyes-Pimentel, T. A., and Juárez-García, B. (2016). Tremor and its duration-amplitude distribution at Popocatépetl volcano, Mexico. Geophys. Res. Lett. 43 (17), 8994–9001. doi:10.1002/2016GL070227
Arciniega-Ceballos, A., Chouet, B., and Dawson, P. (2003). Long-period events and tremor at Popocatépetl Volcano (1994–2000) and their broadband characteristics. Bull. Volcanol. 65, 124–135. doi:10.1007/s00445-002-0248-8
Atlas, Z. D., Dixon, J. E., Sen, G., Finny, M., and Martin-Del Pozzo, A. L. (2006). Melt inclusions from Volcán Popocatépetl and Volcán de Colima, Mexico: Melt evolution due to vapor-saturated crystallization during ascent. J. Volcanol. Geotherm. Res. 153 (3-4), 221–240. doi:10.1016/j.jvolgeores.2005.06.010
Beecham, S., and Chowdhury, R. K. (2010). Temporal characteristics and variability of point rainfall: a statistical and wavelet analysis. Int. J. Climatol. 30 (3), 458–473. doi:10.1002/joc.1901
Berger, P., Got, J. L., Valdés González, C., and Monteiller, V. (2011). Seismic tomography at Popocatépetl volcano, Mexico. J. Volcanol. Geotherm. Res. 200 (3), 234–244. doi:10.1016/j.jvolgeores.2010.12.016
Campion, R., Delgado-Granados, H., Legrand, D., Taquet, N., Boulesteix, T., Pedraza-Espitía, S., et al. (2018). Breathing and coughing: the extraordinarily high degassing of Popocatépetl volcano investigated with an SO2 camera. Front. Earth Sci. 6, 163. doi:10.3389/feart.2018.00163
Coulibaly, P., and Burn, D. H. (2004). Wavelet analysis of variability in annual Canadian streamflows. Water Resour. Res. 40 (3). doi:10.1029/2003WR002667
Currenti, G., Del Negro, C., Lapenna, V., and Telesca, L. (2005). Multifractality in local geomagnetic field at Etna volcano, Sicily (southern Italy). Nat. Hazards Earth Syst. Sci. 5, 555–559. doi:10.5194/nhess-5-555-2005
Del Negro, C., and Currenti, G. (2003). Volcanomagnetic signals associated with the 2001 flank eruption of Mt. Etna (Italy). Geophys. Res. Lett. 30 (7), 1357. doi:10.1029/2002GL015481
Del Negro, C., Currenti, G., Napoli, R., and Vicari, A. (2004). Volcanomagnetic changes accompanying the onset of the 2002–2003 eruption of Mt. Etna (Italy). Earth. Planet. Sci. Lett. 229, 1–14. doi:10.1016/j.epsl.2004.10.033
Del Negro, C., and Ferrucci, F. (2000). Volcanomagnetic effects at vulcano island (aeolian archipelago, Italy). Geophys. J. Int. 140 (1), 83–94. doi:10.1046/j.1365-246x.2000.00987.x
Fedi, M., La Manna, M., and Palmieri, F. (2003). Nonstationary analysis of geomagnetic time sequences from Mount Etna and north palm springs earthquake. J. Geophys. Res. 108 (2493). doi:10.1029/2001JB000820
Grinsted, A., Moore, J. C., and Jevrejeva, S. (2004). Application of the cross wavelet transform and wavelet coherence to geophysical time series. Nonlin. Process. Geophys. 11, 561–566. doi:10.5194/npg-11-561-2004
Jänicke, H., Bottinger, M., Mikolajewicz, U., and Scheuermann, G. (2009). Visual exploration of climate variability changes using wavelet analysis. IEEE Trans. Vis. Comput. Graph. 15 (6), 1375–1382. doi:10.1109/tvcg.2009.197
Johnston, M. J. S., Mueller, R. J., and Dvorak, J. (1981). Volcanomagnetic observations during eruptions, may–august 1980, in the 1980 eruptions of Mount St. Helens, Washington. U.S. Geol. Surv. profess. Pap. 1250, 183–189.
Kanda, W., Utsugi, M., Tanaka, Y., Hashimoto, T., Fujii, I., Hasenaka, T., et al. (2010). A heating process of Kuchi-erabu-jima volcano, Japan, as inferred from geomagnetic field variations and electrical structure. J. Volcanol. Geotherm. Res. 189 (1-2), 158–171. doi:10.1016/j.jvolgeores.2009.11.002
Lapins, S., Roman, D. C., Rougier, J., De Angelis, S., Cashman, K. V., and Kendall, J. M. (2020). An examination of the continuous wavelet transform for volcano-seismic spectral analysis. J. Volcanol. Geotherm. Res. 389, 106728. doi:10.1016/j.jvolgeores.2019.106728
Martin-Del-Pozzo, A. L. (2012). Precursors to eruptions of Popocatépetl volcano, Mexico. Geofís. Int. 51 (1), 87–107. doi:10.22201/igeof.00167169p.2012.51.1.148
Martin-Del-Pozzo, A. L., Cifuentes-Nava, G., Cabral-Cano, E., Bonifaz, R., Correa, F., and Mendiola, I. F. (2003). Timing magma ascent at Popocatepetl volcano, Mexico, 2000-2001. J. Volcanol. Geotherm. Res. 125 (1-2), 107–120. doi:10.1016/S0377-0273(03)00091-X
Martin-Del-Pozzo, A. L., Cifuentes-Nava, G., Cabral-Cano, E., Sánchez-Rubio, G., Reyes, M., Martínez-Bringas, A., et al. (2002). Volcanomagnetic signals during the recent Popocatepetl (Mexico) eruptions and their relation to eruptive activity. J. Volcanol. Geotherm. Res. 113 (3-4), 415–428. doi:10.1016/S0377-0273(01)00275-X
Martin-Del-Pozzo, A. L., Cifuentes-Nava, G., González, E., Martínez, A., and Mendiola, F. (2008b). Magnetic signatures associated with magma ascent and stagnation at Popocatepetl volcano, Mexico: implications for eruption triggering mechanisms during 2006. Geol. Soc. Lond. 304 (1), 117–131. doi:10.1144/SP304.6
Martin-Del-Pozzo, A. L., González-Morán, T., Espinasa-Pereña, R., Butron, M. A., and Reyes, M. (2008a). Characterization of the recent ash emissions at Popocatepetl Volcano, Mexico. J. Volcanol. Geotherm. Res. 170 (1-2), 61–75. doi:10.1016/j.jvolgeores.2007.09.004
Massaro, S., Costa, A., Sulpizio, R., Coppola, D., and Capra, L. (2019). Cyclic activity of the Fuego de Colima volcano (Mexico): insights from satellite thermal data and nonlinear models. Solid Earth 10, 1429–1450. doi:10.5194/se-10-1429-2019
Miwa, T., Geshi, N., and Shinohara, H. (2013). Temporal variation in volcanic ash texture during a vulcanian eruption at the Sakurajima volcano, Japan. J. Volcanol. Geotherm. Res. 260, 80–89. doi:10.1016/j.jvolgeores.2013.05.010
Nadeau, P. A., Palma, J. L., and Waite, G. P. (2011). Linking volcanic tremor, degassing, and eruption dynamics via SO2 imaging. Geophys Res. Lett. 38, L01304. doi:10.1029/2010GL045820
Nakada, S., Zaennudin, A., Yoshimoto, M., Maeno, F., Suzuki, Y., Hokanishi, N., et al. (2019). Growth process of the lava dome/flow complex at Sinabung Volcano during 2013–2016. J. Volcanol. Geotherm. Res. 382, 120–136. doi:10.1016/j.jvolgeores.2017.06.012
Napoli, R., Currenti, G., Del Negro, C., Greco, F., and Scandura, D. (2008). Volcanomagnetic evidence of the magmatic intrusion on 13th May 2008 Etna eruption. Geophys. Res. Lett. 35 (2-5), L22301. doi:10.1029/2008GL035350
O’Brien, G. S., and Bean, C. J. (2008). Seismicity on volcanoes generated by gas slug ascent. Geopphys. Res. Lett. 35, L16308. doi:10.1029/2008GL035001
Preece, K., Gertisser, R., Barclay, J., Charbonnier, S. J., Komorowski, J. C., and Herd, R. A. (2016). Transitions between explosive and effusive phases during the cataclysmic 2010 eruption of Merapi volcano, Java, Indonesia. Bull. Volcanol. 78 (54), 54–16. doi:10.1007/s00445-016-1046-z
Quezada-Reyes, A., Lesage, P., Valdés-González, C., and Perrier, L. (2013). An analysis of the seismic activity of Popocatépetl Volcano, Mexico, associated with the eruptive period of December 2002 to February 2003: looking for precursors. Geol. Soc. Lond. 498, 89–106. doi:10.1130/2013.2498(06
Rikitake, T. (1966). Elimination of Non-local changes from total intensity values of the geomagnetic field. Bull. Earthq. Res. Inst. 44, 1041–1070.
Roberge, J., Delgado-Granados, H., and Wallace, P. J. (2009). Mafic magma recharge supplies high CO2 and SO2 gas fluxes from Popocatépetl volcano, Mexico. Geology 37 (2), 107–110. doi:10.1130/G25242A.1
Sasai, Y., Shimomura, T., Hamano, Y., Utada, H., Yoshino, T., Koyama, S., et al. (1990). Volcanomagnetic effect observed during the 1986 eruption of Izu-Oshima volcano. J. Geomag. Geoelectr. 42 (3), 291–317. doi:10.5636/jgg.42.291
Sasai, Y., Uyeshima, M., Zlotnicki, J., Utada, H., Kagiyama, T., Hashimoto, T., et al. (2002). Magnetic and electric field observations during the 2000 activity of Miyake-jima volcano, Central Japan. Earth. Planet. Sci. Lett. 203 (2), 769–777. doi:10.1016/S0012-821X(02)00857-9
Scandone, R., Cashman, K. V., and Malone, S. D. (2007). Magma supply, magma ascent and the style of volcanic eruptions. Earth. Planet. Sci. Lett. 253, 513–529. doi:10.1016/j.epsl.2006.11.016
Soon, W., Velasco Herrera, V., Selvaraj, K., Traversi, R., Usoskin, I., Chen-Tung, A., et al. (2014). A review of Holocene solar-linked climatic variation on centennial to millennial timescales: physical processes, interpretative frameworks and a new multiple cross-wavelet transform algorithm. Earth Sci. Rev. 134, 1–15. doi:10.1016/j.earscirev.2014.03.003
Straub, S., and Martín-Del Pozzo, A. L. (2001). The significance of phenocryst diversity in tephra from recent eruptions at Popocatépetl volcano (central Mexico). Contrib. Mineral. Petrol. 140 (4), 487–510. doi:10.1007/PL00007675
Takeuchi, S. (2015). A melt viscosity scale for preeruptive magmas. Bull. Vulcanol. 77, 41. doi:10.1007/s00445-015-0929-8
Tamburello, G., Aiuppa, A., McGonigle, A. J. S., Allard, P., Cannata, A., Giudice, G., et al. (2013). Periodic volcanic degassing behavior: the Mount Etna example. Geophys. Res. Lett. 40 (18), 4818–4822. doi:10.1002/grl.50924
Tamburello, G., McGonigle, A. J., Kantzas, E. P., and Aiuppa, A. (2011). Recent advances in ground-based ultraviolet remote sensing of volcanic SO2 fluxes. Ann. Geophys. 54 (2). doi:10.4401/ag-5179
Tanaka, Y. (1995). Volcanomagnetic effects on the Unzen volcano (1990-1992). J. Geomag. Geoelectr. 47 (3), 325–336. doi:10.5636/jgg.47.325
Torrence, C., and Compo, G. P. (1998). A practical guide to wavelet analysis. Bull. Am. Meteorol. Soc. 79 (1), 61–78. doi:10.1175/1520-0477(1998)079<0061:APGTWA>2.0.CO;2
Valade, S., Coppola, D., Campion, R., Ley, A., Boulesteix, T., Taquet, N., et al. (2023). Lava dome cycles reveal rise and fall of magma column at Popocatépetl volcano. Nat. Commun. 14 (3254), 3254. doi:10.1038/s41467-023-38386-9
Valade, S., Ley, A., Massimetti, F., D’Hondt, O., Laiolo, M., Coppola, D., et al. (2019). Towards global volcano monitoring using multisensor sentinel missions and artificial intelligence: the MOUNTS monitoring system. Remote Sens. 11, 1528. doi:10.3390/rs11131528
Varley, N. R., Arámbula-Mendoza, R., Reyes-Dávila, G., Stevenson, J., and Harwood, R. (2010). Long-period seismicity during magma movement at Volcán de Colima. Bull. Volcanol. 72, 1093–1107. doi:10.1007/s00445-010-0390-7
Wadsworth, F. B., Llewellin, E. W., Vasseur, J., Gardner, J. E., and Tuffen, H. (2020). Explosive-effusive volcanic eruption transitions caused by sintering. Sci. Adv. 6, eaba7940. doi:10.1126/sciadv.aba7940
Yukutake, T., Utada, H., Yoshino, T., Watanabe, H., Hamano, Y., Sasai, Y., et al. (1990). Changes in the geomagnetic total intensity observed before the eruption of Oshima Volcano in 1986. J. Geomag. Geoelectr. 42 (3), 277–290. doi:10.5636/jgg.42.277
Zlotnicki, J., and Bof, M. (1998). Volcanomagnetic signals associated with the quasi-continuous activity of the andesitic Merapi volcano, Indonesia: 1990–1995. Phys. Earth Planet. Int. 105, 119–130. doi:10.1016/S0031-9201(97)00085-X
Zlotnicki, J., Bof, M., Perdereau, L., Yvetot, P., Tjetjep, W., Sukhyar, R., et al. (2000). Magnetic monitoring at Merapi volcano, Indonesia. J. Volcanol. Geotherm. Res. 100 (1-4), 321–336. doi:10.1016/S0377-0273(00)00142-6
Zlotnicki, J., Le Mouël, J. L., Delmond, J. C., Pambrun, C., and Delorme, H. (1993). Magnetic variations on Piton de la Fournaise volcano. Volcanomagnetic signals associated with the November 6 and 30, 1987, eruptions. J. Volcanol. Geotherm. Res. 56, 281–296. doi:10.1016/0377-0273(93)90021-I
Zobin, V. M., Bretón, M., León, Z., and Tellez, A. (2021). Transition from passive degassing to slow growth of a new lava dome as derived from seismic signatures: Volcán de Colima, México, January–February 2016. Volcanol. Geotherm. Res. 420, 107419. doi:10.1016/j.jvolgeores.2021.107419
Zobin, V. M., Bretón, M., Ramírez, J. J., and Santiago, H. (2020). Transition from passive to pre-extrusion degassing of ascending andesitic magma before the lava dome-building eruption as derived from the seismic signals and tilt changes: Volcán de Colima, México, August–September 2004. J. Volcanol. Geotherm. Res. 401, 106971. doi:10.1016/j.jvolgeores.2020.106971
Keywords: domes, sudden explosions, magnetic precursors, wavelet analyses, Popocatépetl
Citation: Martin-Del-Pozzo AL and Santos Morales CA (2024) Transition of dome formation to sudden explosive eruptions at Popocatépetl, Mexico: magnetic indicators. Front. Earth Sci. 12:1204859. doi: 10.3389/feart.2024.1204859
Received: 12 April 2023; Accepted: 03 June 2024;
Published: 20 June 2024.
Edited by:
Heather Michelle Wright, Ludwig-Maximilians-University, GermanyReviewed by:
Mark Thomas, University of Leeds, United KingdomStuart Kenderes, Indiana University, Purdue University Indianapolis, United States
Copyright © 2024 Martin-Del-Pozzo and Santos Morales. This is an open-access article distributed under the terms of the Creative Commons Attribution License (CC BY). The use, distribution or reproduction in other forums is permitted, provided the original author(s) and the copyright owner(s) are credited and that the original publication in this journal is cited, in accordance with accepted academic practice. No use, distribution or reproduction is permitted which does not comply with these terms.
*Correspondence: Ana Lillian Martin-Del-Pozzo, YW5hbGlsQGlnZW9maXNpY2EudW5hbS5teA==