 Brandon M. Boucher1
 Samuel J. Robb
 Jacob J. Hanley
 James E. Mungall
94% of researchers rate our articles as excellent or good
Learn more about the work of our research integrity team to safeguard the quality of each article we publish.
Find out more
ORIGINAL RESEARCH article
Front. Earth Sci., 29 August 2023
Sec. Economic Geology
Volume 11 - 2023 | https://doi.org/10.3389/feart.2023.819129
This article is part of the Research TopicOre Formation and Critical Metal Deposits: Geological Contribution to the Clean Energy TransitionView all 6 articles
The second part of this article can be found here: 10.3389/feart.2023.819109 (DOI). At the late Triassic New Afton alkalic porphyry Cu-Au deposit (British Columbia, Canada), pyrite is a widely distributed minor sulfide phase within hypogene ore where it predates Cu mineralization and hosts significant concentrations of Pd and Pt. Here we characterize pyrite major, minor and trace element composition by EPMA and LA-ICP-MS, and S isotopes (bulk pyrite and in situ SIMS in individual growth zones) to elucidate compositional variations at different stages of pyrite growth with respect to PGE deposition. At least two cycles of zoned Co-Ni-Pd-Pt-Se-As co-enrichment are recorded over two stages of pyrite growth at the New Afton deposit. Concentrations of Co (up to ∼5.5 wt%; highest observed in any reported ore-forming system) and Ni (up to 1 wt%) overlap with pyrite from mafic-ultramafic platinum-group element (PGE) deposits, iron oxide±apatite and iron oxide-copper-gold deposits (IOA-IOCG), and mantle peridotite-associated base metal exhalative deposits. In early hypogene (type I) pyrite, high Pt (up to ∼24 ppm) occurs in crystal cores that have high Co/Ni ratio (>∼7), high Co (>∼ 1 wt%) and are poor in Ni, Se, and As. With progressive growth, early hypogene pyrite rims and late hypogene (type II) cores record an initial Ni-Pd-As-Se (±Co) co-enrichment stage, followed by oscillations in composition (from “barren” to variably Co-Ni-Pd-Pt-As-Se-enriched). Pd in pyrite (up to ∼70 ppm) is inversely correlated to Co/Ni ratio, being enriched when Co/Ni < ∼7 and Ni > ∼1000 ppm. The highest levels of Pd enrichment occur in the most Ni- and Se-enriched growth zones. The transition from early, high Co/Ni (Pt-enriched) to later, low Co/Ni (Pd-enriched) growth zones is accompanied by a decrease in pyrite δ34SVCDT of up to ∼7‰ (4‰ range in single grains) with a total range in composition measured between −5.5‰ and +1.4‰. Subsequent to the shift to lower values, overgrowths of high Co/Ni pyrite formed with values of δ34SVCDT similar to the earliest Co-Pt-rich growth zones. Some combination of fluctuations in temperature and oxygen fugacity related to episodic cooling and hydrothermal recharge involving new pulses of metal-rich magmatic fluids is required to explain the observed metal enrichment patterns and variations in S isotope values. Co-Ni-rich pyrite may be a valuable exploration vector to PGE enrichment in porphyry deposits.
Porphyry Cu-Au deposits associated with both alkalic (cf. MacDonald and Katsura, 1964) and calc-alkalic magmatism are variably enriched in platinum-group elements (PGE) and may constitute important unconventional sources of palladium (Pd). In a few examples, the PGE have been a valuable byproduct of Cu-Au production (Peterson, 1993; Economou-Eliopoulos, 2005; Pašava et al., 2010; Eliopoulos et al., 2014). Numerous studies have described the geochemistry and mineralogy of the PGE in porphyry deposits in the North American Cordillera (McMillan, 1991; Barrie, 1993; Peterson, 1993; Schroeter, 1995; Economou-Eliopoulos and Eliopoulos, 1999; Nixon and LaFlamme, 2002; Thompson et al., 2002; Nixon, 2004; LeFort, 2009; MacKenzie, 2009; Pass et al., 2009; 2014; Pass, 2010; LeFort et al., 2011; Bath et al., 2014; Logan and Mihalynuk, 2014; Micko et al., 2014; Hanley et al., 2021) and the European Alpine orogenic belt (Herrington et al., 1998; Economou-Eliopoulos and Eliopoulos, 1999; Tarkian and Stribrny, 1999; Strashimirov et al., 2002; Kehayov et al., 2003; Tarkian et al., 2003; von Quadt et al., 2005; Augé et al., 2005; Economou-Eliopoulos, 2005; Eliopoulos et al., 2014; McFall et al., 2016; 2018); and the Ural-Mongolian metallogenic belt (e.g., Economou-Eliopoulos and Eliopoulos, 1999; Sotnikov et al., 2001; Economou-Eliopoulos, 2005; Berzina et al., 2007; Wang et al., 2014; Plotinskaya et al., 2018). A few deposits with PGE enrichments have also been noted in the Western Pacific margin (Tarkian and Koopmann, 1995; Economou-Eliopoulos and Eliopoulos, 1999; Economou-Eliopoulos, 2005; Eliopoulos et al., 2014); and the South American Cordillera (Crespo et al., 2018). Alkalic porphyry deposits, in particular, show the highest potential as targets for PGE exploration, but a predictive model is lacking and the global inventory for the distribution of PGE in these porphyry settings is not at all comprehensive. In part, this is due to sampling bias toward mineralized intervals containing visible Cu enrichments due to the assumption that the PGE will be spatially/temporally coeval with Cu and Au, and more generally, a lack of PGE assaying during routine porphyry resource evaluation.
In the Canadian Cordillera, PGE-anomalous porphyry systems are associated exclusively with Late Triassic (205–200 Ma) and less commonly, Early Jurassic (185–178 Ma) (Mortensen et al., 1995; Bath et al., 2014; Devine et al., 2014), silica-saturated (containing phenocryst and/or interstitial quartz) and silica-undersaturated alkalic plutons in the Quesnel (Afton-Ajax, Lorraine-Sappho, Friday Creek, Mt. Polley, Mt. Milligan, Crescent, Copper Mountain, Allendale, Maple Leaf deposits) and Stikine (Galore Creek deposit) terranes of the Intermontane Belt. The intrusions were emplaced during collisional tectonic events that ended active subduction (McInnes and Cameron, 1994), and were formed in an arc setting before final accretion onto the North America craton by 175 Ma (McMillan, 1991). Spatial, temporal, and metallogenic relationships among pluton subtypes indicate that they constitute a single suite of shoshonitic magmas with alkaline to sub-alkaline normative mineralogy, all classified as alkalic in the alkalic/tholeiitic discrimination diagram (MacDonald and Katsura, 1964; Lang et al., 1995).
Most past studies of PGE-enriched porphyry systems in the Canadian Cordillera examined correlations between the PGE and other major and trace elements using small whole-rock analysis data sets (Kwong, 1982; 1987; Mutschler et al., 1985; DeLong et al., 1991; Ghosh, 1993; Enns et al., 1995; Nixon and LaFlamme, 2002; Thompson et al., 2002; Nixon, 2004; Warren, 2010; LeFort et al., 2011). These studies noted that while correlations between Pt, Pd and S are strong, the PGE are poorly correlated to Cu and Au, especially at high metal concentrations. Correlations are not statistically significant when larger data sets are utilized. These results suggest that, although the metals may be broadly spatially coincident with one another locally owing to their precipitation in common structures (fractures, breccia stockworks), the timing and mechanism(s) of PGE relative to Cu-Au transport and deposition are distinct, and/or that multiple stages of metal enrichment have occurred that obscure a simple paragenetic relationship between the metals.
Earlier mineralogical studies (e.g., Nixon and Laflamme, 2002) showed that PGE enrichments are related to the presence of abundant platinum-group mineral (PGM) grains in spatial association with Cu-Fe-sulfides, and are dominated by PGE-Hg-Te phases. However, more recent work has shown that accessory pyrite is a significant host for the PGE, likely dissolved within the pyrite structure (Pass et al., 2009; Pass, 2010; Hanley et al., 2021) and correlated to enrichments of Co, Ni, As and other trace elements within pyrite growth zones. These studies were based on small data sets and did not examine the distribution of these metals within the pyrite (i.e., in paragenetic context). Here, and in a companion paper (Robb et al., 2023), we present comprehensive geochemical and mineralogical data that leads to a thermodynamic geochemical model for the distribution of the PGE in the New Afton deposit. In particular, the studies evaluate the role of pyrite in controlling the initial PGE distribution in the deposit, with significance to global ore deposit models for PGE deposits in such unconventional settings.
The New Afton deposit is one of numerous Cu-Au-PGE mineralized systems hosted in alkalic, silica-saturated to silica-undersaturated porphyritic rocks of the Iron Mask batholith near Kamloops, British Columbia, within the Quesnel terrane of the Intermontane Belt (Snyder and Russell, 1993; Snyder, 1994). The Intermontane Belt is one of the five northwest-trending morphogeological belts that together form the Canadian Cordillera (Figure 1). It comprises a series of amalgamated Paleozoic to Mesozoic terranes, including from east to west, the Quesnel island arc terrane (Quesnellia), the oceanic Cache Creek terrane, and the Stikine island arc terrane (Stikinia). Together, Quesnellia and Stikinia form a 2000 km-long metallogenic belt with prevalent calc-alkaline and alkaline-style porphyry mineralization. This belt contains many of the Cu occurrences in British Columbia and account for 75% of the province’s metallic mineral production (Logan and Mihalynuk, 2014), the majority being porphyry and epithermal deposits.
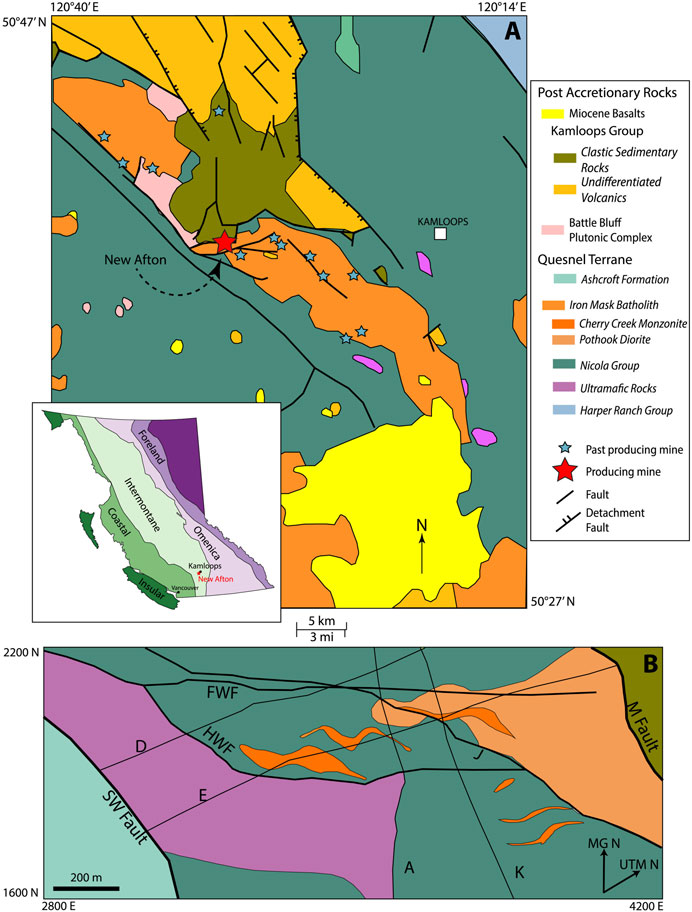
FIGURE 1. Geological setting of the New Afton deposit. (A). Inset shows the location of the deposit within the Intermontane belt, British Columbia. Regional geology of the Iron Mask Batholith showing the locations of the New Afton and other deposits (compiled from maps produced by the British Columbia Geological Survey; Monger and McMillan, 1989). (B). Plan view of local geology at the deposit scale at ∼600 m below surface, based on DDH data. The coordinates of the deposit map are in Mine Grid, which is a 40° rotation of the UTM grid. Letters denote the fault names used by the New Gold geologists. Modified from Lipske and Wade (2014).
The Quesnel terrane, which hosts the New Afton deposit, is an ancient island arc formed off the western coast of ancestral North America in the upper Paleozoic until its eventual Mesozoic accretion on to the cratonic margin ca. 186 Ma (Figure 1; Logan and Mihalynuk, 2014). Its early history, prior to accretion, involved submarine to subaerial clastic and carbonate sedimentation with subsequent arc growth while combined with the Stikine arc at its northern terminus (Mihalynuk et al., 1994). The stratigraphy of southern Quesnellia in the Kamloops area is subdivided into three major sequences: the late Paleozoic Harper Ranch Group, the Late Triassic Nicola Group, and the Jurassic Rossland Group (Smith, 1979; Beatty et al., 2006). Construction of the arc complex began in the Late Devonian with the deposition of the Harper Ranch Group, a thick succession of steeply dipping, northwest-striking interbedded mudstones and siltstones, and volcaniclastic sandstone and conglomerate deposited during the opening of the marginal Slide Mountain Basin along western North America (Roback et al., 1994; Beatty et al., 2006). Late Mississippian carbonates interbedded with volcaniclastic and sedimentary layers overlie the early arc succession, marking a rapid shift from rifting and sedimentation to a period of volcanic quiescence and carbonate formation lasting until the Permian (Beatty, 2002; Beatty et al., 2006).
Pyroxene-phyric volcanic and volcaniclastic rocks of shoshonitic affinity of the Upper Triassic Nicola Group rest unconformably on top of the carbonate and sedimentary rocks of the Harper Ranch Group (Mortimer, 1987). Sporadic submarine volcanism in the Nicola arc began ca. ∼238 Ma with the eruption of felsic pyroclastics containing abundant early pyrite, lavas, and pillow basalts (Mihalynuk et al., 2016). Arc growth accelerated after the initial episodic magmatism, erupting shoshonitic augite-porphyritic picrite, basalt, and andesite and calc-alkaline augite ± plagioclase basalts and andesites (Mortimer, 1987; Mihalynuk et al., 2016). Collision between the Sitlika-Kutcho-Venables arc at 210 Ma and the paired Quesnel-Stikine arc caused an arc-parallel slab tear, eventually culminating in the generation and emplacement of voluminous magmas ca. 203 Ma and a parallel belt of alkalic and calc-alkalic porphyry deposits prior to the 201 Ma cessation of Nicola arc growth (Logan and Mihalynuk, 2014; Mihalynuk et al., 2016). Eventual counterclockwise rotation of the combined Quesnel-Stikine arc due to subduction of the Cache Creek ocean along their eastern margin resulted in the collision of Stikine and Quesnel and the enclosure of the Cache Creek terrane (Mihalynuk et al., 1994). Post-accretionary magmatism in the Kamloops area was dominated by calc-alkaline volcanic rocks of the Eocene Kamloops Group (Ewing, 1981). These high-K basalts, andesites, and rhyolites rest unconformably on top of Quesnel stratigraphic units north of New Afton but extend as far south as Idaho because of the subduction of the Kura-Farallon spreading center (Breitsprecher et al., 2003).
The Iron Mask batholith (204.5 ± 0.6 Ma; Mortensen et al., 1995) is a subvolcanic, multiphase intrusion hosted in, and broadly coeval with, submarine volcanic and sedimentary rocks of the eastern part of the Late Triassic Nicola Group (“picritic”, basaltic, and andesitic flows, monomictic and polymictic tuffs and breccias, mudstones, argillites, and limestones; Carr and Reed, 1976; Mortimer, 1987; Stanley et al., 1994; Snyder, 1994; Logan and Mihalynuk, 2005; 2014; Mihalynuk et al., 2016). The batholith is composed of two large, northwest-trending plutons: the larger Iron Mask pluton (18 km long) and the smaller Cherry Creek pluton. Early to Middle Eocene Kamloops Group sedimentary and volcanic rocks (tuffaceous sandstons, siltstones, shales, minor conglomerates, basalt/andesitic flows and minor dacitic, latitic, and trachytic flows; Ewing, 1981; Ross, 1993) unconformably overlie the Nicola Group rocks. The Iron Mask pluton comprises four major units (in order of relative emplacement): Pothook diorite, Iron Mask “Hybrid”, Cherry Creek monzonite, and Sugarloaf diorite. The Cherry Creek pluton comprises only the Cherry Creek unit. Magnetite-apatite-(actinolite) dikes crosscut the Pothook and Cherry Creek phases in southeasterly and easterly trends (Logan et al., 2007).
Geological characteristics of the New Afton deposit are described in numerous works (e.g., Kwong, 1987; Nixon, 2004; Logan and Mihalynuk, 2005; MacKenzie, 2009; Lipske and Wade, 2014; Lipske et al., 2018; Lecuyer et al., 2020; Lipske et al., 2021) and form the basis for the descriptions below. The Cherry Creek unit is the key host lithology for the New Afton deposit. Its emplacement was controlled by northeast trending faults (Figure 1). It comprises non-porphyritic to porphyritic, hornblende to pyroxene-phyric syenite, monzonite, and diorite, latite porphyry, and intrusion breccia (cf. Carr and Reed, 1976) with dioritic rocks as the prevalent rock type of this unit where it hosts the deposit. The primary ore zone (formerly the Main Zone, now designated by A, B, and C zones) is fault-controlled and strikes northeast with a southeast dip. The ore zone is tabular, parallel to the fault, has a southwest plunge (∼50°), is approximately 220 m wide across strike at its widest point, and has a total vertical extent of at least 1,400 m below the bottom of the historic Afton open pit (Nixon, 2004; MacKenzie, 2009; Lecuyer et al., 2020). The Nicola Group rocks within the deposit include mineralized and altered (epidote-carbonate-chlorite) volcanic breccias rich in hornblendite, altered (epidotized) andesite, and sandstone.
Primary hypogene mineralization generally consists of chalcopyrite (±bornite) with subordinate chalcocite, covellite, magnetite, pyrite, and accessory sulfosalts (e.g., tennantite and enargite) occurring in veins and breccias (“crackle breccia”) crosscutting heavily chloritized rocks, occurring as patches within altered mafic phenocrysts and as disseminations throughout the intrusive rocks. Gold is associated with chalcopyrite and pyrite, occurring as inclusions of Au-Ag alloy. Supergene mineralization, dominating to a depth of 250–400 m below surface, consists of chalcocite, native copper and hematite, and remnant bornite and chalcopyrite, with minor copper oxides (cuprite, tenorite), carbonates and arsenates (malachite, azurite, and conichalcite), gypsum, and late calcite within 1 m of surface. Whereas Cu mineralization is broadly distributed, the highest Au grades occur in the easternmost extension of the Main Zone with minimal Cu mineralization. The distributions of PGE and Au are described by Robb et al. (2023, companion paper). A broad-scale crude zoning is recognized, with variations in the abundance of magnetite, pyrite, and Cu-Fe-sulfide minerals and a magnetite-enriched zone encompassing the ore bodies, flanked by “barren” pyrite zones. Compared to other porphyry copper deposits, Afton does not exhibit well-defined hydrothermal alteration patterns. Generally, alteration within the hypogene ore zones consists of 1) inner, discontinuous zones of early calcic (magnetite-apatite-amphibole-K-feldspar veins) and sodic-potassic alteration (early hydrothermal albite, later K-feldspar-magnetite-biotite-quartz); 2) outer, later phyllic (quartz-sericite) alteration comprised of muscovite-carbonate-pyrite-quartz with a distribution controlled by high angle faults; 3) late argillic alteration, also fault controlled; and 4) widespread propylitic alteration (epidote, chlorite, and magnetite with rare quartz and calcite).
Within the boundary of this crude zonation, ore appears to be most consistently associated with potassic alteration. Potassic/propylitic alteration appears to be confined to syenitic and dioritic rocks. Alteration in the supergene zone is not well defined, consisting of predominantly pervasive hematitization and lacking strong phyllic and argillic alteration typical of other deposits. Intense carbonate alteration, consisting of ankerite and dolomite, is associated mainly with the region where ultrapotassic basaltic flows (“picrite”) are in fault contact with the Cherry Creek unit; this area also shows intense mineralization and may be linked to neutralization of mineralizing fluids by their interaction with the picritic rocks (Kwong, 1987; Nixon and LaFlamme, 2002; Nixon, 2004). Calcite-rich alteration is pervasive, occurring as late fracture-fillings and veinlets that appear to postdate the supergene event.
Mining at New Afton commenced in 1977. The historic Afton Open Pit, Pothook, and Crescent zones were depleted over a 12-year period. Underground mining commenced at New Afton in 2012. At the end of 2019, New Gold Inc. (Lecuyer et al., 2020) reported total reserves and resources (excluding inferred; all zones; cut-off 0.4% Cu equiv.) of 95.6 Mt at 0.69 g/t Au, 2.1 g/t Ag, 0.82% Cu, and 0.1 g/t Pd.
Diamond drill core samples were selected from archived cores, drilled by New Gold Incorporated between 2001 and 2017. Using the New Gold Inc. assay database as a guide, samples (5–30 cm length) of representative mineralization styles were selected. Samples were selected from core intervals that yielded Pd assays >0.4 ppm over 2 m in holes that show either positive correlation of Pd and Au ± Cu or no correlation between these metals. In total 226 samples were collected from 23 drill holes that covered the vertical expanse of the deposit (Figure 2).
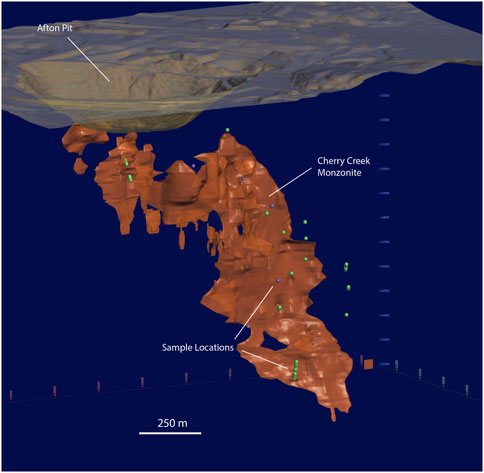
FIGURE 2. 3-D section showing locations of DDH samples (at depth) used in this study and in the companion paper Robb et al. (2023). Samples identified by green points were utilized in this study for EPMA (sulfide mineral compositions) and LA-ICP-MS (spot analyses of sulfide trace element composition); samples identified by purple points were utilized in this study for LA-ICP-MS (mapping of sulfide trace element composition) and SIMS (S isotopes). The Cherry Creek monzonite is shown in orange. The historic Afton open pit intersects the shallowest part of the porphyry.
All petrography and analyses by methods other than SIMS were done on polished thick sections (26 × 46 mm; ∼150–200 um thick). A combination of optical petrography and scanning electron microscope (SEM) imaging were used to characterize the textural features of different types of pyrite and paragenetic relationships between pyrite and other minerals. This also served as a basis to select specific pyrite grains for LA-ICP-MS and secondary ion mass spectrometry analyses. Samples were characterized petrographically using transmitted and reflected light on a Nikon Eclipse H550L microscope. Polished thin sections from representative ore samples were scanned using a TESCAN MIRA 3 LMU VPS field emission SEM at Saint Mary’s University, equipped with a back-scattered electron (BSE) detector and a solid-state, 80 mm2 X-max Oxford Instruments energy-dispersive spectrometer (EDS) detector. A beam voltage of 20 kV and an approximate working distance of 17 mm was used for all imaging. The software package INCA (ETAS Embedded Systems Canada Inc.) was used for X-ray spectral analysis.
To obtain an estimate of Fe concentration for use as an internal standard value for LA-ICP-MS data quantification, and information on minor element concentrations, EPMA analyses of sulphides (chalcopyrite, pyrite) were obtained using JEOL JXA-8200 and 8230 Superprobes, each equipped with five wavelength-dispersive spectrometers, at Dalhousie University and the University of Ottawa, respectively. For the 8200 instrument, operating parameters were 20 kV accelerating voltage with a 20 nA beam current and a beam diameter (spot size) of 1 µm. Elements and corresponding X-ray lines measured were Fe Kα, S Kα, Co Kα, Cu Kα, and Ni K. Counting times for all elements were 20 s on-peak and 10 s on both lower and upper backgrounds. All X-ray count intensity data were acquired using the Probe for EPMA Software(™) package by John Donovan and reduced using the standard ZAF matrix correction method in the software package. Peak position calibration and quantification utilized in-house pentlandite (Fe, Ni, S), cobaltite (Co), and chalcopyrite (Cu). For the 8230 instrument, chalcopyrite and pyrite were analyzed using a 20 kV accelerating voltage and a 40 nA beam current. A beam diameter of 5 μm was used, and 20 s count time (on-peak) for each element, and 10 s on both backgrounds. Elements and corresponding X-ray lines measured were S Kα, Sb Lα, Fe Kα, Cu Kα, As, Lα, Zn Lα, Ag Lα, Hg Mα, and Ni Kα. In-house standards were used for peak positioning and data reduction and were cubanite (S, Fe, Cu), stibnite (Sb), GaAs (As), sphalerite (Zn), Au40Ag60 alloy (Ag), cinnabar (Hg), and pentlandite (Ni). The same software package was used as for the analyses done using the 8200 instrument. Results are reported in Supplementary Table S1. For analyses from the Dalhousie University EPMA lab, data are reported for Fe, S, Ni, Co and Cu. It is noted that measured values of S in this data set are slightly too high (by as much as ∼1 wt%; mean = 0.8 wt%). This results from using pentlandite and cobaltite standards for peak positioning and quantification, required to accurately quantify Co, Ni and Fe in variably Co-Ni-rich pyrite. For analyses from the University of Ottawa EPMA lab, data are reported only for Fe, S, Ni and Cu. Cobalt was not measured for that data set, and other minor/trace elements were routinely below detection limits and not reported in Supplementary Table S1. It is noted that for these EPMA data, the reported Cu values are slightly too high in some analyses (up to ∼0.5 wt% above ideal composition). The reasons for this are unknown.
False colour element distribution maps of cut drill core surfaces were produced using a Bruker M4 Tornadoplus Super Light Element Micro-X-ray Fluorescence (μ-XRF) Spectrometer at Saint Mary’s University (Mineral Imaging and Analysis Laboratory). A Rh-source X-ray beam operated at an accelerating voltage of 50 kV and current of 600 nA, focused to a 20 μm spot size with analyses collected every 100 μm at a scan speed of 1.3 mm/s (counting time of 80 ms/pixel) under vacuum (2 mbar). Fluorescence radiation was collected using two 60 mm2 silicon drift detectors with a maximum throughput of 275,000 cps. Characteristic X-rays were identified in the resulting spectra, and peak overlaps were deconvoluted, using the Bruker M4 Tornado software to produce element maps showing the relative distribution of elements across the samples.
Pyrite trace element distribution maps were created at the LA-ICP-MS facility at the University of New Brunswick, by using a Resonetics M-50 193 nm Excimer laser system connected to an Agilent 7700x quadrupole ICP-MS equipped with dual external rotary pumps (McFarlane and Luo, 2012).
Samples and standards were loaded together into a two-volume, low-volume Laurin Technic Pty sample cell that was repeatedly evacuated and backfilled with ultra-pure He to remove traces of air from the cell after each sample exchange. Pyrite trace element mapping used a 17 μm beam diameter, a stage scan speed of 6 μm/s, and a 10 Hz repetition with the laser fluence regulated at ∼3 J/cm2. A He carrier (flow rate = 300 mL/min) transported the ablated material out of the ablation cell and was mixed downstream of the cell with 2 mL/min N2 (to enhance sensitivity) and 930 mL/min Ar (from the ICP-MS) prior to reaching the ICP-MS torch. Oxide production rates were maintained below 0.3%. Dwell times for all isotopes measured was 10 ms. Measured isotopes were 32S, 55Mn, 57Fe, 59Co, 60Ni, 65Cu, 66Zn, 72Ge, 75As, 82Se, 95Mo, 105,106,108Pd, 107Ag, 111Cd, 115In, 118Sn, 121Sb, 125Te, 182W, 195Pt, 197Au, 202Hg, 208Pb, and 209Bi.
Reference materials MASS-1 (chalcophile elements in Fe-Cu-Zn-S pressed powder pellet; USGS) and Po724 (PGE+Au doped Fe-sulfide; Sylvester et al., 2005) were used to calibrate analyte sensitivities, and the reference material SRM610 (NIST glass) was used to correct for instrument drift. Other reference materials (e.g., UQAC-FeS-1, a PGE-Au-doped Fe-sulfide, Savard et al. (2018); SRM610 from NIST) were used as QA/QC standards to monitor the calibrations. At the end of ablation sequences, laser log files and ICP-MS intensity data files were synchronized using Iolite™ (Paton et al., 2011) running as a plug-in for Wave Metrics Igor Pro 6.22™. Individual ablation signals were inspected offline and adjusted when necessary to avoid artifacts related to ablating through thin grains or from the beam ablating another mineral (e.g., silicates). Spikes in the data were automatically filtered using the default 2σ outlier rejection in the Iolite internally-standardized trace element data reduction scheme. For trace element maps, non-pyrite zones were removed using the Fe count rate intensity maps as a guide. Concentration scales for each map portray internally standardized absolute concentration levels in ppm. The average Fe content of pyrite from EPMA analyses (44.2 wt%) was used for map quantification. For Co- and Ni-poor pyrite (near-ideal pyrite) and very Co- and/or Ni-rich pyrite use of this average Fe value underestimates or overestimates true Fe content on a spot-by-spot basis in the maps by up to 2.3 wt% Fe and 3.3 wt% Fe, respectively. This introduces up to a ∼7.5% (relative) uncertainty in reported trace element concentrations from LA-ICP-MS data quantification. The impact of these uncertainties on the data reported here are discussed in the results below, and the statistical consequences of these uncertainties in the internal standard are explored in the electronic Supplement to the companion paper (Robb et al., 2023).
Trace element concentrations from single grain (spot) analyses of sulfide minerals (chalcopyrite and pyrite; the two most abundant sulfides) were determined by LA-ICP-MS at Dalhousie University. The sulfides were ablated using an ESI NWR213 Nd:YAG laser (213 nm) operated at a fluence of ∼5 J/cm2 and a repetition rate of 10 Hz. Helium (1L/min flow rate) was used as the carrier gas, and isotopes measured with a ThermoScientific iCAP quadrupole ICP-MS. Most chalcophile elements were quantified using reference material MSS5 (Brenan, 2015) to calibrate analyte sensitivities, and SRM610 as a calibration monitor. As with the data quantified from the mapped pyrite grains, Fe (from EPMA analyses) was used as the internal standard for both chalcopyrite and pyrite in the data reduction. For pyrite, an average value of Fe = 45.8 wt% was applied. For chalcopyrite, an average value of Fe = 30.8 wt% was used.
To minimize the influence of non-pyrite analyses from graphical and statistical exploration of the data, quantified map (extracted data points) and spot pyrite analyses were filtered to remove analyses that had Fe/S (wt%) > 0.87 (higher than ideal pyrite) and <0.76 (the lowest value observed in EPMA analyses, corresponding to the highest combined Co+Ni contents, substituting for Fe). Non-chalcopyrite analyses were also removed using a similar approach.
Interferences on the various isotopes of Pd measured were assessed and corrected where appropriate (e.g., 65Cu40Ar on 105Pd, 66Zn40Ar on 106Pd, 106Cd and 108Cd on 106Pd and 108Pd, respectively). Argide production rates were quantified using pure metals, and calculated to be <0.05%.
For spot analyses, concentrations of Pd in chalcopyrite are reported in Supplementary Table S2 based on measurements of 106Pd, corrected for the isobaric contribution of 106Cd to 106Pd. Data are not reported based on measurements of 105Pd owing to the large interference by 65Cu40Ar. Preliminary analyses of chalcopyrite showed that Zn concentrations were below 2 ppm; at these concentrations, and considering 66Zn40Ar product rates, the argide interference is negligible.
For both spot analyses and data extracted from the LA-ICP-MS maps, interpreted concentrations of Pd in pyrite are also based on measurements of 106Pd. Preliminary mapping showed that anomalously high concentrations of trace elements (Cu, Pd, Zn, Cd, Pb, Ag, Bi, Sb, Te) in pyrite occur where chalcopyrite-rich fractures infillings were intersected during ablation, reflecting the co-occurrence of chalcopyrite, accessory minerals and PGM. These were unavoidable, even in spot analyses. Following this rationale, in the final data sets (Supplementary Tables S2, S3) quantified pyrite analyses with more than 1000 ppm Cu were removed. Selecting the 1000-ppm level for this data filtering step was somewhat arbitrary, but aimed at minimizing these non-pyrite related contributions to scatter plots and subsequent interpretation of the data while preserving as much of the data obtained as possible. In particular, a detailed examination of all data from spot analyses and maps showed that above ∼1000 ppm Cu, sporadic, high concentrations of Cd and Zn were associated with chalcopyrite-filled fractures intersected by the laser beam, leading to unacceptable polybaric and argide interferences with Pd isotopes. At the 1000 ppm Cu level (bulk “pyrite”), it was determined (through comparison of Pd quantified using 105Pd, 106Pd, and 108Pd) that Cu65Ar40, Zn66Ar40, Cd106 and Cd108 production may account for ∼10% of 105Pd, ∼3% of 106Pd, ∼1% of 106Pd, and ∼1% of 108Pd count rates, respectively.
Following filtering, corrections for these interferences were also done. The corrected Pd concentrations reported in Supplementary Table S3 show good consistency between all data based on all three isotopes. It is important to note that while the filtering and interference corrections served to reduce the contribution of contaminating chalcopyrite-filled fractures to the final data sets, none of these contaminating elements are present in significant concentrations in the pyrite itself. In other words, filtering and interference corrections do not impact any of the arguments presented below concerning primary zonations in pyrite.
Analyses of bulk S isotopes (pyrite, chalcopyrite, bornite) were conducted at the Queen’s University Facility for Isotope Research (QFIR). Sulfide aliquots were drilled out of cut core samples using disposable diamond micro drill-bits viewed with a binocular microscope to provide control on the area being sampled. Sample aliquots were then sent to QFIR where they were weighed into tin capsules. The S isotope composition was measured using a Finnigan MAT 253 Stable Isotope Ratio Mass Spectrometer coupled to a CostechECS 4010 Elemental Analyzer. The reference materials used were NBS-127 as well as two in-house barite standards from QFIR (M6801, with a δ34S value of 13.6‰ and MRC, with a δ34S value of 2.0‰). The δ34S values are reported with respect to the Vienna Canyon Diablo Troilite (VCDT) international standard, using the delta (δ) notation in units of per mil (‰) and are reproducible to within 0.2‰.
Stable sulfur isotope ratios (34S/32S) for pyrite were collected in-situ using a CAMECA IMS 7f secondary ion mass spectrometer (SIMS) at the Department of Geology, University of Manitoba. For SIMS analyses, small areas (2–5 mm) of the polished thick sections were cut out using a hand-held microsaw and mounted in 2.5 cm-diameter round pucks using a Struers press and acrylic transoptic powder. Individual analysis locations were selected with the guidance of textural information from SEM-BSE imaging at Saint Mary’s University. A cesium (Cs+) primary beam with a ∼2 nA current was accelerated (+10 kV) onto the sample surface with a sputtering diameter of ∼20 μm to generate and detect secondary ions of 34S− and 32S−. The instrument was operated with a 300 V, −9 kV secondary accelerating voltage, and a mass resolving power of 350. A pyrite sample with an accepted δ34S value of 15.1‰ ± 0.3‰ from the Balmat metamorphosed massive sulfide deposit (New York, United States) was used as the S isotope standard (Crowe and Vaughan, 1996). SIMS results from the standards were compared to accepted isotopic compositions in order to calculate correction factors that were applied to the unknowns measured during the same analytical session (e.g., Holliger and Cathelineau, 1988) and results are reported as δ34SVCDT (‰). Spot-to-spot reproducibility for the Balmat pyrite reference material was 0.3‰. For a detailed description of operating conditions and strategy for correction of instrumental mass fractionation and matrix effects for S isotope analysis see Riciputi et al. (1998).
Using the ore domain criteria of Robb et al. (2023, companion paper), data reported in this study are from samples classified as “Group 1” and “Group 2” mineralization. Group 1 is the dominant hypogene ore type, characterized by high Pd and low Pd/Au, and comprising an ore assemblage dominated by chalcopyrite-pyrite-magnetite±hematite. Group 2 is a less abundant mineralization style, characterized by the presence of partially martitized magnetite, apatite, and carbonates; these are interpreted (Robb et al., 2023, companion paper) to represent hypogene ores modified by late structurally controlled carbonate alteration, and have high Pd, and high Pd/Au ratios compared to Group 1. The general absence of sulfide phases in Group 2 samples skewed the choice of analyzed samples towards those in Group 1; where possible, Group 2 samples with some chalcopyrite and pyrite were analyzed. The results below focus on the base metal sulfides pyrite and chalcopyrite. Robb et al. (2023, companion paper) describe accessory and PGM characteristics in the same samples.
At the deposit scale, pyrite abundance in hypogene Cu-Au ore is highly variable—typically between 1-3 vol.%—but locally as high as 10 vol%. Pyrite occurs as disseminated grains and grain aggregates along fractures and infilling breccia matrix. X-ray fluorescence mapping (representative core sample shown in Figure 3) shows that, macroscopically, pyrite occurrences (using Fe Kα and Co Kα as proxies) may be spatially correlated with chalcopyrite. However, pyrite-rich, chalcopyrite-barren veinlets are common. Textural decoupling suggests that these minerals were precipitated at different times, even sequentially, along the same structures. Reflected light microscopy confirms this, showing that pyrite can occupy distinct structures in the sequence (Figure 4A) that are overprinted by later Cu-bearing features, whereas Cu-rich zones in the ores can be completely pyrite-free (Figure 4D). Textural relationships show that chalcopyrite postdates pyrite in all samples, replacing pyrite (rim replacement, island-mainland texture) and infilling fractures in, and porosity between, pyrite grains (e.g., Figures 4A–C, F). Similar textures in pyrite were reported by Nixon (2004) at New Afton, and Pass (2010) at the Mt. Polley deposit. Two dominant textural variants of pyrite were recognized. The earliest pyrite (type I) comprises granular or spongy, anhedral to subhedral polycrystalline aggregates, often ring-shaped or bloom-like and showing variable degrees of annealing of contained grains (Figure 4C). The aggregates resemble diagenetic pyrite aggregates formed during authigenesis. Individual grains annealed into these aggregates are ∼1–10 μm in size, whereas the final aggregates may be up to 0.5 mm in diameter. Later pyrite (type II) comprises euhedral to subhedral single grains (20 μm–1 mm diameter) and coarse-grained aggregates lacking the finer granularity and porosity of type I pyrite (Figures 4A, B, E). Type II pyrite is rarely found in association with type I pyrite, but where it does, it is readily distinguishable from type I pyrite by its euhedral shape (Figure 4C). Occasionally, type II pyrite grains occur as epitaxial overgrowths on type I pyrite (Figure 4C; center red arrow). Where type II pyrite occurs with hematite, it contains inclusions of this mineral (Figure 4E). Both types I and II pyrite show brecciation/replacement/resorption by chalcopyrite. The replacement/resorption is often nearly complete, leaving relict inclusions of pyrite in chalcopyrite (Figure 4F).
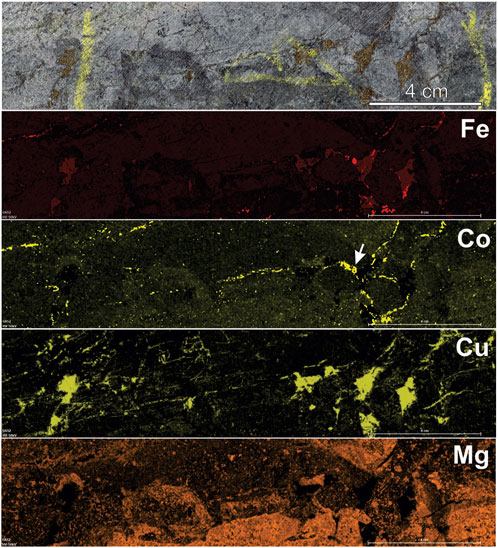
FIGURE 3. X-ray intensity maps of a representative core sample from hypogene ore at New Afton. The cut core sample is shown in the top frame, containing abundant chalcopyrite as a matrix infill and in stringers/veinlets within “crackle breccia”. Maps of Fe Kα, Co Kα, Cu Kα, and Mg Kα (from top to bottom) showing disseminated pyrite (highest intensity Fe and Co) spatially concident in a few areas, but overall texturally decoupled from chalcopyrite (highest intensity Cu) indicating that the minerals are not coeval. The white arrow in the Co map marks a pyrite grain (seen also in Fe map) with Co-rich rim zones, clearly visible at this scale. The Mg map shows enrichment in chlorite in “mafic” fragments in the breccia. Sample taken from near the picrite flow faulted contact with the porphyry (Figure 1). Scale bar length equivalent in all frames.
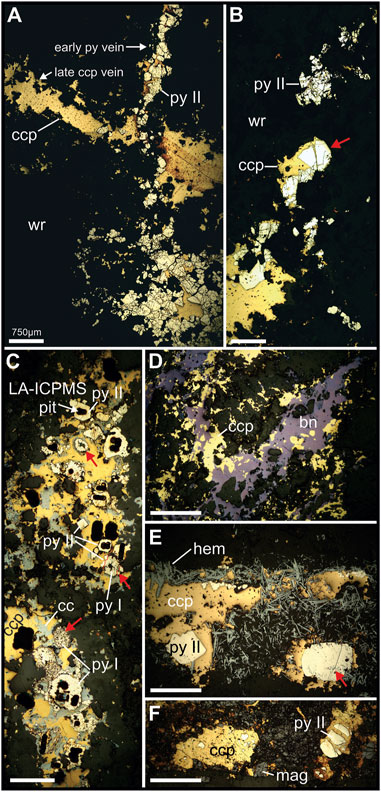
FIGURE 4. Reflected light photomicrographs (PPL) showing representative textural association between ore and accessory minerals in hypogene ore from New Afton. (A). Type II pyrite (py) vein overprinted by chalcopyrite (ccp) vein. Note the interstitial nature of the ccp infilling spaces between py grains. (B). Disseminated type II py grains showing partial enclosure, resorption and fracture infilling by ccp. Red arrow identifies fracture infilling of cpy in py. (C). Type I (anhedral, spongy or granular aggregates) and type II (euhedral to subhedral) pyrite included or partly included in ccp and chalcocite (cc) intergrowth. Dark patches within py and ccp are LA-ICP-MS pits. Top and bottom red arrows mark type II pyrite showing various stages of textural development, from “spongy” or granular/colloform aggregates of smaller grains to more coarsely crystalline grains. Central red arrow shows type I pyrite with euhedral type II pyrite grains that grew on its surface (red lines partition the type I from type II pyrite zones). (D). Pyrite-free ccp-bornite (bn) mineralization showing replacement of ccp by bn (island-mainland textures). (E). Hematite (hem)-py vein showing ccp enclosing type II pyrite. Red arrow marks hem inclusions in py, indicating type II pyrite growth was coeval with or post-dated hematite growth. (F). Relict type II pyrite in ccp overprinting (infilling matrix) of an earlier magnetite breccia. Other abbreviations: wr=wallrock. Scale bar length equivalent the same in all frames.
Chalcopyrite and pyrite from representative hypogene ore samples were analyzed by EPMA and LA-ICP-MS to determine their major and trace element composition, and in particular, characterize their PGE systematics. Fifteen thin sections of Group 1 and 2 samples with the highest concentrations of PGE were selected for spot analyses to characterize the trace element composition of chalcopyrite and pyrite grains. The EPMA analyses of the corresponding grains are listed in Supplementary Table S1. The compiled LA-ICP-MS data from single grain (spot analyses) of chalcopyrite (n=136) and pyrite (n = 58) are listed in Supplementary Tables S2.
Representative grains of type I and II pyrite were selected for trace element mapping by LA-ICP-MS. Areas were selected for mapping based on the results of EPMA, preliminary LA-ICP-MS spot analyses, and detailed petrography to ensure that representative pyrite textures, and Co, Ni and PGE concentration ranges were captured. The results described below are based on mapping of pyrite from 8 areas within 3 thin sections (3 type I pyrite examples, and 5 type II pyrite examples). Spot analyses extracted from LA-ICP-MS maps (n=7980) are listed in Supplementary Table S3. Spot analyses from single grains provide a broader deposit-scale picture of pyrite chemistry without textural distinction, whereas analyses extracted from time series maps provide detailed compositional ranges for a smaller number of grains from fewer samples but distinguish between types I and II pyrite.
EPMA analyses (Supplementary Table S1) show that chalcopyrite at New Afton is commonly slightly Fe-deficient and S-enriched compared to its ideal stoichiometry. EPMA analyses (Supplementary Table S1) show that pyrite contains highly variable concentrations of Co and Ni, with maximum abundances of Co up to ∼5.5 wt% and Ni up to ∼1.0 wt%. Low but highly variable concentrations of Cu noted in the EPMA analyses of pyrite occur in fracture infillings that contain chalcopyrite.
Chalcopyrite LA-ICP-MS spot analyses (Supplementary Table S2; Figure 5A) show a trace element concentration distribution (from most to least abundant; 1st-3rd quartile range) of Se (101–102 ppm level) > Pb (101–102 ppm) > Ag, Bi, As, Mn, Ni (10−1–101 ppm) > Sb, Te (10−1–10 ppm) > Pd, Pt, Au (10−2–10−1 ppm). No systematic differences are noted between samples or ore domain types. Palladium concentration in chalcopyrite has a mean of 0.22 ppm, and ranges from 0.004 to 13.4 ppm, with most analyses in the range between 0.01 and 0.1 ppm.
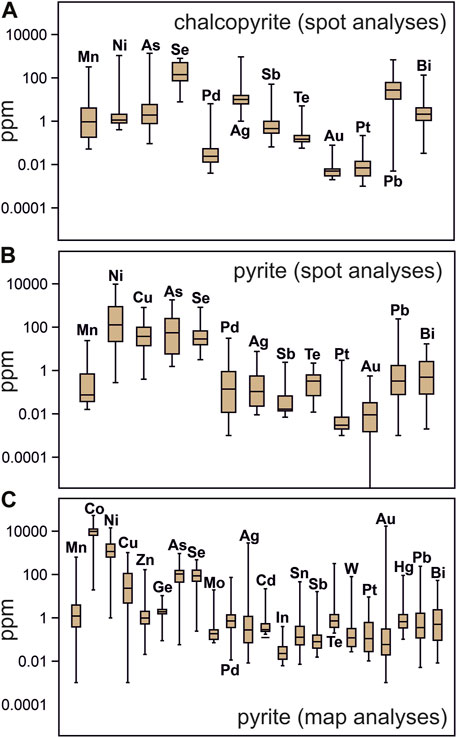
FIGURE 5. Box-whisker plots showing minor and trace element abundances in chalcopyrite and pyrite from the New Afton deposit. (A,B) Chalcopyrite (A) and pyrite (B) data from single grain spot analyses. (C). Pyrite data extracted from time series data (maps).
Pyrite LA-ICP-MS analyses (Supplementary Tables S3, S4; Figures 5B, C) show maximum concentrations of up to ∼9500 ppm Ni (single grain spot analyses), and up to ∼51,600 ppm Co and 13,790 ppm Ni (from mapped grains). Overall, the trace element concentration ranges from single grain and grain map analyses are similar, though some elements quantified from the mapped grains were not quantified in the single grain spot analyses (Co, Zn, Ge, Mo, Cd, In, Sn, W, Hg) and cannot be compared. Generally, from most to least abundant (1st to 3rd quartile range) in pyrite are Co, Ni (102–104 ppm level) > Cu, As, Se (101–102 ppm) > Mn, Pd, Zn, Ge, Cd, Ag, Te, Pb, Bi, Sb, Te, Pt, Au, Mo, In, Hg, W, and Sn (10−1–100 ppm). Elevated concentrations of Cu, Ag, Sb, Hg, In, Te, Pb, and Bi are correlated to fracture infillings in pyrite containing chalcopyrite. Pyrite has a much larger variation in Pt and Pd content than chalcopyrite and is comparatively richer in Pd, on average. Palladium concentration in pyrite has a mean of 2.8 ppm, and ranges from 0.01 to 71 ppm, with 70% of analyses falling between 0.01 and 1 ppm. Platinum concentration in pyrite has a mean of 0.54 ppm, and ranges from 0.01 to 24 ppm, with 70% of analyses falling between 0.01 and 0.3 ppm. Median and 1st-3rd quartile ranges in pyrite trace element abundance at the deposit scale (twelve samples; spot analyses not from maps) and from detailed grain-scale mapping (three samples; spot analyses from maps) are very similar (Figures 5B, C). However, spot analyses extracted from mapped grains show a larger range in concentration for Pt (higher values from mapped grains), Mn, Cu, As, Se, Au, Ag and Te.
Early type I pyrite (Figure 6) shows a co-enrichment of Co and Pt in grain cores. These core zones carry the highest concentrations of Co (>5 wt%) and Pt (>10 ppm) observed in pyrite at New Afton. The cores are also associated with moderate Ni (∼1000 ppm) and Se (∼10–100 ppm) concentrations. The Co-Pt-enriched zones drop abruptly outward and are followed by a rim zone co-enriched in high Ni (up to 1 wt%), As (up to ∼1000 ppm), Se (up to 500 ppm), and Pd (up to several ppm). Occasionally (Figure 6) type I pyrite grain cores are crosscut by zones containing a late-stage of type I pyrite similar in composition to the rims of type I pyrite. This late-stage type I pyrite in the crosscutting zones and rims shows highly elevated Ni, As, Se, and Pd. The general paragenetic sequence (i.e., elemental prevalence with time during pyrite growth) illustrated by the maps of type I pyrite is: Co-Pt → Ni-Pd-As-Se.
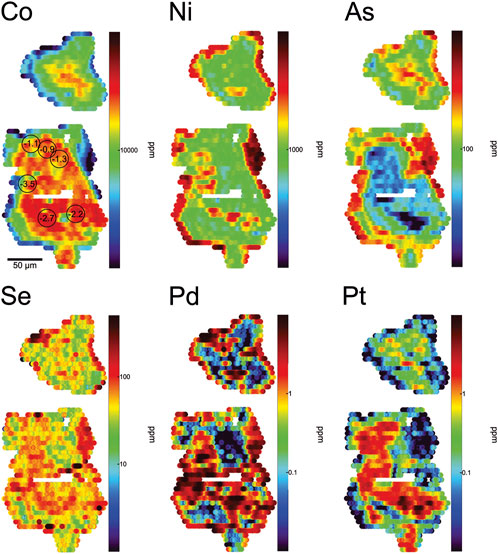
FIGURE 6. LA-ICP-MS maps of trace element concentrations in type I pyrite grains. The core zone is enriched in Co and Pt, and the rim is enriched in Ni, Pd, Se, and As. In the larger pyrite grain, another secondary zone of enrichment in Pd and Se crosscuts the older Co-Pt-enriched core, and appears to coincide with a diagonal band of Ni enrichment. Spot analyses in the map of Co show values of δ34SVCDT in units of ‰ (SIMS analyses).
Late type II pyrite (Figures 7–9) shows similar overall co-enrichment patterns from sample to sample, but these patterns are variable in the extent and complexity of oscillatory zoning. Figures 7, 8 are representative of relatively simple zoning relationships in type II pyrite. In these examples, grains consistently show that: 1) the earliest growth zones (cores) are co-enriched in very high concentrations of Ni (up to 1 wt%), Se (up to ∼500 ppm), and Pd (up to ∼15 ppm); Ni and Pd in core zones show the strongest positive correlation in mapped concentrations. Core zones are also enriched in Co (up to 1 wt%) and As (up to ∼500 ppm); 2) concentrations of Ni-Se-Pd decrease gradually to a Ni-Se-Pd poor rim zone, or may decrease and then increase again (only Ni and Pd show this) near the rim; 3) where observed, these outer zones of Ni and Pd re-enrichment also show Co and As co-enrichment as in cores, and concentrations of Ni-Pd-As-Co reach similar concentrations to those in cores; 4) enrichment in Se is only observed in the core of type II pyrite grains; 5) across the transition from core to rim, Co concentrations generally stay constant but may show some oscillations, and never reach the very high values observed in type I pyrite; 6) elevated Pd concentrations may occur where Ni and Co are co-enriched, but Pd concentrations in these Ni-Co-rich zones are never high unless Ni concentrations are high and Co:Ni ratios are low; 7) elevated Pt concentrations are discontinuous and rare, and never reach the same concentrations as those observed in type I pyrite; where Pt is observed, it is tied only to transitions from low Co/Ni to high Co/Ni pyrite and is not distributed at elevated concentrations throughout the entirety of higher Co/Ni zones. The general paragenetic sequence in type II pyrite with simple zoning is: Ni-Se-Pd-(Co-As) → Co-(Pt-Ni-As) → Ni-Pd-(Co-As), in which the last stage is not always observed.
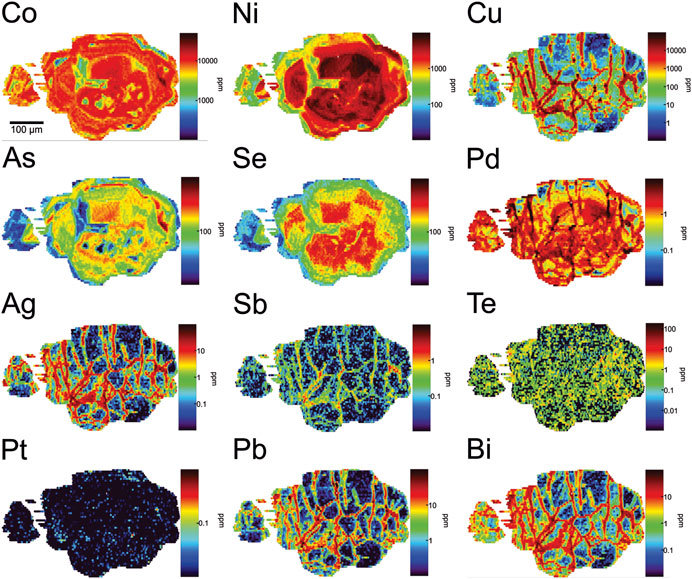
FIGURE 7. LA-ICP-MS maps of trace element concentrations in a type II pyrite grain showing simple zoning. Abundant fractures are infilled by chalcopyrite and coincide (generally, though some decoupling is apparent) with enrichments in Cu-Pb-Bi-Sb-Ag-Te-Pd corresponding to dissolved trace elements in chalcopyrite but also likely discrete platinum-group mineral grains and other accessory phases coeval with chalcopyrite. In contrast to those elements, Co-Ni-As-Se-Pt and Pd (mapped concentration based on 106Pd) are concentrated in primary growth zones in the pyrite. The highest concentrations of Pd coincide with the core of the pyrite grain, correlated with Ni and Se enrichment, and to a lesser extent Co and As. However, Co and As are decoupled partly from Pd-Ni-Se, and show enrichment also in the rim/outer growth zones of the pyrite. Slightly elevated Pt is observed in the outer growth zones of the pyrite, where Ni and Se decrease in abundance and Co remains enriched. Some oscillation in Co, Ni and As content is apparent.
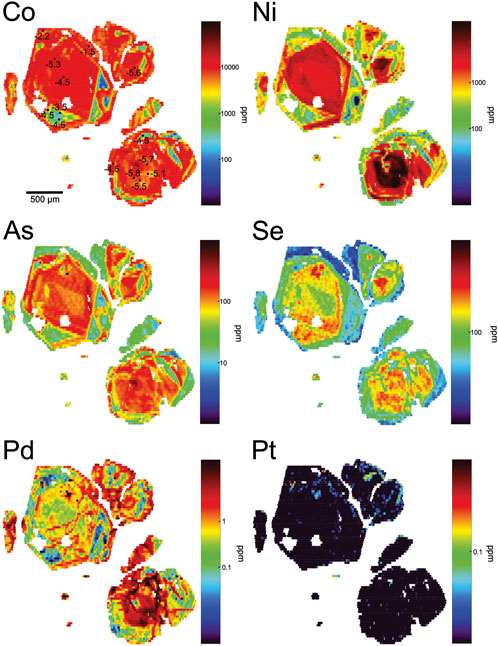
FIGURE 8. LA-ICP-MS maps of trace element concentrations in type II pyrite grains showing relatively simple zoning but with different Pd contents. The highest concentrations of Pd correlate with Ni enrichment in the core of the pyrites, in particular in the lower right-most grain. Concentrations of Co, Se and As also show coincidence with elevated Pd and Ni in the core. Subsequent growth zones are enriched in Co (which stays elevated from core to rim) but poor in Pd-Ni-Se-As. Slightly elevated Pt is observed in the outer growth zones of the pyrite, where Ni-As-Se decrease in abundance and Co remains enriched. The outermost rim of the grain shows elevated Ni-Pd-As, and sustained Co. Spot analyses in the map of Co show values of δ34SVCDT in units of ‰ (SIMS analyses).
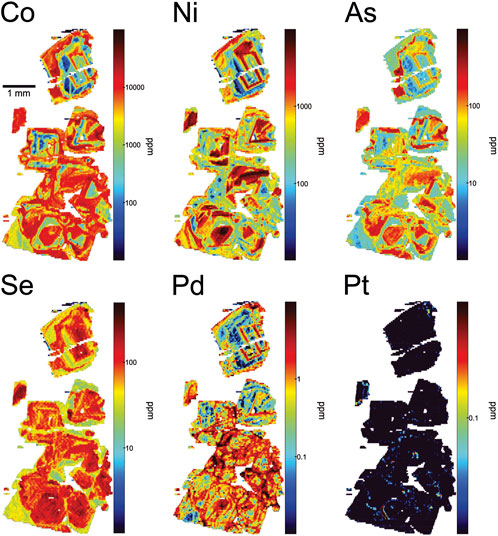
FIGURE 9. LA-ICP-MS maps of trace element concentrations in type II pyrite grains showing a more complex, oscillatory zoning pattern. “Barren” zones with low Co-Ni-Pd-Pt-As-(Se) are observed punctuating zones showing cycles of enrichment in these metals.
Figure 9 shows an example of more complex zoning relationships in type II pyrite than shown in Figures 7, 8. In this example: 1) the earliest growth zones (cores) are very enriched in Se, but do not show co-enrichment in Ni, Pd, Co and As seen in other type II grains (see fractured grain at top of Figure 9); 2) a subsequent zone shows co-enrichment in Ni, Pd, Se, Co and As, followed by another “barren zone” poor in these elements; 3) a subsequent Se-rich zone occurs, and 4) an outer rim zone occurs with low Se content but co-enriched in As, Co, Ni and Pd in the sequence: Co+As→Co+Ni→Co+Ni+Pd. As in the more simply zoned pyrite grains, this type II variant shows the co-enrichment in Pd only where Ni content is also very high (low Co/Ni pyrite). High Pt concentrations are rare and highly discontinuous, associated only with transitions from low Co/Ni to high Co/Ni pyrite, and low concentrations occur across growth zones with higher Co/Ni ratios.
Overprinting both type I and II pyrites, and spatially associated with fracture infillings in pyrite, are irregular zones rich in Mn, Cu, Zn, Mo, Ag, Pd, Cd, In, Sn, Sb, Te, W, Au, Hg, Pb, and Bi (Figure 7 shows a selection of these elements). This metal association is not linked to growth zoning in pyrite, and concentrations of these metals (with the exception of Pd) in clean, fracture-free zones of pyrite are very low (10−1–10 ppm order of magnitude range). Growth zones in type II pyrite that are deficient in the metal association Co-Ni-As-Se-PGE are common. Such zones that are poor in trace elements are identified in this study as “barren” zones (Figures 7–9). These zones are possibly related to the influx of metal-poor fluids.
Bivariate plots of Co-Ni-Pd-Pt-As-Se and their ratios in the New Afton pyrite show distinct compositional zones that can be reconciled with the trace element maps and provide quantitative limits on pyrite composition (Figures 10, 11; Supplementary Table S2, S3). Uncertainties resulting from selecting a different internal standard value for Fe (specific to each spot analysis extracted from the mapped grains rather than an average Fe from EPMA) as well as standard error bars (2 sigma) calculated by Iolite are shown in Figures 10A, F. These have negligible impact on the groupings/clustering of data in the scatter diagrams, as interpreted below.
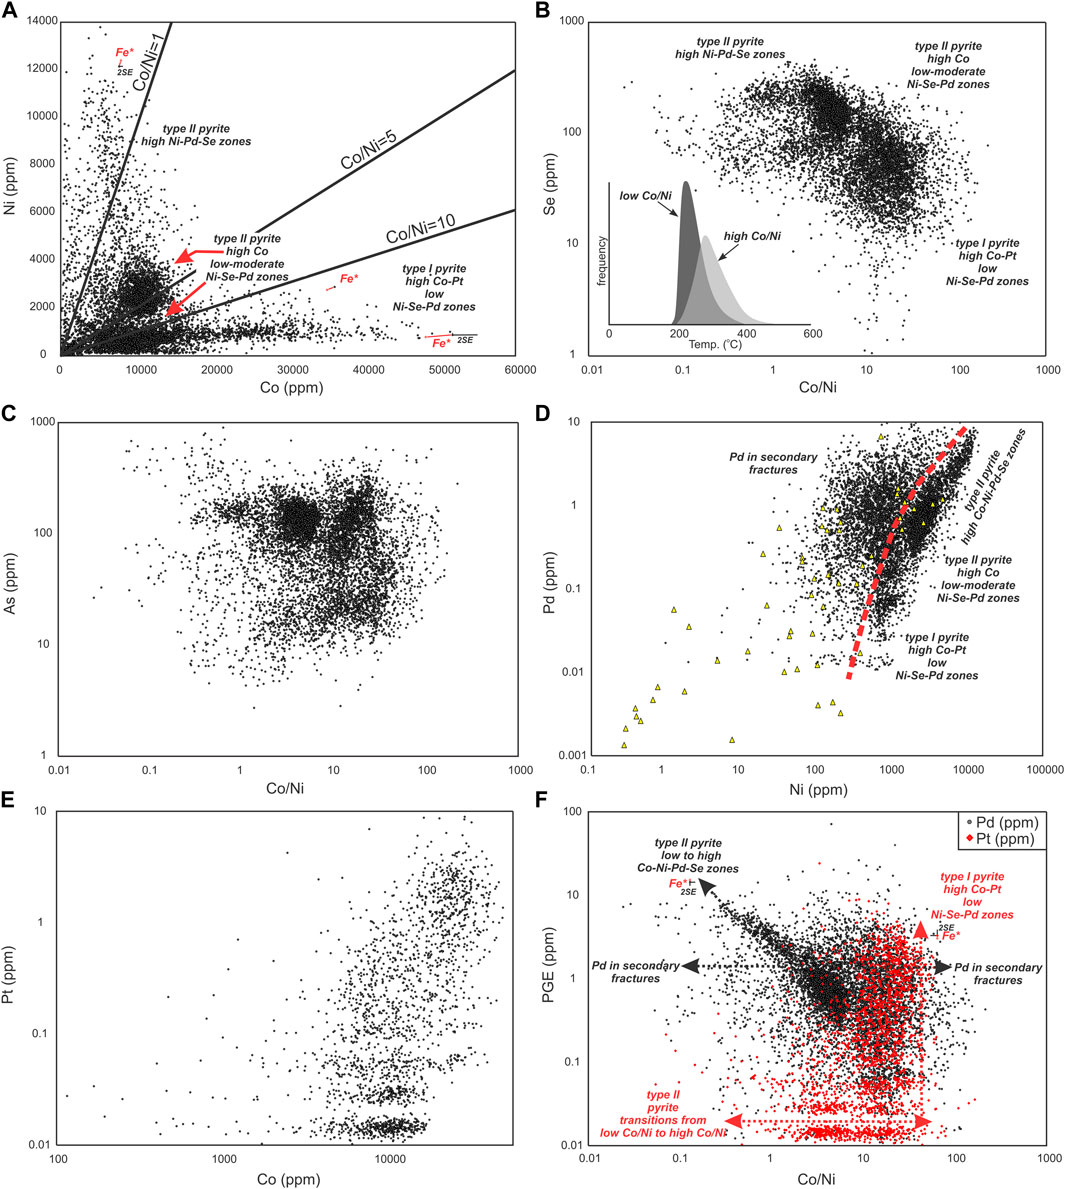
FIGURE 10. Scatter plots for selected elements quantified in pyrite by LA-ICP-MS mapping and single spot analyses. Data shown are for all type I and II grains mapped (black data points; n =7980; individual data points extracted from time series rasters across the grains; Supplementary Table S3) and individual spot analyses from selected grains from deposit-scale sample distribution (yellow triangles; n = 58; Supplementary Table S2). See text for explanation of the compositional variations shown in (A–F). The inset in frame (B) shows a histogram of calculated Se-in-pyrite temperatures (using method in Keith et al., 2018) for high Co/Ni (>7) and low Co/Ni (<7) pyrite (LA-ICP-MS), corresponding to the two clusters of analyses recognized in frame (B). The effect of using a different internal standard value for Fe for LA-ICP-MS data quantification is shown in (A,F). In frame (A), for three data points (low Co/Ni, intermediate Co/Ni and high Co/Ni ratios; marked with Fe*) the resulting shift in the data is shown as a red line connecting the data point quantified using a value of 44.2 wt% (average EPMA) to a data point (empty red circle) quantified using a different Fe value (specific to each analysis, for that location in the map). In frame F, two data points, one at low Co/Ni ratio for Pd data, and one at high Co/Ni ratio for Pt data are shown calculated at two different Fe internal standard values (EPMA average of 44.2 wt%, black or red solid symbol; and the specific Fe value for that data point, empty red circle). The calculated uncertainty (2SE) is also shown on these data points (calculated using Fe=44.2 wt%) as black bars in one x and one y-axis direction.
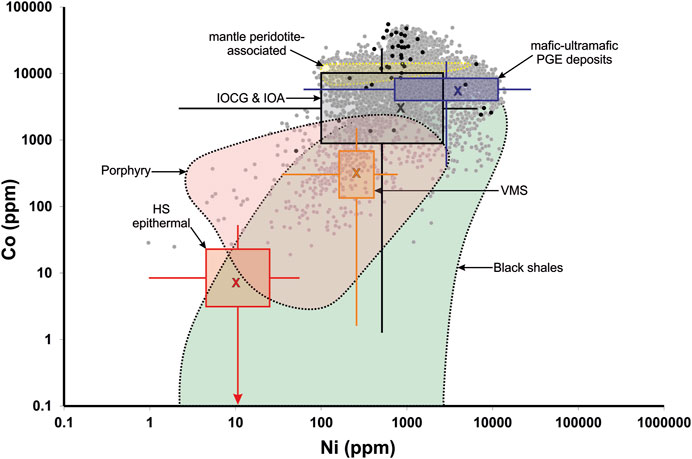
FIGURE 11. Scatter plot showing the Co-Ni concentrations in New Afton pyrite compared to compositional fields for other ore-forming environments. Data extracted from LA-ICP-MS maps are shown as grey circles (n = 7980; Supplementary Table S3). EPMA analyses (Supplementary Table S1) are shown as black filled circles. Compositional ranges (either fields or box plots) are shown for high sulfidation epithermal gold deposits (Tanner et al., 2016; Keith et al., 2020; Steadman et al., 2020), volcanogenic massive sulfide deposits (Maslennikov et al., 2009; Genna and Gaboury, 2015), and metal-rich black shales (Gregory et al., 2015a). New Afton pyrite compositions are compared to compositional ranges for mafic-ultramafic intrusion-related PGE deposits (Dare et al., 2010; 2011; Duran et al., 2015; Piña et al., 2016), IOCG (Reich et al., 2016; del Real et al., 2020; Steadman et al., 2020), mantle peridotite-associated Cu-Co-Ni-Zn-Ag-Au deposits (“Outokumpu-type”; Loukola-Ruskeeniemi, 1999), and porphyry deposits (Pass, 2010; Reich et al., 2013; Sykora et al., 2018; McFall et al., 2019; Steadman et al., 2020; González-Jiménez et al., 2021).
With respect to Co-Ni concentrations, pyrite analyses fall broadly into four groups in Figure 10A. Early cores in type I grains (Figure 6; enriched in Pt) have Co/Ni ratios > ∼7. Two clusters of analyses define those growth zones in type II pyrite with high Co and either low Ni-Pd (Co/Ni > ∼ 7; red arrows in Figure 10A) or moderate Ni-Pd enrichment (Co/Ni < ∼7; cluster between ∼3–7; red arrows in Figure 10A). A fourth group shows scatter to low Co/Ni ratios (<∼3) and corresponds to those zones in type II pyrite with high Ni-Pd concentrations. High Co/Ni, high Co pyrite is associated with lower Se content than low Co/Ni, high Ni pyrite (Figure 10B). The high Co/Ni, high Co pyrite also shows a wider range in As content that extends to considerably lower As values (Figure 10C).
Comparison of Pd and Ni concentrations in type I and II pyrite (Figure 10D) shows a curvilinear positive correlation from low (∼1000) to high (∼1 wt%) Ni. A large proportion of the analyses plot along this trend, but many analyses scatter to its left (left of red dashed line in Figure 10D) towards lower Ni contents, but showing a similar range in Pd concentrations. Mapping shows (e.g., Figure 7) zones of high Cu (in chalcopyrite) and Pd associated with cross-cutting features in pyrite. While the impact of these features in the scatter diagrams has been suppressed through filtering out analyses with high Cu, the residual effects of those fractures at lower Cu concentrations are still showing (cf. Reich et al., 2016). As those fractures cut zones with either low or high Ni concentrations, a significant proportion of spot analyses extracted from the maps represent mixtures of high Pd fracture material and low Ni-Pd pyrite; this manifests as the scatter to the left of the pyrite trend in Figure 10D. A similar scatter is seen if other elements enriched in the fracture infillings are plotted against elements that are structurally tied to pyrite growth zoning. Importantly, single grain analyses (yellow triangles in Figure 10D) show a similar overall distribution and metal ranges. Platinum and Co show a similar relationship as shown by Pd and Ni, defining a diffuse curvilinear trend with the highest Pt concentrations generally associated with high Co. The trends involving Pd-Ni and Pt-Co in pyrite may be analogous to the solubility limit relationships and compositional fields for As and Au co-enrichment within pyrite in porphyry-epithermal systems (cf. Reich et al., 2005). The lack of significant scatter to the right of the red dashed trend line in Figure 10D suggests that Pd and Pt are close to saturation level over the range in Ni and Co contents in pyrite at New Afton.
The trend of increasing Pd with decreasing Co/Ni ratio in type II pyrite (Figure 10F) is distinct for structurally-bound Pd, with Co/Ni ratio controlling Pd content below a Co/Ni ratio of ∼7. Significant scatter to the left and right of this trend is due to the presence of non-structurally bound Pd occurring in chalcopyrite-bearing, overprinting fractures that was sampled with pyrite with a variable Co/Ni ratio during mapping. In contrast to Pd, the majority of elevated Pt concentrations (Figure 10F) in type I pyrite are most commonly tied to zones with Co/Ni ratios > ∼ 7. Pyrite with lower Pt content but with a wider range in Co/Ni ratio than in type I pyrite likely represents those zones in type II pyrite with transitions between high and low Co/Ni ratios (e.g., Figures 7–9).
Bulk (microdrilled) and in situ (SIMS) S isotope results are listed in Supplementary Table S4 and shown in Figure 12. Data were obtained by both methods for comparison purposes, and sampling was restricted to a few areas where these minerals (by microscope observation) were as pure as possible. However, obtaining pyrite uncontaminated by chalcopyrite was not possible as fracture infillings by chalcopyrite are pervasive in all pyrite types. Type I pyrite was targeted for bulk analysis as these grains contained the simplest zoning relationships with volumetrically dominant Co-enriched, Ni-Se-Pd poor cores and lacked the oscillatory zoning observed in type II pyrite. Bulk values of δ34SVCDT in type I pyrite and chalcopyrite are similar and range from −0.9 to +3.0‰ (n = 6) and −1.2 to +1.5‰ (n = 5). A single analysis of bornite yielded δ34SVCDT = 0.1‰.
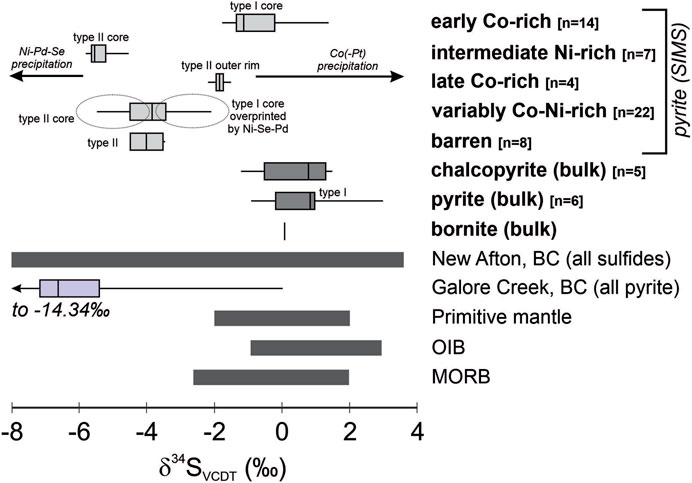
FIGURE 12. Sulfur isotope compositional ranges for type I and II pyrite zones of varying Co-Ni-Pd-Pt-Se-As composition at New Afton determined by SIMS, and related bulk sulfide mineral compositions. The transition from early Co-Pt-rich (“early Co-rich”), high Co/Ni type I pyrite cores to later, high Ni-Pd (“intermediate Ni-rich”), low Co/Ni type II growth zones is accompanied by a decrease in pyrite δ34SVCDT of up to ∼7‰ (4‰ range in single grains). Later overgrowths of high Co/Ni type II pyrite (“late Co-rich”) show values of δ34SVCDT similar to the earliest Co-Pt-rich growth zones in type I pyrite. “Variably Co-Ni-rich” pyrite corresponds to undifferentiated growth zones in type I and II pyrite that show a range in Co/Ni ratios, are not the most Co-rich or Ni-rich zones observed, and have S isotope compositions that fall between the most Ni-rich and Co-rich “end-member” compositions. “Barren” metal-poor zones in type II pyrite have a similar range to those variably Co-Ni-rich growth zones. The ranges for primitive mantle, OIB and MORB are from Thode et al. (1961); Sakai et al. (1984); Ueda and Sakai, (1984); Chaussidon et al. (1987; 1989). Unpublished data for Galore Creek pyrite (alkalic porphyry deposit) are from Micko (2011). Unpublished data for New Afton (all sulfides, deposit-scale) are from Deyell and Tosdal (2004).
Analysis of growth zones in pyrite required in situ methods. Analyses summarized in Supplementary Table S4 correspond to ∼20 µm spot sizes, and thus, in some cases, analyses represent mixed growth zones. However, reconciliation of analysis locations with LA-ICP-MS maps provides confirmation of the compositional regime of each SIMS spot. The locations of, and measured values of δ34SVCDT for, some analyzed spots in pyrite are shown in Figures 6, 8 to illustrate spatially variability in S isotope composition. Six pyrite variants were analyzed. Early Co-Pt-enriched, Ni-Se-Pd-poor cores (highest Co/Ni ratio) in type I pyrite range in δ34SVCDT between −1.6‰ and 1.4‰ (n = 14). With the exception of a single value of δ34SVCDT = 3.0‰, the bulk compositional range for type I pyrite of −0.9 to +1.0‰ (n = 5) falls entirely within the range of SIMS spot analyses. The range for bulk type I pyrite and type I Co-Pt-enriched cores is similar to, but slightly higher than, late Co-rich, low Ni-As-Se-Pd (high Co/Ni) rims on type II pyrite; these yield a range in δ34SVCDT from −2.2 to −1.5‰ (n = 14). Barren zones in type II pyrite, containing relatively low concentrations of all metals, show a narrow range in δ34SVCDT from −3.5 to −4.5‰ (n = 5). The zones that are richest in Ni-Se-Pd (lowest Co/Ni ratio) in type II pyrite yielded δ34SVCDT between −5.8 and −4.5‰ (n = 7). These four zones are tightly constrained by the trace element composition of the targeted areas and represent end-member compositional extremes for New Afton pyrite. A fifth zone, comprised of variably Co-Ni-rich type II pyrite with high Ni-Se-Pd contents, yielded similar values of δ34SVCDT to the lowest Co/Ni ratio pyrite, but with a slightly wider range, from −5.1 to −3.4‰ (n = 16). A sixth zone is reported, namely, Ni-Se-Pd-rich pyrite overprinting the core of a type I pyrite grain (Figure 6); this overprinting pyrite yielded δ34SVCDT values between −3.5 and −2.1‰ (n = 6). These data are consistent with a mixture of higher δ34SVCDT type I Co-Pt-enriched pyrite (primary zoning) and later Ni-Se-Pd-enriched pyrite (overprinting pyrite), likely due to the SIMS spot size and associated analytical volume being larger than the actual overprinting feature.
In summary, the results show a distinct shift to lower δ34SVCDT values of up to ∼7‰ associated with the transition from early Co-Pt-rich, Ni-Se-Pd-poor to later Ni-Se-Pd-rich pyrite zones. The δ34SVCDT data then show a shift back to higher values with the appearance of a new generation of Co-enriched, Ni-Se-Pd-poor pyrite. Overall, low δ34SVCDT values are associated with pyrite with a low Co/Ni ratio and high Ni-Pd contents, whereas high δ34SVCDT values are associated with pyrite zoning with a high Co/Ni ratio, lower Ni-Pd contents and higher Pt content. The observed shift in δ34SVCDT values is recognizable in bulk compositional data, based on the comparison of bulk and SIMS analyses for type I pyrite (Supplementary Table S4; Figure 12).
A wide variety of metals and metalloids can be incorporated into pyrite during its growth from magmatic-hydrothermal fluids. These can be structurally bound whereby their solubility in pyrite is augmented by the presence of other co-enriched elements that promote the decomposition of fluid-soluble metal complexes and facilitate chemisorption (e.g., Reich et al., 2005; Rickard and Luther, 2007; Deditius et al., 2009; Reich et al., 2016; Kusebauch et al., 2018). Alternatively, nanometer-to micrometer-sized particles of various metals, metal sulfides and alloys may become saturated at pyrite-fluid interfaces and become incorporated in primary growth zones (e.g., Reich et al., 2013; Keith et al., 2018; Kravtsova et al., 2020, and others therein). Recently, the use of LA-ICP-MS to measure and map the distribution of ore metals in pyrite and provide large mineral compositional data sets from this mineral has become a routine approach to better understanding fluid physicochemical parameters and changes in those parameters with time. Such data has provided significant insight into the nature of metal sources and metal precipitation mechanisms in a wide range of ore-forming environments including porphyry Cu-Au-Mo, epithermal Au, VMS, IOCG, orogenic and Carlin-type Au, paleoplacer Au, and magmatic Ni-Cu-PGE (e.g., Reich et al., 2005; Baker et al., 2006; Maslennikov et al., 2009; Deditius et al., 2009; Large et al., 2009; Large et al., 2014; Dare et al., 2010; Winderbaum et al., 2012; Peterson and Mavrogenes, 2014; Duran et al., 2015; Belousov et al., 2016; Reich et al., 2013; Reich et al., 2016; Gregory et al., 2015a; Gregory et al., 2015b; Piña et al., 2016; Tanner et al., 2016; Steadman and Large, 2016; Tardani et al., 2017; Kerr et al., 2018; Sykora et al., 2018; McFall et al., 2019; Keith et al., 2016; Keith et al., 2018; Keith et al., 2020; Román et al., 2019; del Real et al., 2020; Large and Maslennikov, 2020; Steadman et al., 2020; González-Jiménez et al., 2021; and others therein).
In the discussion below, we review the key compositional features of pyrite at New Afton, and compare some relevant compositional parameters to those reported for pyrite in other ore-forming environments. As well, we discuss the significance of the S isotope data.
Type I (early) and II (late) pyrite from the New Afton deposit records two to three cycles of metal enrichment. High Pt contents in pyrite were only associated with the growth of early, high Co and Co/Ni pyrite (type I cores). This was followed by the first Ni-Pd-Se-As co-enrichment event in high Ni, low Co/Ni pyrite (type I rims). Two, or possibly 3 subsequent Co-Ni-PGE-As-Se enrichment events occurred, recorded in type II pyrite. One of these was associated with some minor, discontinuous Pt enrichment that was associated with a transition from low Co/Ni to high Co/Ni pyrite. High Pd contents in pyrite are only associated with high Ni, low Co/Ni growth zones. Following the early Pd enrichment in type I pyrite, two subsequent Pd enrichments are recorded in association with high Ni-Co-As-Se contents. Commonly, Co-Ni-PGE-enriched zones coincide with Se-As-enriched zones, but evidence of offset is observed between the two element associations. For example, in Figure 9, it is evident that periods of Se-As enrichment did not reach peak intensity synchronously to Co-Ni-PGE enrichment, which tended to lag behind. Similarly, Co-enrichment persisted beyond the growth stage/s rich in Ni-Pd-Se-As. This is seen in Figures 7–9 in the outermost growth zones of type II pyrite that have high Co concentrations extending to the rims of the grains, whereas Ni-Pd-Se-As show a sharp decrease in concentration well before the rims. However, sulfur isotope data suggest that the sustained Co-enrichment outward was not tied to a single growth event. The Co-rich rim values of δ34S in type II pyrite are comparable to those in the earliest stages of pyrite growth (type I cores; Supplementary Table S4; Figure 12). Thus, the Co-rich rims may be overgrowths of new pyrite formed after a shift back to earlier (type I pyrite) fluid composition and/or conditions.
Notably, barren growth zones are also observed, in which Co-Ni-PGE-Se-As concentrations drop by up to 1-2 orders of magnitude relative to zones enriched in these metals. It is unlikely that the barren growth zones are linked to the incursion of externally-derived, relatively metal-poor fluids (e.g., lower T meteoric) since the S isotope composition of these growth zones is the same as adjacent metal-enriched zones (Supplementary Table S4; Figure 12). The barren growth zones may represent 1) periods during which magmatic-hydrothermal fluids were temporarily exhausted of metals, and/or 2) periods of non-metal deposition during which conditions were favorable for metals to remain dissolved in ore-bearing fluids and not precipitate in pyrite.
While not structurally analogous, experimental studies of Pd and Pt solubility in pyrrhotite (Kruse, 1990; Ballhaus and Ulmer, 1995) suggest that the oscillating Co-Pt and Ni-Pd co-enrichments in pyrite are related to temperature fluctuations. Those studies showed that partitioning of Pd and Pt into pyrrhotite is favored at high temperatures. At such conditions Fe2+ site vacancies in the pyrrhotite lattice are maximized and the PGE replace Fe atoms that have as their nearest neighbours a minimum number of vacancies. Fluctuations in temperature during pyrrhotite crystallization lead to variations in the abundance of these vacancies. Palladium substitutes Fe if this cation is surrounded by at least four vacancies, whereas Pt substitution would require at least five vacancies (Ballhaus and Ulmer, 1995). If Pd and Pt substitution into pyrite would require a similar temperature-dependent hierarchy of minimum vacancies, it would follow that Co-Pt-rich growth zones may have crystallized at higher temperature than Ni-Pd zones.
Variations in the Se content of the pyrite supports this suggestion. The incorporation of Se into pyrite is not primarily controlled by fluid pH or fO2 and is strongly temperature-dependent, whereby Se-rich pyrite formed from cooler fluids than Se-poor pyrite (Huston et al., 1995; Maslennikov et al., 2009; Keith et al., 2016; Keith et al., 2018). Using the semiquantitative Se-in-pyrite thermometer developed by Keith et al. (2018) for orogenic and Carlin-type, epithermal (high and low sulfidation, including alkalic) and porphyry deposits, high Co/Ni to low Co/Ni pyrite crystallized over a range between ∼450°C and 200°C (Figure 10B). This indicates that there were large fluctuations in temperature during pyrite growth. Calculated temperatures show a bimodal distribution (see inset in Figure 10B) with peaks around ∼240°C (for low Co/Ni pyrite; < ∼7) and ∼300°C (for high Co/Ni pyrite > ∼7). Note that these estimated temperatures are considerably lower than those estimated through modelling by Robb et al. (2023, companion paper) for the coprecipitation of Co-Pt and Ni-Pd in pyrite. Keith et al. (2018) did not discuss the influence of pressure on their tentative thermometer. On the other hand, Robb et al. (2023, companion paper) note that reducing the pressure used in their models (100 MPa) would result in a decrease in absolute reaction temperature, but would not impact the relative temperature between modelled reactions, which also indicate a cooling trend.
The latest stage of pyrite involved fracture infilling/overprinting by chalcopyrite and accessory minerals rich in Mn-Zn-Mo-Ag-Pd-Cd-In-Sn-Sb-Te-W-Au-Hg-Pb-Bi. Many of these elements (e.g., Pb, Ag, Bi, Sb, Te) are concentrated in chalcopyrite (based on single grain LA-ICP-MS analyses) but, with the exception of Pd, are not concentrated in pyrite. This suggests that their enrichment in chalcopyrite is not related to the release of those metals from dissolution of earlier pyrite. The low PGE content of chalcopyrite is consistent with their earlier scavenging by pyrite. Other metals in chalcopyrite (e.g., Se, Pd, As, Ni) may have been inherited during pyrite resorption. Robb et al. (2023, companion paper) provide a thermodynamic model to explain several aspects of the observed co-enrichment of Co-Ni-Pd-Pt in pyrite at New Afton and discuss crystallographic mechanisms by which these elements may concentrate in pyrite. They also document the relationship between earlier hypogene mineralization and later platinum-group minerals (PGM) formed by remobilization of the PGE.
Relatively few studies report data for the concentration of Pd and/or Pt in pyrite. In magmatic Ni-Cu-PGE deposits associated with mafic-ultramafic rocks, the earliest studies to recognize the PGE in pyrite used mass balance approaches, together with EMPA and PIXE to quantify these metals (e.g., Barkov et al., 1997; Oberthür et al., 1997; Cabri et al., 2002; Gervilla and Kojonen, 2002; Cabri et al., 2008; Cabri et al., 2010). Subsequent investigations using LA-ICP-MS to quantify PGE contents in the Great Dyke, Zimbabwe and at Aguablanca, Spain showed that Pt occurs in pyrite with elevated concentrations of Co, As and Se (Piña et al., 2011; Piña et al., 2016). In contrast, Pd abundance in these deposits is largely controlled by pentlandite. Dare et al. (2010) and Dare et al. (2011) found IPGE and some Pt concentrated in Co-Ni-As-Se-rich, oscillatory zoned pyrite in magmatic sulfide deposits at Sudbury, but PPGE were instead concentrated in sulfarsenide phenocrysts that grew early in the sulfide paragenesis. Djon (2010) and Duran et al. (2015) quantified high concentrations of Pt and Pd in Co-Ni-As-Se-enriched pyrite from unaltered high PGE grade sulfides and altered ores in the Lac Des Iles deposits, and noted decoupling of Pd from Pt, tied to variations in the Co and Ni content of pyrite. An unusual case of magmatic sulfide occurring within an appinitic intrusion (intermediate, alkaline) shows a similar Co-Ni-PGE association in pyrite (e.g., Graham et al., 2017). The studies above have attributed the occurrence of IPGE and small amounts of Pt in pyrite to inheritance from altered monosulfide solid solution (MSS), or via exsolution of pyrite from MSS.
The association of Co-Ni-As-Se in pyrite is common, and many studies show that these elements have the strongest overall tendency to be enriched in pyrite to very high concentrations. These elements also show the largest oscillations in concentration (measured up to 5 orders of magnitude), in response to a wide variety of thermochemical parameters (cf. Steadman et al., 2020). This is particularly common in high temperature magmatic-hydrothermal mineralization types but also in lower temperature types where pyrite grew from fluids that inherited this metal association from the leaching/alteration of former higher temperature sulfides or mafic-ultramafic rocks (e.g., Reich et al., 2005; Maslennikov et al., 2009; Deditius et al., 2009; Koglin et al., 2010; Large et al., 2009; Large et al., 2014; Winderbaum et al., 2012; Peterson and Mavrogenes, 2014; Belousov et al., 2016; Reich et al., 2013; Reich et al., 2016; Gregory et al., 2015a; Gregory et al., 2015b; Piña et al., 2016; Steadman and Large, 2016; Tardani et al., 2017; Sykora et al., 2018; McFall et al., 2019; Keith et al., 2016; Keith et al., 2018; Keith et al., 2020; Román et al., 2019; del Real et al., 2020; Large and Maslennikov, 2020; Steadman et al., 2020; González-Jiménez et al., 2021; and others therein). These studies demonstrate that pyrite often shows a T hierarchy to its metal zonations with the Co-Ni-As-Se enrichment stage associated with the highest T pyrite. For example, porphyry and IOCG/IOA pyrite tends to show the Co-Ni-As-Se association, notably early in the paragenesis. With time and decreasing temperature, Co-Ni-As-Se concentrations and Co/Ni ratios in pyrite decreased. Then, other metals (e.g., Cu, Au, Pb, Ag, Sb, Tl) increase in concentration. Often, these later metals show co-enrichment with elements such as As (e.g., Reich et al., 2016; Richards, 2018; Sykora et al., 2018; del Real et al., 2020; Steadman et al., 2020). Pyrite in other deposit types (e.g., VMS: Maslennikov et al., 2009; Genna and Gaboury, 2015; Belousov et al., 2016; epithermal: Tanner et al., 2016; Peterson and Mavrogenes, 2014) shows similar characteristics associated with temperature decrease. It has also been noted that low pH and boiling inhibit the uptake of Co and Ni into pyrite, whereas high fO2 promotes the uptake of Co, Ni and Se (e.g., Gregory et al., 2015a; b; Román et al., 2019; Steadman et al., 2020).
Few studies have reported the PGE content of sulfide minerals from porphyry deposits. In calc-alkaline systems, the PGE content of pyrite is very low (e.g., <0.08 ppm; McFall et al., 2019). In alkalic systems, many studies note discrete PGM in association with bornite-chalcopyrite, whereas pyrite and other sulfides are barren of PGE (e.g., Eliopoulos and Economou-Eliopoulos, 1991; 1999; Eliopoulos et al., 2014; McFall et al., 2016; McFall et al., 2018; K. McFall, unpublished data, 2020). However, recently González-Jiménez et al. (2021) conducted a detailed study of the PGE mineralogy at the alkalic Elatsite deposit, Bulgaria, and noted Pd concentrated in all base metal sulfides (chalcopyrite, bornite, pyrite) at ppm levels. As well, they showed that Pd in pyrite is accompanied by very high (1000s ppm to wt%-level) concentrations of As and Sb, but no spatial correlation between them and the PGE was noted. Importantly, and in contrast to the sulfides analyzed in this study, the chalcopyrite and bornite analyzed at Elatsite formed hypogene assemblages, whereas the pyrite characterized at Elatsite is a very late mineral, associated with an epithermal stage. González-Jiménez et al. (2021) showed that PGE in chalcopyrite and bornite do not occur in solid solution but rather as micro-to nano-sized particles of Pd-Te that were remobilized and reconcentrated in later pyrite.
Whereas the low Co/Ni ratio of pyrite at Elatsite is similar to Pd-enriched pyrite zones at New Afton, the Co+Ni content of pyrite at Elatsite is much lower than at New Afton (<∼2500 ppm). Since the PGE-rich pyrite is a low temperature product of PGE remobilization from earlier hypogene Cu-Fe-sulfides at Elatsite, it is not surprising that the pyrite Co-Ni content is also lower, reflecting the thermal hierarchy described above. Cobalt-Ni-As accessory sulfides (linnaeite, carrolite, siegenite, and rammelsbergite) at Elatsite, which are uncommon in typical porphyry systems, occur in textural association with late stage PGM (Augé et al., 2005). Possibly, these accessory phases represent the end-products of remobilization of earlier Co-Ni-As phases, now absent owing to complete resorption/dissolution. At New Afton, the Co-Ni-As precursor (pyrite) is preserved, providing a snapshot of the early stages of co-enrichment of these elements with PGE.
The only other studies within the Canadian Cordillera that noted PGE enrichment in pyrite from an alkalic porphyry setting are those of Pass et al. (2009) and Pass (2010) at the Mount Polley deposit. Contents of Pd and Pt in pyrite reported do not reach the same levels as at New Afton (<=1 ppm), and Co-Ni concentrations are likewise significantly lower (<4000 ppm). Textural relationships between pyrite and chalcopyrite at Mount Polley (involving two stages of pyrite) and prevalence of oscillatory zoning of trace elements are remarkably similar to New Afton pyrite. However, the metal associations with PGE are quite different between these deposits. At Mount Polley, many trace elements (Bi, Te, Ag, Pb, Zn, Cd) that are low in concentration in New Afton pyrite are tied to primary growth zoning, and zones of Pd enrichment (inner-most growth zones) are rich in these elements. Nickel and As are also spatially associated with the PGE in these growth zones at Mount Polley, affording some similarity between the two deposits.
The use of Co and Ni concentrations as a provenance tool to discriminate pyrite formed in different ore-forming environments has been assessed for a long time (e.g., Carstens, 1941; Hegemann, 1943; Gavelin and Gabrielson, 1947; Loftus-Hills and Solomon, 1967; Bralia et al., 1979; Mookherjee and Philip, 1979; Bajwah et al., 1987). Systematic compositional variations (e.g., in Co/Ni ratio) have been tied to host rock associations, and across many ore deposit types (metalliferous black shales, VMS, Sedex, stratiform copper, MVT, and intrusion-related deposits in mafic and felsic igneous settings). Bajwah et al. (1987) found no deposits in which pyrite contained more than ∼1 wt% and 1000 ppm Ni, and magmatic sulfide deposits associated with the Sudbury Igneous Complex had the highest Co and Ni. Pyrite from VMS deposits associated with mafic volcanic rocks also showed very high Co/Ni ratios; Figure 11 shows compositional fields defining the concentration ranges for Co and Ni in pyrite for a variety of ore-forming environments. EPMA and LA-ICP-MS data for New Afton pyrite are plotted for comparison to pyrite in these other environments. New Afton pyrite is richer in Co than pyrite in any other studied deposit type. The only significant overlap in composition (i.e., with broadly comparable ranges in Co and Ni content) occurs with IOCG and IOA deposits (Reich et al., 2016; Steadman et al., 2020; del Real et al., 2020), mafic-ultramafic PGE deposits (Dare et al., 2010; Duran et al., 2015; Piña et al., 2016), and mantle-peridotite associated Cu-Co-Zn-Ni-Ag-Au deposits (“Outokumpu”-type deposits; Loukola-Ruskeeniemi, 1999; Peltonen et al., 2008) which are polygenetic sedimentary exhalative deposits that derive a component of their metal endowment from leaching of ultramafic rocks. Data for alkalic porphyry deposits (e.g., Mount Polley, Canada: Pass, 2010; Elatsite, Bulgaria; González-Jiménez et al., 2021) fall within the high Co region of the field for porphyry deposits in Figure 11. Thus, pyrite from the New Afton deposit is anomalous even for deposits of equivalent classification.
The early Co-Ni-PGE enrichment recorded by hypogene pyrite at New Afton implicates a distinct mafic-ultramafic source contribution likely essential to the PGE tenor of the deposits but not necessarily tied to Cu and Au enrichment. This mafic-ultramafic source would likely be a cryptic component related to the parentage of the porphyry magmas, as observed at other porphyry systems, some of which contain anomalous PGE endowments (e.g., Bingham: Keith et al., 1997; Hattori and Keith, 2001; Lepanto: Hedenquist et al., 2016; Dexing: Reich et al., 2013). Alternatively, the endowment in Co, Ni and the PGE may be related to interaction of porphyry magmas and related high temperature volatiles with mafic-ultramafic wallrocks in the crust (cf. Reich et al., 2013). In Quesnellia, relevant mafic-ultramafic suites do regionally occur, and are coeval or juxtaposed with alkalic plutons. These include 1) subduction-related “Alaskan-type” ultramafic alkaline complexes that are anomalously high in Cu-PGE-Au–containing sulfide “reefs” with elevated Pd/Pt ratios and dunitic core zones that contain Pt-enriched chromitites (e.g., 209.9 ± 4.7 Ma Tulameen complex; Findlay, 1963; 1969; Nixon and Rublee, 1988; Rublee, 1994; Nixon et al., 2018); and 2) volatile-rich, oxidized, ultrapotassic, high-Mg, basaltic subvolcanic sills and flows (“picrites”) (Kwong, 1982; 1987; Nixon, 2004; Hanley and MacKenzie, 2009; Milidragovic et al., 2016). Lipske et al. (2021) point out that, although volumetrically minor, these ultrapotassic basaltic rocks are spatially associated with other alkalic porphyry deposits in both the Quesnel and Stikine terranes (Logan and Mihalynuk, 2014). Also, their emplacement immediately preceeded episodes of prolific porphyry mineralization, thus suggesting that ultrapotassic basaltic magmas may have played a key role in transporting metals into the crust. It is also worth noting the presence of early magnetite-apatite bodies at New Afton, concentrated along the contact between the porphyry and adjacent picrite (Cann, 1976; Lipske et al., 2021) and overprinted by hypogene mineralization. While Robb et al. (2023, companion paper) note that the chemical characteristics of porphyry mineralizing fluids are not linked directly to these IOA features, their presence at New Afton and the demonstrated similarities in composition between pyrite in IOA-IOCG settings and at New Afton (Figure 11) warrants further investigation to elucidate genetic links between alkalic porphyry deposits and IOA-IOCG magmatism in this particular setting.
Numerous studies of mineral deposit isotope geochemistry, allied with quantitative modelling, have evaluated the relative and combined effects of changes in P, T, redox and pH on ore fluid S speciation, and the related S isotope systematics of sulfide and sulfate minerals in porphyry deposits (e.g., Eastoe, 1983; Drummond and Ohmoto, 1985; Field et al., 2005; Fifarek and Rye, 2005; Rye, 2005; Peterson and Mavrogenes, 2014; Hedenquist et al., 2016; Hutchison et al., 2020). These studies illustrate distinct roles played by T, pH and fO2 in controlling S isotope fractionation when SO42−/H2S and δ34SΣS remain constant during fluid cooling. Hutchison et al. (2020) note that in such long-lived magmatic-hydrothermal systems, significant spatial and temporal variations in SO42−/H2S and δ34SΣS may occur as a result of multiple fluid injections, with each episode ultimately evolving along varied physicochemical trajectories. Consequently, this leads to scattered S isotope compositions for apparently coeval sulfide and sulfate minerals that do not follow simple linear trends in relation to cooling, unless mineral precipitation is rapid (Weis et al., 2012; Peterson and Mavrogenes, 2014; Richards, 2018).
In the absence of S isotope data for coeval sulfate minerals at New Afton, it is not possible to quantify the SO42−/H2S ratio and δ34SΣS of related fluids, or robustly model the T-isotope trajectories related to pyrite precipitation. However, assuming that these fluid parameters remained constant, and that the only cause of isotopic variations in the δ34S of the fluid (and precipitated pyrite) was exchange between SO42- and H2S, some tentative statements about the nature of the fractionation mechanisms relevant to New Afton can be made (Seal, 2006) based on the measured S isotope composition of pyrite. The transition from high Co/Ni, Co-(Pt)-enriched pyrite (type I cores) to low Co/Ni, Ni-Se-Pd-(Co-As)-enriched pyrite (type I rims, and type II cores) coincides with a decrease in pyrite δ34SVCDT of up to ∼7‰ (Supplementary Table S4; Figure 12). Values of δ34SVCDT for high Co/Ni zones broadly overlap with mantle S compositions (Figure 12; Thode et al., 1961; Sakai et al., 1984; Ueda and Sakai, 1984;; Chaussidon et al., 1987; 1989). The ∼7‰ decrease was reversed at least once: high Co/Ni rims on type II pyrite revert back to earlier values, and it is implied that this sequence was repeated several times, based on the observed oscillatory metal zonation in type II pyrite (Figure 9). A number of possible scenarios may explain the observed coupling of metal-S isotope zonation, as discussed below.
Magmatic SO2 will strongly partition into exsolved aqueous volatiles during fluid saturation (e.g., Scaillet and Pichavant, 2003). Cooling of that fluid will lead to hydrolysis of SO2 via the following disproportionation reaction (Ohmoto, 1972; Burnham and Ohmoto, 1980):
The resulting H2S will be depleted in 34S relative to the parental SO2, whereas SO42- will be enriched in 34S, and the exact isotopic composition of H2S and SO42- derived through this reaction will depend on T, fO2, and the initial composition of the parental SO2 (Kusakabe et al., 2000; McDermott et al., 2015). Since the New Afton porphyry system was likely initially relatively oxidized (Robb et al., 2023, companion paper) the SO42−/H2S ratio in ore fluids was likely relatively high. Assuming an initial δ34SSO2 around 0‰ (Ohmoto and Goldhaber, 1997), fluid cooling and associated precipitation of sulfides and sulfates over a large cooling interval would have likely resulted in significant shifts of δ34S in pyrite to lower values (Hutchison et al., 2020). Estimates of the change in temperature for the onset of Co(-Pt) and Ni(-Pd) precipitation stages in pyrite at New Afton (Robb et al., 2023, companion paper) predict a decrease of ∼150°C. This agrees well with temperature estimates from the Se content of high Co/Ni to low Co/Ni pyrite that show a decrease of up to ∼200°C. This temperature shift could account for some of the variability in S isotope composition observed in pyrite at New Afton. However, the measured shift is large (up to ∼7‰) compared to the typical range observed in sulfides in porphyry-type deposits resulting from cooling disproportionation (−3 to +1‰; Ohmoto and Rye, 1979; Rye, 1993; Wilson et al., 2007) and so additional processes must be invoked.
The loss of H2 during fluid boiling will oxidize aqueous H2S to SO42−, leading to preferential partitioning of 34S into SO42- and a resulting 34S-depleted H2S from which pyrite will crystallize (e.g., Ohmoto and Rye, 1979; Ohmoto and Lasaga, 1982; McKibben and Eldridge, 1990; Richards and Kerrich, 1993; Marini et al., 2011; Weatherley and Henley, 2013). Fluid boiling as a viable mechanism for S isotope fractionation has been demonstrated through in situ isotope analysis of zoned pyrite in intrusion-related and epithermal Au deposits (e.g., McKibben and Eldridge, 1990; Peterson and Mavrogenes, 2014). Boiling was recognized through fluid inclusion studies at New Afton (Sedge et al., 2017; Hanley et al., 2021) and occurred at ∼300°C in response to decompression related fault movement and/or brecciation of the porphyry stock. Fluid inclusions containing (non-boiling) ore fluid are trapped in dissolution-reprecipitation zones in apatite that immediately pre-date chalcopyrite (hypogene), whereas brine and vapor (the products of boiling) inclusions are trapped in syn-to post-chalcopyrite carbonates. Thus, boiling was likely timed with chalcopyrite precipitation and, therefore, postdated pyrite growth. Additional evidence for boiling not playing a role in pyrite chemical or isotopic evolution is the observation of very high Co-Ni-enrichments and relative low Pb, Ag, Au and As in New Afton pyrite; these characteristics are typical of pyrite zones formed under non-boiling conditions (Román et al., 2019).
In concert with S isotope fractionation resulting from cooling, the redox state, SO42−/H2S and δ34SΣS may have also fluctuated in response to the incursion of new pulses of oxidized metal-bearing magmatic fluids (Wilson et al., 2007; Peterson and Mavrogenes, 2014; Tanner et al., 2016) or possibly 34S-depleted exotic fluids (e.g., equilibrated with biogenic sulfides; Micko et al., 2014; Peterson and Mavrogenes, 2014). Ultimately, the range in S isotope data and associated oscillatory nature of metal zonation in pyrite might result from the combination of cooling and fluid recharge. This uncertainty should be addressed in future studies. At a deposit scale, previous bulk sulfide isotope studies at New Afton showed that negative δ34S values are associated with pyrite-rich zones for up to 100 m beyond the limits of the ore body and the range in values reported spans that recognized here in pyrite zonation (Figure 12; Deyell and Tosdal, 2004; Lipske et al., 2021). Thus, there is exploration relevance in studying the S isotope systematics of the New Afton deposit further.
Recent efforts to expand exploration criteria for routine geochemical exploration for PGE-enriched alkali porphyry deposits in the Canadian Cordillera have capitalized on the unique mineralogical characteristics and metal associations associated with these deposits (e.g., Pd-Hg signatures in detrital gold; Chapman et al., 2017). Consistent with this initiative, the results of this study demonstrate that high concentrations of Co-Ni co-enriched with Pd-Pt-As-Se in early hypogene pyrite are a hallmark of PGE-rich alkalic porphyry deposits in the Canadian Cordillera. The New Afton deposit stands out in this respect from other PGE-rich alkalic porphyry deposits globally that show PGE concentrated in only late epithermal-stage pyrite with no Co-Ni co-enrichment. Recognition of Co-Ni-rich, variably 34S-depleted pyrite in heavy mineral separates or thin section (detectable as minor elements by routine microprobe analysis) may provide a valuable exploration vector, thus enabling discrimination of PGE-barren from PGE-rich porphyry systems. The results of this study also reinforce that the global inventory of PGE in alkalic porphyry systems is likely poorly constrained, stemming partly from a lack of recognition that pyrite-rich zones in porphyry deposits may carry significant PGE resources, independent of, or complimentary to, their Cu-Au potential. Routine assaying for PGE during deposit evaluation and definition, examination of the PGE content of pyrite rejected to tailings during mineral processing (including historical tailings), and characterization of mineral chemistry is encouraged to determine if PGE recovery from pyrite has potential as a value-added commodity to supplement Cu and Au production.
Pyrite at New Afton records multiple cycles of Co-Ni-Pd-Pt-Se-As co-enrichment. Transitions from early, high Co/Ni (Pt-enriched) to later, low Co/Ni (Pd-enriched) to end-stage high Co/Ni pyrite growth are accompanied by fluctuations in pyrite δ34SVCDT. These results call for a comprehensive thermodynamic model (Robb et al., 2023, companion paper) that elucidates the physicochemical conditions required to precipitate the PGE early in the hypogene ore paragenesis (i.e., before Cu) but also explains the differential incorporation of Pt in high Co/Ni, high Co growth zones and Pd in low Co/Ni, high Ni-enriched growth zones in pyrite. As well, future work should attempt to resolve the characteristics of the mafic-ultramafic contribution to ore fluids at New Afton. In particular, given that many alkalic porphyry deposits of the Iron Mask Batholith are endowed in PGE, the results of this study raise important questions about both the spatial extent and nature of the ultimate parental source for the PGE.
The original contributions presented in the study are included in the article/Supplementary Material. Further inquiries can be directed to the corresponding author.
BB, SR, MK, JH, and JM: methodology, data collection, graphical interpretation and design, writing original draft, and editing the manuscript following reviews; JH and JM: supervision, conceptualization. All authors contributed to the article and approved the submitted version.
The research was supported by funding from NSERC Discovery Grants to JH (RGPIN-2012-341762) and JM (RGPIN-2018-05327), and an NSERC Engage Grant (EGP-536604-18) to JM.
The authors wish to acknowledge logistical support in obtaining samples for the study from New Gold Incorporated. We thank Ryan Sharpe (University of Manitoba) for assistance in providing S isotope analyses of pyrite by SIMS, Erin Adlakha (Saint Mary’s University) for μ-XRF mapping, and James Brenan (Dalhousie University) for LA-ICP-MS spot analysis. The manuscript was improved significantly through detailed reviews from 4 reviewers, and through earlier discussions with Joseph Petrus, Graham Nixon, Katie McFall, and Maria Economou-Eliopoulos.
The authors declare that the research was conducted in the absence of any commercial or financial relationships that could be construed as a potential conflict of interest.
All claims expressed in this article are solely those of the authors and do not necessarily represent those of their affiliated organizations, or those of the publisher, the editors and the reviewers. Any product that may be evaluated in this article, or claim that may be made by its manufacturer, is not guaranteed or endorsed by the publisher.
The Supplementary Material for this article can be found online at: https://www.frontiersin.org/articles/10.3389/feart.2023.819129/full#supplementary-material
Augé, T., Petrunov, R., and Bailly, L. (2005). On the origin of the PGE mineralization in the elatsite porphyry Cu-Au deposit, Bulgaria: comparison with the baula-nuasahi complex, India, and other alkaline PGE-rich porphyries. Can. Mineral. 43, 1355–1372. doi:10.2113/gscanmin.43.4.1355
Bajwah, Z. U., Seccombe, P. K., and Offler, R. (1987). Trace element distribution, Co: Ni ratios and Genesis of the big cadia iron-copper deposit, new south wales, Australia. Min. Dep. 22, 292–300. doi:10.1007/bf00204522
Baker, T., Mustard, R., Brown, V., Pearson, N., Stanley, C. R., Radford, N. W., et al. (2006). Textural and chemical zonation of pyrite at pajingo: a potential vector to epithermal gold veins. Geochem. Explor. Env. Anal. 6, 283–293. doi:10.1144/1467-7873/05-077
Ballhaus, C., and Ulmer, P. (1995). Platinum-group elements in the merensky reef: II. Experimental solubilities of platinum and palladium in Fe1− xS from 950 to 450°C under controlled ƒS2 and ƒH2. Geochim. Cosmochim. Acta 59, 4881–4888. doi:10.1016/0016-7037(95)00355-x
Barkov, A. Y., Halkoaho, T. A. A., Laajoki, K. V. O., Alapieti, T. T., and Peura, R. A. (1997). Ruthenian pyrite and nickeloan malanite from the Imandra layered complex, northwestern Russia. Can. Mineral. 35, 887–897.
Barrie, C. T. (1993). Petrochemistry of shoshonitic rocks associated with porphyry copper-gold deposits of central Quesnellia, British Columbia, Canada. J. Geochem. Expl. 48, 225–258. doi:10.1016/0375-6742(93)90006-8
Bath, A. B., Cooke, D. R., Friedman, R. M., Faure, K., Kamenetsky, V. S., Tosdal, R. M., et al. (2014). Mineralization, U-Pb geochronology, and stable isotope geochemistry of the lower main zone of the lorraine deposit, north-central British Columbia: a replacement-style alkalic Cu-Au porphyry. Econ. Geol. 109, 979–1004. doi:10.2113/econgeo.109.4.979
Beatty, T. W. (2002). New geological and paleontological data from the Harper Ranch group, Kamloops, British Columbia. Ottawa: Geological Survey of Canada. Current Research 2002-A14.
Beatty, T. W., Orchard, M. J., and Mustard, P. S. (2006). “Geology and tectonic history of the Quesnel terrane in the area of Kamloops, British Columbia,” in Paleozoic evolution and metallogeny of pericratonic terranes at the ancient pacific margin of north America, Canadian and Alaskan Cordillera: Geol. Ass. Can. Spec. Pap. Editors M. Colpron, and J. L. Nelson (Ottawa: P. des Marais), 45, 483–504.
Belousov, I., Large, R. R., Meffre, S., Danyushevsky, L. V., Steadman, J., and Beardsmore, T. (2016). Pyrite compositions from VHMS and orogenic Au deposits in the Yilgarn Craton, Western Australia: implications for gold and copper exploration. Ore Geol. Rev. 79, 474–499. doi:10.1016/j.oregeorev.2016.04.020
Berzina, A. N., Sotnikov, V. I., Economou-Eliopoulos, M., and Eliopoulos, D. G. (2007). First finding of merenskyite (Pd,Pt)Te2 in porphyry Cu-Mo ores in Russia. Russ. Geol. Geophys. 48, 656–658. doi:10.1016/j.rgg.2007.07.001
Bralia, A., Sabatini, G., and Troja, F. (1979). A revaluation of the Co/Ni ratio in pyrite as geochemical tool in ore Genesis problems. Min. Dep. 14, 353–374. doi:10.1007/bf00206365
Breitsprecher, K., Thorkelson, D. J., Groome, W. G., and Dostal, J. (2003). Geochemical confirmation of the kula-farallon slab window beneath the pacific northwest in Eocene time. Geology 31, 351–354. doi:10.1130/0091-7613(2003)031<0351:gcotkf>2.0.co;2
Brenan, J. M. (2015). Se-Te fractionation by sulfide-silicate melt partitioning: implications for the composition of mantle-derived magmas and their melting residues. Earth Planet. Sci. Lett. 422, 45–57. doi:10.1016/j.epsl.2015.04.011
Burnham, C. W., and Ohmoto, H. (1980). Late-stage processes of felsic magmatism. Min. Geol. Spec. 8, 1–11.
Cabri, L. J., Choi, Y., Nelson, M., Tubrett, M., and Sylvester, P. J. (2010). “Advances in precious metal trace element analyses for deportment using LAM-ICP-MS,” in Proc. 42nd Ann. Can. Mineral Process. Conf., Westin, Ottawa, January 19-21, 2010, 181–196.
Cabri, L. J., Rudashevsky, N. S., and Rudashevsky, V. N. (2008). “Current approaches for the process mineralogy of platinum-group element ores and tailings,” in Ninth international congress for applied mineralogy ICAM 2008 (The Australasian Inst. Min. Metall.), 9–17.
Cabri, L. J., Wilson, J. M. D., Distler, V. V., Kingston, D., Nejedly, Z., and Sluzheniken, S. F. (2002). Mineralogical distribution of trace platinum-group elements in the disseminated sulphide ores of Noril'sk 1 layered intrusion. Earth Sci. 111, 15–22. doi:10.1179/aes.2002.111.1.15
Cann, R. M. (1976). Geochemistry of magnetite and the genesis of magnetite-apatite lodes in the Iron Mask batholith, British Columbia. M.Sc. thesis (Vancouver, BC: University of British Columbia).
Carr, J. M., and Reed, R. J. (1976). “Afton: A Supergene copper deposit,” in Canadian Institute of Mining and Metallurgy Special Volume 15. Editor A. Sutherland Brown (Montreal, QC: Can. Inst. Min. Metall. Petrol), 376–387.
Chapman, R., Mileham, T., Allan, M., and Mortensen, J. (2017). A distinctive Pd-Hg signature in detrital gold derived from alkalic Cu-Au porphyry systems. Ore Geol. Rev. 83, 84–102. doi:10.1016/j.oregeorev.2016.12.015
Chaussidon, M., Albarede, F., and Sheppard, S. M. F. (1987). Sulphur isotope heterogeneity in the mantle from ion microprobe measurements of sulphide inclusions in diamonds. Nature 330, 242–244. doi:10.1038/330242a0
Chaussidon, M., Albarède, F., and Sheppard, S. M. (1989). Sulphur isotope variations in the mantle from ion microprobe analyses of micro-sulphide inclusions. Earth Plan. Sci. Lett. 92, 144–156. doi:10.1016/0012-821x(89)90042-3
Crespo, J., Reich, M., Barra, F., Verdugo, J. J., and Martinez, C. (2018). Critical metal particles in copper sulfides from the supergiant Río Blanco porphyry Cu-Mo deposit, Chile. Minerals 8, 519. doi:10.3390/min8110519
Crowe, D. E., and Vaughan, R. G. (1996). Characterization and use of isotopically homogeneous standards for in situ laser microprobe analysis of 34S/32S ratios. Am. Min. 81, 187–193. doi:10.2138/am-1996-1-223
Dare, S. A. S., Barnes, S-J., Prichard, H. M., and Fisher, P. C. (2011). Chalcophile and platinum-group element (PGE) concentrations in the sulfide minerals from the McCreedy East deposit, Sudbury, Canada, and the origin of PGE in pyrite. Min. Dep. 46, 381–407. doi:10.1007/s00126-011-0336-9
Dare, S. A. S., Barnes, S-J., and Prichard, H. M. (2010). The distribution of platinum-group elements (PGE) and other chalcophile elements among sulfides from the Creighton Ni–Cu–PGE sulfide deposit, Sudbury, Canada, and the origin of palladium in pentlandite. Min. Dep. 45, 765–793. doi:10.1007/s00126-010-0295-6
Deditius, A. P., Utsunomiya, S., Ewing, R. C., and Kesler, S. E. (2009). Nanoscale “liquid” inclusions of As-Fe-S in arsenian pyrite. Am. Min. 94, 391–394. doi:10.2138/am.2009.3116
Del Real, I., Thompson, J. F. H., Simon, A. C., and Reich, M. (2020). Geochemical and isotopic signature of pyrite as a proxy for fluid source and evolution in the Candelaria-Punta del Cobre iron oxide copper-gold district, Chile. Econ. Geol. 115, 1493–1518. doi:10.5382/econgeo.4765
DeLong, R. C., Godwin, C. I., Harris, M. W., Caira, N. M., and Rebagliati, C. M. (1991). Geology and alteration at the Mount Milligan gold-copper porphyry deposit, central British Columbia (93N/1E). Geol. Fieldwork 1990. B. C. Geol. Surv. Pap. 1, 199–206.
Devine, F. A. M., Chamberlain, C. M., Davies, A. G. S., Friedman, R., and Baxter, P. (2014). Geology and district-scale setting of tilted alkalic porphyry Cu-Au mineralization at the Lorraine deposit, British Columbia. Econ. Geol. 109, 939–977. doi:10.2113/econgeo.109.4.939
Deyell, C. L., and Tosdal, R. M. (2004). “Alkalic Cu-Au deposits of British Columbia: sulfur isotope zonation as a guide to mineral exploration,” in Geological fieldwork 2004, BC geol. Surv. Pap. 2005-01 (Victoria, BC), 191–208.
Djon, M. L. N. (2010). “Changement de la minéralogie des sulfures, des minéraux du groupe du platine et des textures avec le degré d’altération des zones Roby, Twilight et High-Grade du Complex du Lac-Des-Iles (Ontario, Canada),”. Unpublished M.Sc. thesis (Chicoutimi, QC: Université du Québec à Chicoutimi).
Drummond, S. E., and Ohmoto, H. (1985). Chemical evolution and mineral deposition in boiling hydrothermal systems. Econ. Geol. 80, 126–147. doi:10.2113/gsecongeo.80.1.126
Duran, C. J., Barnes, S.- J., and Corkery, J. T. (2015). Chalcophile and platinum-group element distribution in pyrites from the sulfide-rich pods of the Lac des Iles Pd deposits, Western Ontario, Canada: implications for post-cumulus re-equilibration of the ore and the use of pyrite compositions in exploration. J. Geochem. Expl. 158, 223–242. doi:10.1016/j.gexplo.2015.08.002
Eastoe, C. J. (1983). Sulfur isotope data and the nature of the hydrothermal systems at the Panguna and Frieda porphyry copper deposits, Papua New Guinea. Econ. Geol. 78, 201–213. doi:10.2113/gsecongeo.78.2.201
Economou-Eliopoulos, M., and Eliopoulos, D. G. (1999). Palladium, platinum and gold concentration in porphyry copper systems of Greece and their genetic significance. Ore Geol. Rev. 16, 59–70. doi:10.1016/s0169-1368(99)00024-4
Economou-Eliopoulos, M. (2005). “Platinum-group element potential of porphyry deposits,” in Exploration for platinum-group elements deposits. Editor J. Mungall (Québec: Mineralogical Association of Canada), 203–246.
Eliopoulos, D. G., and Economou-Eliopoulos, M. (1991). Platinum-group element and gold contents in the Skouries porphyry copper deposit, Chalkidiki Peninsula, northern Greece. Econ. Geol. 86, 740–749. doi:10.2113/gsecongeo.86.4.740
Eliopoulos, D. G., Economou-Eliopoulos, M., and Zelyaskova-Panayiotova, M. (2014). Critical factors controlling Pd and Pt potential in porphyry Cu–Au deposits: evidence from the Balkan peninsula. Geosciences 4, 31–49. doi:10.3390/geosciences4010031
Enns, S. G., Thompson, J. F. H., Stanley, C. R., and Yarrow, E. W. (1995). The Galore Creek porphyry copper-gold deposits, northwestern British Columbia. Can. Inst. Min. Metall. Petrol. Spec. Editor T. G. Schroeter 46, 630–643.
Ewing, T. E. (1981). Petrology and geochemistry of the Kamloops group volcanics, British Columbia. Can. Jour. Earth Sci. 18, 1478–1491. doi:10.1139/e81-138
Field, C. W., Zhang, L., Dilles, J. H., Rye, R. O., and Reed, M. H. (2005). Sulfur and oxygen isotopic record in sulfate and sulfide minerals of early, deep, pre-Main Stage porphyry Cu–Mo and late Main Stage base-metal mineral deposits, Butte district, Montana. Chem. Geol. 215, 61–93. doi:10.1016/j.chemgeo.2004.06.049
Fifarek, R. H., and Rye, R. O. (2005). Stable-isotope geochemistry of the Pierina high-sulfidation Au–Ag deposit, Peru: influence of hydrodynamics on SO42−H2S sulfur isotopic exchange in magmatic-steam and steam-heated environments. Chem. Geol. 215, 253–279. doi:10.1016/j.chemgeo.2004.06.040
Findlay, D. C. (1969). Origin of the Tulameen ultramafic-gabbro complex, southern British Columbia. Can. Jour. Earth Sci. 6, 399–425. doi:10.1139/e69-040
Findlay, D. C. (1963). Petrology of the tulameen ultramafic complex, yale district, British Columbia. Unpublished PhD thesis (Kingston, ON: Queen’s University).
Gavelin, S., and Gabrielson, O. (1947). Spectrochemical investigation of sulfide minerals from ores of the Skellefte district. The significance of minor constituents for certain practical and theoretical problems of economic geology. Sver. Geol. Undersökn. Ser. C No. 491 Årsb. 41, 1–45.
Genna, D., and Gaboury, D. (2015). Deciphering the hydrothermal evolution of a VMS system by LA-ICP-MS using trace elements in pyrite: an example from the Bracemac-McLeod deposits, Abitibi, Canada, and implications for exploration. Econ. Geol. 110, 2087–2108. doi:10.2113/econgeo.110.8.2087
Gervilla, F., and Kojonen, K. (2002). The platinum-group minerals in the upper section of the Keivitsansarvi Ni–Cu–PGE deposit, northern Finland. Can. Mineral. 40, 377–394. doi:10.2113/gscanmin.40.2.377
Ghosh, D. K. (1993). “Uranium-lead geochronology,” in Porphyry Cu-Au systems of British Columbia (Vancouver, BC: The University of British Columbia). Min Dep Res Unit Ann Tech Rep 111–1126.
González-Jiménez, J. M., Piña, R., Kerestedjian, T. N., Gervilla, F., Borrajo, I., Farré-de Pablo, J., et al. (2021). Mechanisms for Pd-Au enrichment in porphyry-epithermal ores of the Elatsite deposit, Bulgaria. Jour. Geochem. Expl. 10664, 106664. doi:10.1016/j.gexplo.2020.106664
Graham, S. D., Holwell, D. A., McDonald, I., Jenkin, G. R. T., Hill, N. J., Boyce, A. J., et al. (2017). Magmatic Cu-Ni-PGE-Au sulfide mineralisation in alkaline igneous systems: an example from the Sron Garbh intrusion, Tyndrum, Scotland. Ore Geol. Rev. 80, 961–984. doi:10.1016/j.oregeorev.2016.08.031
Gregory, D. D., Large, R. R., Halpin, J. A., Baturina, E. L., Lyons, T. W., Wu, S., et al. (2015a). Trace element content of sedimentary pyrite in black shales. Econ. Geol. 110, 1389–1410. doi:10.2113/econgeo.110.6.1389
Gregory, D. D., Large, R. R., Halpin, J. A., Steadman, J. A., Hickman, A. H., Ireland, T. R., et al. (2015b). The chemical conditions of the late Archean Hamersley basin inferred from whole rock and pyrite geochemistry with Δ33S and δ34S isotope analyses. Geochim. Cosmochim. Acta 149, 223–250. doi:10.1016/j.gca.2014.10.023
Hanley, J. J., Kerr, M., LeFort, D., Warren, M., MacKenzie, M., and Sedge, C. (2021). “Enrichment of platinum-group elements (PGE) in alkalic porphyry Cu-Au deposits in the Canadian Cordillera: new insights from mineralogical and fluid inclusion studies,” in Porphyry Deposits of the Northwestern Cordillera of North America: A 25-year update. Editors L. Sharman, J. Lang, and J. Chapman Can. Inst. Min. Metall. Petrol. Spec. Montmagny, QC, 57, 88–109.
Hanley, J. J., and MacKenzie, M. K. (2009). “Incorporation of platinum-group elements and cobalt into subsidiary pyrite in alkalic Cu-Au porphyry deposits: significant implications for precious metal distribution in felsic magmatic-hydrothermal systems (abstract ID V14a-03),” in AGU Spring Meeting 2009, San Francisco, CA, December 14th, 2009 to December 18th, 2009.
Hattori, K. H., and Keith, J. D. (2001). Contribution of mafic melt to porphyry copper mineralization: evidence from mount pinatubo, Philippines, and Bingham Canyon, Utah, USA. Min. Dep. 36, 799–806. doi:10.1007/s001260100209
Hedenquist, J. W., Arribas, R. A., and Aoki, M. (2016). Zonation of sulfate and sulfide minerals and isotopic composition in the Far Southeast porphyry and Lepanto epithermal Cu–Au deposits, Philippines. Res. Geol. 67, 174–196. doi:10.1111/rge.12127
Hegemann, F. (1943). Die geochemische Bedeutung von Kobalt und Nickel in Pyrit. Zeit. Ang. Mineral. 4, 122–239.
Herrington, R. J., Jankovic, S., and Kozelj, D. (1998). “The Bor and Madjanpek copper-gold deposits in the context of the Bor metallogenic zone (Serbia, Yugoslavia),” in Porphyry and hydrothermal copper and gold deposits – a global perspective Proc. Austral. Min. Found. Conf. Editor T. M. Porter (Adelaide, Australia: PGC Publishing).
Holliger, P., and Cathelineau, M. (1988). In situ U-Pb age determination by secondary ion mass spectrometry. Chem. Geol. 70, 173. doi:10.1016/0009-2541(88)90702-4
Huston, D. L., Sie, S. H., Suter, G. F., Cooke, D. R., and Both, R. A. (1995). Trace elements in sulfide minerals from eastern Australian volcanic-hosted massive sulfide deposits: part I, proton microprobe analyses of pyrite, chalcopyrite, and sphalerite, and Part II. Selenium levels in pyrite; comparison with δ34S values and implications for the source of sulfur in volcanogenic hydrothermal systems. Econ. Geol. 90, 1167–1196. doi:10.2113/gsecongeo.90.5.1167
Hutchison, W., Finch, A. A., and Boyce, A. J. (2020). The sulfur isotope evolution of magmatic-hydrothermal fluids: insights into ore-forming processes. Geochim. Cosmochim. Acta 288, 176–198. doi:10.1016/j.gca.2020.07.042
Kehayov, R., Bogdanov, K., Fanger, L., von Quadt, A., Pettke, T., and Heinrich, C. (2003). “The fluid chemical evolution of the Elatsite porphyry Cu-Au-PGE deposit, Bulgaria,” in Mineral exploration and sustainable development: 7th biennial SGA meeting. Editor D. G. Eliopoulos (Athens, Greece: Millpress), 1173–1176.
Keith, J. D., Whitney, J. A., Hattori, K., Ballantyne, G. H., Christiansen, E. H., Barr, D. L., et al. (1997). The role of magmatic sulfides and mafic alkaline magmas in the Bingham and Tintic mining districts, Utah. Jour. Petrol. 38, 1679–1690. doi:10.1093/petroj/38.12.1679
Keith, M., Haase, K. M., Klemd, R., Krumm, S., and Strauss, H. (2016). Systematic variations of trace element and sulfur isotope compositions in pyrite with stratigraphic depth in the Skouriotissa volcanic-hosted massive sulfide deposit, Troodos ophiolite, Cyprus. Chem. Geol. 423, 7–18. doi:10.1016/j.chemgeo.2015.12.012
Keith, M., Smith, D. J., Doyle, K., Howell, D. A., Jenkin, G. R. T., Barry, T. L., et al. (2020). Pyrite chemistry: A new window into Au-Te ore-forming processes in alkaline epithermal districts, cripple Creek, Colorado. Geochim. Cosmochim. Acta 274, 172–191. doi:10.1016/j.gca.2020.01.056
Keith, M., Smith, D. J., Jenkin, G. R. T., Holwell, D. A., and Dye, M. D. (2018). A review of Te and Se systematics in hydrothermal pyrite from precious metal deposits: insights into ore-forming processes. Ore Geol. Rev. 96, 269–282. doi:10.1016/j.oregeorev.2017.07.023
Kerr, M. J., Hanley, J. J., Kontak, D. J., Morrison, G. G., Petrus, J., Fayek, M., et al. (2018). Evidence of upgrading of gold tenor in an orogenic quartz-carbonate vein system by late magmatic-hydrothermal fluids at the Madrid Deposit, Hope Bay Greenstone Belt, Nunavut, Canada. Geochim. Cosmochim. Acta 241, 180–218. doi:10.1016/j.gca.2018.08.030
Koglin, N., Frimmel, H. E., Minter, W. L., and Brätz, H. (2010). Trace-element characteristics of different pyrite types in Mesoarchaean to Palaeoproterozoic placer deposits. Min. Dep. 45, 259–280. doi:10.1007/s00126-009-0272-0
Kravtsova, R. G., Tauson, V. L., Makshakov, A. S., Bryansky, N. V., and Smagunov, N. V. (2020). Platinum-group elements in arsenopyrites and pyrites of the Natalkinskoe gold deposit (Northeastern Russia). Minerals 10, 318–354. doi:10.3390/min10040318
Kruse, O. (1990). Mössbauer and X-ray study of the effects of vacancy concentration in synthetic hexagonal pyrrhotites. Am. Mineral. 75, 755–763.
Kusakabe, M., Komoda, Y., Takano, B., and Abiko, T. (2000). Sulfur isotopic effects in the disproportionation reaction of sulfur dioxide in hydrothermal fluids: implications for the δ34S variations of dissolved bisulfate and elemental sulfur from active crater lakes. Jour. Volcan. Geoth. Res. 97, 287–307. doi:10.1016/s0377-0273(99)00161-4
Kusebauch, C., Oelze, M., and Gleeson, S. A. (2018). Partitioning of arsenic between hydrothermal fluid and pyrite during experimental siderite replacement. Chem. Geol. 500, 136–147. doi:10.1016/j.chemgeo.2018.09.027
Kwong, Y. T. J. (1982). “A new look at the Afton copper mine in light of mineral distributions, host rock geochemistry and irreversible mineral-solution interactions,”. Unpublished PhD thesis (Vancouver, BC: The University of British Columbia), 121.
Kwong, Y. T. J. (1987). Evolution of the iron Mask batholith and its associated copper mineralization (British Columbia geological Survey bulletin 77). Victoria, BC: BC Min. Energy and Mines.
Lang, J. R., Stanley, C. R., and Thompson, J. F. H. (1995). “Porphyry copper-gold deposits related to alkalic igneous rocks in the Triassic-Jurassic arc terranes of British Columbia,” in Footprints along the Cordillera: Porphyry copper deposits from Alaska to Chile. Editors F. W. Pierce, and J. G. Bolm (Tuscon, AZ: Ariz. Geol. Soc. Dig), 20, 219–236.
Large, R. R., Danyushevsky, L., Hollit, C., Maslennikov, V., Meffre, S., Gilbert, S., et al. (2009). Gold and trace element zonation in pyrite using a laser imaging technique: implications for the timing of gold in orogenic and Carlin-style sediment-hosted deposits. Econ. Geol. 104, 635–668. doi:10.2113/gsecongeo.104.5.635
Large, R. R., Halpin, J. A., Danyushevsky, L. V., Maslennikov, V. V., Bull, S. W., Long, J. A., et al. (2014). Trace element content of sedimentary pyrite as a new proxy for deep-time ocean–atmosphere evolution. Earth Planet. Sci. Lett. 389, 209–220. doi:10.1016/j.epsl.2013.12.020
Large, R. R., and Maslennikov, V. V. (2020). Invisible gold paragenesis and geochemistry in pyrite from orogenic and sediment-hosted gold deposits. Minerals 10, 339. doi:10.3390/min10040339
Lecuyer, N. L., Rennie, D. W., Krutzelmann, H., and Vasquez, L. (2020). NI 43-101 technical report on the New Afton mine. Canada: British Columbia, 271.
LeFort, D. (2009). “Evidence for low-to intermediate-sulfidation epithermal-style processes associated with an alkalic porphyry Cu-Au system at the Mt. Milligan Cu-Au deposit, Quesnel terrane, British Columbia, Canada,”. Unpublished Bachelor’s thesis (Halifax, NS: Saint Mary’s University).
LeFort, D., Hanley, J., and Guillong, M. (2011). Subepithermal Au-Pd mineralization associated with an alkalic porphyry Cu-Au deposit, Mount Milligan, Quesnel terrane, British Columbia, Canada. Econ. Geol. 106, 781–808. doi:10.2113/econgeo.106.5.781
Lipske, J., Libera, M. D., Petersen, M., and Wade, D. (2018). Geology and mineralization of the New Afton porphyry Cu-Au deposit, New Afton site tour presentation.
Lipske, J. L., Wade, D., Hall, R. D., and Petersen, M. A. (2021). “Geology and mineralization of the new Afton Cu-Au alkalic porphyry deposits, Kamloops, British Columbia,” in Porphyry Deposits of the Northwestern Cordillera of North America: a 25-year update. Editors L. Sharman, J. Lang, and J. Chapman Can. Inst. Mini. Metall. Petrol. Spec. (Montmagny, QC), 57, 648–667.
Lipske, J., and Wade, D. (2014). Geological model of the new Afton copper and gold deposit, British Columbia, new gold internal report, 53.
Loftus-Hills, G., and Solomon, M. (1967). Cobalt, nickel and selenium in sulphides as indicators of ore Genesis. Min. Dep. 2, 228–242. doi:10.1007/bf00201918
Logan, J. M., Mihalynuk, M. G., Ullrich, T., and Friedman, R. M. (2007). U-Pb ages of intrusive rocks and 40Ar/39Ar plateau ages of copper-gold-silver mineralization associated with alkaline intrusive centres at Mount Polley and the Iron Mask batholith, southern and central British Columbia. Victoria, BC: Geological Fieldwork BC Geol. Surv. Pap., 93–116.
Logan, J. M., and Mihalynuk, M. G. (2005). Porphyry Cu-Au deposits of the iron Mask batholith, southeastern British Columbia. Victoria, BC: British Columbia Geological Survey Geological Fieldwork. 271–290.
Logan, J. M., and Mihalynuk, M. G. (2014). Tectonic controls on early Mesozoic paired alkaline porphyry deposit belts (Cu-Au ± Ag-Pt-Pd-Mo) within the Canadian Cordillera. Econ. Geol. 109, 827–858. doi:10.2113/econgeo.109.4.827
Loukola-Ruskeeniemi, K. (1999). Origin of black shales and the serpentinite-associated Cu-Zn-Co ores at Outokumpu, Finland. Econ. Geol. 94, 1007–1028. doi:10.2113/gsecongeo.94.7.1007
MacDonald, G. A., and Katsura, I. (1964). Chemical composition of Hawaiian lavas. J. Petrology 5, 82–133. doi:10.1093/petrology/5.1.82
MacKenzie, M. K. (2009). “Mineralogy of the platinum-group elements (PGE) in the Afton Cu-Au-Pd porphyry deposit, iron Mask batholith, Kamloops, British Columbia,”. Unpublished Bachelor’s thesis (Halifax, NS: Saint Mary’s University).
Marini, L., Moretti, R., and Accornero, M. (2011). Sulfur isotopes in magmatic-hydrothermal systems, melts, and magmas. Rev. Mineral. Geochem. 73, 423–492. doi:10.2138/rmg.2011.73.14
Maslennikov, V. V., Maslennikova, S. P., Large, R. R., and Danyushevsky, L. V. (2009). Study of trace element zonation in vent chimneys from the Silurian Yaman-Kasy volcanic-hosted massive sulfide deposit (Southern Urals, Russia) using laser ablation-inductively coupled plasma mass spectrometry (LA-ICP-MS). Econ. Geol. 104, 1111–1141. doi:10.2113/gsecongeo.104.8.1111
McDermott, J. M., Ono, S., Tivey, M. K., Seewald, J. S., Shanks, W. C., and Solow, A. R. (2015). Identification of sulfur sources and isotopic equilibria in submarine hot-springs using multiple sulfur isotopes. Geochim. Cosmochim. Acta 160, 169–187. doi:10.1016/j.gca.2015.02.016
McFall, K. A., Roberts, S., McDonald, I., Boyce, A. J., Naden, J., and Teagle, D. (2019). Rhenium enrichment in the muratdere Cu-Mo (Au-Re) porphyry deposit, Turkey: evidence from stable isotope analyses (δ34S, δ18O, δD) and laser ablation-inductively coupled plasma-mass spectrometry analysis of sulfides. Econ. Geol. 114, 1443–1466. doi:10.5382/econgeo.4638
McFall, K. A., Naden, J., Roberts, S., Baker, T., Spratt, J., and McDonald, I. (2018). Platinum-group minerals in the Skouries Cu-Au (Pd, Pt, Te) porphyry deposit. Ore Geol. Rev. 99, 344–364. doi:10.1016/j.oregeorev.2018.06.014
McFall, K., Roberts, S., Teagle, D., Naden, J., Lusty, P., and Boyce, A. (2016). The origin and distribution of critical metals (Pd, Pt, Te and Se) within the Skouries Cu–Au porphyry deposit, Greece. Appl. Earth Sci. Trans. Inst. Mini. Metall. B 125, 100–101. doi:10.1080/03717453.2016.1166651
McFarlane, C., and Luo, Y. (2012). U-Pb geochronology using 193 nm Excimer LA-ICP-MS optimized for in situ accessory mineral dating in thin sections. Geosci. Can. 39, 158–172.
McInnes, B. I., and Cameron, E. M. (1994). Carbonated, alkaline hybridizing melts from a sub-arc environment: Mantle wedge samples from the Tabar-Lihir-Tanga-Feni arc, Papua New Guinea. Earth Planet. Sci. Lett. 122, 125–141. doi:10.1016/0012-821x(94)90055-8
McKibben, M. A., and Eldridge, C. S. (1990). Radical sulfur isotope zonation of pyrite accompanying boiling and epithermal gold deposition: a SHRIMP study of the valles caldera, new Mexico. Econ. Geol. 85, 1917–1925. doi:10.2113/gsecongeo.85.8.1917
McMillan, W. J. (1991). “Porphyry deposits in the Canadian Cordillera,” in Ore deposits, tectonics and metallogeny in the Canadian Cordillera. Editors W. J. McMillan, T. Höy, D. G. MacIntyre, J. L. Nelson, G. T. Nixon, J. L. Hammacket al. (Victoria, BC: Province of British Columbia, Ministry of Energy, Mines, and Petroleum Resources), 252–276.
Micko, J., Tosdal, R., Bissig, T., Chamberlain, C. M., and Simpson, K. A. (2014). Hydrothermal alteration and mineralization of the Galore Creek alkalic Cu-Au porphyry deposit, northwestern British Columbia, Canada. Econ. Geol. 109, 891–914. doi:10.2113/econgeo.109.4.891
Mihalynuk, M. G., Diakow, L. J., Friedman, R. M., and Logan, J. M. (2016). Chronology of southern Nicola arc stratigraphy and deformation. B. C. Geol. Surv. Geol. Fieldwork 2015, 31–63.
Mihalynuk, M. G., Nelson, J., and Diakow, L. J. (1994). Cache Creek terrane entrapment: oroclinal paradox within the Canadian Cordillera. Tectonics 13, 575–595. doi:10.1029/93tc03492
Milidragovic, D., Chapman, J. B., Bichlmaier, S., Canil, D., and Zagorevski, A. (2016). H2O-driven generation of picritic melts in the Middle to late triassic stuhini arc of the stikine terrane, British Columbia, Canada. Earth Planet. Sci. Lett. 454, 65–77. doi:10.1016/j.epsl.2016.08.034
Monger, J. W. H., and McMillan, W. J. (1989). Geology, Ashcroft. British Columbia: Geological Survey of Canada. Map 42-1981 Sheet 1.
Mookherjee, A., and Philip, R. (1979). Distribution of copper, cobalt and nickel in ores and host-rocks, Ingladhal, Karnataka, India. Min. Dep. 14, 33–55. doi:10.1007/bf00201866
Mortensen, J. K., Ghosh, D. K., and Ferri, F. (1995). U-Pb geochronology of intrusive rocks associated with copper-gold porphyry deposits in the Canadian Cordillera. Editor T. G. Schroeter Can. Inst. Min. Metall. Petrol. Spec., 142–158.
Mortimer, N. (1987). The Nicola group: late triassic and early jurassic subduction-related volcanism in British Columbia. Can. Jour. Earth Sci. 24, 2521–2536. doi:10.1139/e87-236
Mutschler, F. E., Griffin, M. E., Stevens, D. S., and Shannon, S. S. (1985). Precious metal deposits related to alkaline rocks in the North American Cordillera: an interpretive review. Ver. Geol. Veren. Suid-Afrika 88, 355–377.
Nixon, G. T., and Laflamme, J. H. G. (2002). Cu-PGE mineralization in alkaline plutonic complexes BC Geol. Surv. Geofile 2002-02.
Nixon, G. T., Manor, M. J., and Scoates, J. S. (2018). Cu-PGE sulphide mineralization in the tulameen alaskan-type intrusion: analogue for Cu-PGE reefs in layered intrusions? (British Columbia geological Survey geofile 2018-2). Victoria, BC: BC Min. Energy Mines Petrol. Res.
Nixon, G. T. (2004). Platinum group elements in the Afton Cu-Au porphyry deposit, southern British Columbia. Geol. Fieldwork 2003, B. C. Geol. Surv. Pap., 263–289.
Nixon, G. T., and Rublee, V. J. (1988). Alaskan-type ultramafic rocks in British Columbia: new concepts of the structure of the Tulameen complex. Geol. Fieldwork 1987, B. C. Geol. Surv. Pap. 1988 (01), 281–294.
Oberthür, T., Cabri, L. J., Weiser, T. W., and Müller, P. (1997). Pt, Pd and other trace elements in sulfides of the main sulphide zone, great dyke, Zimbabwe: A reconnaissance study. Can. Min. 35, 597–609.
Ohmoto, H., and Goldhaber, M. B. (1997). “Sulfur and carbon isotopes,” in Geochemistry of hydrothermal ore deposits. Editor H. L. Barnes (J. Wiley and Sons), 517–611.
Ohmoto, H., and Lasaga, A. C. (1982). Kinetics of reactions between aqueous sulfates and sulfides in hydrothermal systems. Geochim. Cosmochim. Acta 46, 1727–1745. doi:10.1016/0016-7037(82)90113-2
Ohmoto, H., and Rye, R. O. (1979). “Sulfur and carbon isotopes,” in Geochemistry of hydrothermal ore deposits. Editor H. L. Barnes (J. Wiley and Sons), 509–567.
Ohmoto, H. (1972). Systematics of sulfur and carbon isotopes in hydrothermal ore deposits. Econ. Geol. 67, 551–578. doi:10.2113/gsecongeo.67.5.551
Pašava, J., Vymazalová, A., Košler, J., Koneev, R. I., Jukov, A. V., and Khalmatov, R. A. (2010). Platinum-group elements in ores from the kalmakyr porphyry Cu-Au-Mo deposit, Uzbekistan: bulk geochemical and laser ablation ICP-ms data. Min. Dep. 45, 411–418. doi:10.1007/s00126-010-0286-7
Pass, H. E. (2010). Breccia-hosted chemical and mineralogical zonation patterns of the northeast zone, Mt. Polley Cu-Ag-Au alkalic porphyry deposit, British Columbia, Canada. PhD thesis (Hobart, Australia: University of Tasmania).
Pass, H. E., Cooke, D. R., Davidson, G., Maas, R., Dipple, G., Rees, C., et al. (2014). Isotope geochemistry of the northeast zone, Mount Polley alkalic Cu-Au-Ag porphyry deposit, British Columbia: A case for carbonate assimilation. Econ. Geol. 109, 859–890. doi:10.2113/econgeo.109.4.859
Pass, H. E., Danyushevsky, L., Gilbert, S., Cooke, D. R., and Williams, P. J. (2009). “LA-ICP-MS analyses of PGE in pyrite and Cu-sulfides from Mt Polley alkali porphyry Cu-Au deposit, Canada,” in Smart Science for Exploration and Mining: Proc. 10th Bien. SGA Meeting, Townsville, Australia, 17th-20th August 2009, 738–740.
Paton, C., Hellstrom, J., Paul, B., Woodhead, J., and Hergt, J. (2011). Iolite: freeware for the visualisation and processing of mass spectrometric data. Jour. Anal. At. Spect. 26, 2508–2518. doi:10.1039/c1ja10172b
Peltonen, P., Kontinen, A., Huhma, H., and Kuronen, U. (2008). Outokumpu revisited: new mineral deposit model for the mantle peridotite-associated Cu-Co-Zn-Ni-Ag-Au sulphide deposits. Ore Geol. Rev. 33, 559–617. doi:10.1016/j.oregeorev.2007.07.002
Peterson, E. C., and Mavrogenes, J. A. (2014). Linking high-grade gold mineralization to earthquake-induced fault-valve processes in the Porgera gold deposit, Papua New Guinea. Geology 42, 383–386. doi:10.1130/g35286.1
Peterson, J. A. (1993). Maps showing platinum-group element occurrences in the conterminous United States, updated as of 1993. U.S. Geol. Surv. Rep. Misc. Field Studies Map 2270. Reston, VA: U.S. Geological Survey.
Piña, R., Gervilla, F., Barnes, S-J., Ortega, L., and Lunar, R. (2011). Platinum-group elements-bearing pyrite from the Aguablanca Ni-Cu sulphide deposit (SW Spain): A LA-ICP-MS study. Eur. Jour. Mineral. 25, 241–252. doi:10.1127/0935-1221/2013/0025-2290
Piña, R., Gervilla, F., Barnes, S-J., Oberthür, T., and Lunar, R. (2016). Platinum-group element concentrations in pyrite from the main sulfide zone of the great dyke of Zimbabwe. Min. Dep. 51, 853–872. doi:10.1007/s00126-016-0642-3
Plotinskaya, O. Y., Azovskova, O. B., Abramov, S. S., Groznova, E. O., Novoselov, K. A., Seltmann, R., et al. (2018). Precious metals assemblages at the Mikheevskoe porphyry copper deposit (South Urals, Russia) as proxies of epithermal overprinting. Ore Geol. Rev. 94, 239–260. doi:10.1016/j.oregeorev.2018.01.025
Reich, M., Deditius, A., Chryssoulis, S., Li, J. W., Ma, C. Q., Parada, M. A., et al. (2013). Pyrite as a record of hydrothermal fluid evolution in a porphyry copper system: a SIMS/EMPA trace element study. Geochim. Cosmochim. Acta 104, 42–62. doi:10.1016/j.gca.2012.11.006
Reich, M., Kesler, S. E., Utsunomiya, S., Palenik, C. S., Chryssoulis, S. L., and Ewing, R. C. (2005). Solubility of gold in arsenian pyrite. Geochim. Cosmochim. Acta 69, 2781–2796. doi:10.1016/j.gca.2005.01.011
Reich, M., Simon, A. C., Deditius, A., Barra, F., Chryssoulis, S., Lagas, G., et al. (2016). Trace element signature of pyrite from the los colorados iron oxide-apatite (IOA) deposit, Chile: a missing link between andean IOA and iron oxide copper-gold systems? Econ. Geol. 111, 743–761. doi:10.2113/econgeo.111.3.743
Richards, J. P. (2018). A shake-up in the porphyry world? Econ. Geol. 113, 1225–1233. doi:10.5382/econgeo.2018.4589
Richards, J. P., and Kerrich, R. (1993). The Porgera gold mine, Papua New Guinea; magmatic hydrothermal to epithermal evolution of an alkalic-type precious metal deposit. Econ. Geol. 88, 1017–1052. doi:10.2113/gsecongeo.88.5.1017
Riciputi, L. R., Paterson, B. A., and Ripperdan, R. L. (1998). Measurement of light stable isotope ratios by SIMS:. Int. Jour. Mass Spect. 178, 81–112. doi:10.1016/s1387-3806(98)14088-5
Rickard, D., and Luther, G. W. (2007). Chemistry of iron sulfides. Chem. Rev. 107, 514–562. doi:10.1021/cr0503658
Roback, R. C., Sevigny, J. H., and Walker, N. W. (1994). Tectonic setting of the Slide Mountain terrane, southern British Columbia. Tectonics 13, 1242–1258. doi:10.1029/94tc01032
Robb, S. J., Boucher, B. M., Hanley, J. J., and Mungall, J. E. (2023). Platinum-group elements (PGE) in the new Afton alkalic Cu-Au porphyry deposit, Canadian Cordillera, II: PGE distribution and models for the hydrothermal coprecipitation of Co-Ni-Pd-Pt in pyrite. Front. Earth Sci. 11, 819109. doi:10.3389/feart.2023.819109
Román, N., Reich, M., Leisen, M., Morata, D., Barra, F., and Deditius, A. P. (2019). Geochemical and micro-textural fingerprints of boiling in pyrite. Geochim. Cosmochim. Acta 246, 60–85. doi:10.1016/j.gca.2018.11.034
Ross, K. V. (1993). “Geology of the ajax east and ajax west, silica-saturated alkalic copper-gold porphyry deposits, Kamloops, south-central British Columbia,”. Master’s thesis (Vancouver, BC: The University of British Columbia).
Rublee, V. J. (1994). “Chemical petrology, mineralogy and structure of the Tulameen complex, Princeton area, British Columbia,”. Master’s thesis (Ottawa, ON: University of Ottawa).
Rye, R. O. (2005). A review of the stable-isotope geochemistry of sulfate minerals in selected igneous environments and related hydrothermal systems. Chem. Geol. 215, 5–36. doi:10.1016/j.chemgeo.2004.06.034
Rye, R. O. (1993). The evolution of magmatic fluids in the epithermal environment; the stable isotope perspective. Econ. Geol. 88, 733–752. doi:10.2113/gsecongeo.88.3.733
Sakai, H., Des Marais, D. J., Ueda, A., and Moore, J. G. (1984). Concentrations and isotope ratios of carbon, nitrogen and sulfur in ocean-floor basalts. Geochim. Cosmochim. Acta 48, 2433–2441. doi:10.1016/0016-7037(84)90295-3
Savard, D., Bouchard-Boivin, B., Barnes, S-J., and Garbe-Schoenberg, D. (2018). “UQAC-FeS: a new series of base metal sulfide quality control reference material for LA-ICP-MS analysis,” in Proc. 10th Int. Conf. Anal. Geol. Env. Mat., Sydney, Australia, 8–13.
Scaillet, B., and Pichavant, M. (2003). Experimental constraints on volatile abundances in arc magmas and their implications for degassing processes. Volc. Degassing 213, 23–52. doi:10.1144/gsl.sp.2003.213.01.03
Schroeter, T. G. (1995). Porphyry deposits of the northwestern Cordillera of north America. Can. Inst. Min. Metall. Petrol. Spec. 46, 888.
Seal, R. R. (2006). Sulfur isotope geochemistry of sulfide minerals. Rev. Mineral. Geochem. 61, 633–677. doi:10.2138/rmg.2006.61.12
Sedge, C., Hanley, J., Zajacz, Z., Tsay, A., Fayek, M., and Sharpe, R. (2017). Fluid inclusion characteristics of hydrothermal platinum group element remobilization in an alkalic Cu-Pd-Au porphyry deposit, Afton, British Columbia, Canada (abstract ID S3.P33). Eur. Curr. Res. Fluid Inclusions Biennial Meeting.
Smith, R. B. (1979). “Geology of the harper Ranch group (carboniferous to permian) and Nicola group (upper triassic) northeast of Kamloops, British Columbia,”. M.Sc. thesis (Vancouver, British Columbia: University of British Columbia).
Snyder, L. D. (1994). “Petrological studies within the Iron Mask batholith, south central British Columbia,”. M.Sc. thesis (Vancouver, British Columbia: University of British Columbia).
Snyder, L. D., and Russell, J. K. (1993). Field constraints on diverse igneous processes in the Iron Mask batholith. B. C. Geol. Surv. Geol. Fieldwork, 281–286.
Sotnikov, V. I., Berzina, A. N., Economou-Eliopoulos, M., and Eliopoulos, D. G. (2001). Palladium, platinum and gold distribution in porphyry Cu±Mo deposits of Russia and Mongolia. Ore Geol. Rev. 18, 95–111. doi:10.1016/s0169-1368(01)00018-x
Steadman, J. A., and Large, R. R. (2016). Synsedimentary, diagenetic, and metamorphic pyrite, pyrrhotite, and marcasite at the Homestay BIF-hosted gold deposit, South Dakota, USA: insights on Au-As ore Genesis from textural and LA-ICP-MS trace element studies. Econ. Geol. 111, 1731–1752. doi:10.2113/econgeo.111.7.1731
Stanley, C. R., Lang, J. R., and Snyder, L. D. (1994). Geology and mineralization in the northern part of the iron Mask batholith, Kamloops, British Columbia. B. C. Geol. Surv. Geol. Fieldwork, 269–274.
Steadman, J. A., Large, R. R., Olin, P., Danyushevsky, L. V., Meffre, S., Huston, D., et al. (2020). Pyrite trace element behavior in magmatic-hydrothermal environments: an LA-ICPMS imaging study. Ore Geol. Rev. 128, 103878. doi:10.1016/j.oregeorev.2020.103878
Strashimirov, S., Petrunov, R., and Kanazirski, M. (2002). Porphyry-copper mineralisation in the central Srednogorie zone, Bulgaria. Min. Dep. 37, 587–598. doi:10.1007/s00126-002-0275-6
Sykora, S., Cooke, D. R., Meffre, S., Stephanov, A. S., Gardner, K., Scott, R., et al. (2018). Evolution of pyrite trace element compositions from porphyry-style and epithermal conditions at the Lihir gold deposit: implications for ore Genesis and mineral processing. Econ. Geol. 113, 193–208. doi:10.5382/econgeo.2018.4548
Sylvester, P. J., Cabri, L. J., Tubrett, M. N., McMahon, G., Laflamme, J. H. G., and Peregoedova, A. (2005). Synthesis and evaluation of a fused pyrrhotite standard reference material for platinum group element and gold analysis by laser ablation-ICPMS. Proc. 10th Int. Plat. Symp., 16–20.
Tanner, D., Henley, R. W., Mavrogenes, J. A., and Holden, P. (2016). Sulfur isotope and trace element systematics of zoned pyrite crystals from the El Indio Au–Cu–Ag deposit, Chile. Contrib. Mineral. Petrol. 171, 33. doi:10.1007/s00410-016-1248-6
Tardani, D., Reich, M., Deditius, A. P., Chryssoulis, S., Sánchez-Alfaro, P., Wrage, J., et al. (2017). Copper–arsenic decoupling in an active geothermal system: a link between pyrite and fluid composition. Geochim. Cosmochim. Acta 204, 179–204. doi:10.1016/j.gca.2017.01.044
Tarkian, M., Hünken, U., Tokmakchieva, M., and Bogdanov, K. (2003). Precious-metal distribution and fluid-inclusion petrography of the Elatsite porphyry copper deposit, Bulgaria. Min. Dep. 38, 261–281. doi:10.1007/s00126-002-0336-x
Tarkian, M., and Koopmann, G. (1995). Platinum-group minerals in the santo tomas II (philex) porphyry copper-gold deposit, luzon island, Philippines. Min. Dep. 30, 39–47. doi:10.1007/bf00208875
Tarkian, M., and Stribrny, B. (1999). Platingruppen-elemente in porphyrischen kupfer Lagerstätten: Eine Überblicksstudie. Mineral. Petrol. 65, 161–183. doi:10.1007/bf01161959
Thode, H. G., Monster, J., and Dunford, H. B. (1961). Sulphur isotope geochemistry. Geochim. Cosmochim. Acta 25 (3), 159–174. doi:10.1016/0016-7037(61)90074-6
Thompson, J. F. H., Lang, J. R., and Stanley, C. R. (2002). “Platinum group elements in alkaline porphyry deposits, British Columbia,” in Exploration and mining in British Columbia – 2001 (Victoria, BC: BC Min. Energy and Mines), 57–64.
Ueda, A., and Sakai, H. (1984). Sulfur isotope study of Quaternary volcanic rocks from the Japanese Islands Arc. Geochim. Cosmochim. Acta 48, 1837–1848. doi:10.1016/0016-7037(84)90037-1
von Quadt, A. V., Peytcheva, I., Fanger, L., and Heinrich, C. (2005). 3-1: the Elatsite porphyry Cu–Au deposit, Bulgaria. Ore Geol. Revi. 27, 128–129. doi:10.1016/j.oregeorev.2005.07.022
Wang, M., Gutzmer, J., Michalak, P. P., Guo, X., Xiao, F., Wang, W., et al. (2014). PGE geochemistry of the fengshan porphyry-skarn Cu-Mo deposit, hubei province, eastern China. Ore Geol. Rev. 56, 1–12. doi:10.1016/j.oregeorev.2013.07.006
Warren, M. R. (2010). “The origin and distribution of platinum-group metals in the Mt. Milligan alkalic Cu-Au porphyry deposit, B.C., Canada,”. Unpublished Bachelor’s thesis (Halifax, NS: Saint Mary's University).
Weatherley, D. K., and Henley, R. W. (2013). Flash vaporization during earthquakes evidenced by gold deposits. Nat. Geosci. 6, 294–298. doi:10.1038/ngeo1759
Weis, P., Driesner, T., and Heinrich, C. A. (2012). Porphyry-copper ore shells form at stable pressure-temperature fronts within dynamic fluid plumes. Science 338, 1613–1616. doi:10.1126/science.1225009
Wilson, A. J., Cooke, D. R., Harper, B. J., and Deyell, C. L. (2007). Sulfur isotopic zonation in the cadia district, southeastern Australia: exploration significance and implications for the Genesis of alkalic porphyry gold–copper deposits. Min. Dep. 42, 465–487. doi:10.1007/s00126-006-0071-9
Keywords: porphyry, hydrothermal, LA-ICP-MS, SIMS, platinum-group elements, PGE, New Afton
Citation: Boucher BM, Robb SJ, Hanley JJ, Kerr MJ and Mungall JE (2023) Platinum-group elements (PGE) in the New Afton alkalic Cu-Au porphyry deposit, Canadian Cordillera, I: relationships between PGE, accessory metals and sulfur isotopes in pyrite. Front. Earth Sci. 11:819129. doi: 10.3389/feart.2023.819129
Received: 20 November 2021; Accepted: 27 June 2023;
Published: 29 August 2023.
Edited by:
Massimo Chiaradia, University of Geneva, SwitzerlandReviewed by:
Maria Economou-Eliopoulos, National and Kapodistrian University of Athens, GreeceCopyright © 2023 Boucher, Robb, Hanley, Kerr and Mungall. This is an open-access article distributed under the terms of the Creative Commons Attribution License (CC BY). The use, distribution or reproduction in other forums is permitted, provided the original author(s) and the copyright owner(s) are credited and that the original publication in this journal is cited, in accordance with accepted academic practice. No use, distribution or reproduction is permitted which does not comply with these terms.
*Correspondence: Jacob J. Hanley, amFjb2IuaGFubGV5QHNtdS5jYQ==
Disclaimer: All claims expressed in this article are solely those of the authors and do not necessarily represent those of their affiliated organizations, or those of the publisher, the editors and the reviewers. Any product that may be evaluated in this article or claim that may be made by its manufacturer is not guaranteed or endorsed by the publisher.
Research integrity at Frontiers
Learn more about the work of our research integrity team to safeguard the quality of each article we publish.