 Qing Li
 Yun Liu1
 Meihong Ma
94% of researchers rate our articles as excellent or good
Learn more about the work of our research integrity team to safeguard the quality of each article we publish.
Find out more
ORIGINAL RESEARCH article
Front. Earth Sci., 16 January 2024
Sec. Geohazards and Georisks
Volume 11 - 2023 | https://doi.org/10.3389/feart.2023.1358987
This article is part of the Research TopicMonitoring, Early Warning and Mitigation of Natural and Engineered Slopes, volume IIIView all 17 articles
The North China plain (NCP) is an important production base for winter wheat and summer maize in China. Severe droughts seriously restrict agricultural production in this region, threatening food security. Based on the standardized precipitation evapotranspiration index (SPEI), this study explored the spatial and temporal drought characteristics during the winter wheat and summer maize growing seasons in the region. The study found that: 1) From 1980 to 2013, the drought trend of the winter wheat growing season in the NCP has intensified, with Huang-Huai Plain agricultural area (HH_P) showing the most significant drought trend. However, the summer maize growing season has become wetter, with the Shandong hilly agricultural and forestry area (SD_Q) showing the most significant wetting trend. 2) After the year 2003, the results from Mann-Kendall trend analysis revealed that the drought trend of HH_P during the winter wheat growing season became particularly pronounced, but the wetting trend of SD_Q and HH_P during the summer maize growing season became more evident. 3) The dominant spatial patterns observed in the NCP during the growing seasons of winter wheat and summer maize were marked by a consistent distribution of drought and wetness conditions. For winter wheat, the southern regions of the foothill plain area of Yanshan and Taihang Mountains (YT_P) and the low-lying plain area of Hebei, Shandong, and Henan (JLY_P) were more sensitive to the changes of drought and wet conditions. For summer maize, SD_Q was more sensitive to the changes of the drought and wet conditions. The results of this study could provide references for the formulation of drought relief strategies of winter wheat and summer maize in the NCP.
The North China Plain (NCP) is a key area for grain production in China. Approximately 50% of the country’s total winter wheat planting area and yield come from this region (Liu et al., 2006), while the maize planting area in the region accounts for 30% in China, with a yield comprising around 50% of China (Sun et al., 2009). Drought poses a significant threat to the food security of the area, being the primary meteorological disaster affecting agricultural production. With the backdrop of global climate change, the NCP has experienced a substantial rise in average temperature over the past 50 years, leading to intensified drought (Zhang et al., 2015). Furthermore, drought in this region shows clear cyclic variations and regional differences (Hu, 2014; Li et al., 2023). Studies have shown that droughts, heat waves, and floods can have compound effects (Carvalho and Spataru, 2023). Under extreme climate change, sudden changes between droughts and floods can have lasting and profound effects on soil fertility by altering comprehensive conditions such as water, soil, and temperature, exacerbating threats to food security (Bai et al., 2023). Underground coal mining can cause continuous and long-term surface deformation, triggering landslides, and may also pose a threat to grain-producing areas (Ma et al., 2022).
Fan assessed the impact of El Niño and La Niña phenomena on meteorological drought in the Weihe River Basin in China from 1970 to 2020. They found that on a scale of 3–6 months, attention should be paid to the drought disasters in the summer of the following year caused by La Niña, but the impact of El Niño on the 12-month scale of drought in China cannot be ignored (Fan et al., 2023). Drought is typically classified into meteorological drought, hydrological drought, agricultural drought and socio-economic drought (Jiang et al., 2019). Simultaneous occurrences of multiple droughts can significantly impact the economic development, particularly causing substantial losses in food production. Research on drought in the context of winter wheat and summer corn primarily includes the evolution of drought, drought prediction, spatiotemporal analysis of drought changes, and the drought influences on agricultural production. Some studies have also explored the drought spatiotemporal changes of winter wheat and summer maize from the perspective of solar radiation values (Zheng et al., 2022).
Based on different data sources, the drought indices can be divided into remote sensing-based indices such as Temperature Condition Index (TCI), Vegetation Condition Index (VCI), and Vegetation Health Index (VHI), and meteorological data-based indices such as Standardized Precipitation Index (SPI), Palmer Drought Severity Index (PDSI) and Standardized Precipitation Evapotranspiration Index (SPEI) (Vicente-Serrano and Sergio, 2013). The PDSI is primarily utilized to calculate short-term drought conditions, estimating soil moisture supply and demand through a two-layer model based on precipitation and temperature. It can provide a comprehensive indicator of the overall water condition. However, the PDSI index is mainly used for calculating short-term drought conditions and has a relatively singular time scale (Vicente-Serrano and Sergio, 2013). SPI can monitor drought at different time scales (Pasho et al., 2011). SPI has been widely used in drought monitoring studies due to its simplicity in calculating and ability to measure drought at different time scales. However, its application has limitations in the context of climate change, as it only considers precipitation conditions. The accumulated precipitation, one of the indicators of drought, is not only related to rainfall but also connected to temperature changes (Zhou et al., 2022). In areas lacking rainfall data, it can be used to predict drought, landslides, and debris flow disasters (Zhou et al., 2022). With the development of remote sensing technology, more and more technologies such as unmanned aerial vehicle detection and Synthetic Aperture Radar Interferometry (InSAR) are being applied in the acquisition of drought indices and land instability analysis (Yang et al., 2021; Liu et al., 2022; Wang et al., 2022).
SPEI combines the advantages of SPI and PDSI, considering the impacts of precipitation and temperature on drought (Vicente-Serrano et al., 2010). It has been widely used in the research for monitoring and assessing the impact of drought (Guo et al., 2017; Cao et al., 2021; Tirivarombo et al., 2018; Wu and Chen, 2019; Yang et al., 2020). The Penman-Monteith (PM) method was used to calculate the national potential evapotranspiration in China from 1961 to 2019. Furthermore, by utilizing the SPEI as a monthly drought indicator, it was determined that there has been an exacerbation of drought in the North China region due to abnormal temperature and wind speed (Wen and Chen, 2023). Therefore, in this study, SPEI was chosen as the drought monitoring index in the NCP. Meteorological data from 50 weather stations in the NCP was selected. And the SPEI could represent the drought conditions during the winter wheat and summer maize growing season were calculated. The study utilized methods such as linear trend analysis, Mann-Kendall trend analysis and Empirical Orthogonal Function (EOF) decomposition to investigate the spatiotemporal characteristics of drought during the winter wheat and summer maize growing seasons in the NCP over the past 33 years. The aim of this study is to provide references for the formulation of drought relief strategies of winter wheat and summer maize in the NCP.
The North China Plain (NCP) (32°N ∼ 40°N, 114°E ∼ 121°E) is located in the northern part of China, including all or part of seven provinces (municipalities) including Hebei, Henan, Shandong, Jiangsu, Anhui, Beijing, and Tianjin. This region belongs to the Huang-Huai-Hai agricultural region in the comprehensive agricultural zoning of China, including four secondary agricultural regions: the Huang-Huai Plain agricultural area (HH_P), the Shandong hilly agricultural and forestry area (SD_Q), the low-lying plain area of Hebei, Shandong, and Henan (JLY_P), and the foothill plain area of Yanshan and Taihang Mountains (YT_P). It is an important grain production base in China (Figure 1). Winter wheat and summer maize are the main grain crops in this region. The North China Plain is located in the East Asian monsoon climate zone, with uneven spatial and temporal distribution of precipitation. Drought is one of the main factors restricting the growth of winter wheat and summer maize in this region. The meteorological data used in this study are from 50 meteorological stations in North China from 1980 to 2013, obtained from the China Meteorological Data Sharing Service Network.
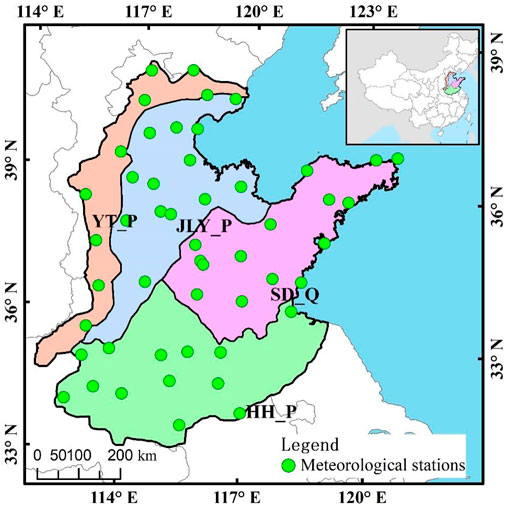
FIGURE 1. Spatial distribution of meteorological stations in the study area.
As shown in Figure 2. By inputting temperature and precipitation data, standardized evapotranspiration index (ETI) can be obtained. The Mann-Kendall test method is used to assess climate and hydrological change trends, while empirical orthogonal function (EOF) analysis is employed to identify abrupt changes and three spatial-temporal distribution patterns.
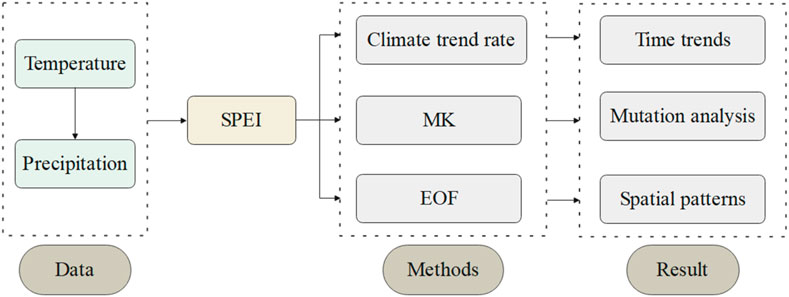
FIGURE 2. Research methodology flowchart.
SPEI considers the impact of precipitation, temperature changes, and potential surface evapotranspiration on drought. It can identify the occurrence or end of drought and reflect its actual severity. Here’s how it is calculated:
1) This study involves retrieving daily weather data from the selected ground meteorological station and organizing it into monthly climate data. Then, the monthly potential evaporation (Pe) is calculated based on the monthly average temperature recorded at the station. The specific calculation formula is as follows:
where Eqs 1–3,
where Eq. 4, NDM is the total number of days in that month, N is the possible sunshine hours, calculated using Eq. 5:
Where
Where
Where J is the average day number of that month, ranging from 1 to 365 or 366, with 1st January being day 1.
2) Construct the cumulative water deficit X for different time scales. Calculated using Eq. 8:
Where
Then, calculate the water deficit
3) Calculate the probability distribution of the cumulative water deficit X
Below introduce the probability density function of the three-parameter log-logistic distribution as shown in Eq. 11:
Where
where Eqs 12, 14,
Finally, standardize the probability distributions for each month.
Order
Order
where Eq. 17,
The SPEI-based drought classification is given in Table 1.
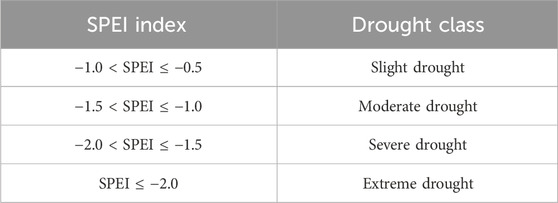
TABLE 1. Drought classes based on SPEI.
Using the least squares method to calculate the regression coefficient between the sample and time, the change in meteorological elements can be represented by a linear Eq. 18:
The climate trend rate is 10a.
The M-K test method is a non-parametric statistical test method. It can not only detect changes in the trend of the sequence but also find mutation points in the sequence. It does not require the sample to follow a certain distribution and is not affected by a few exceptional values. It is suitable for the analysis of type variables and ordinal variables. The calculation process of MK is as follows (Sharma and Goyal, 2020; Alsubih et al., 2021):
For a time series X with a sample size of n, we construct a rank sequence in Eq. 19:
Where
It can be seen that the rank sequence
Assuming random and independent time series, we define the statistic in Eq. 20:
Where
Where
The above process in reverse order of the time series X,
Analyze and plot the
The EOF decomposition was proposed by Pearson in 1902. In the mid-1950s, Lorenz introduced it into the study of atmospheric science (Lorenz and Hartmann, 2003). The advantage of EOF decomposition is that it can decompose meteorological elements into spatial functions that do not change with time (eigenvalues) and time functions that are independent of space. The spatial function part is determined by the main characteristics of the meteorological element field. The convergence speed of EOF decomposition is fast, so as long as a few eigenvectors with large eigenvalues are taken, the spatial characteristics of the climate element field can be fully described. EOF decomposition is to decompose the three-dimensional climate variables into orthogonal spatial typical fields and the corresponding time series, which can represent the main spatial distribution structure of meteorological elements.
The observed data of a certain climate variable field is given in matrix form:
In Eq. 22, m represents spatial points,n represents time points, and
The above matrix is decomposed into two parts Eq. 23:
The spatial function V and the time function T, where V and T are referred to as the spatial function matrix and the time function matrix, respectively. Each column of V represents a spatial typical field, which is only related to space. According to orthogonality, the spatial typical field and the time weighting coefficient should satisfy the following Eq. 24:
According to the theorem of real symmetric decomposition, we have Eq. 25:
where Λ is a diagonal matrix composed of the eigenvalues of the matrix. According to the properties of eigenvectors, (U^TU=I). Therefore, the spatial function matrix can be obtained from the eigenvectors of Λ. After obtaining V, the time function matrix T can be obtained. Λ is a diagonal matrix, and the diagonal elements are the eigenvalues of the matrix. Arrange the eigenvalues in descending order as shown in Eq. 26:
Calculate the variance contribution of each eigenvalue and the cumulative variance contribution of the first
Between 1981 and 2013, the growth season of winter wheat in the Huang-Huai-Hai Plain area of North China showed an increasing trend of drought, with a decrease rate of SPEI at 0.4/10a (p < 0.05). In contrast, the growing season of summer maize in this region overall exhibited a trend towards wetter conditions, with an SPEI growth rate of 0.1/10a (Figure 3A). The changes in SPEI for the crop growing season in the low-lying plains of Hebei, Shandong, and Henan provinces were not significant overall, indicating no significant change in the dryness or wetness conditions during the crop growing season over the past 33 years (Figure 3B). The growing season of summer maize in the hilly and forested area of Shandong showed a trend towards wetter conditions, with a growth rate of approximately 0.27/10a. However, the winter wheat growing season in this region exhibited a slightly drier trend at 0.066/10a (Figure 3C). The foothill plains of the Yanshan and Taihang Mountains showed a trend towards drier conditions for both the winter wheat and summer maize growing seasons, with the summer maize season showing a more pronounced trend towards dryness at 0.158/10a compared to the winter wheat season at 0.072/10a (Figure 3D).
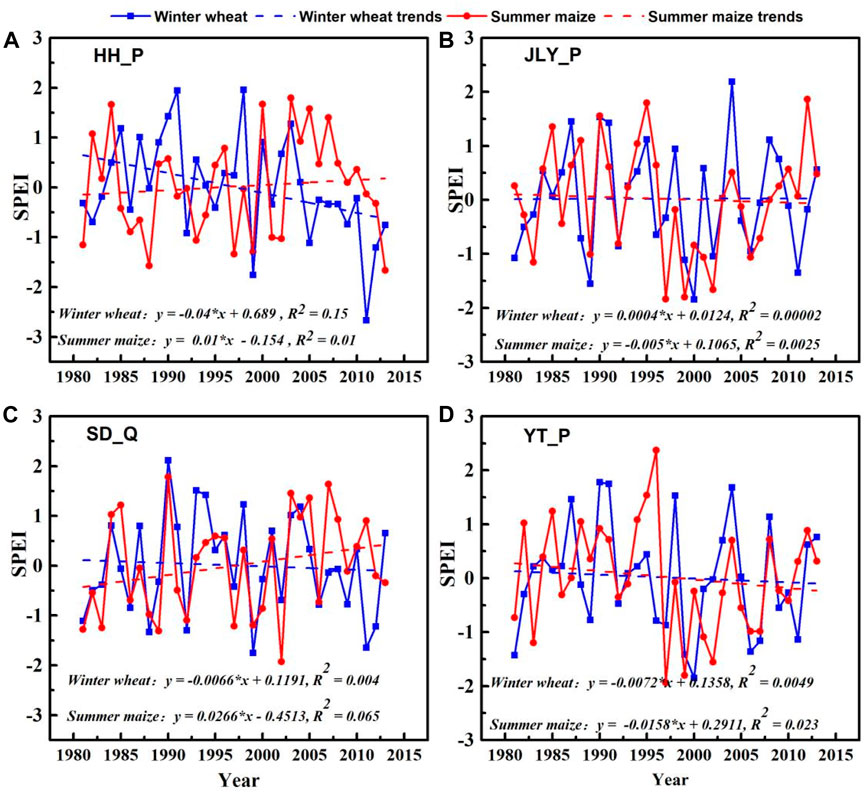
FIGURE 3. Drought trends during the winter wheat and summer maize growing seasons in different agricultural areas of the North China Plain from 1981 to 2013.
By using climate trend analysis methods to analyze the changes in SPEI at 50 stations in the North China region from 1981 to 2013, it can be observed that during the past 33 years, most stations in North China showed a trend towards drier conditions during the winter wheat growing season, particularly pronounced in the Huang-Huai-Hai Plain area. Only some stations in the northern part of the North China Plain showed a certain trend towards wetter conditions, mainly distributed in the northern parts of the low-lying plains of Hebei, Shandong, and Henan provinces, and the northern foothill plains of the Yanshan and Taihang Mountains (Figure 4). As for the summer maize growing season, apart from some stations in the northern part of North China showing a more pronounced trend towards dryness, most areas in the North China region exhibited a trend towards wetter conditions during the summer maize growing season (Figure 5).
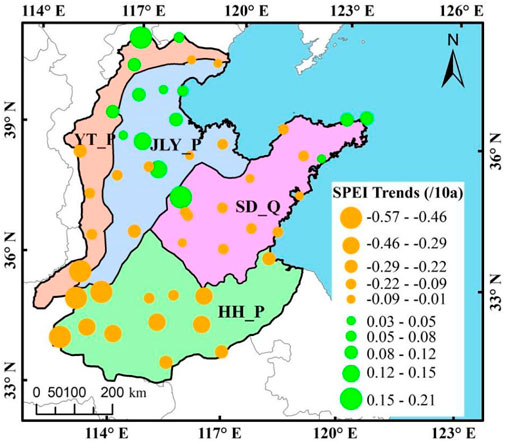
FIGURE 4. SPEI variation trends during the winter wheat growing season in different stations of the North China Plain from 1981 to 2013.
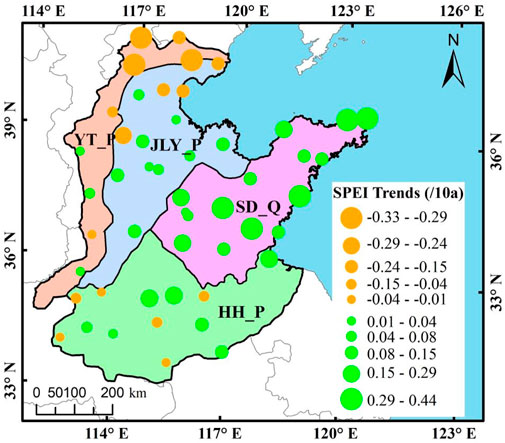
FIGURE 5. SPEI variation trends during the summer maize growing season in different stations of the North China Plain from 1981 to 2013.
Overall, in the past 30 years, the winter wheat growing season in North China has shown a trend towards drier conditions, while the summer maize growing season has shown a trend towards wetter conditions. This dry-wet trend, in terms of spatial distribution, has manifested as a worsening drought trend at most stations for winter wheat, with a few stations in the north showing a trend towards wetter conditions, such as in cities like Bazhou, Miyun, and Botou (Figure 4). As for summer maize, it has shown a trend towards wetter conditions at most stations, with a few stations in the north exhibiting a trend towards dryness, such as in cities like Miyun, Beijing, and Tangshan (Figure 5).
The Mann-Kendall method was employed to analyze the variation trends and change patterns of SPEI during the winter wheat and summer maize growing seasons in four secondary agricultural regions in North China. In Figure 6, UF represents the statistics for the upward sequences, while UB represents the statistics for the downward sequences.
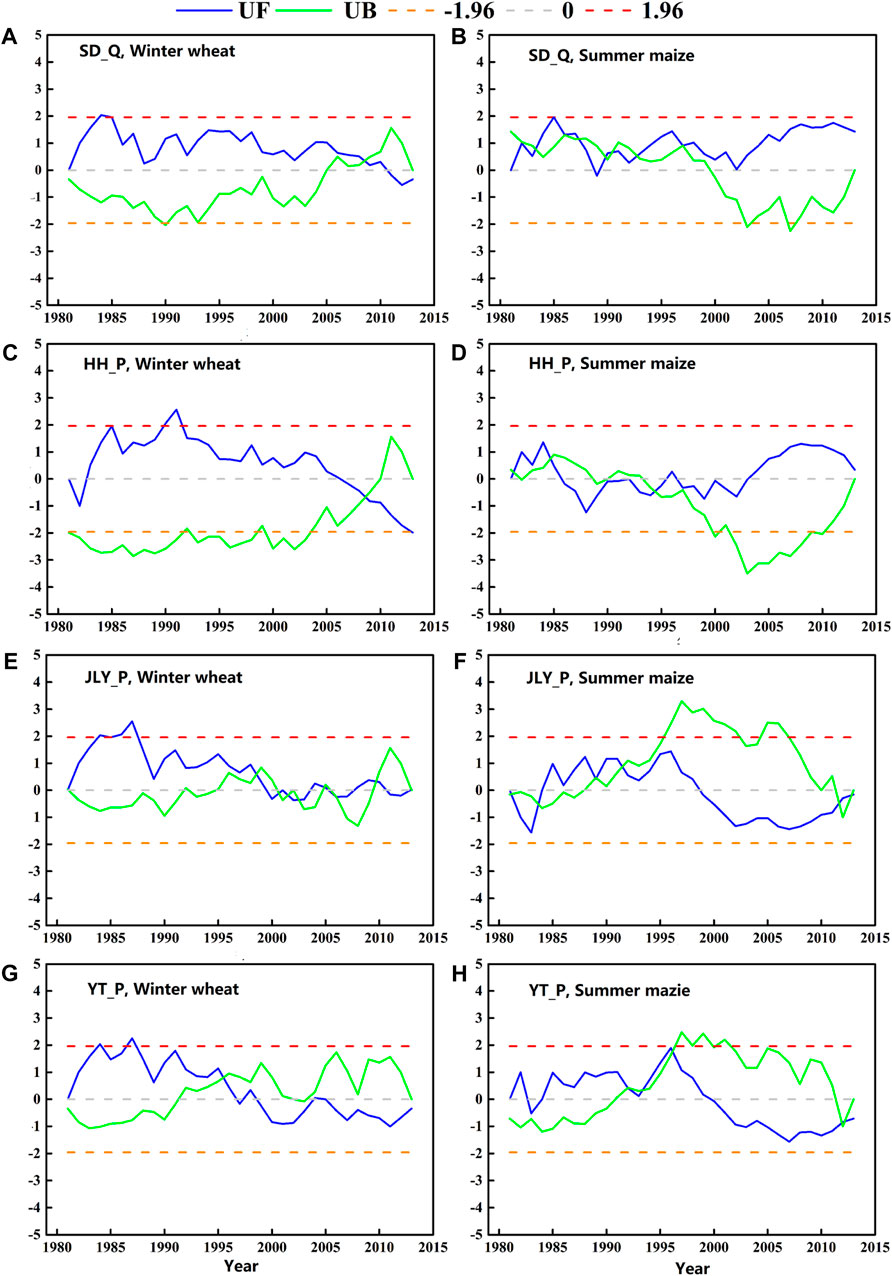
FIGURE 6. Mann-Kendall test figures for winter wheat and summer maize growing seasons in different agricultural areas of North China from 1981 to 2013.
In the four secondary agricultural regions of North China, the UF curve of the winter wheat growing season showed an upward trend in the early and mid-1980s, but it exhibited a downward trend after the mid-1980s (Figures 6A, C, E, G). After the mid-1980s, the winter wheat growing season showed a trend towards drier conditions. In the hilly and forested area of Shandong, the UF curve showed a gentle decline after the mid-1980s, suggesting that the trend towards drier conditions was not significant (Figure 6A); in the Huang-Huai Plain area, the UF curve showed a noticeable decline around 2003, indicating an intensified trend towards drier conditions after 2003 (Figure 6C); in the low-lying plains of Hebei, Shandong, and Henan, and the foothill plains of the Yanshan and Taihang Mountains, the UF curve showed a more stable trend after 1998, suggesting relatively unchanged drought conditions in these areas (Figures 6E, G).
In the four major agricultural regions of North China, the UF curve of the summer maize growing season exhibited spatial differences. The UF curve trends in the hilly and forested area of Shandong and the Huang-Huai Plain area were similar (Figures 6B, D). In these two regions, the UF curve changes were relatively stable from around 1980 to 2003, indicating no significant change in drought conditions during this period. After 2003, the UF curves of these two regions showed an upward trend, suggesting a gradual trend towards wetter conditions during the summer maize growing season. In the low-lying plains of Hebei, Shandong, and Henan, and the foothill plains of the Yanshan and Taihang Mountains, the UF curve trends were similar (Figures 6F, H). Before 1997, the UF curve showed some fluctuation trends, but after 1997, the UF curves in both of the mentioned areas exhibited a clear downward trend, indicating that these areas showed a more pronounced drying trend during the summer maize growing season after 1997.
In order to further analyze the spatiotemporal distribution characteristics of drought during the winter wheat and summer maize growing seasons in North China over the past 30 years, the SPEI for the winter wheat and summer maize growing seasons were separately subjected to EOF decomposition. Through EOF decomposition, mutually orthogonal characteristic vectors can be obtained, which can represent independent drought spatial distribution types in North China. The magnitude of the variance contribution rate after EOF decomposition characterizes the typicality of the corresponding mode’s drought spatial distribution form. The larger the variance contribution rate, the more typical the corresponding drought distribution form. The maximum center of each mode is the sensitive center of drought variation. The temporal coefficient can be used as a weight of the spatial coefficient to reflect the contribution rate of a certain year to this drought spatial distribution. The larger the absolute value of the temporary coefficient, the more typical the distribution form of that year.
Based on the magnitude of the variance contribution rate, the first 3 characteristic vectors of the SPEI for the winter wheat and summer maize growing seasons were selected. Table 2 respectively list the variance contribution rates corresponding to the first 3 characteristic vectors of winter wheat and summer maize. It can be seen that the variance contribution rate of the first mode for both crops is much larger than that of the second and third modes, indicating that, whether for winter wheat or summer maize, the first mode corresponds to the main drought spatial distribution type in North China. Below discusses the spatial distribution and temporal coefficients for different modes:
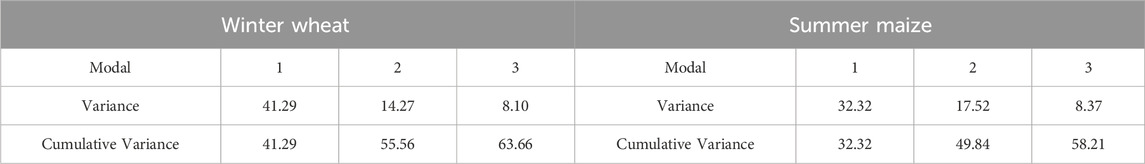
TABLE 2. Variance contribution rates of the first 3 modes of EOF decomposition of the SPEI index for the winter wheat and the summer maize growing season in the NCP (%).
The variance contribution rate of the spatial coefficient characteristic vectors of the first mode for the winter wheat and summer maize growing seasons is significantly higher than that of the second and third modes (Table 2), indicating that the spatial distribution type of the first mode is the main spatial distribution type in North China. From Figure 7, it can be seen that the spatial coefficients corresponding to the first mode of the growing seasons for both crops are positive, indicating a good spatial consistency in the drought distribution in North China during the growing seasons of the two crops. For winter wheat, the high-value area of the first mode is mainly distributed in the southern part of the Yanshan and Taihang mountain foothill plains and the low-lying plains of the Hebei, Shandong, and Henan regions, including areas such as Xingtai, Anyang, and Chaoyang. For summer maize, the high-value area of the first mode is mainly distributed in the hilly agricultural and forestry areas of Shandong and the plains of the Huang-Huai region, including areas such as Shangqiu, Dangshan, and Ganyu, indicating that the variability of drought occurrence is more significant and their response to dryness and wetness is more sensitive (Figures 7A, C).
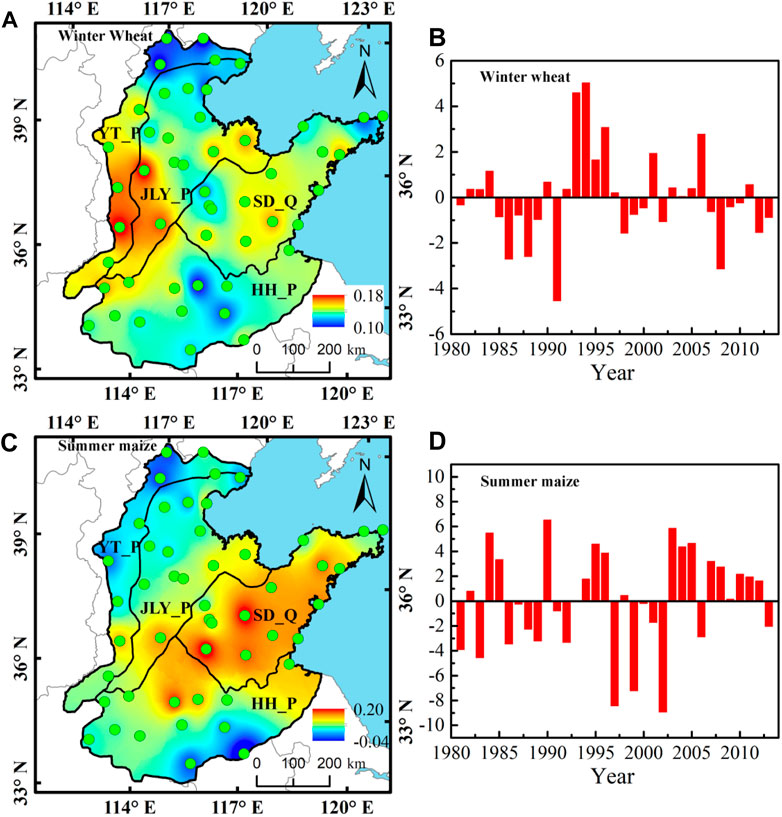
FIGURE 7. Spatial distribution and temporal coefficient changes of the first mode for winter wheat and summer maize growing seasons in the NCP.
Since the spatial coefficients corresponding to the first mode of the growing seasons for winter wheat and summer maize are both greater than 0 (Figure 7), the positive or negative situation of the temporal coefficients corresponding to the first mode reflects the overall dryness and wetness conditions in North China for that year. The temporal coefficients corresponding to the first mode of the winter wheat growing season show an overall trend of first increasing and then decreasing. Specifically, between 1981 and 1991, the temporal coefficients of the first mode for winter wheat show an overall increasing trend, and after 1991, they show an overall decreasing trend, indicating that the main drought spatial distribution type in North China during the winter wheat growing season over the past 34 years has undergone an evolution from wet to dry (Figure 7B). For summer maize, before 2000, its temporal coefficients alternated between positive and negative without a clear trend, indicating that from 1981 to 2000, the overall dryness and wetness conditions during the summer maize growing season in North China did not change significantly. After 2000, there were significantly more years with positive temporal coefficients than with negative ones for the winter wheat growing season in North China, showing an overall increasing trend, indicating that after 2000, the summer maize growing season in North China has shown a trend towards wetter conditions (Figure 7D).
Both winter wheat and summer maize show significant north-south differences in the spatial distribution of the second mode’s SPEI EOF during their growing seasons. Specifically, for the winter wheat growing season, the spatial coefficients of the SPEI EOF exhibit a positive trend in the north and a negative trend in the south (Figure 8A), while for summer maize, it is the opposite, with a negative trend in the north and a positive trend in the south (Figure 8C). This indicates that the second dominant dry-wet spatial distribution pattern during the growing seasons of winter wheat and summer maize in North China exhibits a contrasting spatial pattern from north to south.
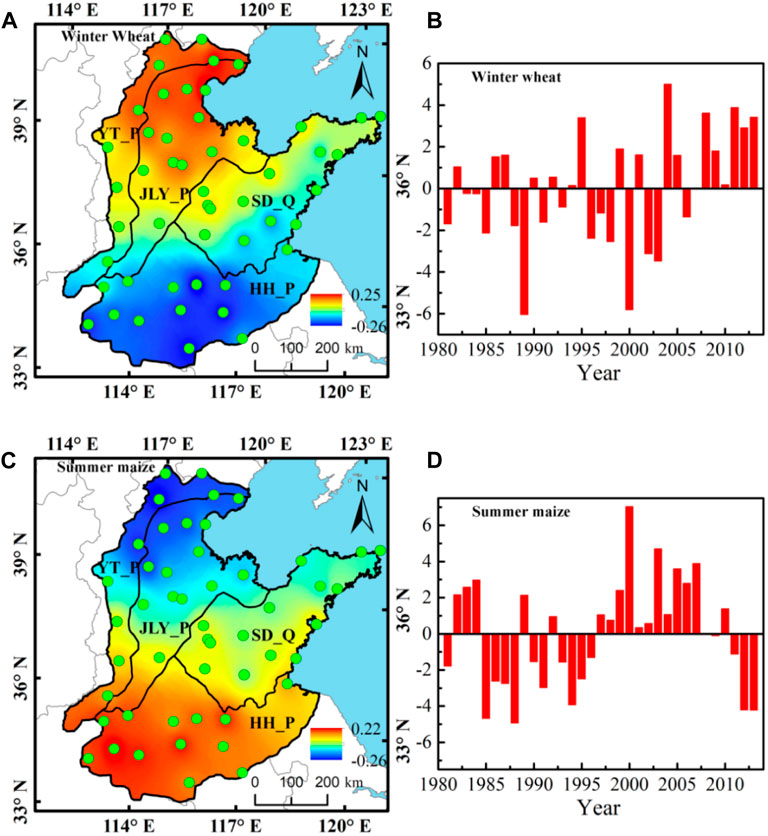
FIGURE 8. Spatial distribution and temporal coefficient changes of the second mode for winter wheat and summer maize growing seasons in the NCP.
After 2000, there is a significant increase in the number of years with positive temporal coefficients corresponding to the second mode of the winter wheat growing season, indicating that the northern drought during the winter wheat growing season in North China has eased, while the southern drought has intensified (Figure 8B). For summer maize, after 2000, the temporal coefficients corresponding to the second mode show a decreasing trend, indicating that the northern drought during the summer maize growing season in North China is gradually worsening, while the southern drought is gradually easing. In particular, 2012 and 2013 are typical years of northern drought and southern wetness (Figure 8D).
The variance contribution rates of the third mode of the SPEI EOF decomposition for the growing seasons of winter wheat and summer maize are 8.10% and 8.37% respectively (Table 2), to some extent reflecting the drought spatiotemporal distribution characteristics of the two crops’ growing seasons in North China. From the spatial distribution maps of the third mode’s spatial coefficients for the two crops (Figures 9A, C), it can be observed that for both the winter wheat and summer maize growing seasons’ SPEI EOF decomposition, the high-value areas of the third mode are concentrated in the Shandong Peninsula. The difference lies in the fact that for winter wheat, the hilly agricultural and forestry areas of Shandong near Taian and Jinan are also significant high-value areas. Overall, for winter wheat, the third mode exhibits a drought spatial distribution pattern of three northeast-southwest-oriented bands, with the middle band’s spatial coefficient higher than the two outer bands, and the northern band having the smallest spatial coefficient. For summer maize, the spatial coefficients of the third mode exhibit a decreasing trend from the eastern coastal areas to the western areas.
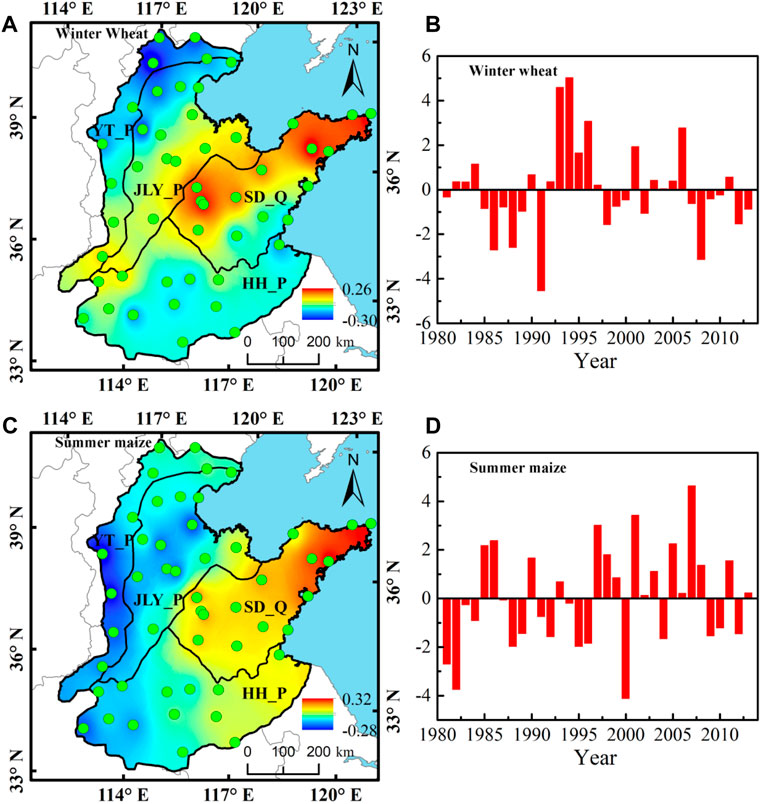
FIGURE 9. Spatial distribution and temporal coefficient changes of the third mode for winter wheat and summer maize growing seasons in the NCP.
The temporal coefficients of the third mode during the winter wheat growing season show an overall trend of first increasing and then decreasing (Figure 9B). In 1986, 1988, 1991, and 2008, the winter wheat growing season in North China exhibited significant dryness in the middle and wetness on the sides; in 1993, 1994, and 2006, it exhibited a spatial distribution pattern of wetness in the middle and dryness on the sides. The temporal coefficients corresponding to the third mode of the summer maize growing season show an overall increasing trend (Figure 9D), indicating that during the summer maize growing season, the eastern part of North China is becoming wetter, while the western part is becoming drier. 1981, 1982, and 2000 were typical years of western wetness and eastern dryness in North China, while 1985, 1986, 1997, 2001, as well as 2005 and 2007, were relatively typical years of eastern wetness and western dryness.
Based on the SPEI, this study explored the spatiotemporal characteristics of drought during the growing season of the winter wheat and summer maize in the NCP from 1980 to 2013. The main conclusions were as follows:
(1) From 1980 to 2013, except for the northern parts of YT_P and JLY_P, the drought trend during the winter wheat growing season has intensified, with HH_P showing the most significant drought trend. In contrast, the summer maize growing season showed wetting trends generally, with SD_Q showing the most significant wetting trend, only the northern parts of YT_P and JLY_P show a drought trend.
(2) The Mann-Kendall trend analysis results indicate that after the mid-to-late 1980s, the winter wheat growing season in the NCP has shown consistent drought trends, with HH_P showing a particularly pronounced drought trend after 2003. For summer maize, after 2003, the wetting trends in the SD_Q and HH_P was more significant, while the drought trend is evident for JLY_P and YT_P after 1997.
(3) The consistency of the drought-wet spatial distribution is the dominant pattern for the winter wheat and summer maize growing seasons in North China. For winter wheat, the southern parts of YT_P and JLY_P were more sensitive to the changes of drought-wet conditions, while for summer maize, SD_Q were more sensitive to the changes of the drought-wet conditions.
(4) The opposite north-south drought-wet spatial distribution pattern was the second dominant spatial distribution pattern for the winter wheat and summer maize growing seasons in the NCP. The third drought-wet spatial distribution pattern for winter wheat consisted of three northeast-southwest-oriented bands, with the spatial coefficient of the middle band higher than the two outer bands. For summer maize, the third drought-wet spatial distribution pattern overall exhibited opposite characteristics from east to west.
This study presents a comprehensive analysis of agricultural drought in the North China Plain region, focusing solely on the Standardized Precipitation Evapotranspiration Index (SPEI) and the Empirical Orthogonal Function (EOF) method. The integration of drone and remote sensing data with SPEI and EOF methods offers a promising approach for monitoring and forecasting agricultural drought, thus contributing to the development of effective strategies for drought management in the North China Plain.
The original contributions presented in the study are included in the article/supplementary material, further inquiries can be directed to the corresponding author.
QL: Funding acquisition, Writing–review and editing. YL: Project administration, Supervision, Writing–original draft. LL: Validation, Visualization, Writing–review and editing. YW: Formal Analysis, Writing–original draft. QW: Methodology, Writing–original draft. MM: Conceptualization, Project administration, Supervision, Writing–review and editing.
The authors declare financial support was received for the research, authorship, and/or publication of this article. This research was supported by National Natural Science Foundation of China (42371086, 42101086, 42201387) and the Open Fund of the China Institute of Water Resources and Hydropower Research (IWHR-SKL-KF202310).
The authors declare that the research was conducted in the absence of any commercial or financial relationships that could be construed as a potential conflict of interest.
All claims expressed in this article are solely those of the authors and do not necessarily represent those of their affiliated organizations, or those of the publisher, the editors and the reviewers. Any product that may be evaluated in this article, or claim that may be made by its manufacturer, is not guaranteed or endorsed by the publisher.
Alsubih, M., Mallick, J., Talukdar, S., Salam, R., AlQadhi, S., Fattah, M. A., et al. (2021). An investigation of the short-term meteorological drought variability over Asir Region of Saudi Arabia. Theor. Appl. Climatol. 145, 597–617. doi:10.1007/s00704-021-03647-4
Bai, X., Zhao, C., Tang, Y., Zhang, Z., Yang, B., and Wang, Z. (2023). Identification,physical mechanisms and impacts ofdrought–flood abrupt alternation:a review. Front. Earth Sci. 11, 1203603. doi:10.3389/feart.2023.1203603
Cao, S., Yi, H., Lifeng, Z., Yi, C., Wang, Y., Sheng, Y., et al. (2021). Spatiotemporal characteristics of drought and its impact on vegetation in the vegetation region of Northwest China. Ecol. Indic. 133, 108420. doi:10.1016/j.ecolind.2021.108420
Carvalho, P., and Spataru, C. (2023). Gaps in the governance of floods, droughts, and heatwaves in the United Kingdom. Front. Earth Sci. 11, 1124166. doi:10.3389/feart.2023.1124166
Fan, J., Wei, S., Liu, D., Qin, T., Xu, F., Wu, C., et al. (2023). Impact of ENSOevents on meteorological drought in theWeihe River basin, China. Front. Earth Sci. 11, 1093632. doi:10.3389/feart.2023.1093632
Guo, E., Liu, X., Zhang, J., Wang, Y., Wang, C., Wang, R., et al. (2017). Assessing spatiotemporal variation of drought and its impact on maize yield in Northeast China. J. Hydrology 553, 231–247. doi:10.1016/j.jhydrol.2017.07.060
Hu, Y. (2014). Risk assessment of drought disasters in the North China winter wheat-summer corn rotation area. Beijing, China: Chinese Academy of Agricultural Sciences.
Jiang, X., Bai, J., and Liu, X. (2019). Progress and prospect of comprehensive drought monitoring based on multi-source information. Adv. Earth Sci. 34 (3), 275–287.
Li, S., Ge, W., and Wang, F. (2023). Characteristics of drought events in northern China from 1982 to 2019 and their impact on vegetation. Res. Soil Water Conservation 30 (03), 251–259.
Liu, R., Zhu, Z., Fang, W., Wang, Y., Xu, P., and Shi, L. (2006). Risk zoning of drought damage for winter wheat in the North China Plain. J. Ecol. (09), 1068–1072.
Liu, Z., Qiu, H., Zhu, Y., Liu, Y., Yang, D., Ma, S., et al. (2022). Efficient identification and monitoring of landslides by time-series InSAR combining single- and multi-look phases. Remote Sens. 14, 1026. doi:10.3390/rs14041026
LorenzHartmann, D. J. D. L. (2003). Eddy–zonal flow feedback in the northern hemisphere winter. J. Clim. 16 (8), 1212–1227. doi:10.1175/1520-0442(2003)16<1212:effitn>2.0.co;2
Ma, S., Qiu, H., Yang, D., Wang, J., Zhu, Y., Tang, B., et al. (2022). Surface multi-hazard effect of underground coal mining. Landslides 20, 39–52. doi:10.1007/s10346-022-01961-0
Pasho, E., Camarero, J. J., de Luis, M., and Vicente-Serrano, S. M. (2011). Impacts of drought at different time scales on forest growth across a wide climatic gradient in north-eastern Spain. Agric. For. Meteorology 151 (12), 1800–1811. doi:10.1016/j.agrformet.2011.07.018
Sharma, A., and Goyal, M. K. (2020). Assessment of drought trend and variability in India using wavelet transform. Hydrological Sci. J. 65, 1539–1554. doi:10.1080/02626667.2020.1754422
Sun, H., Zhang, X., Chen, S., Wang, Y., Shao, L., and Gao, L. (2009). Impact of meteorological factor changes on summer corn yield in the North China Plain. Chin. J. Agric. Meteorology 30 (02), 215–218. doi:10.3969/j.issn.1000-6362.2009.02.019
Tirivarombo, S., Osupile, D., and Eliasson, P. (2018). Drought monitoring and analysis: standardised precipitation evapotranspiration index (SPEI) and standardised precipitation index (SPI). Phys. Chem. Earth 106, 1–10. doi:10.1016/j.pce.2018.07.001
Vicente-Serrano, S. M., Beguería, S., and López-Moreno, J. I. (2010). A multiscalar drought index sensitive to global warming: the standardized precipitation evapotranspiration index. J. Clim. 23 (7), 1696–1718. doi:10.1175/2009jcli2909.1
Vicente-Serrano, S. M., Sergio, M., Camarero, J. J., Beguería, S., Trigo, R., López-Moreno, J. I., et al. (2013). Response of vegetation to drought time-scales across global land biomes. Proc. Natl. Acad. Sci. U. S. A. 110 (1), 52–57. doi:10.1073/pnas.1207068110
Wang, L., Qiu, H., Zhou, W., Zhu, Y., Liu, Z., Ma, S., et al. (2022). The post-failure spatiotemporal deformation of certain translational landslides may follow the pre-failure pattern. Remote Sens. 14, 2333. doi:10.3390/rs14102333
Wen, Q. X., and Chen, H. (2023). Changes in drought characteristics over China during 1961–2019. Front. Earth Sci. 11. doi:10.3389/feart.2023.1138795
Wu, J. F., and Chen, X. H. (2019). Spatiotemporal trends of dryness/wetness duration and severity: the respective contribution of precipitation and temperature. Atmos. Res. 216, 176–185. doi:10.1016/j.atmosres.2018.10.005
Yang, D., Qiu, H., Hu, S., Pei, Y., Wang, X., Du, C., et al. (2021). Influence of successive landslides on topographic changes revealed by multitemporal high-resolution UAS-based DEM. CATENA 202, 105229. doi:10.1016/j.catena.2021.105229
Yang, J., Wu, J., Liu, L., Zhou, H., Gong, A., Han, X., et al. (2020). Responses of winter wheat yield to drought in the North China plain: spatial–temporal patterns and climatic drivers. Water 12, 3094. doi:10.3390/w12113094
Zhang, Y., Wang, C., and Zhang, J. (2015). Analysis of the spatial and temporal distribution characteristics of drought in the North China winter wheat area based on SPEI index. Acta Ecol. Sin. 35 (21), 7097–7107. doi:10.5846/stxb201311272825
Zheng, S., Hu, Q., He, H., Xing, M., Liu, Y., Ma, X., et al. (2022). Spatiotemporal variation characteristics of light energy resources during the winter wheat-summer corn growing season in the North China Plain from 1961 to 2020. J. China Agric. Univ. 27 (01), 26–37. doi:10.11841/j.issn.1007-4333.2022.01.03
Keywords: drought, winter wheat, summer maize, the North China Plain, spatial and temporal distribution characteristics
Citation: Li Q, Liu Y, Luo L, Wang Y, Wang Q and Ma M (2024) Spatiotemporal drought characteristics during growing seasons of the winter wheat and summer maize in the North China Plain. Front. Earth Sci. 11:1358987. doi: 10.3389/feart.2023.1358987
Received: 20 December 2023; Accepted: 28 December 2023;
Published: 16 January 2024.
Edited by:
Haijun Qiu, Northwest University, ChinaReviewed by:
Haiming Yan, Hebei GEO University, ChinaCopyright © 2024 Li, Liu, Luo, Wang, Wang and Ma. This is an open-access article distributed under the terms of the Creative Commons Attribution License (CC BY). The use, distribution or reproduction in other forums is permitted, provided the original author(s) and the copyright owner(s) are credited and that the original publication in this journal is cited, in accordance with accepted academic practice. No use, distribution or reproduction is permitted which does not comply with these terms.
*Correspondence: Meihong Ma, MjAxNTMxNDcwMDExQG1haWwuYm51LmVkdS5jbg==
Disclaimer: All claims expressed in this article are solely those of the authors and do not necessarily represent those of their affiliated organizations, or those of the publisher, the editors and the reviewers. Any product that may be evaluated in this article or claim that may be made by its manufacturer is not guaranteed or endorsed by the publisher.
Research integrity at Frontiers
Learn more about the work of our research integrity team to safeguard the quality of each article we publish.