
94% of researchers rate our articles as excellent or good
Learn more about the work of our research integrity team to safeguard the quality of each article we publish.
Find out more
METHODS article
Front. Earth Sci., 11 January 2024
Sec. Geochemistry
Volume 11 - 2023 | https://doi.org/10.3389/feart.2023.1351264
This article is part of the Research TopicUnconventional Resources: Provenance Analysis, Sediment Transport, Reservoir Evaluation, Geo-energyView all 29 articles
 Rujun Wang1Yongliang Tang1Fenglai Yang1Jiaofeng She1*Xiaorui Li1Naidong Chen1
 Ce Ji2,3Yingzheng He2,3
The reservoirs of ultra-deep and low-permeability sandstones typically exhibit characteristics of lithological tightness and poor physical properties. Fractures control the oil and gas content as well as the productivity of such reservoirs. However, the distribution of fractures is complex, exhibiting strong heterogeneity. Therefore, a systematic study on reservoir fracture modeling can provide geological foundations for the development of such reservoirs. Due to the considerable burial depth of these reservoirs, conventional methods relying solely on seismic information have limited reliability, and the established discrete network models of fractures are often less dependable. In this paper, taking the X gas reservoir in a basin in western China as an example, we discuss a fracture modeling method based on the integration of geological information to enhance the efficiency and accuracy of fracture modeling. The modeling method primarily involves the use of deterministic methods to obtain large-scale fractures, while random simulation is employed for small and medium-scale fractures. The fracture development control factors and seismic attribute information are integrated using permanence of ratios (PR) model to establish a fracture development probability field model. Subsequently, the geometric parameters of fractures and the fracture density model are used as input parameters to generate a discrete network model of small and medium-scale fractures using a object-based modeling method. Finally, based on the fracture equivalent property model and verified through geological understanding, analysis of production dynamics, and numerical simulation of the gas reservoir, it is demonstrated that the fracture model established using the proposed method aligns with geological understanding and exhibits high reliability.
With the maturity of deep exploration and development technologies and equipment, global oil and gas exploration and development has gradually entered the ultra-deep layer (Sun et al., 2013; Lei et al., 2021; Jia, 2023) (>6,000 m). China possesses abundant ultra-deep oil and gas resources, and in the past 20 years, large oil and gas reservoirs have been discovered in ultra-deep formations, such as the Changxing Formation in the Yuanba Gas Field in the Sichuan Basin, the Yanchang Formation in the Upper Triassic of the Ordos Basin, the Fuman-Shunbei Or-do-vician and the Kubuqi-Dabeikeleisu structural zone in the Tarim Basin (Guo et al., 2023; Chengzao et al., 2012; Qi and Li, 2014; Zhang et al., 2014). These sand-stone reservoirs, due to their high burial depth, experience strong compaction and cementation effects, resulting in poor matrix properties. However, compared with the fracture porosity, matrix porosity is still one to three orders of magnitude higher, making porosity the primary space for oil and gas accumulation and controlling steady production (Olson et al., 2009; Zeng and Xiang-Yang, 2009; Liu, 2010; Li et al., 2012; Liu et al., 2016; Li et al., 2017). Structural fractures serve as the main pathways for oil and gas migration, providing predominantly permeability (Wang et al., 2020a; Wang et al., 2020b; Wang et al., 2021; Wang et al., 2022a).
Fractures in low-permeability sandstone reservoirs are composed of fractures of different scales (Zeng et al., 2020; Lu et al., 2021). Fractures of different scales have different controlling effects on wells. Large-scale fractures typically extend in the range of hundreds of meters to kilometers in planar extent, and wells encountering large-scale fractures have high production capacity (Xue et al., 2014; Dong et al., 2020), but they often encounter water quickly. Medium and small-scale fractures, on the other hand, are typically within the range of hundreds of meters and can alter the permeability of the surrounding rock formations (Xue et al., 2014; Dong et al., 2020). Wells encountering these fractures have higher production capacity and experience more uniform water invasion along the fractures. Therefore, a fracture grading modeling approach is often used (Dong et al., 2020). However, due to the strong randomness and complex distribution patterns of fractures, it is challenging to establish fracture models that accurately represent the actual conditions. Currently, there are mainly two approaches for reservoir fracture modeling: the equivalent continuous model (Hennings et al., 2000; Huang et al., 2017) and the discrete fracture network model (DFN) (Wang and Hu, 2012; Dong et al., 2018; Yu et al., 2023). The equivalent continuous model divides the reservoir into a finite number of grids and assigns a certain average fracture attribute value to each grid (Lang and Guo, 2013). The DFN model uses discrete surface elements with specific directions, lengths, and areas to represent the distribution of fractures, and predicts fluid flow characteristics based on the geometric shape and conductivity of the fractures (Dershowitz and Wei, 2000). Compared to the equivalent continuous model, DFN can better capture the heterogeneity and multiscale nature of fractures. It also has the advantages of multi-disciplinary collaboration and utilization of multiple data sources. Therefore, DFN is currently the most widely used and rapidly developing model for fracture modeling (Shang et al., 2023). For multiscale fracture modeling, a combination of deterministic and stochastic modeling approaches is generally employed. Large-scale fractures can be determined through the interpretation of 3D seismic data and thus deterministic modeling methods can be used (Dershowitz and Wei, 2000; Hou et al., 2012; Liu et al., 2017). These methods have higher credibility. Medium and small-scale fractures, on the other hand, are often modeled using stochastic methods (Sun et al., 2019; Giuffrida et al., 2020; Wang et al., 2022b; Dan et al., 2022), with 3D seismic attributes used to constrain inter-well predictions. However, these models are of-ten limited by the accuracy of seismic data, and relying solely on them can lead to discrepancies between the models and the actual conditions, which hinders the efficient development of tight sandstone reservoirs (Ding et al., 2015; Gao et al., 2018; Lu et al., 2021).
This study takes the X gas reservoirs in a basin in western China as an example. The core samples and imaging data in the study area are relatively complete. On the basis of fully considering the controlling factors of fracture development, a fracture grading modeling approach is conducted by combining geological and seismic information. The large-scale fracture model is determined through deterministic modeling, while the medium and small-scale fracture model is developed using a probability fusion method based on the PR probability. The geological and seismic information are fully integrated to establish a fracture development probability field, which is used to constrain the construction of the discrete fracture network model. The aim of this study is to provide geological basis for the efficient development of this type of oil and gas reservoirs and to provide references for the fracture modeling of other ultra-deep low-permeability sandstone reservoirs.
The X gas reservoirs is located in a basin in western China and is a recently discovered trillion cubic meter-level giant gas field. The natural gas in the reservoirs mainly comes from coal-bearing formations and lacustrine mudstones in the Middle-Lower Jurassic and Middle-Upper Triassic strata. It has laid a solid resource foundation for China’s “West-East Gas Transmission” project (Wang, 2014; Wang et al., 2018; Yang et al., 2021). The X gas reservoirs is a billion-cubic-meter-scale large natural gas reservoirs discovered under the guidance of salt-related structural modeling theory.
The X gas reservoirs was formed during the Mesozoic Yanshan movement and the Cenozoic Himalayan movement. It is a regional northeast-trending elongated anticline, with a near east-west thrust fault developed in the northern and southern parts (Figure 1). The stratigraphy encountered in the study area from top to bottom includes the Quaternary (Q) series, the Neogene Kuqa Formation (N2k), the Kangcun Formation (N1-2k), the Jidike Formation (N1j), the Paleogene Suweiyi Formation (E2-3s), the Kumugeli Formation (E1-2km), the Cretaceous Baskichik Formation (K1bs), and the Basai Formation (K1bx). The target reservoirs is the Baskichik Formation, which is a red-brown fine sandstone and interbedded thin mudstone in a braided river delta-front depositional system (Gao et al., 2014; Lai et al., 2018; Wang et al., 2023). The cap rock is composed of gypsum and salt rocks of the Kumugeli Formation. Due to Late Cretaceous tectonic uplift and erosion, the baskichik Formation is unconformably overlain by the overlying strata and conformably contacts the underlying Basai Formation (Deng et al., 2009; Wang et al., 2016). The measured matrix porosity of the target formation is an average of 5.4%, and the matrix permeability is an average of 0.055mD. Core observations and imaging logging interpretations show that structural fractures are highly developed in the study area (Figure 2). The well test permeability is much higher than the matrix permeability, indicating that the presence of fractures greatly improves the reservoir’s fluid flow capacity and is an important controlling factor for high gas production.
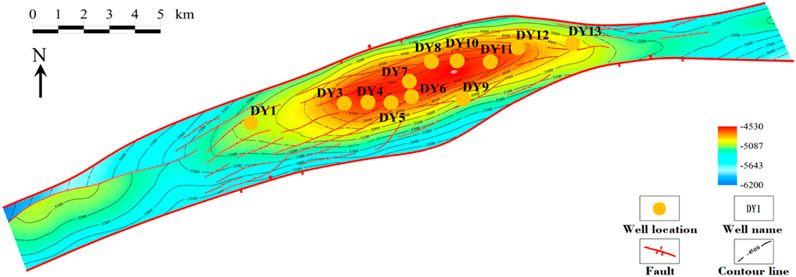
FIGURE 1. Structure map of Baskichik Formation in the study area.
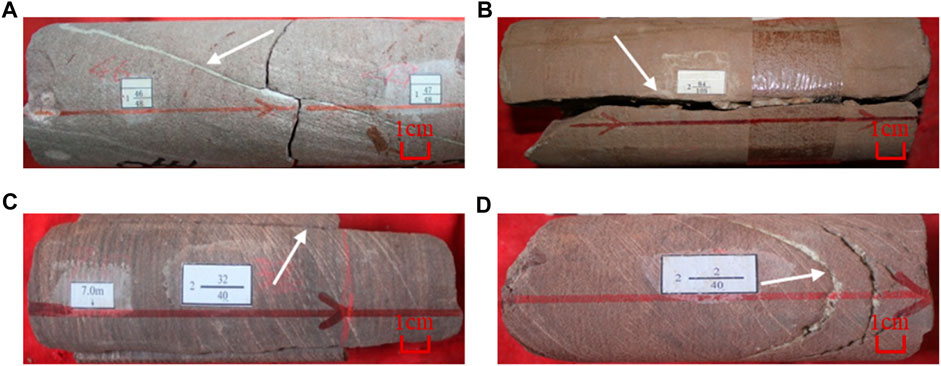
FIGURE 2. Structural fractures in the study area. (A) Filling structural fractures; (B) Filling structural fractures; (C) Unfilled structural fractures; (D) Filling structural fractures.
The development of reservoir fractures is complex and is controlled by multiple fac-tors such as sedimentation and tectonics (Sun et al., 2019; Giuffrida et al., 2020; Dan et al., 2022). In this study, we fully utilized core samples, thin sections, imaging well logs, and seismic data to investigate the controlling fac-tors of fracture development. Based on this, a fracture grading modeling approach was conducted, with deterministic modeling used for the large-scale fracture model and stochastic modeling used for the medium and small-scale fracture model. In the process of modeling the medium and small-scale fractures, a probability field of fracture development controlled by a single factor was first constructed. Then, a probability fusion method based on PR probability was used to establish a probability field of fracture development controlled by multiple factors. This was used to constrain the construction of the discrete fracture network model, providing guidance for subsequent well placement deployment.
Based on the interpretation of imaging well logs, the fracture parameters of wells at different locations in the anticline of the X gas reservoirs were statistically analyzed to analyze their spatial distribution characteristics. The results show that in conventional anticline-type oil and gas reservoirs, the core of the anticline exhibits the strongest curvature deformation and the highest density of structural fractures. However, in the X gas reservoirs, the wells located in the flank of the anticline show a higher density of fracture development compared to those in the core of the anticline (Figure 3). This is due to the characteristic of low stress in the core and high stress in the flank of the X gas reservoirs, which is a result of its reverse thrust-style overthrust anticline structure.
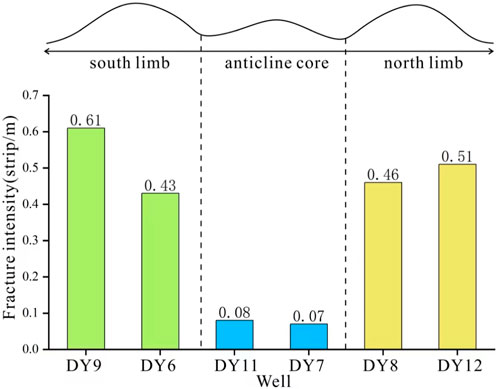
FIGURE 3. Fracture line density distribution map in different structural positions.
The X gas reservoirs is characterized by the development of 23 major faults with a nearly east-west orientation. Based on the interpretation of core fractures and imaging well log fractures, the relationship between fault proximity and the degree of fracture development in adjacent wells was analyzed, and the distribution pattern was summarized. It was observed that as the distance from the fault increases, the line density of fractures gradually decreases (Figure 4), indicating that fault development is conducive to reservoir fracture development.
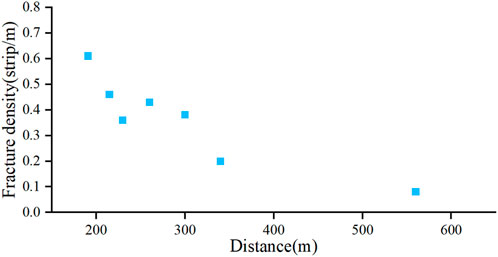
FIGURE 4. Fracture line density distribution map in different structural positions.
Based on the analysis of core samples and laboratory data, different lithologies exhibit distinct micro-pore structure characteristics, resulting in variations in petrophysical parameters. Therefore, based on the lithology, petrophysical properties, and micro-pore structure characteristics of reservoir rocks, the distributary channel and sheet-like sand deposition microfacies were further classified into three lithofacies types: Type 1, Type 2, and Type 3 sandstone facies. The interdistributary bay mudstone was classified as the fourth lithofacies type. Type 1 lithofacies mainly occur in the middle of distributary channels, while Type 2 and Type 3 lithofacies are primarily found at the edges of the channels. Due to the limited core data, conventional well logging curves are used to determine lithofacies types. By analyzing the relationship between different lithofacies types and conventional well logging responses, a well logging-based lithofacies identification criteria (Table 1) is established and used for lithofacies classification at individual wells.
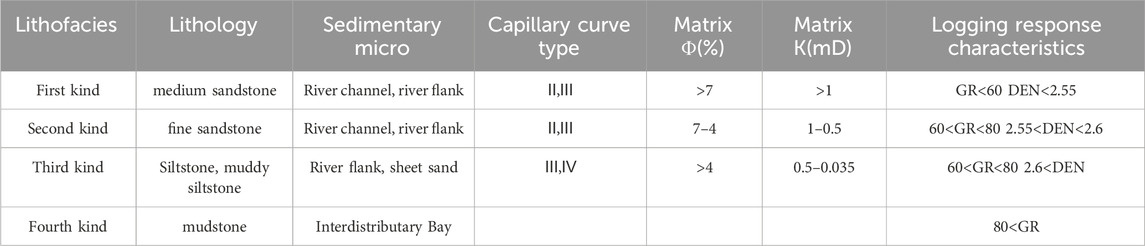
TABLE 1. Quantitative division standard of reservoir lithofacies of baskichik formation.
Based on the previous classification of different lithofacies types, the fracture line density of different lithofacies at each well point was analyzed, with emphasis on imaging well logging interpretation. The statistical results showed that the fracture line density was highest in the second lithofacies type, followed by the first and third lithofacies types, while the fourth lithofacies type exhibited the lowest fracture line density (Figure 5). This can be attributed to the fact that the second lithofacies type is mainly composed of fine sandstone, with high content of brittle minerals such as feldspar and quartz. As a result, the rock is more prone to fracture and release stress through brittle deformation, leading to increased fracture development. On the other hand, the fourth lithofacies is predominantly composed of mudstone. Under similar stress conditions, mudstone can absorb more stress, resulting in a lower degree of fracture development.
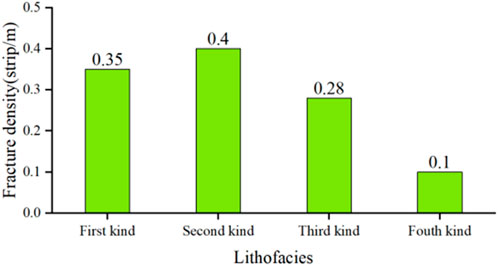
FIGURE 5. Relationship between fracture development density and fault distance.
Large-scale fractures are interpreted directly from conventional 3D seismic data as faults using deterministic methods. The process involves initially interpreting the faults on seismic sections based on their seismic signatures and fault combinations. This enables the determination of parameters such as fault location and orientation. Subsequently, a deterministic modeling approach is employed to directly establish a discrete network model of large-scale fractures that matches the interpreted faults (Figure 6).
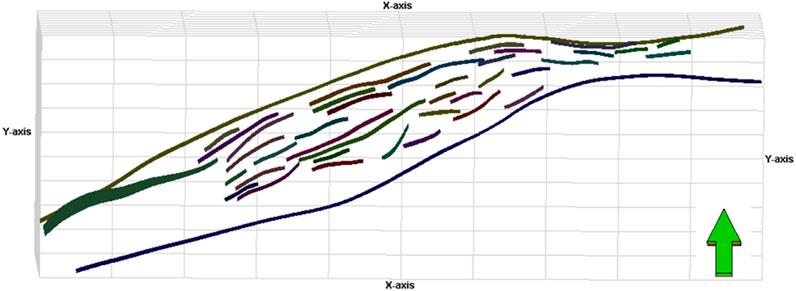
FIGURE 6. Large-scale fracture model of Baskichik Formation reservoir in the study area.
In this study, we employed seismic attributes and geological information that are sensitive to fracture information as the fundamental constraints for modeling small and medium-scale fractures. Based on the fracture identification results from imaging well logging, fracture development intervals were delineated, and the probability of fracture development was calculated for each well. The fracture development probability is defined as the ratio of the thickness of the fracture development interval to the thickness of the formation. A higher value indicates a more developed fracture system.
Due to limitations in the accuracy of seismic data acquisition technology, it is not possible to directly identify small to medium-scale fractures in seismic attributes. However, these attributes can provide information on the relative development of fractures, allowing for inter-well prediction. Seismic attributes extracted from post-stack seismic data can serve as important indicators for predicting fractures between wells. Through analysis of these extracted seismic attributes, it is observed that the maximum curvature and maximum likelihood attributes exhibit a good response to fracture development. Regions with high curvature and maximum likelihood values align well with the distribution of faults in the study area. Therefore, these two seismic attributes can be used as secondary data constraints for fracture modeling.
To facilitate the calculation of probabilities, the maximum curvature and maximum likelihood attributes undergo normalization. The formula Eq. 1 for normalization is as follows:
In the formula, Di is the attribute value of a grid node, Di is the attribute maximum value of all grid nodes, Dmax is the attribute maximum value of all grid nodes, Dmin is the attribute minimum value of all grid nodes, CDi value is between 0 and 1, the more developed the fracture, the greater the value.
The normalized seismic attribute fusion body can reflect the degree of fracture development. The larger the value is, the more developed the fracture is, but it cannot directly reflect the probability of fracture development. Therefore, according to the correlation analysis (Figure 7) between the fracture development probability and the seismic attributes of each well, the absolute value of the correlation coefficient between the seismic attributes and the fracture development probability is taken as the weight coefficient of each seismic attribute, and the calculation formula Eq. 2 of the seismic attribute fusion body is obtained by using the weighted average method as follows:
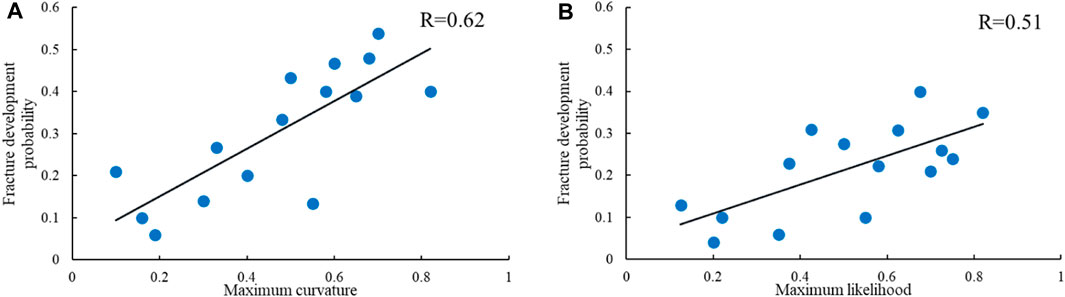
FIGURE 7. The correlation between fracture development probability and seismic attributes. (A) Correlation diagram of fracture development probability and maximum curvature attribute; (B) Correlation diagram of fracture development probability and maximum likelihood attribute.
In the formula, Si is the normalized seismic fusion attribute of a grid node, and the value of Si is between 0 and 1. The more developed the fracture is, the larger the value is. CCuri is the normalized curvature value of a grid node, and CLikei is the normalized likelihood value of a grid node.
Finally, using the formula, the seismic attributes are transformed into a seismic attribute fusion volume that controls the probability of fracture development. From Figure 8, it can be observed that the seismic attribute fusion volume highlights the regions where the fracture prediction results across different seismic attribute volumes are consistent. This enhances the visibility of the fracture development areas and improves prediction accuracy while reducing inter-well uncertainty.
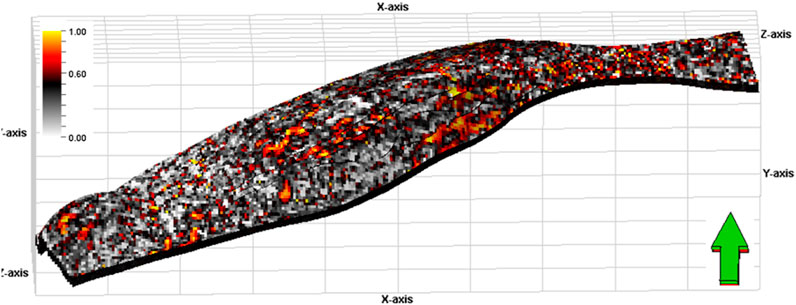
FIGURE 8. Maximum curvature and maximum likelihood seismic attribute fusion body.
Due to the inherent uncertainty in seismic information, relying solely on seismic data for inter-well predictions often leads to discrepancies with actual production and development understanding. Therefore, in this study, we have introduced the aforementioned factors controlling fracture development as constraints to obtain more realistic fracture models. This will provide stronger evidence for subsequent oil and gas field development. Based on the structural position, distance to fault, and spatial distribution of lithofacies, corresponding attribute volumes were constructed, and these results were utilized as supplementary constraints in fracture modeling.
We conducted a statistical analysis on the relationship between the probability of fracture development in individual wells and the distance to the fault, and found that the probability of fracture development decreases exponentially as the distance to the fault increases (Figure 9A). Then, we used the formula Eq. 3 relating the probability of fracture development to the distance to the fault to calculate the probability distribution of fracture development controlled by fault distance (Figure 9B).
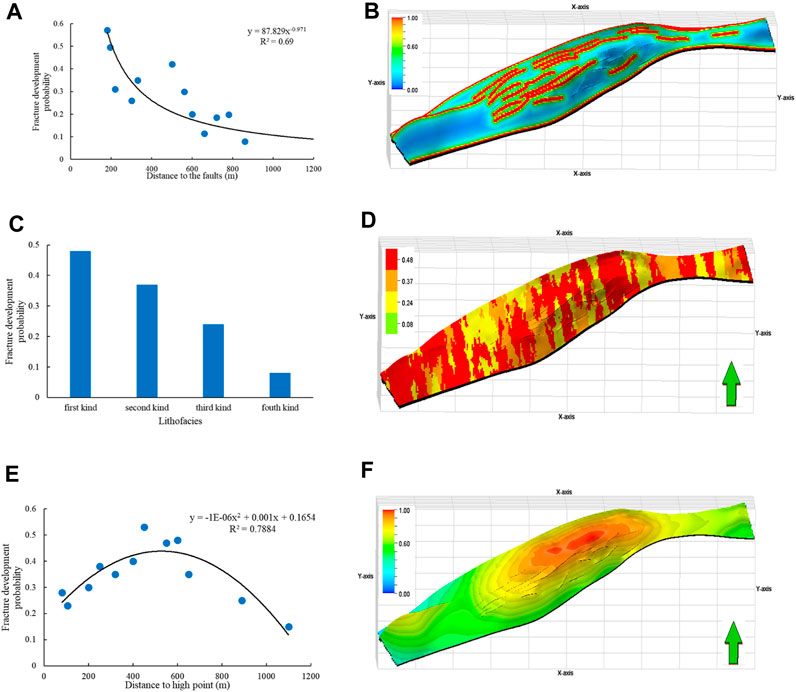
FIGURE 9. Fracture development probability body controlled by correlation analysis and geological information. (A) Distance from fault; (B) The distance from the fault controls the probability of fracture development;(C) lithofacies; (D) Lithofacies control fracture development probability body; (E) Structural position controls fracture development probability body; (F) Structural position controls fracture development probability body.
Through statistical analysis on the relationship between the probability of fracture development in a single well and lithofacies, for ease of calculation, the lithofacies types were renamed according to the descending order of fracture development probability, and the average probability values for different types were taken (Figure 9C). Based on this, the probability body of fracture development conditions was calculated (Figure 9D).
Based on the statistical analysis of the relationship between the fracture development probability of a single well and the distance to the high point of the anticline, the relationship between the fracture development probability and the distance to the high point of the anticline is established(Figure 9E). Based on this formula, the fracture development condition probability body controlled by different positions of the anticline is calculated from the model of the distance to the high point of the anticline (Figure 9F).
The PR model refers to the constant updating ratio theory in engineering approximation learning, which assumes that “the ratio of probability updates does not change with the introduction of a variable.” This assumption requires the variables to be in some form of independence and lack of correlation. This independence is neither complete nor conditional independence, but rather a weak assumption that approximates reality and minimizes the calculation error of the model. Journel provided a detailed derivation of the PR model (Jo and urnel, 2002) and demonstrated that the model satisfies all the theorems of probability theory. The computational formula (Eq. 4 and Eq. 5) for the PR model is as follows:
Of which
In the formula, A represents the main variable (such as fracture development), Di denotes the i-th secondary variable., n represents the number of secondary variables, P(A| Di) represents the conditional probability of the main variable (such as fracture development) when the secondary variable takes a certain value, and P(A) represents the main variable (such as fracture development) prior probability, P(A|Di,i=1,…,n) represents when all the secondary variables(i=1,…,n). The comprehensive conditional probability of the main variable (such as fracture development) when taking a set of fixed values.
Due to the multiple controlling factors of fracture development event (A), in this study, a seismic attribute fusion body (D1), distance to fault (D2), distance to the highest point of the anticline (D3), and lithology (D4) were selected as four factors to comprehensively evaluate the probability of fracture development in the study area. The probability of fracture development for each factor can be calculated individually, but when considering the interdependence of the four events, it becomes challenging to recombine these four conditional probabilities as P(A|D1, D2, D3, D4). The PR method satisfies the requirements of ensuring all limiting conditions, even in the presence of complex interdependencies among data. Therefore, this method is chosen to construct the comprehensive probability of fracture development.
The seismic attribute fusion volume, distance to faults, distance to the crest of the anticline, and lithofacies-controlled fracture development conditional probability volume were incorporated into the above formula to calculate the comprehensive fracture development conditional probability volume (Figure 10). The model reveals that high probability zones of fracture development are mainly distributed near faults or in certain lithofacies regions. This indicates that fracture development is primarily influenced by structural factors and lithology, which aligns with geological understanding and demonstrates the reliability of the fracture probability volume model.

FIGURE 10. Medium and small scale fracture development probability body.
The establishment of a fracture density model is crucial in fracture modeling. Firstly, based on imaging well logs for fracture interpretation, individual well fracture density curves were plotted. Fracture density is defined as the number of fractures per unit formation thickness, and it has a strong positive correlation with fracture development probability. Higher fracture development probability corresponds to higher fracture density. Therefore, in this study, individual well fracture density curves were used as hard data for modeling, while a fracture probability volume model was utilized as soft data. The sequential Gaussian co-simulation method was employed to establish a fracture development density volume (Figure 11). The model reveals that areas with high fracture density are distributed near faults and the first type of lithofacies, which is consistent with geological expectations.
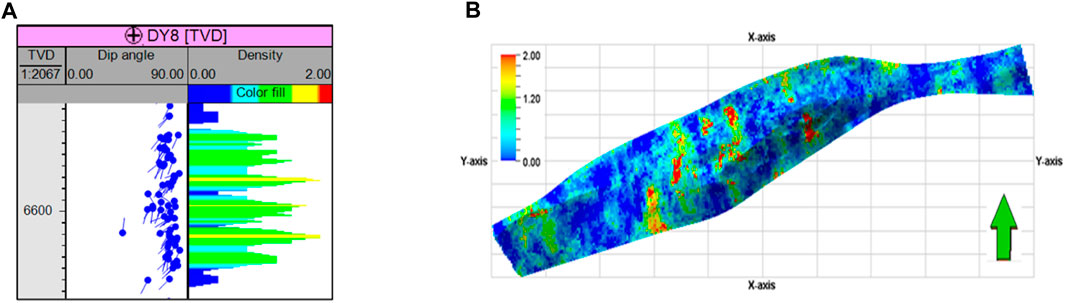
FIGURE 11. Medium and small scale fracture density model.(A) Imaging logging interpretation of fracture density curve; (B) Fracture density model.
Based on the statistical data of the occurrence and orientation of small-scale fractures in the study area, parameters for modeling small-scale fractures were defined. The object-based marked point processes simulation was employed to generate fracture slices stochastically. At the same time, combined with annealing simulation, the fracture density model is taken as the objective function, so that the generated fracture slices meet the fracture density requirements in the model. Reasonable termination conditions can make the model closer to the real fracture network system. In this paper, the number of fractures in the study area is selected as the termination condition of the simulation. According to the fracture density of the geological understanding in the study area, the total number of fractures in the study area is calculated. When the number of fractures in the model reaches the calculated total for the study area, the simulation is terminated. Finally, a discrete network model of small and medium-sized fractures in the study area is established(Figure 12).
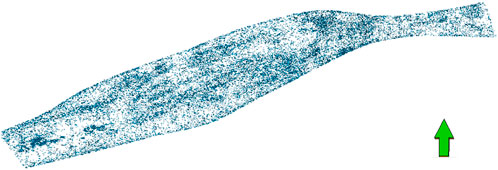
FIGURE 12. Fracture discrete network model of Baskichik Formation in the study area.
The fracture equivalent porosity of the grid node is equal to the ratio of the sum of the fracture volume in the grid to the grid volume. The formula Eq. 6 is as follows:
In the formula, ϕf is the fracture equivalent porosity of the grid, %; Afi is the fracture area in the grid, m2; ωfi is the fracture opening in the grid, m; Vcell is the mesh volume, m3.
Based on the discrete fracture network model of X gas reservoirs, the equivalent porosity of each grid is calculated using a formula, which is coarsened into the matrix reservoir model to obtain the equivalent porosity model of the fractures (Figure 13A). The modeling results indicate that the fracture porosity value is around 0.06%.
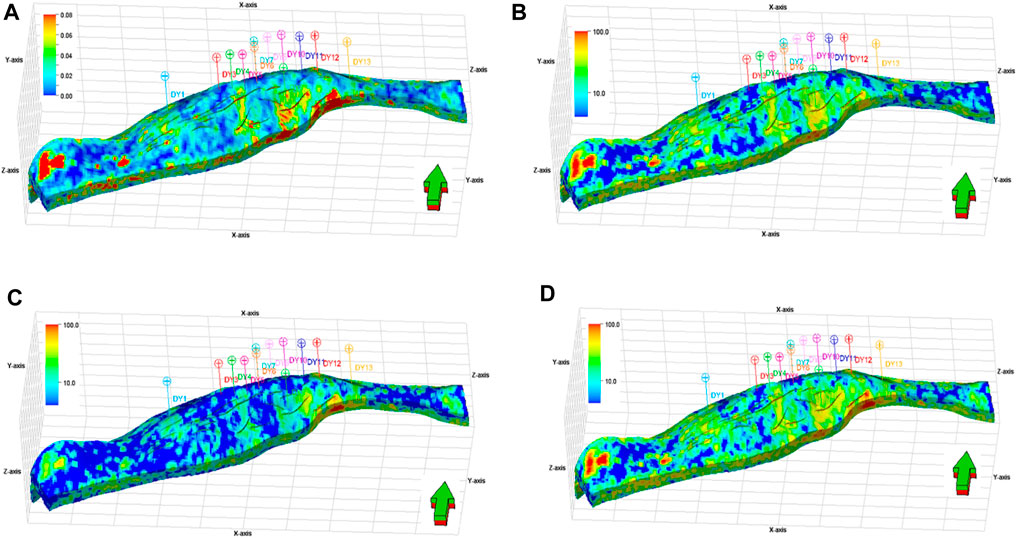
FIGURE 13. Fracture equivalent attribute model. (A) equivalent porosity model; (B) i direction equivalent permeability model; (C) j direction equivalent permeability model; (D) k direction equivalent permeability model.
Using the Oda method, the equivalent permeability of fractures in different directions for each grid was calculated. This equivalent permeability model was subsequently upscaled to the matrix reservoir model, yielding equivalent permeability models in the i, j, and k directions (Figures 13B–D). The model shows that the fracture permeability is mainly in the range of 10 mD to 100 mD, which is significantly higher than the matrix permeability. This indicates that fractures can greatly enhance the permeability of tight sandstone reservoirs. High-value areas with permeability greater than 75 mD were identified in the DY12, DY4, and DY5 well areas. Through comparing with individual well productivity, a correlation between individual well productivity and fractures is discovered: under the assumption of similar reservoir thickness, wells with higher fracture density exhibit larger effective permeability around the wellbore, resulting in higher daily gas production. Conversely, wells with lower fracture density yield smaller daily gas production, indicating that fractures can enhance individual well productivity by controlling reservoir flow capacity.
The effectiveness of the established fracture model was validated through three aspects, ensuring that it can accurately reflect the current geological understanding, align with production practices, and be used for numerical simulations and fitting.
(1) Geological understanding: The distribution of fractures in each layer and the total number of fractures in the model obtained by this modeling are in line with the existing geological understanding.
(2) Dynamic analysis: Based on the equivalent fracture property model, the DY12, DY4, and DY5 well areas were identified as high-permeability zones. By comparing them with the initial unrestricted flow rates, the unrestricted flow rate of DY12 well was 386.6 × 10⁴ m3/d, DY4 well was 195.4 × 10⁴ m3/d, and DY5 well was 171.7 × 10⁴ m3/d. These values indicate that the modeled fracture network corresponds well with the actual development and testing data, demonstrating a high level of model accuracy.
(3) Numerical simulation of the reservoir was conducted using the established fracture model as the underlying geological model. The historical fitting of daily gas and water production rates for the X reservoir is illustrated in Figure 14, showing a high level of accuracy with a conformity rate of over 90%. This indicates that the developed model of the basement fractures effectively captures the actual geological characteristics of the target reservoir.
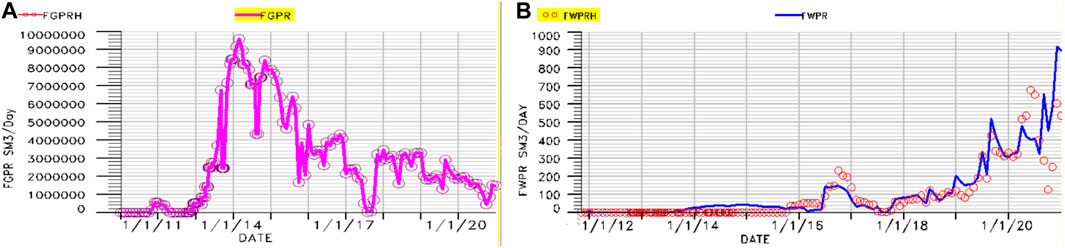
FIGURE 14. Actual production history matching diagram. (A) Nissan gas history matching diagram; (B) Daily water production history matching map.
In low-permeability sandstone reservoirs, fractures have a direct impact on the productivity of oil and gas wells. Currently, fracture modeling typically combines deterministic and stochastic approaches. The construction of a small to medium-scale fracture development density model is a current and challenging research focus. Numerous scholars have conducted extensive work on predicting small to medium-scale fractures based on numerical simulation of structural stress fields, pre-stack and post-stack seismic information, and other methods. However, there are still several issues that warrant further consideration: (1) When predicting fractures in ultra-deep fracture-prone reservoirs, the resolution of seismic data is often low, leading to significant discrepancies between the constructed models and the actual fractures present; (2) The primary controlling factors for fracture development can vary across different regions. Therefore, the preferred conditions established by previous researchers may not necessarily be applicable until the main controlling factors for fractures are explicitly identified; (3) Fracture orientations can vary within the same region, making it challenging to integrate fracture density models and fracture orientation attribute information. As a result, the spatial distribution prediction of fracture geometry exhibits poor performance.
The future trend in fracture modeling involves the integration of multiple disciplines and methods. In-depth research can be conducted in the following areas: (1) Currently, multi-scale fracture modeling is commonly employed, and there exists a certain correlation between fractures at different scales. It is important to establish a quantitative model that utilizes large-scale fractures as constraints for modeling small-scale fractures; (2) Strengthening physical simulation experiments can contribute to the study of fracture patterns in different rock types under varying stress conditions, providing guidance for modeling; (3) Multiple methods such as outcrop observations, seismic analysis, reservoir geomechanics, and far-field acoustic investigations can be used to study the three-dimensional distribution characteristics of fracture orientations. It is essential to establish a trend-constrained model for fracture orientations.
(1) Fractures in X gas reservoir are primarily controlled by structural position, distance to faults, and lithofacies. The highest fracture line density is observed in the crestal flank and near fault zones, whereas the fracture density is relatively lower in the crestal core region. Among lithofacies types, the second lithofacies exhibits the highest fracture development line density, followed by the first lithofacies.
(2) A fracture model for the X gas reservoir was established based on the integration of probability ranking (PR) and geological information, leading to a fracture modeling technique that incorporates multiple data sources, including core analysis, well logging, production dynamics, and seismic data. This integration enhances the accuracy and reliability of the constructed fracture model.
(3) At the core of this method is the construction of fracture development probabilities for different segments based on the development of fractures. By integrating these probabilities using PR analysis, a comprehensive fracture development probability volume is established, thereby improving the accuracy of inter-well fracture development predictions.
(4) To assess the applicability of the discrete fracture model, three aspects were considered: geological understanding, dynamic characteristics of the reservoir production, and numerical simulations. The distribution of fractures was found to align with the current geological understanding. Analysis of the production dynamics of the reservoir indicated that wells with high initial unimpeded flow rates were predominantly located in areas with high values of equivalent permeability, which corresponds to real-world observations. The credibility of the discrete fracture model was further validated through numerical simulations, which yielded a comprehensive historical fitting of actual daily gas and water production rates.
The original contributions presented in the study are included in the article/Supplementary Material, further inquiries can be directed to the corresponding author.
RW: Methodology, Writing–original draft, Data curation. YT: Methodology, Writing–review and editing. FY: Investigation, Writing–original draft. JS: Conceptualization, Writing–review and editing. XL: Formal Analysis, Writing–review and editing. NC: Investigation, Writing–original draft. CJ: Writing–review and editing. YH: Writing–original draft.
The author(s) declare financial support was received for the research, authorship, and/or publication of this article. This work was supported by National Natural Science Foundation of China (No. 42172154).
Authors RW, YT, FY, JS, XL, and NC were employed by PetroChina Tarim Oilfield Company.
The remaining authors declare that the research was conducted in the absence of any commercial or financial relationships that could be construed as a potential conflict of interest.
All claims expressed in this article are solely those of the authors and do not necessarily represent those of their affiliated organizations, or those of the publisher, the editors and the reviewers. Any product that may be evaluated in this article, or claim that may be made by its manufacturer, is not guaranteed or endorsed by the publisher.
Chengzao, J., Zheng, M., and Zhang, Y. (2012). Unconventional hydrocarbon resources in China and the prospect of exploration and development. Petroleum Explor. Dev. 39 (2), 139–146. doi:10.1016/s1876-3804(12)60026-3
Dan, L., Shi, C., Wen, J., Wei, L., Zhang, X., and Zhang, J. (2022). Application of multi-information fusion modeling technology for fractures in dual-medium carbonate reservoir. Petroleum Geol. Recovery Effic. 29 (1), 46–52. doi:10.13673/j.cnki.cn37-1359/te.2022.01.006
Deng, H., Xin, Z., Hai, Y., Lei, G., and Ma, Y. (2009). Geological structure and its controls on giant oil and gas fields in Kuqa depression, Tarim Basin: a clue from new shot seismic data. Geotect. Metallogenia 33 (1), 19–32. doi:10.1016/S1874-8651(10)60080-4
Dershowitz, B. P. T., and Wei, L. (2000). Integration of discrete feature network methods with conventional simulator approaches. Spe Reserv. Eval. Eng. 3 (2), 165–170. doi:10.2118/62498-pa
Ding, W., Yin, S., Wang, X., Zhang, N., Zhang, M., and Cao, X. (2015). Assessment method and characterization of tight sandstone gas reservoir fractures. Earth Sci. Front. 22 (4), 173–187. doi:10.13745/j.esf.2015.04.019
Dong, S., Lyu, W., Xia, D., Wang, S., Du, X., Wang, T., et al. (2020). An approach to 3D geological modeling of multi-scaled fractures in tight sandstone reservoirs. Oil Gas Geol. 41 (3), 627–637.
Dong, S., Zeng, L., Xu, C., Cao, H., Wang, S., and Lu, W. (2018). Some progress in reservoir fracture stochastic modeling research. Oil Geophys. Prospect. 53 (3), 625–641. doi:10.13810/j.cnki.issn.1000-7210.2018.03.023
Gao, J., Zhou, L., Feng, Q., and Mu, Z. (2018). Progress in reservoir structural fracture characterization and prediction. Geol. Sci. Techology Inf. 37 (4), 158–166. doi:10.19509/j.cnki.dzkq.2018.0421
Gao, Z., Feng, J., Zhou, C., Cui, J., Li, X., Zhao, X., et al. (2014). Arid climate seasonal rivers deposition: a case of lower cretaceous in kuche river outcrop. Acta Sedimentol. Sin. 32 (6), 1060–1071.
Giuffrida, A., Fabrizio, A., Andrea, R., Elisa, P., Vincenco, L., Martin, E., et al. (2020). Fracture stratigraphy and DFN modelling of tight carbonates, the case study of the Lower Cretaceous carbonates exposed at the Monte Alpi (Basilicata, Italy). Mar. Petroleum Geol. 112, 104045. doi:10.1016/j.marpetgeo.2019.104045
Guo, D., Wang, Y., and Ke, G. (2023). Key technologies for sustainable production of ultra-deep high-sulfur bioherm gas reservoirs with bottom water in the Changxing Formation, Yuanba Gas Field. Nat. Gas. Ind. 43 (09), 93–101. doi:10.3787/j.issn.1000-0976.2023.09.009
Hennings, P., Olson, J., and Thompson, L. (2000). Combining outcrop data and three-dimensional structural models to characterize fractured reservoirs: an example from Wyoming. AAPG Bull. 84 (6), 830–849. doi:10.1306/a967340a-1738-11d7-8645000102c1865d
Hou, J., Ma, X., Liu, Y., and Zhao, B. (2012). Modelling of carbonate fracture-vuggy reservoir: A case study of Ordovician reservoir of 4th block in Tahe Oilfield. Earth Sci. Front. 19 (2), 59–66.
Huang, X., Li, Z., Zhou, G., Liu, Q., Li, H., and Wang, H. (2017). Fracture porosity modeling of fractured tight sandstone reservoir:a case study of the reservoir in Member 2 of Xujiahe Formation, Pingluoba structure, Sichuan Basin. Acta Pet. Sin. 38 (5), 570–577. doi:10.7623/syxb201705010
Jia, C. (2023). Key scientific and technological problems of petroleum exploration and development in deep and ultra-deep formation. J. China Univ. Petroleum (Edition Nat. Sci. 47 (05), 1–12. doi:10.3969/j.issn.1673-5005.2023.05.001
Journel, A. G. (2002). Combining knowledge from diverse sources: an alternative to traditional data independence hypotheses. Math. Geol. 34 (5), 573–596. doi:10.1023/a:1016047012594
Lai, J., Han, N., Jia, Y., Ji, Y., Wang, G., Pang, X., et al. (2018). Detailed description of the sedimentary reservoir of a braided delta based on well logs. Geol. China 45 (2), 304–318. doi:10.12029/gc20180207
Lang, X., and Guo, Z. (2013). Fractured reservoir modeling method based on discrete fracture network model. Acta Sci. Nat. Univ. Pekin. 49 (6), 964–972. doi:10.13209/j.0479-8023.2013.128
Lei, Q., Xu, Y., Yang, Z., Cai, B., Wang, X., Zhou, L., et al. (2021). Progress and development directions of stimulation techniques for ultra-deep oil and gas reservoirs. Petroleum Explor. Dev. 48 (1), 221–231. doi:10.1016/s1876-3804(21)60018-6
Liu, C., Zhang, R., Zhang, H., Wang, J., Mo, T., Wang, K., et al. (2017). Genesis and reservoir significance of multi-scale natural fractures in Kuqa foreland thrust belt, Tarim Basin, NW China. Petroleum Explor. Dev. 44 (3), 495–504. doi:10.1016/s1876-3804(17)30057-5
Liu, J., Wu, M., Song, R., Huang, L., and Dai, X. (2017). Study on simulation method of multi-scale fractures in low permeability reservoirs. J. Southwest Petroleum Univ. Sci. Technol. Ed. 39 (4), 90–103. doi:10.11885/j.issn.1674-5086.2016.06.25.03
Liu, W., Zhou, X., Li, S., and Zhang, S. (2016). A case study of the third member of Shahejie Formation in Dongpu Depression. Nat. Gas. Geosci. 27 (11), 1993–2004. doi:10.11764/j.issn.1672-1926.2016.11.1993
Liu, X. (2010). Simulation of fracture parameters in the 3∼(rd) sand unit of the Paleogene Fu-2 member in the Qiaohekou oilfield. Oil Gas Geol. 31 (2), 250–254. doi:10.1016/S1876-3804(11)60008-6
Li, Y., Li, J., Yang, R., Wang, Y., and Fan, A. (2012). Relationship between gas bearing capacity and reservoir fractures of tight sand reservoirs in the eastern block 2 of the Sulige Gas Field. Nat. Gas. Ind. 32 (6), 28–30.
Lu, W., Zeng, L., Chen, S., Lu, P., Dong, S., et al. (2021). Characterization methods of multi-scale natural fractures in tight and low-permeability sandstone reservoirs. Geol. Rev. 67 (2), 543–556. doi:10.16509/j.georeview.2021.02.020
Olson, J., Laubach, S., and Lander, R. (2009). Natural fracture characterization in tight gas sandstones: integrating mechanics and diagenesis. AAPG Bull. 93 (11), 1535–1549. doi:10.1306/08110909100
Qi, L., and Li, X. (2014). Exploration practice and prospects of giant carbonate field in the Lower Paleozoic of Tarim Basin. Oil Gas Geol. 35 (6), 771–779. doi:10.11743/ogg20140604
Shang, X., Duan, T., Bao, H., Long, S., and Li, D. (2023). A new model of natural fractures in shale gas reservoirs based on fracture facies characterization:A case study from the Jiaoshiba Block of the Fuling Shale Gas Field. Nat. Gas. Ind. 43 (6), 44–56. doi:10.3787/j.issn.1000-0976.2023.06.004
Sun, L., Zou, C., Zhu, R., Zhang, Y., Zhang, S., Zhang, B., et al. (2013). Formation, distribution and potential of deep hydrocarbon resources in China. Petroleum Explor. Dev. 40 (6), 687–695. doi:10.1016/s1876-3804(13)60093-2
Sun, S., Zhao, S., Hou, J., Zhou, Y., Song, S., and He, Y. (2019). Hierarchical modeling of multi-scale fractures in tight sandstones: a case study of the eighth member of the Yanchang formation in wellblock 92 of the Honghe oilfield. Petroleum Sci. Bull. 4 (01), 11–26. doi:10.3969/j.issn.2096-1693.2019.01.002
Wang, H., and Hu, G. (2012). Realization and optimization of discrete fracture network model of buried hill fractured reservoir in C oilfield,Bohai Bay. Lithol. Reserv. 24 (1), 74–79. doi:10.3969/j.issn.1673-8926.2012.01.014
Wang, K., Zhang, H., Zhang, R., Wang, J., Dai, J., and Yang, X. (2016). Characteristics and influencing factors of ultra-deep tight sandstone reservoir structural fracture: a case study of Keshen-2 gas field, Tarim Basin. Acta Pet. Sin. 37 (6), 715–727. doi:10.7623/syxb201606003
Wang, K., Zhang, R., Fang, X., Wang, J., and Zhang, T. (2018). Characteristics and property modeling of ultra-deep fractured-porous tight sandstone reservoir: a case study on the Keshen 8 gas reservoir in Kuqa depression. China Pet. Explor. 23 (06), 87–96. doi:10.3969/j.issn.1672-7703.2018.06.010
Wang, R., Wang, S., Xian, B., Zhu, S., Fan, Q., Shan, C., et al. (2023). Sedimentary microfacies and configuration of skeleton sand bodies in the third member of Bashijiqike Formation in northern Kuqa Depression n, Tarim Basin. Nat. Gas. Geosci. 34 (10), 1681–1695. doi:10.11764/j.issn.1672-1926.2023.07.001
Wang, X., Hou, J., Li, S., Dou, L., Song, S., Kang, Q., et al. (2020a). Insight into the nanoscale pore structure of organic-rich shales in the Bakken Formation, USA. J. Petroleum Sci. Eng. 191, 107182. doi:10.1016/j.petrol.2020.107182
Wang, X., Liu, Y., Hou, J., Li, S., Kang, Q., Sun, S., et al. (2020b). The relationship between synsedimentary fault activity and reservoir quality — a case study of the Ek1 formation in the Wang Guantun area, China. Interpretation-a J. Subsurf. Charact. 8 (3), SM15–SM24. doi:10.1190/int-2019-0131.1
Wang, X., Yu, S., Li, S., and Zhang, N. (2022b). Two parameter optimization methods of multi-point geostatistics. J. Petroleum Sci. Eng. 208, 109724. doi:10.1016/j.petrol.2021.109724
Wang, X., Zhang, F., Li, S., Dou, L., Liu, Y., Ren, X., et al. (2021). The architectural surfaces characteristics of sandy braided river reservoirs, case study in gudong oil field, China. China. Geofluids. 2021, 1–12. doi:10.1155/2021/8821711
Wang, X., Zhou, X., Li, S., Zhang, N., Ji, L., and Lu, H. (2022a). Mechanism study of hydrocarbon differential distribution controlled by the activity of growing faults in faulted basins: case study of Paleogene in the Wang guantun area, bohai bay basin, China. Lithosphere 2021, 7115985. doi:10.2113/2022/7115985
Wang, Z. (2014). Formation mechanism and enrichment regularities of kelasu subsalt deep large gas field in Kuqa depression,Tarim Basin. Nat. Gas. Geosci. 25 (2), 153–166. doi:10.11764/j.issn.1672-1926.2014.02.0153
Xue, Y., Xia, D., Su, Z., Wu, X., and Ji, S. (2014). Fracture modeling at different scales based on convergent multi-source information. J. Southwest Petroleum Univ. Sci. Technol. Ed. 36 (2), 57–63. doi:10.11885/j.issn.1674-5086.2012.08.30.11
Yang, H., Li, Y., Tang, Y., Lei, G., Zhou, P., Zhou, L., et al. (2021). Accumulation conditions, key exploration and development technologies for Keshen gas field in Tarim Basin. Acta Pet. Sin. 42 (3), 399–414. doi:10.7623/syxb202103012
Yu, C., Wen, R., Zhang, X., Pang, F., Zhao, X., Chen, Z., et al. (2023). Research on reservoir fracture identification and modeling in M oilfield. Petrochem. Ind. Appl. 42 (06), 87–92. doi:10.3969/j.issn.1673-5285.2023.06.020
Zengxiang-Yang, L. L. (2009). Fractures in sandstone reservoirs with ultra-low permeability: a case study of the upper triassic Yanchang Formation in the Ordos Basin, China. Aapg Bull. 93 (4), 461–477. doi:10.1306/09240808047
Zeng, L., Lyu, P., Qu, X., and Fan, J. (2020). Multi-scale fractures in tight sandstone reservoirs with low permeability and geological conditions of their development. Oil Gas Geol. 41 (3), 449–454. doi:10.11743/ogg20200301
Keywords: ultra-deep sandstone reservoirs, fracture modeling, seismic attribute, probability fusion, PR model
Citation: Wang R, Tang Y, Yang F, She J, Li X, Chen N, Ji C and He Y (2024) A fracture modeling method for ultra-deep reservoirs based on geologic information fusion: an application to a low porosity sandstone reservoirs in X gas field of a basin in western China. Front. Earth Sci. 11:1351264. doi: 10.3389/feart.2023.1351264
Received: 06 December 2023; Accepted: 29 December 2023;
Published: 11 January 2024.
Edited by:
Xixin Wang, Yangtze University, ChinaReviewed by:
Nina Su, China University of Petroleum (East China), ChinaCopyright © 2024 Wang, Tang, Yang, She, Li, Chen, Ji and He. This is an open-access article distributed under the terms of the Creative Commons Attribution License (CC BY). The use, distribution or reproduction in other forums is permitted, provided the original author(s) and the copyright owner(s) are credited and that the original publication in this journal is cited, in accordance with accepted academic practice. No use, distribution or reproduction is permitted which does not comply with these terms.
*Correspondence: Jiaofeng She, eXVqZl90bG1AMTYzLmNvbQ==
Disclaimer: All claims expressed in this article are solely those of the authors and do not necessarily represent those of their affiliated organizations, or those of the publisher, the editors and the reviewers. Any product that may be evaluated in this article or claim that may be made by its manufacturer is not guaranteed or endorsed by the publisher.
Research integrity at Frontiers
Learn more about the work of our research integrity team to safeguard the quality of each article we publish.