 Dacheng Wang1†
 Meihong Ma
95% of researchers rate our articles as excellent or good
Learn more about the work of our research integrity team to safeguard the quality of each article we publish.
Find out more
ORIGINAL RESEARCH article
Front. Earth Sci. , 15 January 2024
Sec. Geohazards and Georisks
Volume 11 - 2023 | https://doi.org/10.3389/feart.2023.1348730
This article is part of the Research Topic Monitoring, Early Warning and Mitigation of Natural and Engineered Slopes, volume III View all 17 articles
Against the backdrop of global climate warming, the issue of flash flood disasters in small watersheds triggered by heavy rainfall is gradually becoming more prominent. Selecting an appropriate hydrological model is crucial for flash flood disaster defense. This article focuses on the Daxi Water Basin in Lianping County, Guangdong Province, as the research area. Firstly, organize the data and subject it to standardization processing. Subsequently, establish the topological relationships within the basin, construct a hydrological model for simulating flood processes in Chinese mountainous regions, and obtain a set of model parameters applicable to the specific basin. The results indicated that: ① the relative errors of flood runoff depth were all less than 7%, with an average of 4.5%; ② the relative errors of peak flow for all events were less than 6%, with an average of 4.2%; ③ peak time errors were all within ±2 h, either earlier or later than the actual peak by 1 h; ④ the Nash-Sutcliffe efficiency coefficient for floods were all greater than 0.8, with an average of 0.86. The research results above will serve as a reference and guidance for flood defense management in the Daxi Water Basin.
Flash flood disaster caused by sudden floods in streams and rivers in hilly areas, which brings losses to humans and the natural environment and constitute one of the most significant natural disasters in China (Zhao, 1995; Liu et al., 2019; Pei et al., 2023). As global climate warming intensifies, the problem of flash floods caused by sudden and localized heavy rainfall in hilly areas has become increasingly prominent, which has had a serious impact on the natural environment and social development, resulting in casualties, property losses, and facility destruction. and environmental damage and other serious consequences (Liu, 2012; Zhou et al., 2022; Ma et al., 2023). For example, in September 2023, floods in Libya caused nearly 13,000 people to die and go missing (Chen and Wei, 2023). Since 2000, the number of deaths due to flash floods in China has accounted for more than 70% of the number of flood deaths every year (Wei et al., 2022); since 2011, the average number of deaths and missing persons caused by flash floods has exceeded 300 per year (Li and Zhao, 2022). China has numerous mountainous areas, dense river networks, and frequent extreme weather, which poses a great threat to flash flood disasters. Among them, the southwest region, South China, and the middle and lower reaches of the Yangtze River have frequent flash flood disasters, and are all high-risk areas for flash flood disasters (Zhao, 1996; Zhao and Fan, 2006; Qiu et al., 2022; Wang et al., 2022); For example, in the first three-quarters of 2023, natural disasters across the country caused nearly 500 deaths and missing persons, more than 80% of which were caused by flash floods and geological disasters; a flash flood in Jinyang, Sichuan alone at the end of August caused 52 deaths and missing persons (Dong, 2023). Therefore, research on flash flood prevention is a focus issue that has attracted much attention at home and abroad.
In the hilly regions, small watersheds are susceptible to the influences of terrain and vegetation. These areas are prone to short-duration heavy rainfall, and the small watershed areas between mountains and streams, with steep riverbed slopes, accelerate the formation of runoff in the watershed. Moreover, rapid fluctuations in water levels lead to significant impacts and erosive effects, resulting in substantial damage from floods in these small watersheds. Additionally, the occurrence of extreme weather events contributes to frequent flooding and waterlogging disasters, primarily concentrated between April and October. Due to the relatively underdeveloped socio-economic conditions in the hilly regions and issues such as low monitoring station coverage, the defense against flood disasters poses significant challenges. The core hydrological models for flood defense have long been the focus of extensive attention. Improving their simulation accuracy remains a key research priority. Hydrological models can be broadly categorized into distributed hydrological models and lumped hydrological models (Liang et al., 2007). Lumped hydrological models treat watersheds of various scales as a homogeneous entity, typically neglecting spatial variations in natural geographical elements and hydrological processes within the watershed. Consequently, they struggle to describe the internal hydrological processes of the watershed. On the other hand, distributed hydrological models consider differences in rainfall and underlying surface conditions across the watershed, allowing for a more realistic representation of the actual hydrological processes within the watershed. Therefore, selecting a hydrological model that suits the characteristics of the watershed is crucial for effective flood defense in hilly regions.
Based on the dynamic mechanisms of the water cycle, distributed hydrological models can effectively simulate and forecast watershed hydrological processes (Wang et al., 2012). In 1969, Freeze et al. (Rui, 2017) proposed the framework for distributed hydrological physics models and elucidated their theoretical foundations, marking the initiation of research into distributed hydrological models. Researchers from France, the United Kingdom, and Denmark (Rui et al., 2006) collaborated to enhance the System Hydrological European (SHE) model, which could investigate issues such as water quality, runoff, and sediment production in European watersheds, considering human activities. Subsequently, various countries developed hydrological models tailored to their specific characteristics, opening up new possibilities for flood prediction (Liu et al., 2003).
With the development of modern science and technology, especially the application of "3S" information technology (Geographic Information Systems, Remote Sensing, Global Positioning System), important methods and technological support have been provided for watershed flood forecasting. Various hydrological models have undergone iterative optimization, the applicability to watersheds has gradually strengthened, and the forecasting effectiveness has progressively improved. This has further enhanced the importance of hydrological models in flood prediction. Combining geographic information system (GIS) technology, the Hydrologic Engineering Center (HEC) model (Halwatura and Najim, 2013) constructed by the United States federal government, using ARCVIEW as the operating platform, achieved the extraction of watershed characteristic parameters and the generation of river networks and watershed vector boundaries. Shen et al. (Shen et al., 1995) proposed a GIS-based distributed rainfall-runoff model, which simulated characteristic values of slope runoff, convergence, and river channel evolution. Ren (Ren and Liu, 1999), in conjunction with a watershed digital elevation model, encoded the river network and sub-basins within the watershed and established the topological relationships. Cao et al. (Pan et al., 2021) utilized hydrological information extracted from a digital elevation model to construct a distributed hydrological model for rivers in the northeastern part of the Qinghai-Tibet Plateau. They also proposed the potential application of LiDAR data in hydrological modeling for small, high-altitude, and cold regions. Koohi et al. (Koohi et al., 2022) explored the applicability of the Global Water Resources Reanalysis (GWRR) dataset for calibrating the VIC-3L distributed hydrological model in the Sefidroud Basin, Iran, providing insights into the use of GWRR data sources for hydrological modeling in data-scarce regions.
In recent years, the application of distributed hydrological models in multi-scale watersheds has become a research hotspot in flood forecasting. Dong et al. (Dong, 2008), using the LL-II fully distributed hydrological model and the Shaanbei model, investigated their application in flood forecasting in semi-arid areas, taking the Taoqupo Reservoir in Shaanxi Province as an example. Xu et al. (Xu et al., 2021), utilizing the Liuxihe model, designed a flood forecasting scheme for the Bai Penzhu Reservoir in Guangdong Province and verified that the forecasting results exhibited strong accuracy. Marahatta et al. (Marahatta et al., 2021) used the SWAT model to simulate the hydrological processes in the Budhigandaki River Basin (BRB) in Nepal, validating the applicability of the SWAT model in data-scarce and complex mountainous watershed areas.
In summary, scholars both domestically and internationally have achieved rich results in hydrological modeling. However, most of the models mentioned above are applicable to large scales and require high-quality measured data for watershed conditions. In China, there are still challenges in small to medium-sized watershed flood forecasting, including weak non-linear adaptability of models, lack of measured data, and human activities interference. The China Institute of Water Resources and Hydropower Research has independently developed the Chinese Flash Flood Hydrological Model. This model integrates a set of nationwide small watershed basic datasets through investigating and analyzing the natural geographical features and hydrological conditions of the watershed. The model has a limited number of parameters, making it suitable for application in small to medium-sized watersheds. Currently, the model has participated in over ten thousand flood simulation tests in different types of terrain across the country, with over 93% of the simulated flood results meeting forecasting requirements (Zhai et al., 2020). The Daxi Water Basin in this study is prone to flash floods, and there is currently limited research on flood simulation in this area, with a lack of experience. By introducing the Chinese Flash Flood Hydrological Model, a set of characteristic parameters suitable for this basin was calibrated and validated. Combined with multiple evaluation indicators, the simulation accuracy is analyzed. This research aims to provide reference and guidance for mountainous flood defense and control in the studied watershed.
The river network system and rainfall-flood monitoring stations in the Daxi Water Basin are concentrated in the eastern Shangping watershed. Therefore, this paper designated the Shangping watershed as the primary study area (Figure 1). The basin is situated in the northeastern part of Lianping County, Guangdong Province. The total area of the basin is 175.95 km2, with the outlet of the basin located at approximately 114.57°E and 24.44°N. The basin spans from the northeast to the southwest, traversing Lianping County, with the terrain rising in the north and lowering in the south. The northern-central part features undulating mountain ranges, belonging to a segment of the Jiulian Mountain Range in Guangdong Province. The valleys between the mountains are deeply cut by flowing water, developing into narrow and deep "V"-shaped valleys. The main valleys, shaped by river erosion and crustal uplift, give rise to relatively smaller "V"-shaped valleys on their side slopes—hanging valleys. The southwestern part is characterized by low hills, fertile soil, and abundant water resources. The research area experiences a subtropical monsoon climate, characterized by simultaneous high temperatures and rainfall during the rainy season. Summers are hot and rainy, while winters are mild and dry. Rainfall gradually increases from March, with the peak concentrated in May and June. Summer is susceptible to heavy rainfall due to convective thunderstorms and typhoon influences, leading to the occurrence of flash floods. The Daxi Water Basin is one of the six main rivers in Lianping County, with a total of 15 major and minor tributaries. The river originates from the Jiaofeng Ridge (elevation 732.9 m) in Zhongcun, Upper Ping Town, and eventually flows into Xinfeng County. The river has a total length of 75 km, a natural drop of 1,070 m, an average slope of 0.0398, and an average annual runoff of 15.95 m³/s.
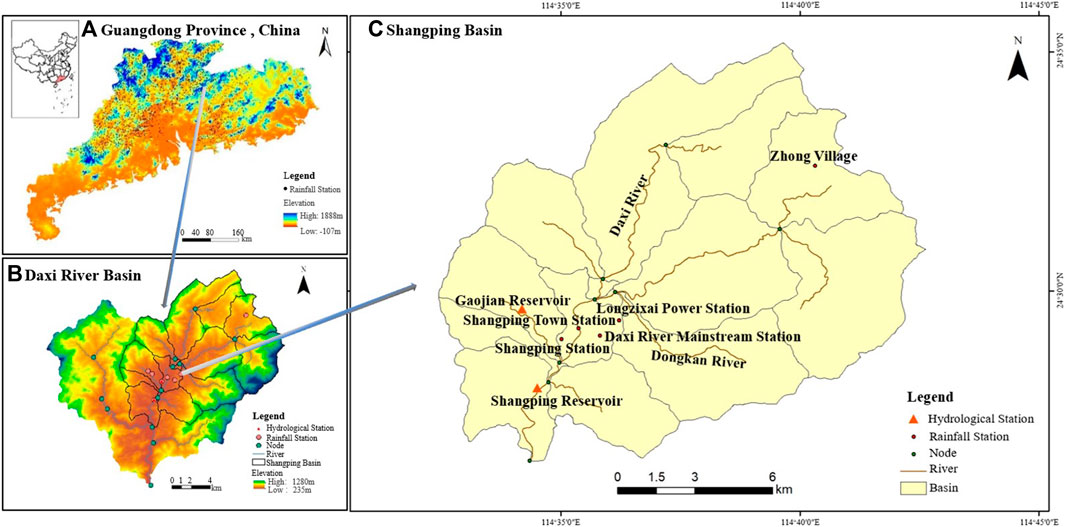
FIGURE 1. Locations of Guangdong Province (A), Daxi Water Basin (B), and Shangping Watershed (C).
This study primarily involves two categories of data for the research area: watershed geographic spatial data and rainfall-flood data. The geographic spatial data include a digital elevation model (DEM) of the watershed, as well as spatial distribution maps for the watershed, river channels, nodes, and monitoring stations. The rainfall-flood data consist of observed rainfall data from various rainfall stations and water level-flow data from the outlet hydrological station in the Daxi Water Basin, spanning from March to July 2019. Specific details are provided in Table 1.
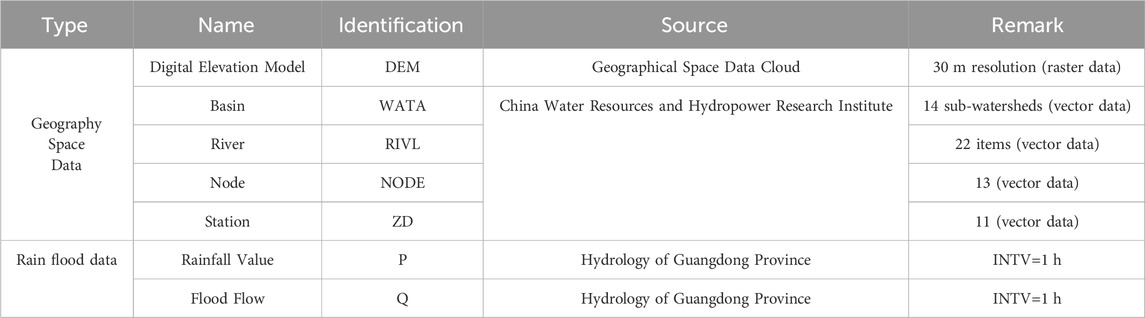
TABLE 1. Daxi Water Basin information.
(1) Chinese Flash Flood Hydrological Model
The Chinese Flash Flood Hydrological Model is built on the basis of natural small watershed attributes, employing modular and hierarchical architectural concepts. It takes the cluster of watershed hydrological relationships, high-precision terrain and topographic data as units, accommodating the characteristics of runoff generation and convergence in different climatic regions. The model establishes a library of multi-process water cycle models, primarily focused on the development of defense against flash floods in small watersheds. It addresses the challenges of nonlinear runoff simulation and computationally efficient modeling under short-duration, intense rainfall conditions. In a certain sense, the Chinese Flash Flood Hydrological Model is a generalized distributed watershed hydrological model. Its hydrological units mainly include watershed, river section, node, water source, watershed divide, reservoir, and depression. The hydrological processes encompass rainfall, runoff generation, hillslope runoff convergence, and flood routing, with runoff generation involving factors such as vegetation interception, evapotranspiration, and soil moisture. The model structure is shown in Figure 2.
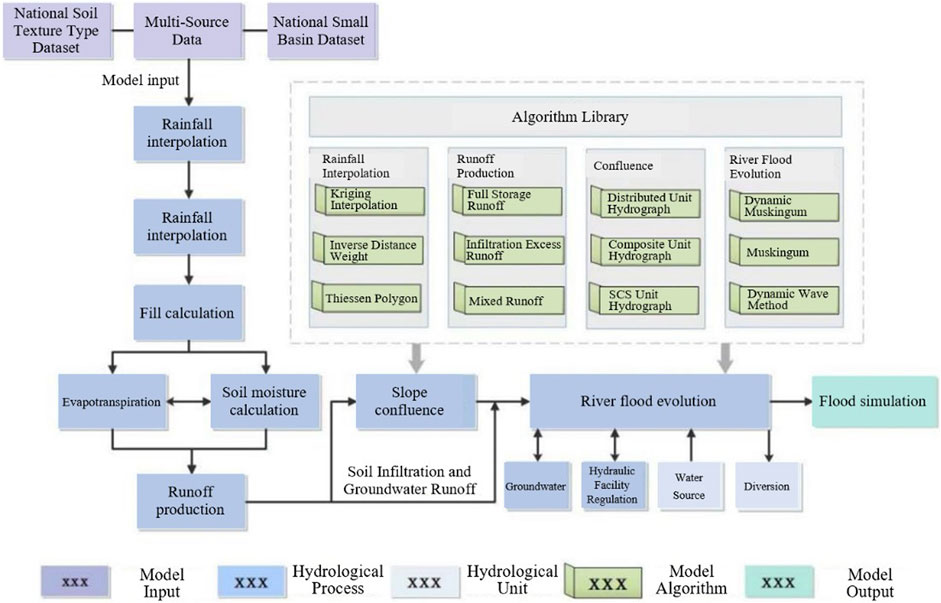
FIGURE 2. China flash flood hydrological model structure diagram.
The Shangping Watershed comprises 14 sub-watersheds, with sizes ranging from 0.4 km2 to 29.03 km2. Within the watershed, there are five rainfall observation stations and two hydrological observation stations. Taking into account the characteristic of the watershed’s terrain being higher in the north and lower in the south, the downstream Shangping hydrological station was designated as the outlet node, and the watershed’s topological structure was established. Given that the Shangping Watershed is located in a humid region, the runoff module primarily employed the Xin’anjiang three-source storage runoff method. The convergence module utilized distributed unit hydrographs extracted and processed from the "National Mountain Flood Disaster Prevention Project" (1), which effectively reflects the phase-based impact of underlying surface and rainfall intensity on flow velocity in various river sections. The river channel evolution module employed the dynamic Muskingum method (2) suitable for small watersheds with limited data availability.
In the equation: V represents the flood flow velocity, measured in meters per second (m/s); Ks is the coefficient used to calculate water flow velocity, measured in meters per second (m/s); S is the specific drop of the river bed in any grid in the basin; i is the dimensionless rain intensity; Tj is the time required for runoff convergence in the j-th grid of the watershed; Mj is the number of grids passed through by runoff convergence in the j-th grid of the watershed; Vm is the flow velocity in the mth grid of the watershed, measured in meters per second (m/s); L m is the length of the river channel passed through by the flood when it traverses the m-th grid; c is the coefficient, taking a value of 1 or
In the equation: K represents the slope of the reservoir storage curve, in terms of elevation (h); Q0 is the reference flow rate, measured in cubic meters per second (m³/s), calculated as Q0 = Qb + 0.5(Qp - Qb), where Qb is the maximum upstream flood flow rate, and Qp is the maximum upstream flood flow rate, both measured in cubic meters per second (m³/s); Vm is the wave velocity, measured in meters per second (m/s); x is the flow ratio coefficient; J is the channel slope; L is the length of the channel, measured in meters (m); N is the Manning’s coefficient. Parameters a and b are determined based on the cross-sectional shape.
(2) Simulation Accuracy Evaluation Index
The article employed three indicators, namely, relative error of runoff depth, relative error of peak flow, and peak timing difference, combined with the Nash-Sutcliffe efficiency coefficient to evaluate the accuracy of flood simulations. According to the 《Hydrological Information Forecasting Specification》, a flood simulation result is considered qualified only if it simultaneously satisfies all error index requirements. The maximum allowable relative errors for runoff depth and peak flow are both 20%, and the permissible error for peak timing difference is ±2 h. The Nash-Sutcliffe efficiency coefficient, approaching 1, indicates better correlation, with the optimal value being 1. If NSE is less than 0, it indicates that the simulation accuracy is worse than the measured average. The formulas for calculating each indicator are shown in Table 2.
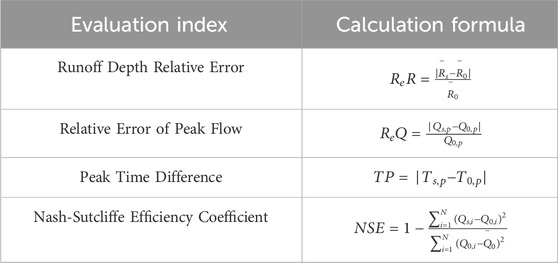
TABLE 2. Calculation formula of evaluation indicators.
In the equation: ‾Rs, Qs,p, Ts,p are the simulated average runoff depth (mm), the simulated peak flow (m³/s), and the simulated peak current (h) respectively; Qs,i is the simulated flow rate at the time i, m³/s; ‾R0, Q0,p, T0,p are the measured average runoff depth (mm), the measured peak flow rate (m³/s), and the actual peak time (h) respectively; Qo,i is the measured flow rate at time i, ‾Q0,i is the average measured flow rate, m³/s.
In this study, the first step involved standardizing data. Subsequently, based on ArcGIS, a digital elevation model of the small watershed was extracted, and the watershed’s topological relationships were established by integrating with the Chinese Flash Flood Hydrological Model system. The model was then constructed using data on watershed soil types, soil textures, and the national dataset of small watersheds. Parameters of the model were calibrated and validated. This entailed analyzing the significance of model parameters and the natural geographic features within the watershed, determining the events for calibration and validation of floods, obtaining specific parameter values, and analyzing their feasibility. Subsequently, a set of model parameters suitable for the study area was simulated. Finally, the accuracy of flood simulations was evaluated using relative error and the Nash-Sutcliffe efficiency coefficient. This evaluation was then used to explore the applicability of the Chinese mountain flood hydrological model in the Da Xi River Basin. The specific research approach is illustrated in Figure 3.
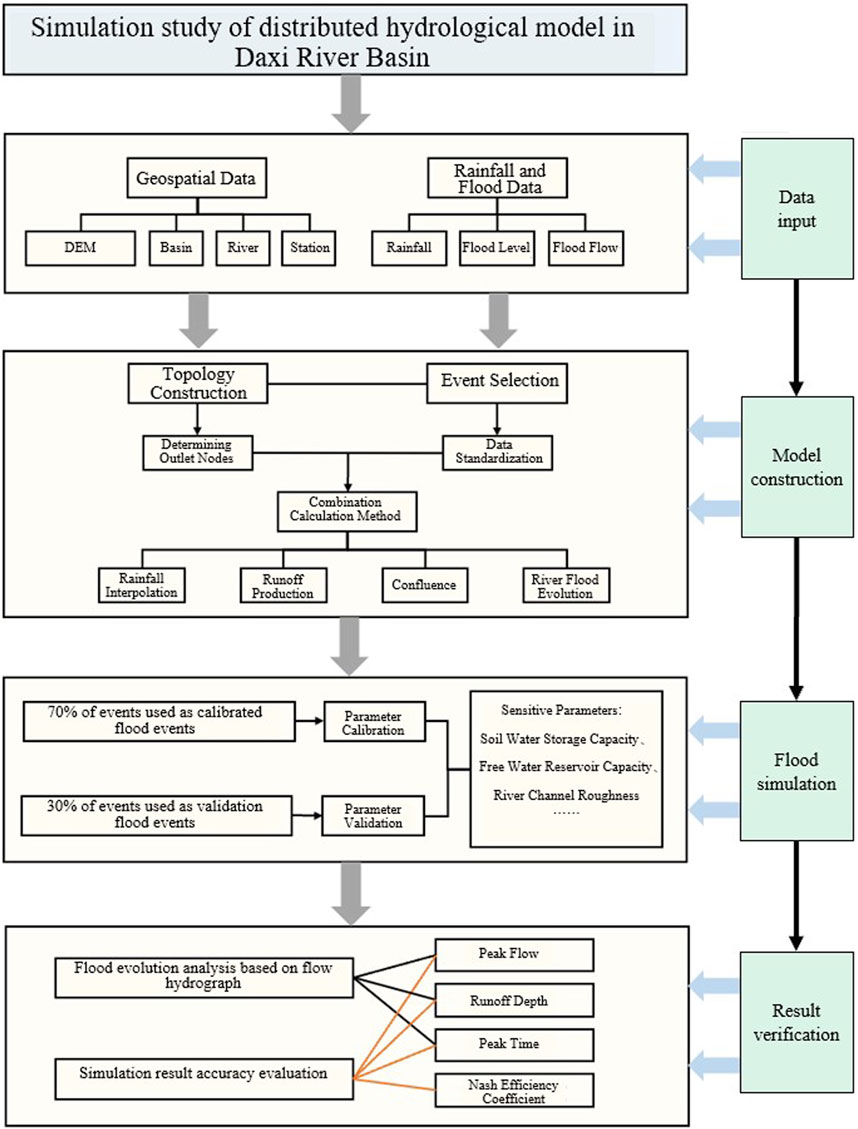
FIGURE 3. Research approach.
By analyzing rainfall-flood data in the Shangping Watershed, representative flood events are selected. Approximately 70% of these events were defined for model calibration, while the remaining 30% were reserved for model validation. Considering the natural geographical features and hydrological conditions of the Shangping watershed, the main model parameters, including upper soil water storage capacity, lower soil water storage capacity, deep soil water storage capacity, and free water storage capacity, were set to 15 mm, 70 mm, 40 mm, and 22 mm, respectively. Figure 4 illustrates the simulation results of the flood events.
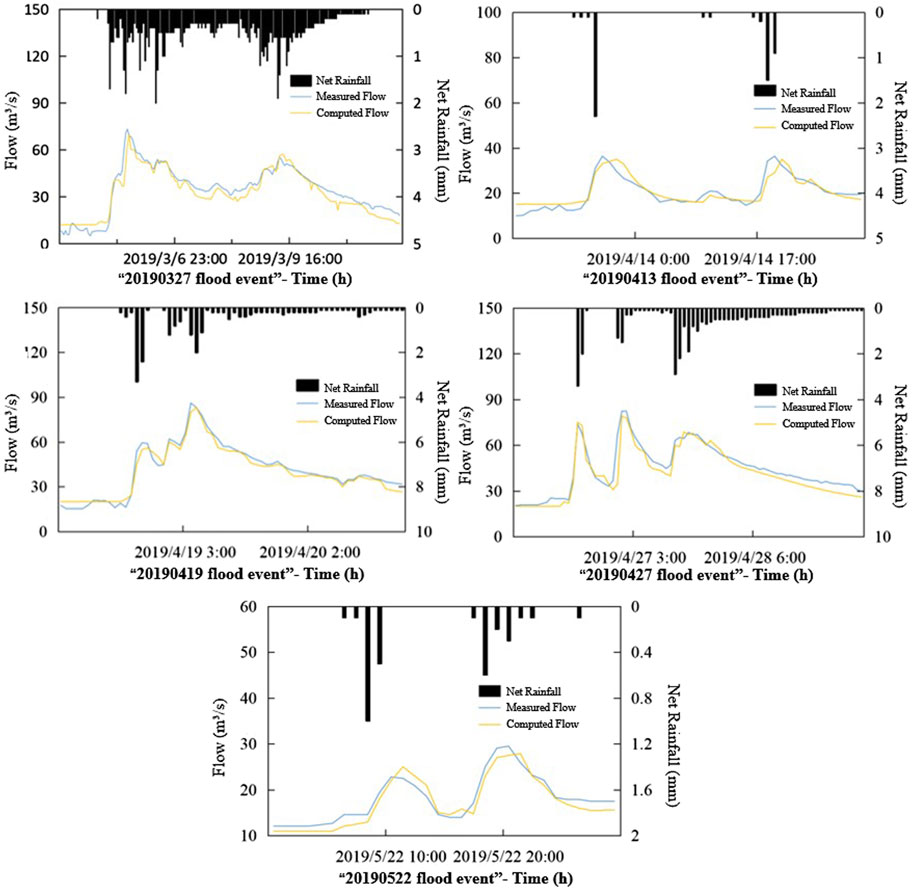
FIGURE 4. Flood simulation results.
The flood event "20190305″ exhibits a double-peak pattern, with an initial flow smaller than other events. The first peak flow occurred at 22:00 on March 5th, reaching 70 m³/s, differing from the actual peak flow by 3.2 m³/s. The rise in flow during the second phase was slower, and the relationship between post-peak flow and time became more linear. The period with significantly higher flow concentrations for the entire flood event occurred from 13:00 on March 5th to 08:00 on March 10th, with good fitting between simulated and actual flow processes during this period.
The flood event "20190413″ is a typical double-peak flood. The simulated peak flows occurred at 22:00 on April 13th and 21:00 on April 14th, reaching 35 m³/s each. The measured peak flows occurred at 21:00 on April 13th and 20:00 on April 14th, both at 36.3 m³/s. Additionally, the intervals between the simulated and measured peak flows were both 23 h. However, the river channel base flow was relatively high during this flood, and the rainfall continuity was not strong, resulting in a relatively gentle fluctuation of the entire flood.
The flood event "20190419″ is a multi-peak flood. Intense rainfall from 19:00 on April 18th to 10:00 on April 19th caused frequent changes in rainfall intensity, leading to significant fluctuations in flood flow along with the rainfall trend. Three peak flow values occurred during this period: 56 m³/s at 21:00 on April 18th, 60 m³/s at 01:00 on April 19th, and the highest flow value of 83 m³/s at 06:00 on April 19th. After the third peak, rainfall rapidly decreased, followed by a stabilizing trend, and the river flow slowly decreased.
The flood event "20190427″ had a slightly higher base flow than other events. The flood initiated rapidly, with the first peak occurring in the second hour (15:00 on April 26th), reaching 75 m³/s. However, the short duration of rainfall led to a sudden drop in flood flow. A second round of rainfall occurred at 00:00 on April 27th, resulting in the second peak flow of this event at 79 m³/s. The third intense rainfall occurred at 13:00 on April 27th, and although the third peak flow was slightly lower than the previous two, the high flow period lasted for 7 h.
The flood event "20190522″ had a shorter duration compared to others, lasting for 1 day. It is a double-peak flood, with the first peak occurring at 12:00 on May 22nd, reaching 25 m³/s. After 10 h, a second peak flow occurred at 22:00 on the same day, reaching 27.9 m³/s. Due to the discontinuous nature of rainfall, the fitting degree between the simulated and actual flood processes for this event was smaller than for other events.
Overall, the routing of the five flood events show strong consistency with the changes in rainfall during the study period. Additionally, all five flood events exhibited significant flow fluctuations before the main peak, and the decrease in flow during the declining phase after reaching the maximum value was slow. Comparing the five flood events, the simulated flow results of the three flood events with more continuous rainfall, namely, "20190305," "20190419," and "20190427," were closer to the measured flow values, indicating better overall simulation performance.
From the statistical results of flood simulation errors (refer to Table 3), it can be observed that all five simulated flood events are qualified: The relative errors in flood runoff depth for all five events were below the maximum permissible error of 10%; the maximum error was 6.1% for the "20190522″ event, while the minimum was 2.4% for the "20190305″ event, with an average of 4.5%. Relative errors in peak flow were below the maximum permissible error of 20% for all five events, accounting for 100%; the maximum error is 5.4%, the minimum is 3.6%, and the average is 4.2%. Four events simulated peak times occurring 1 h later than the observed peaks, while for the "20190427″ event, the simulated peak occurred 1 h earlier than the observed peak; the simulated results were within the maximum permissible error of ±2 h. Nash-Sutcliffe efficiency coefficients for all five events were above 0.8; the maximum was 0.91 for the "20190419″ event, the minimum was 0.81 for the "20190522″ flood, and the average was 0.86, indicating a good correlation between the simulated and actual flood processes.
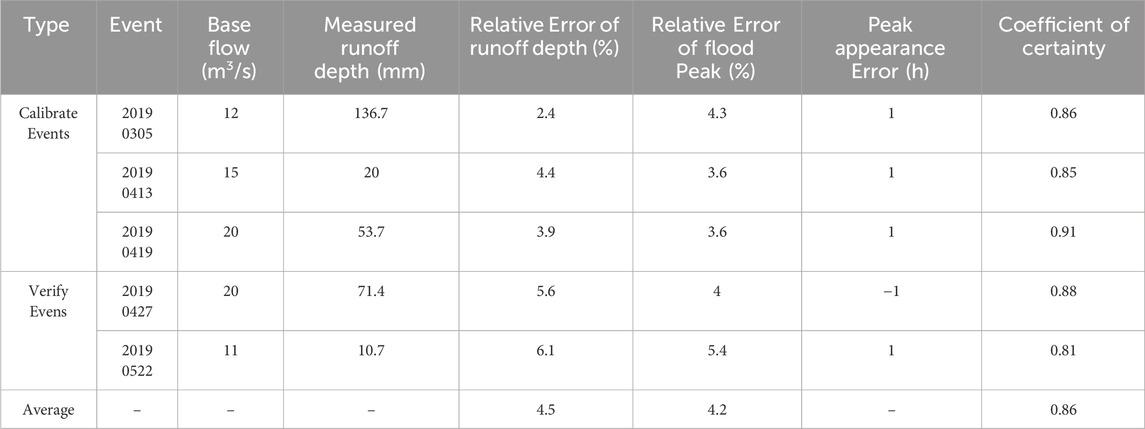
TABLE 3. Simulation error analysis.
Comparing the analysis of the five flood events, for the "20190522″ event, although all error values were within permissible ranges, the errors were relatively large, and the fitting degree between the simulated and actual flow processes was not high. In contrast, for the "20190419″ flood event, both relative errors in runoff depth and peak flow were the lowest, and the Nash-Sutcliffe efficiency coefficient was closest to 1, making it the event with the best simulation performance. The China Flash Flood Model can accurately simulate the flood processes in the Shangping River basin, and the results are reliable.
This study, based on the China Flash Flood Model, conducted flood simulations in small watersheds within susceptible mountainous flood areas and evaluated the model’s applicability. The main conclusions are as follows: ①small watershed river flood processes exhibit strong spatial heterogeneity, in which distributed unit hydrograph can effectively reflect the impact of different rainfall intensities and underlying surface conditions on flood velocity in various river segments; ②there is a strong consistency between flood flow and rainfall intensity variations, but both lag behind the changes in rainfall; ③the relative errors in simulated runoff depth were all below 7%, peak flow relative errors were below 6%, peak timing differences were within 1 h, and Nash-Sutcliffe efficiency coefficients were all above 0.8, showing simulation results were good, and the accuracy was higher for flood events with continuous rainfall. This research provides reference for flood forecasting and control in the studied region. However, the study also faced numerous challenges, including a limited number of flash flood events and the need for a more in-depth analysis of the mechanisms responsible for heavy rainfall. These issues may affect the operational application of the model and hinder a more comprehensive exploration of flood characteristics. In the future, the researchers plan to incorporate machine learning techniques to reveal the flash flood mechanisms, enhance the model’s informatization and intelligence, and provide theoretical and empirical foundations for flash flood simulations in data-scarce regions in China.
The raw data supporting the conclusion of this article will be made available by the authors, without undue reservation.
DW: Writing–original draft. YZ: Writing–original draft. XZ: Writing–original draft. YL: Writing–original draft. QT: Writing–original draft. MM: Writing–original draft.
The author(s) declare financial support was received for the research, authorship, and/or publication of this article. This study was supported by National Natural Science Foundation of China (grant number 42101086, 42271095, 42371086), and Study on flash flood risk assessment method based on ensemble learning (grant number IWHR-SKL-KF202310).
The authors declare that the research was conducted in the absence of any commercial or financial relationships that could be construed as a potential conflict of interest.
All claims expressed in this article are solely those of the authors and do not necessarily represent those of their affiliated organizations, or those of the publisher, the editors and the reviewers. Any product that may be evaluated in this article, or claim that may be made by its manufacturer, is not guaranteed or endorsed by the publisher.
Chen, Z. F., and Wei, Y. (2023). Floods in Libya lead to thousands of deaths-how did all of this happen. Pengpai News 2023. Available at: https://www.thepaper.cn/newsDetail_forward_24565310.
Dong, H. (2008). Application of distributed hydrological model to flood prediction in semi-arid areas. Guangdong Water Resour. Hydropower (1), 4. doi:10.3969/j.issn.1008-0112.2008.01.007
Dong, X. M. (2023). The Ministry of Emergency Management released the national natural disaster situation in the first three quarters of 2023. Yangtze River cloud press, 2023–2110. Available at: https://m.hbtv.com.cn/p/2903053.html.
Halwatura, D., and Najim, M. M. M. (2013). Application of the hec-hms model for runoff simulation in a tropical catchment. Elsevier Sci. Publ. B. V. dol: 46, 155, 162. doi:10.1016/j.envsoft.2013.03.006
Koohi, S., Azizian, A., and Brocca, L. (2022). Calibration of a distributed hydrological model (vic-3l) based on global water resources reanalysis datasets. Water Resour. Manag. 36 (4), 1287–1306. doi:10.1007/s11269-022-03081-9
Li, Y., and Zhao, S. S. (2022). Floods losses and hazards in China from 2001 to 2020. Clim. Change Res. 18(2): 154–165. doi:10.12006/j.issn.1673-1719.2021.196
Liang, Z. Y., Jia, Y. W., Li, K. J., Niu, C. W., and Wang, H. (2007). A review on the application of distributed hydrological model in flood prediction. Huanghe River 29 (2), 4. doi:10.3969/j.issn.1000-1379
Liu, C. M., Li, D. F., Tian, Y., Hao, F. H., and Yang, G. L. (2003). Application of distributed hydrological model based on dem in large scale watershed. Prog. Geogr. Sci. 22 (5), 437–445. doi:10.11820/DLKXJZ2003.05.001
Liu, Y. S., Yang, Z. S., Huang, Y. H., and Liu, C. J. (2019). Spatial and temporal evolution pattern and driving factors of mountain flood disasters in China since the founding of the People’s Republic of China. Sci. China Earth Sci. (02), 408–420. doi:10.1360/N072017-00328
Liu, Z. Y. (2012). Research and application of flash flood warning and forecasting technology. Flood Control Drought Relief China 22 (2), 6.
Ma, S., Qiu, H., Zhu, Y., Yang, D., Tang, B., Wang, D., et al. (2023). Topographic changes, surface deformation and movement process before, during and after a rotational landslide. Remote Sens. 15 (3), 662. doi:10.3390/rs15030662
Marahatta, S., Devkota, L. P., and Aryal, D. (2021). Application of swat in hydrological simulation of complex mountainous river basin (part i: model development). Water 13 (11), 1546. doi:10.3390/w13111546
Pan, Z., Wang, X., Cao, H., Zhou, A., and Sun, Z. (2021). Stream network modeling using Remote sensing data in an alpine cold catchment. Water 13 (11), 1585. doi:10.3390/w13111585
Pei, Y., Qiu, H., Yang, D., Liu, Z., Ma, S., Li, J., et al. (2023). Increasing landslide activity in the Taxkorgan River Basin (eastern Pamirs Plateau, China) driven by climate change. Catena 223, 106911. doi:10.1016/j.catena.2023.106911
Qiu, H., Zhu, Y., Zhou, W., Sun, H., He, J., and Liu, Z. (2022). Influence of DEM resolution on landslide simulation performance based on the Scoops3D model. Geomat. Nat. Hazards Risk 13 (1), 1663–1681. doi:10.1080/19475705.2022.2097451
Ren, L. L., and Liu, X. R. (1999). Application of digital elevation model in river basin topology calculation. Adv. Water Sci. 10 (2), 6. doi:10.3321/j.issn:1001-6791
Rui, X. F. (2017). On watershed hydrological model. Adv. Water Resour. hydropower Sci. Technol. 37 (4), 8. doi:10.3880/j.issn.1006-7647
Rui, X. F., Jiang, C. Y., and Zhang, J. C. (2006). Development of watershed hydrological models. Chin. J. Hydrology 26 (3), 5. CNKI: SUN: SWZZ.0.
Shen, X. D., Wang, L. C., and Xie, S. P. (1995). Raster data based rainfall and runoff model in watershed. Acta Geogr. Sin. 62 (3). doi:10.11821/xb199503009
Wang, L., Qiu, H., Zhou, W., Zhu, Y., Liu, Z., Ma, S., et al. (2022). The post-failure spatiotemporal deformation of certain translational landslides may follow the pre-failure pattern. Remote Sens. 14 (10), 2333. doi:10.3390/rs14102333
Wang, Y., Zhang, B., and Harald, Z. (2012). The European distributed wasim-eth model was applied to simulate the hydrological process of a subtropical agricultural small watershed in southern China. Acta Pedol. Sin. 49 (5), 11. CNKI: SUN: TRXB.0.2012-05-004.
Wei, Y. Q., Sheng, D., Dong, L. Y., and Tan, J. Q. (2022). Research status and development trend of mountain flood disaster prevention and control. China’s flood control drought relief (07), 30–35. doi:10.16867/j.iSSN.1673-9264
Xu, S., Chen, Y., Xing, L., and Li, C. (2021). Baipenzhu reservoir inflow flood forecasting based on a distributed hydrological model. Water 13 (3), 272. doi:10.3390/w13030272
Zhai, X. Y., Guo, L., Liu, R. H., Zhang, Y. Y., and Liu, C. J. (2020). Development and application of mountain flood hydrological model in China: a case study of small and medium-sized river basins in Anhui Province. Chin. J. Basic Appl. Eng. Sci. 28 (5), 19. doi:10.16058/j.issn.1005-0930.2020.05.002
Zhao, J., and Fan, B. L. (2006). Spatial and temporal distribution characteristics of mountain flood disaster in China. China Water Resour. 13, 3. doi:10.3969/j.issn.1000-1123
Zhao, S. P. (1995). Study on system integration method of mountain flood disaster assessment. Geogr. Res. 14 (3), 111. doi:10.11821/yj1995030020
Zhao, S. P. (1996). A preliminary study on the overall characteristics of mountain flood disaster system and its risk zoning in China. J. Nat. Disasters 5 (3), 7. CNKI: SUN: ZRZH.0.1996-03-014.
Keywords: flash flood, flood simulation, distributed hydrological model, Daxi Water Basin, flood prevention
Citation: Wang D, Zhou Y, Zhang X, Liu Y, Teng Q and Ma M (2024) Simulated research on distributed hydrological models–a case study of the Daxi Water Basin. Front. Earth Sci. 11:1348730. doi: 10.3389/feart.2023.1348730
Received: 03 December 2023; Accepted: 21 December 2023;
Published: 15 January 2024.
Edited by:
Haijun Qiu, Northwest University, ChinaCopyright © 2024 Wang, Zhou, Zhang, Liu, Teng and Ma. This is an open-access article distributed under the terms of the Creative Commons Attribution License (CC BY). The use, distribution or reproduction in other forums is permitted, provided the original author(s) and the copyright owner(s) are credited and that the original publication in this journal is cited, in accordance with accepted academic practice. No use, distribution or reproduction is permitted which does not comply with these terms.
*Correspondence: Meihong Ma, bWFtaEB0am51LmVkdS5jbg==
†These authors share first authorship
Disclaimer: All claims expressed in this article are solely those of the authors and do not necessarily represent those of their affiliated organizations, or those of the publisher, the editors and the reviewers. Any product that may be evaluated in this article or claim that may be made by its manufacturer is not guaranteed or endorsed by the publisher.
Research integrity at Frontiers
Learn more about the work of our research integrity team to safeguard the quality of each article we publish.