 Pengxiang Li
 Zongwen Wang3
95% of researchers rate our articles as excellent or good
Learn more about the work of our research integrity team to safeguard the quality of each article we publish.
Find out more
ORIGINAL RESEARCH article
Front. Earth Sci. , 09 January 2024
Sec. Geohazards and Georisks
Volume 11 - 2023 | https://doi.org/10.3389/feart.2023.1348366
This article is part of the Research Topic Evolution Mechanism and Control Method of Engineering Disasters Under Complex Environment View all 30 articles
Ruihai gold mine is a super large underwater gold mine with an initial mining depth of more than 1,400 m. Deep mining may face rockburst disaster. In order to scientifically control the potential rockburst risk, ensure the safety of underground personnel and equipment, and realize the safe and efficient mining of the mine, it is necessary to evaluate the rockburst risk of the mine and formulate appropriate rockburst risk warning and mitigation strategies. XRD mineral composition analysis and conventional rock mechanical tests were carried out on the parent rock granite samples. The results show that there are differences in the lithologic composition and rock mechanics parameters of the three colors of granite, which are preliminarily determined as three kinds of granite; The rockburst tendency of three kinds of granites is evaluated by using three classical rockburst criteria, and the discrimination results of the three rockburst criteria are not completely consistent or even contradictory. The application limitations rockburst risk assessment based on index criteria are discussed and analyzed in detail. It is proposed to apply microseismic monitoring technology to warn and manage the rockburst risk of Ruihai gold mine in development and mining stages, and put forward microseismic monitoring layout schemes and targeted rockburst prevention and control measures in different stages. The research results can provide reference for similar projects.
With the depletion of shallow mineral resources, more and more mines are entering the deep or even ultra-deep mining areas (Cai and Brown, 2017; Liu et al., 2023). The frequent occurrence of rockburst disasters induced by high stress in deep mining areas has become a prominent issue. Rockburst is a complex dynamic geological disaster in which the elastic strain energy accumulated in the rock mass suddenly releases due to excavation or other external disturbances under high stress environment, leading to rock fracturing and ejection. It can cause serious casualties and equipment damage (Feng, 2017; Li et al., 2019a; Li et al., 2023a; He et al., 2023).
Extensive research has been conducted on rockburst mechanism, early warning and control since the first record of rockburst in the 19th century. However, rockburst is a global challenge, and its mechanism remains not adequately understood, even reaching a consensus on its definition (Kaiser and Cai, 2012; Feng, 2017; Li et al., 2019b). In terms of rockburst warning, scholars have proposed various empirical criteria and assessment methods for evaluating rockburst risk based on the factors affecting rockburst occurrences (Zhou et al., 2018; Li et al., 2019a; Gong et al., 2020; He et al., 2023). These include criteria such as Russense criteria (Russenes, 1974), Barton criteria (Barton et al., 1974), Hoek criteria (Hoek and Brown, 1980), strain energy storage index (Kidybinski, 1981), potential energy of elastic strain (Wang and Park, 2001), residual elastic energy index (Gong et al., 2021), rock brittleness index (Xu and Wang, 1999), brittle deformation coefficient (Zhang et al., 2017), distance discrimination method (Gong and Li, 2007), artificial neural network method (Wang et al., 2024), etc. These criteria and assessment methods have greatly guided the prevention and control of rockburst risks and have achieved good economic and social benefits. They have played an important guiding role, particularly in formulating strategies for rockburst prevention and control, mine development design, selection of mining methods and mining processes, and design of support methods (Mazaira and Konicek, 2015; Leveille et al., 2017). With the continuous deepening of research on rockburst and the development of scientific technology, rockburst risk on-site monitoring technology is increasingly being applied to rockburst risk management of mines. On site monitoring mainly involves directly or indirectly monitoring a series of parameters such as stress, deformation, and damage of the surrounding rock mass, in order to evaluate and infer the risk of rockburst. Microseismic monitoring technology can detect the elastic waves generated by small fractures in rock masses. These elastic waves contain valuable information about the internal stress and fracture development trends of the rock mass (Li et al., 2019b; Zhao et al., 2022; Zhao et al., 2023). By monitoring and analyzing microseismic events (each elastic wave is considered a microseismic event) during the process of rock fracture damage, it is possible to infer the degree of damage and development trends of the rock mass, thereby achieving the prediction and early warning of rockburst disasters. Microseismic monitoring has the characteristic of 24-h continuous real-time monitoring. Microseismic technology has become an important means of early-warning and controlling rockburst disasters (Li et al., 2023b; Kan et al., 2023).
The Ruihai gold mine is characterized by “large mine reserves, large investment capital, long investment cycle, and long construction period”. The designed mining capacity of the mine is 3.96 million tons per year, and the initial mining depth can reach over 1,400 m. It is a super-deep buried mine of a large scale. Deep mining may face the risk of rockburst disasters. To scientifically manage and control the potential rockburst risks, ensure the safety of underground personnel and equipment, and achieve safe and efficient mining of the mine, it is necessary to assess the rockburst risks of the mine and develop appropriate rockburst risk prevention and control strategies to realize the construction of a first-class modern mine.
In this paper, the samples of granite from Ruihai gold mine were separated into three sub-rock types based on XRD rock composition results, and uniaxial compression experiments were conducted on the three types of granite to obtain the basic mechanical parameters of the rocks. Then, rockburst tendency criteria such as rock brittleness criteria, deformation brittleness coefficient, Barton criteria were applied to determine the rockburst tendency of the three types of rocks. The results show that the three types of rocks have different degrees of rockburst risk, and it is necessary to warn and control rockburst risk based on rock type. The results also indicate that using different rockburst criteria for the same type of rock may yield different or even contradictory rockburst risk determination results, and the limitations of rockburs tendency criteria are discussed. Finally, considering the limitations of rockburst index criteria and the need for real-time warning in mines, the microseismic monitoring technique is then to be appliedto conduct comprehensive microseismic rockburst monitoring and early warning during the development and mining stages of the Ruihai gold mine. The layout plan for microseismic monitoring at different stages and specific rockburst prevention and control measures were determined. The research results have important guiding significance for the Ruihai gold mine and other similar projects, and can provide strong support for the construction of the first-class inherently safe mines.
The Ruihai gold mine is located in the northern part of Laizhou City and is currently the largest single rock gold deposit discovered in China. The total ore resource of the mine is about 114 million tons, with a gold resource reserve of more than 470 tons and an average grade of Au 4.12 g/t. The designed mining and selection capacity of the mine is 3.96 million tons per year, making it a super-large mine. Most of the ore bodies in the mine are buried at a depth of over 1,000 m, and the first mining area at the −1,480 section is over 1,400 m deep. During the production period, mining will continue to go deeper, and the mining depth will exceed 1,800 m. The mining of ultra-deep mines is very likely to induce rockburst and other problems, which pose a great threat to safety production, seriously endangering the lives and equipment safety of on-site personnel, and also causing a large amount of resources to be unrecoverable, becoming permanent losses.
The Ruihai gold deposit is completely located in the submarine rock formation, making it an underwater mining operation. The rock type of the mine is relatively uniform, with the roof and floor of the deposit consisting of schistose granite, schistose fractured rock, and pyrite schistose granite fractured rock. The rocks are relatively hard, and there is a risk of rockburst. The engineering geological conditions of the deposit depend on the degree of development of the rock structure. The fault structures in the area are well developed, and the local rocks within the fault zone are more fragmented, strongly altered, and have more developed fractures and broken cores, making them relatively unstable. Overall, the fault structures in the mining area are well developed, and the surrounding rocks near the deposit are relatively stable. However, there are some areas where engineering geological problems such as block falling and collapse are prone to occur, and the impact is severe. The complexity of the engineering geological conditions in the mining area is moderate.
The surrounding rock of the ore body is mainly granite. We conducted conventional mechanical tests on the granite to assess its tendency for rockburst, in order to scientifically control the potential risk of rockburst. The granite samples were taken from the 1,300–1,480 level of the Ruihai gold mine, and more than 30 granite blocks were obtained. In the laboratory, diamond drill bits were used to drill rock cores, which were then processed into the following specimens using a cutting and grinding machine: the sample size for uniaxial compression strength (UCS) test was 50 mm × 100 mm, and the size of for Brazilian tensile strength (BTS) test was 50 mm × 25 mm. The ends and sides of the specimens were carefully ground, and the non-parallelism and non-perpendicularity were both less than 0.02 mm. The accuracy of the specimens met the experimental specifications recommended by the International Society for Rock Mechanics (ISRM). The rock specimens are shown in Figure 1.
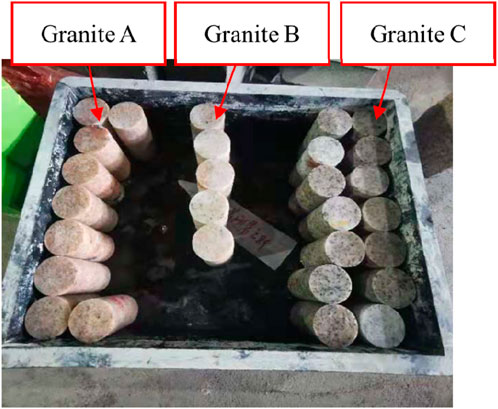
FIGURE 1. Rock specimens for tests.
During the processing, it was found that the granite specimens showed three different colors, which may be three different types of granite, as shown in Figure 1. For the time being, we named them Granite A, Granite B, and Granite C, in order to further analyze the differences in rock types, X-ray diffraction (XRD) analysis was performed on the three colors of granite, and the analysis results are shown in Table 1.
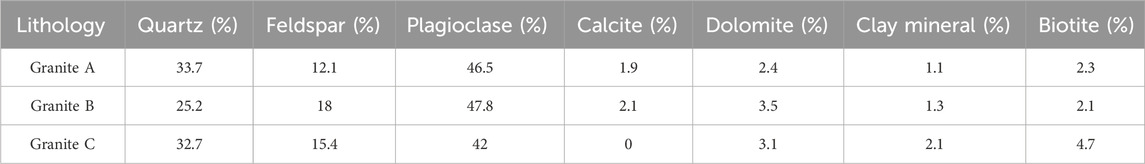
TABLE 1. Analysis results of X-ray diffraction composition of three types of granite.
From the analysis results in Table 1, it can be seen that the rock composition of the three colors of granite differs significantly, and it can be determined that they are three different types of granite. Therefore, when conducting rock mechanics experiments, they need to be classified for testing. A total of 28 standard rock specimens for uniaxial compression strength test were processed, including 9 Granite A, 5 Granite B, and 14 Granite C specimens. There were also 5 Brazilian tensile strength test specimens for Granite A and Granite C, respectively.
The equipment used in this experiment was the ZTRE-210 microcomputer-controlled rock triaxial testing system produced by Changchun Zhantuo Experimental Instrument Co., Ltd., as shown in Figure 2. Displacement control was used to apply loading to the rock samples for uniaxial compression test and Brazilian tensile test, with a loading speed of 0.0002 mm/s. The purpose of the uniaxial compression test was mainly to obtain the basic mechanical parameters of the rock and to determine its rockburst tendency, while the purpose of the Brazilian tensile test was mainly to obtain the tensile strength of the rock. Five standard specimens were selected for uniaxial compression strength tests for each type of granite, and five Brazilian disc specimens were selected for Granite A and Granite C for Brazilian tensile strength tests (there is no Brazilian tensile test samples for Granite B).
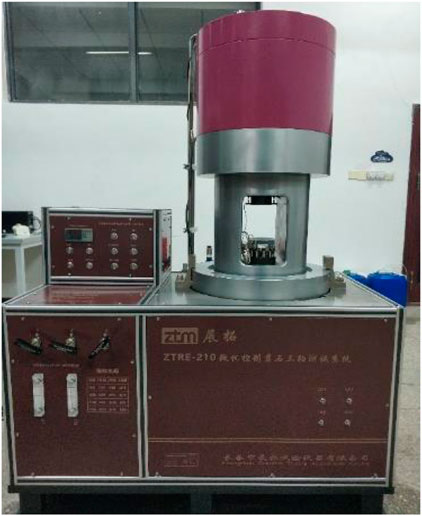
FIGURE 2. Test equipment for the samples.
During the experimental process, varying degrees of rock powder and debris were observed to be ejected from all three types of granite, accompanied by sound and large rock fragments being ejected when sample failure approached. Overall, the above conditions were more pronounced in Granite C, followed by Granite A, and finally Granite B. The failure modes of the three types of granite are shown in Figures 3A, 4A, 5A.
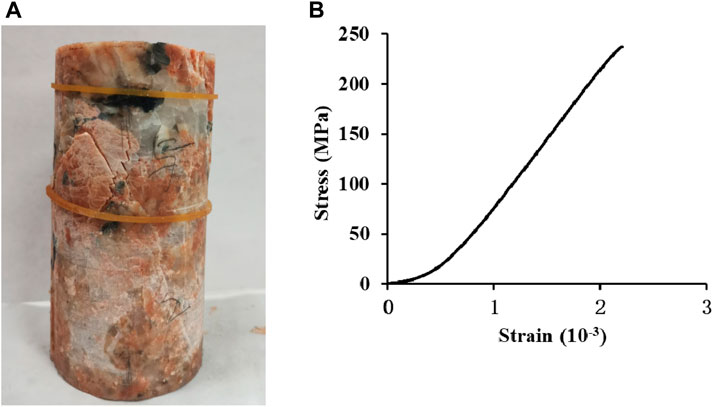
FIGURE 3. Results of uniaxial compression test on granite A. (A) Typical failure forms, (B) Stress-strain curve.
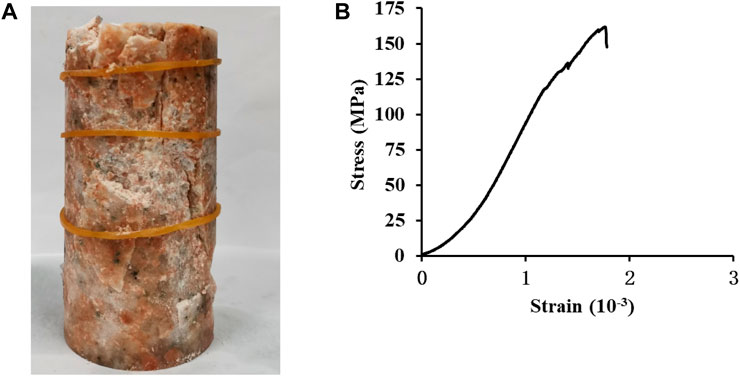
FIGURE 4. Results of uniaxial compression test on granite B. (A) Typical failure forms, (B) Stress-strain curve.
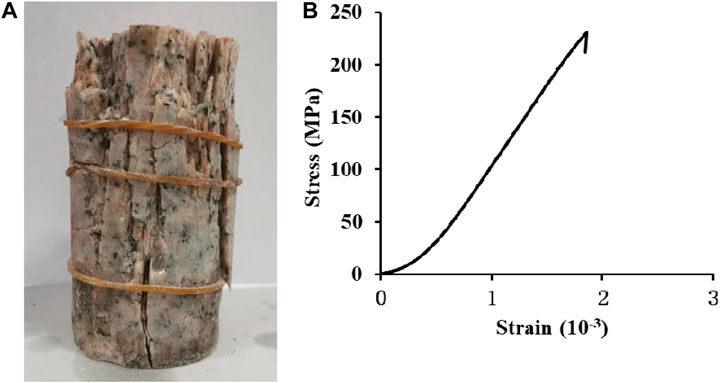
FIGURE 5. Results of uniaxial compression test on granite C. (A) Typical failure forms, (B) Stress-strain curve.
Figures 3B, 4B, 5B show the typical full stress-strain curves of the three types of granite. It can be seen from the figures that the ultimate strain of the three types of granite is less than 3‰, with Granite B and C having an ultimate strain of less than 2‰, which is typical of brittle rocks. This can also be seen from the characteristics of rock failure in Figures 3A, 4A, 5A, where the rocks exhibit tensile and brittle failure. Due to the high strength and strong brittleness of the rocks, although the control of the loading speed at 0.0002 mm/s, only a small amount of post-peak deformation was observed in some of the rock samples. The basic mechanical parameters of Granite A, Granite B, and Granite C are shown in Table 2.
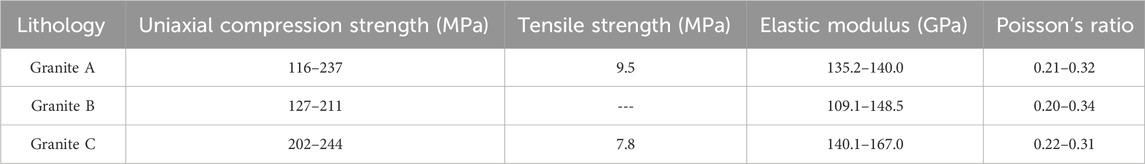
TABLE 2. Mechanical parameters of intact granite rocks.
Using typical rockburst tendency criterions such as rock brittleness criteria (Xu and Wang, 1999), deformation brittleness coefficient (Zhang et al., 2017), and Barton criteria (Barton et al., 1974), a prediction of rockburst risk was made for the Ruihai gold mine. The expressions and discrimination intervals of the criterions are shown in Table 3.
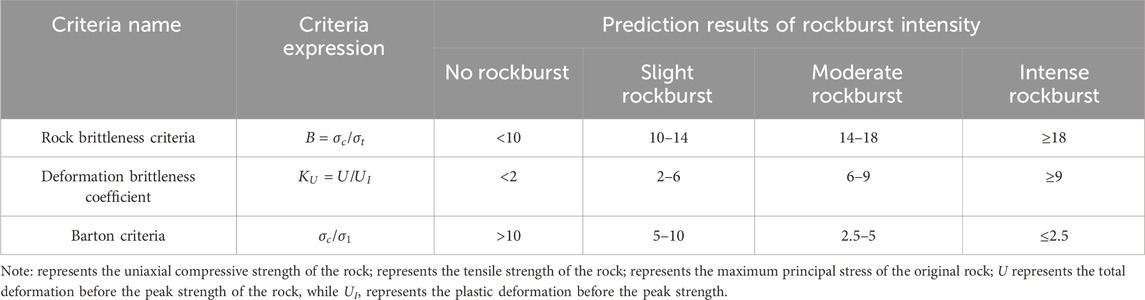
TABLE 3. Typical criteria for evaluating rockburst risks.
According to the experimental parameters of rock mechanics in section 3.3, the rock brittleness criterion B and the deformation brittleness coefficient KU were applied to determine the rockburst tendency of three types of granite. The determination results of granite A, B, and C are shown in Tables 4–6. It can be seen from Tables 4–6 that the rockburst risk of granite C is moderate to intense, the rockburst risk of granite A is slight to intense, and the rockburst tendency of granite B is slight to moderate. The rockburst tendency of granite C is greater than that of granite A, and the rockburst tendency of granite A is greater than that of granite B.
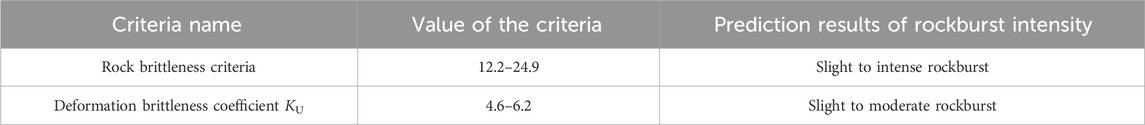
TABLE 4. Prediction results of rockburst tendency of granite A.

TABLE 5. Prediction results of rockburst tendency of granite B.
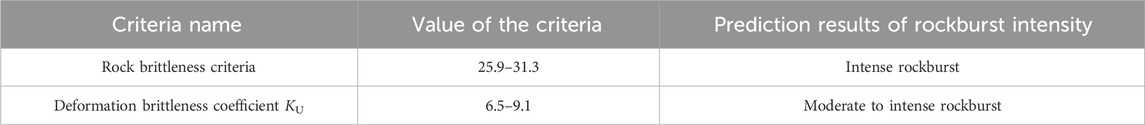
TABLE 6. Prediction results of rockburst tendency of granite C.
According to the in situ stress test results of the 2# drill hole of the Ruihai gold mine, the stress field in the exploration area is mainly dominated by horizontal stress, and the ratio of maximum horizontal principal stress SH to vertical principal stress Sv is 1.06–1.41, with an average of 1.24. The ratio of the two horizontal principal stresses is 1.19–1.54, with an average of 1.37 (Peng and Sun, 2016). The maximum value of the horizontal principal stress is 12.61–39.74 MPa, and the minimum value of the horizontal principal stress is 10.64–28.89 MPa.
From Figure 6, it can be observed that the two horizontal principal stresses and the vertical principal stress increase with the increase of the overlying rock layer thickness or burial depth, and they show a basically linear relationship. The linear regression equations for the maximum (SH) and minimum (Sh) horizontal principal stresses of each measuring point in drill hole 2 of the gold mine in the northern waters of Sanshan Island are as follows:
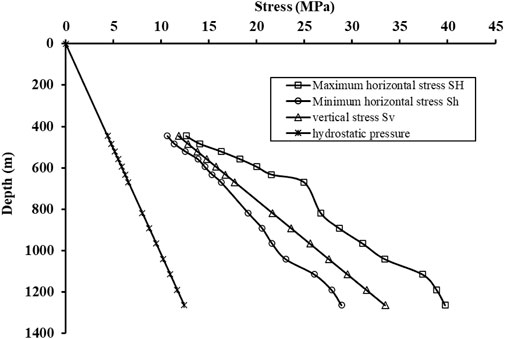
FIGURE 6. Diagram of the variation of principal stress values with depth (Results from number 2 borehole).
SH = 0.74+0.033D
Sh = 1.08+0.022D
Sv = 0.00+0.027D
Where D is the depth of the drill hole (positive downwards), m; SH is the maximum horizontal principal stress, MPa; Sh is the minimum horizontal principal stress, MPa; Sv is vertical principal stress, MPa.
Based on the fitting relationship between the stress and depth, it can be inferred that the maximum principal stresses in the −1,480 and −1,300 levels are 49.6 and 43.6 MPa, respectively. By applying the rock mechanics parameters and stress conditions to the Barton criterion, the rockburst risks in the two sections can be predicted, as shown in Tables 7, 8. From the tables, it can be seen that in the −1,480 level, Granite A has a moderate to intense rockburst risk, Granite B and Granite C have a moderate rockburst risk; in the −1,300 section, Granite A and Granite B have a moderate rockburst risk, and Granite C has a slight to moderate rockburst risk.
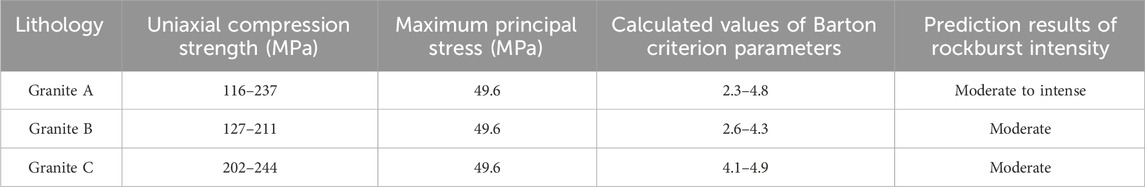
TABLE 7. Prediction results of rockburst intensity for 1,480 level using Barton Criterion.
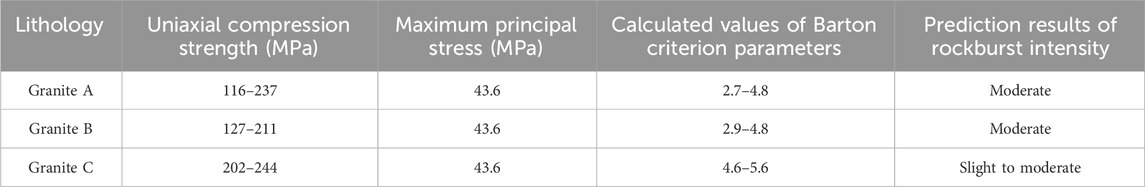
TABLE 8. Prediction results of rockburst intensity for 1,300 level using Barton Criterion.
From the deformation brittleness coefficient, rock brittleness criterion, and Barton criterion for the rockburst tendency determined results of Granite A, Granite B, and Granite C, it can be seen that all three criterions indicate that there is a risk of rockburst occurrence in these three types of granite. However, it can also be observed that different criterions may lead to inconsistent or even different rockburst risk assessments for the same type of granite. For example, when using the deformation brittleness coefficient KU criterion, granite C has the highest rockburst risk among the three types of granite, with a moderate to strong rockburst risk. However, when using the Barton criterion, granite C has the lowest rockburst risk among the three types of granite, with a slight to moderate rockburst risk at −1,300 level. Different criteria seem to lead to some contradictions in the rockburst risk levels assigned to the same rock. In fact, despite a series of explorations and studies by domestic and foreign scholars on rockburst, the understanding of the mechanism of rockburst and the warning of rockburst has been deepening. However, because rockbursts are an extremely complex dynamic phenomenon, there is still no unified understanding of the mechanism of rockburst.
Although there are many rockburst criterions at present, these criterions are mostly single factor criterion that are considered one-sided and do not consider the necessary and sufficient conditions for rockburst occurrence, namely, the external driving force of rockburst occurrence, i.e., stress conditions, and the internal conditions for rockburst occurrence, i.e., the inherent energy storage and consumption characteristics of the rock. For example, criterions such as the Barton criterion, Russense criterion, and Hoek criterion criterion only consider stress conditions, without considering whether the rock itself has a tendency to rockburst. Energy and rock brittleness criteria, such as rock brittleness criteria, deformation brittleness coefficient, impact index KE, and strain energy index Wet, only consider whether the rock mass itself has a tendency to rockburst, without considering whether the external driving force of stress conditions for rockburst occurrence has been reached. Both of the above criterions may lead to misjudgments of the occurrence level of rockburst. For example, in the first type of situation, the external driving force may reach the conditions for rockburst occurrence, but if the rock does not have a tendency to rockburst (such as soft rock), then the rockburst will not occur. In the second type of situation, although the rock itself is judged to be prone to rockburst, if the external driving force does not reach the rockburst threshold, then the rockburst will not occur, either. The above stress factors (external conditions) and the rock’s own rockburst tendency (internal conditions) are both necessary conditions rather than sufficient conditions for rockburst. Rockburst can only occur if the above two conditions are met at the same time. Moreover, the above conclusion is only obtained at the experimental scale. Due to the complexity of engineering rock masses, such as local stress changes, variable rock structures, and geological conditions, the above indicators have certain limitations in predicting and warning rockburst. However, rockburst criterions still have important significance, as they can provide guidance for mine design, roughly delineate key areas of concern for rockburst, and develop rockburst prevention and control strategies.
Based on the above sections, it is evident that the Ruihai granite has a tendency for rockburst under all three criterions, and some even assess it as having a high level risk of rockburst. Therefore, it is necessary to carry out on-site monitoring to conduct daily risk management and control of rockburst.
Based on previous engineering experience and in combination with the microseismic monitoring methods recommended by the ISRM (Xiao et al., 2016), a new generation of high-precision intelligent microseismic monitoring system for rock fracture produced by Hubei Seaquake Technique Co., Ltd was selected. This system can continuously monitor rockburst disasters in rock engineering for 24 h, achieving real-time automatic data acquisition, analysis, and positioning of microseismic data. It can obtain micro-fracture information of the entire process of rockburst disaster incubation, providing a basis for the evaluation of rock mass stability and disaster warning and prediction, and providing technical support for engineering management and rockburst prevention and control. The hardware of the microseismic monitoring system mainly includes sensors, data acquisition devices, communication devices, time synchronization servers, and data servers. Some hardware is shown in Figure 7. The sensor converts the ground motion (ground velocity or acceleration) into a measurable electrical signal. The data acquisition device is responsible for converting the analog electrical signal from the sensor into a digital signal, and then transmitting the data to the data server for analysis and processing through the communication equipment.
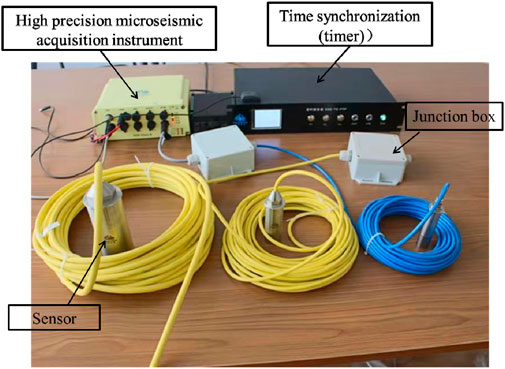
FIGURE 7. Hardware of microseismic monitoring system.
The software of the microseismic monitoring system mainly consists of system configuration management software, microseismic waveform data processing software, microseismic event visualization and interpretation software, and real-time display software for microseismic events, as shown in Figure 8.
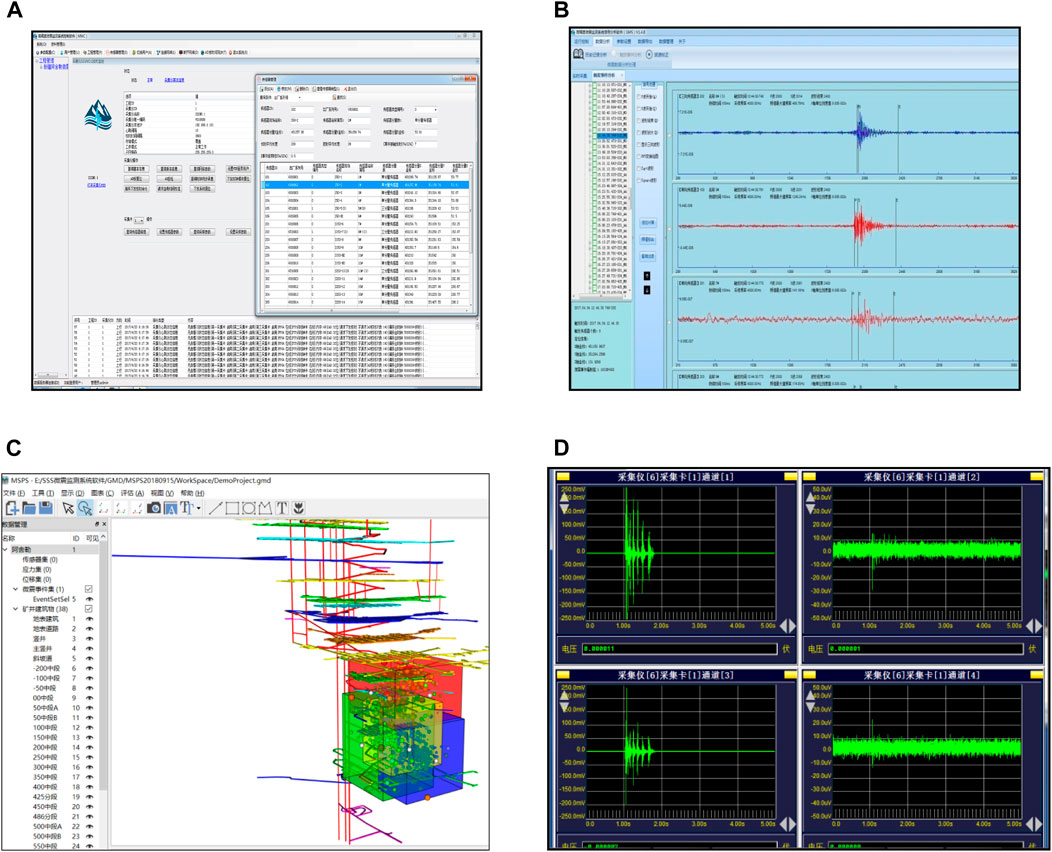
FIGURE 8. Software of microseismic monitoring system. (A) system configuration management software, (B) microseismic waveform data processing software, (C) microseismic event visualization and interpretation software, (D) microseismic waveform real-time display software.
The design of the development roadway excavation adopts the drilling and blasting method. Considering the characteristics of linear engineering of the development roadway and the optimized layout of the sensor array, combined with previous successful sensor layout schemes, the microseismic monitoring plan is as follows: one microseismic acquisition device and six microseismic sensors will be installed in the development roadway, including five uniaxial sensors and one triaxial sensor. Each sensor has a natural frequency of 10 Hz, a response ranging from 10 to 2,000 Hz, and a sensitivity of 100 V/m/s. They will be arranged in two cross-sections, with three sensors in each cross-section. The installation of the I-I monitoring section is selected at a distance of about 50–60 m from the working face (the specific distance depends on the on-site construction conditions), with the No. 1 sensor being a triaxial sensor and the other two being uniaxial sensors. The borehole depth for sensor installation is 2–3 m. The tunnel is excavated 40 m forward, which means that the I-I monitoring section is about 90–100 m away from the tunnel face. A second monitoring Section II-II is arranged at a distance of about 50–60 m from the tunnel face (the specific distance depends on the on-site construction conditions). Sensor 3 is a triaxial sensor, and the other two are uniaxial sensors. As the tunnel continues to excavate another 40 m, the I-I section sensor is about 130–140 m away from the face. The I-I section sensor is recovered and arranged at a distance of about 50–60 m from the face. This cycle continues, and every 40 m of excavation, the last row of sensors is recovered and arranged at a distance of about 50–60 m from the face until the tunnel excavation is completed. To improve monitoring performance, it is planned to adopt an interlaced arrangement of sensors within the section, that is, the adjacent sensors within the section are spaced apart by 2–4 m. At the same time, when the sensors move, the two sensors on the left wall (or right wall) are replaced by the two sensors on the right wall (or left wall), so that the sensors are arranged in a spiral alternating pattern. The specific layout plan is shown in Figures 9, 10.
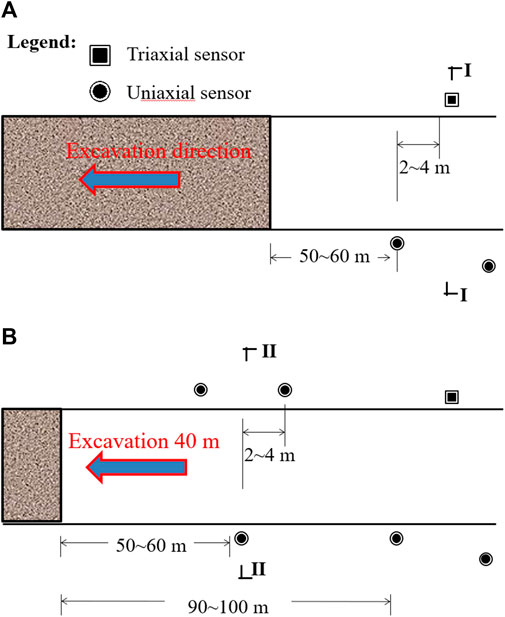
FIGURE 9. Plan layout of microseismic monitoring sensors. (A) Initial monitoring stage (single row sensor), (B) Normal monitoring stage (dual row sensors).
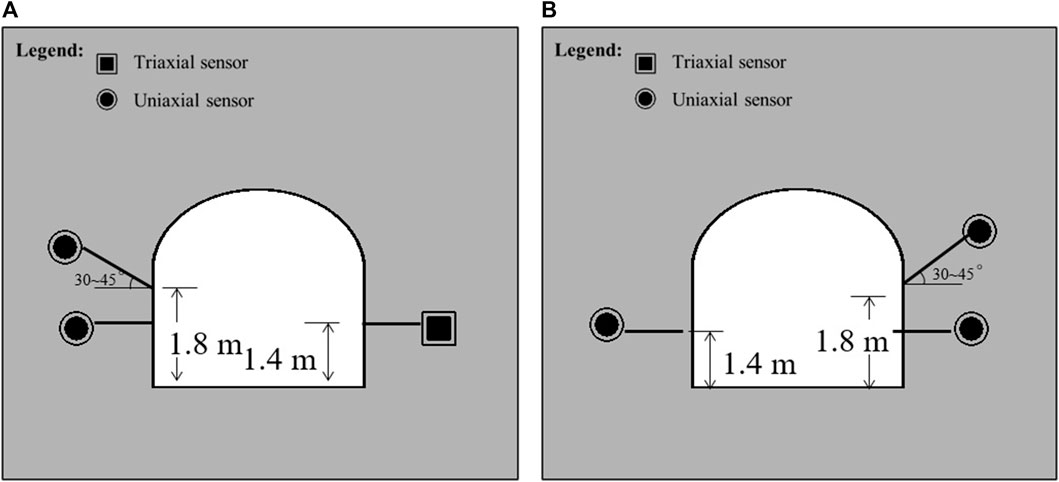
FIGURE 10. Sectional layout of microseismic sensors. (A) section I-I, (B) section II-II.
After the installation of the microseismic monitoring system, the rockburst risk of the roadway can be quantitatively predicted by rockburst warning formula based on the microseismic information recommended by the Technical Specification for Rock Burst Risk Assessment of Hydropower Engineering. This warning method can provide different levels of rockburst risk probability (Chen et al., 2015; Hydropower et al., 2019). When the potential rockburst risk is high, the basic excavation strategy of “short footage and weak blasting” should be followed. At the same time, measures such as destress boreholes and destress blasting can be taken, and strengthened support measures such as “Combining active and passive support, using rigid-flexible support together, and combining multiple support methods” can be used. When there is an extremely high level of rockburst risk, measures such as evacuation and suspension of construction should be taken.
The first mining area is located in the −1,480 level, which is deeply buried. According to empirical rockburst criteria, the level of rockburst tendency is relatively high, and the volume of the mined rock mass in the mining area is large. The stress adjustment of the surrounding rock is bound to be severe, and the maximum tangential stress can be several times higher than the original rock stress. Therefore, the occurrence probability of rockburst with high intensity is relatively high.
Taking into account factors such as the distribution of the ore body and key monitoring areas (ore body enrichment area), mining methods and processes, tunnel space layout, coverage of microseismic sensors, and distribution arrays of sensors, a sensor encryption and more triaxial sensor layout plan will be implemented in the key monitoring areas. The specific sensor layout plan is as follows: Firstly, a triaxial sensor is installed on the middle roof of the first ort roadway. Then, two uniaxial sensors are placed on the roof near the intersection area of first ort roadway and the two tramway transport entries, respectively, and another two sensors are placed on the roof near the intersection area of the second ort roadway and the two tramway transport entries and a microseismic monitoring network is preliminarily formed. As the mining progresses, a uniaxial sensor is installed on the middle roof of the second ort roadway, and two uniaxial sensors are placed on the roof near the intersection area of third ort roadway and the two tramway transport entries. As the mining continues, a triaxial sensor will be installed in the middle of the roof of the third ort roadway. This process will be repeated until the sixth ort roadway, covering the key monitoring area. The specific arrangement of microseismic sensors can be seen in Figure 11, and the monitoring layout plan for other areas can be seen in Figure 11. A total of 28 microseismic sensors are arranged in the middle section of 1,480, including 6 triaxial sensors and 22 uniaxial sensors. 40 microseismic channels are required, and 5 high-precision microseismic acquisition instruments produced by Hubei Seaquake Technique Co., Ltd are selected. Considering factors such as the layout of microseismic sensor cables and external construction disturbances, the microseismic acquisition instrument is arranged in one side of the transportation roadway, and the microseismic monitoring sever should be located in chambers in case been disturbed and damaged.
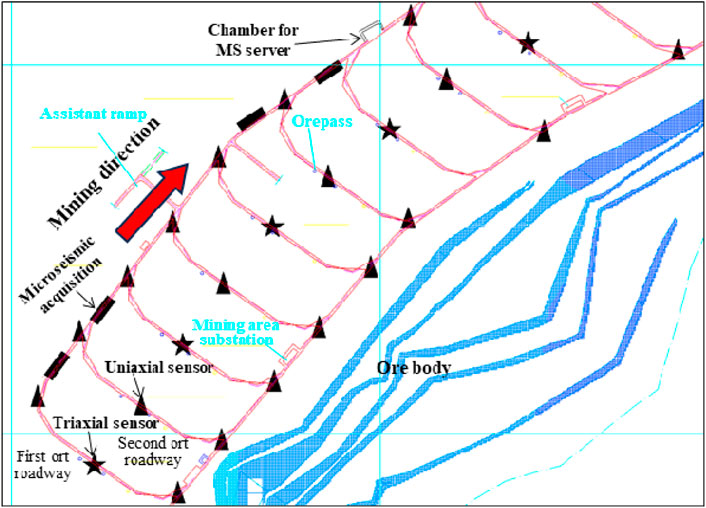
FIGURE 11. Microseismic sensor layout in the −1,480 level.
During microseismic monitoring in the mining process, close attention should be paid to the area where microseismic events are clustered in the surrounding rock of the mining area. The more clustered the microseismic events are, the more active the micro-fracturing of the rock mass in that area, the more intense the stress adjustment, and the higher the energy accumulated in the surrounding rock. The probability of micro-fractures penetrating each other to produce large fractures is higher, and the risk of rockburst is also higher. Therefore, when the number of microseismic events and the released energy suddenly increase in a certain area over a period of time, appropriate measures should be taken to prevent and control rockburst.
In the area where microseismic events are clustered, measures such as destress blasting or destress boreholes during mining, reducing the single charge amount of mining to reduce disturbance to the surrounding rock, and strengthening the support of the mining area should be taken to mitigate or even control the risk of rockburst. The mining rate of the mining area should be reduced to slow down the stress adjustment. The number of personnel working in the area should be reduced. When the risk of rockburst is extremely high, personnel should be evacuated from the working face.
Three rockburst criteria were employed to evaluate the rockburst risk of three kinds of granite in Ruihai ultra deep mine gold mine. The substantive reasons for the differences or even contradictions in the discrimination results of different criteria were analysed. Targeted rockburst microseismic monitoring methods and specific prevention and mitigation measures were proposed for different mining stages for the Ruihai gold mine. The detailed analysis allows the conclusions listed below to be drawn.
1) XRD mineral composition analysis and basic rock mechanics tests were conducted on the three colors of granite in the Ruihai gold mine. The results showed that there were differences in the lithological composition and rock mechanics parameters of the three colors of granite, indicating that they were three different types of granite. Therefore, when conducting rockburst risk management and control, they should be classified separately.
2) Three rockburst criteria, namely, the deformation brittleness coefficient, rock brittleness criterion, and Barton criterion, were applied to evaluate the rockburst tendency of the three types of granite. All three criteria indicated that granite A, granite B, and granite C had the risk of rockburst. However, when different indicators were used to distinguish the same type of granite, the degree of rockburst tendency was inconsistent. After discussion and analysis, it was found that most of the existing rockburst criteria were based on a single condition, which was considered to be somewhat one-sided, as they did not consider the sufficient and necessary conditions for rockburst, namely, the inherent rockburst tendency of the rock itself and the external driving force, i.e., the stress condition.
3) It is proposed to use microseismic monitoring technology to manage rockburst risk during the development and mining stages of the Ruihai gold mine. Different microseismic monitoring layout schemes were proposed for different stages, and targeted rockburst prevention and control measures were proposed for different stages.
The original contributions presented in the study are included in the article/Supplementary Material, further inquiries can be directed to the corresponding author.
PL: Conceptualization, Data curation, Validation, Writing–original draft. ZW: Investigation, Validation, Writing–review and editing. BC: Conceptualization, Funding acquisition, Methodology, Supervision, Validation, Writing–review and editing. JP: Supervision, Validation, Writing–original draft. BZ: Formal Analysis, Investigation, Writing–review and editing. JZ: Investigation, Validation, Writing–review and editing. HX: Formal Analysis, Validation, Writing–review and editing.
The author(s) declare financial support was received for the research, authorship, and/or publication of this article. This research was funded by the National Natural Science Foundation of China under Grants 42077263 and 52209132 and Natural Science Foundation of Shandong Provincial, China, under Grant No. ZR2020ME100.
Authors ZW, JP, and BZ were employed by Zhaojin Mining Industry Co., Ltd.
The remaining authors declare that the research was conducted in the absence of any commercial or financial relationships that could be construed as a potential conflict of interest.
All claims expressed in this article are solely those of the authors and do not necessarily represent those of their affiliated organizations, or those of the publisher, the editors and the reviewers. Any product that may be evaluated in this article, or claim that may be made by its manufacturer, is not guaranteed or endorsed by the publisher.
Barton, N., Lien, R., and Lunde, J. (1974). Engineering classification of rock masses for the design of tunnel support. Rock Mech. 6 (4), 189–236. doi:10.1007/bf01239496
Cai, M. F., and Brown, E. T. (2017). Challenges in the mining and utilization of deep mineral resources. Engineering 3 (4), 432–433. doi:10.1016/J.ENG.2017.04.027
Chen, B. R., Feng, X. T., Li, Q. P., Luo, R. Z., and Li, S. J. (2015). Rock burst intensity classification based on the radiated energy with damage intensity at Jinping II Hydropower Station, China. Rock Mech. Rock Eng. 48, 289–303. doi:10.1007/s00603-013-0524-2
Gong, F. Q., and Li, X. B. (2007). A distance discriminant analysis method for prediction of possibility and classification of rockburst and its application. J. Rock Mech. Eng. 26 (5), 1012–1018. (in Chinese). doi:10.3321/j.issn:1000-6915.2007.05.021
Gong, F. Q., Wang, Y. l., and Luo, S. (2020). Rockburst proneness criteria for rock materials: review and new insights. J. Central South Univ. 27, 2793–2821. doi:10.1007/s11771-020-4511-y
Gong, F. Q., Wang, Y. l., Wang, Z. G., Pan, J. F., and Luo, S. (2021). A new criterion of coal burst proneness based on the residual elastic energy index. Int. J. Min. Sci. Technol. 31 (4), 553–563. doi:10.1016/j.ijmst.2021.04.001
He, M. C., Chen, T., Qiao, Y. F., and Li, H. R. (2023). A review of rockburst: experiments, theories, and simulations. J. Rock Mech. Geotechnical Eng. 15, 1312–1353. doi:10.1016/j.jrmge.2022.07.014
Hoek, E., and Brown, E. T. (1980). Underground excavation in rock. London: The Institute of Mining and Metallurgy.
Hydropower (2019). NB/T 10143-2019 technical specification for rock Burst risk assessment of hydropower engineering. Beijing: China Water Resources and Hydropower Publishing House.
Kaiser, P. K., and Cai, M. (2012). Design of rock support system under rockburst condition. J. Rock Mech. Geotechnical Eng. 4 (3), 215–227. doi:10.3724/sp.j.1235.2012.00215
Kan, J. L., Dou, L. M., Li, J. Z., Li, X. W., Bai, J. Z., and Wang, M. Q. (2023). Characteristics of microseismic waveforms induced by underground destress blasting: comparison with those induced by ground blasting and coal mining. Front. Earth Sci. 10, 797358. doi:10.3389/feart.2022.797358
Kidybinski, A. (1981). Bursting liability indices of coal. Int. J. Rock Mech. Min. Sci. 18 (4), 295–304. doi:10.1016/0148-9062(81)91194-3
Leveille, P., Sepehri, M., and Apel, D. B. (2017). Rockbursting potential of Kimberlite: a case study of Diavik diamond mine. Rock Mech. Rock Eng. 50, 3223–3231. doi:10.1007/s00603-017-1294-z
Li, P. X., Chen, B. R., Xiao, Y. X., Feng, G. L., Zhou, Y. Y., and Zhao, J. S. (2023a). Rockburst and microseismic activity in a lagging tunnel as the spacing between twin TBM excavated tunnels changes: a case from the Neelum-Jhelum hydropower project. Tunn. Undergr. Space Technol. 132, 104884. doi:10.1016/j.tust.2022.104884
Li, P. X., Chen, B. R., Zhou, Y. Y., Xiao, Y. X., Feng, G. L., and Zhu, G. Q. (2019a). Research progress of rockburst prediction and early warning in hard rock underground engineering. J. China Coal Soc. 44 (S2), 447–465. (in Chinese). doi:10.13225/j.cnki.jccs.2019.0665
Li, P. X., Feng, X. T., Feng, G. L., Xiao, Y. X., and Chen, B. R. (2019b). Rockburst and microseismic characteristics around lithological interfaces under different excavation directions in deep tunnels. Eng. Geol. 260, 105209. doi:10.1016/j.enggeo.2019.105209
Li, P. X., Zhao, J. S., Bu, W. K., Niu, W. J., Liu, P. P., and Sun, M. H. (2023b). Optimization of rockburst risk control measures for deeply buried tbm tunnels: a case study. Buildings 13, 1440. doi:10.3390/buildings13061440
Liu, G. F., Ran, G. H., Li, Z. Q., Duan, S. Q., Su, G. S., Yang, C. G., et al. (2023). An insight into the effect of primary hidden microfissures on mechanical behaviors and failure characteristics of brittle basalt Theoretical and applied fracture mechanics. 2023, 1. doi:10.1016/j.tafmec.2023.104138
Mazaira, A., and Konicek, P. (2015). Intense rockburst impacts in deep underground construction and their prevention. Can. Geotechnical J. 52, 1426–1439. doi:10.1139/cgj-2014-0359
Peng, H., and Sun, Y. (2016). Report on in-situ stress measurement of hydraulic fracturing in borehole 2 of the gold mine in the northern sea area of Sanshan Island. Beijing: Institute of Geomechanics, Chinese Academy of Geological Sciences.
Russenes, B. F. (1974). Analysis of rock spalling for tunnels in steep valley sides. USA: Norwegian Institute of Technology. [dissertation/master’s thesis]. [Trondheim].
Wang, C., Liu, Y., Song, D., Xu, J., Wang, Q., and Zhang, S. (2024). Evaluation of bedding effect on the bursting liability of coal and coal-rock combination under different bedding dip angles. Adv. Geo-Energy Res. 11 (1), 29–40. doi:10.46690/ager.2024.01.04
Wang, J. A., and Park, H. D. (2001). Comprehensive prediction of rockburst based on analysis of strain energy in rocks. Tunn. Undergr. Space Technol. 16 (1), 49–57. doi:10.1016/s0886-7798(01)00030-x
Xiao, Y. X., Feng, X. T., Hudson, J. A., Chen, B. R., Feng, G. L., and Liu, J. P. (2016). ISRM suggested method for in situ microseismic monitoring of the fracturing process in rock masses. Rock Mech. Rock Eng. 49 (1), 343–369. doi:10.1007/s00603-015-0859-y
Xu, L. S., and Wang, L. S. (1999). Study on the laws of rockburst and its forecasting in the tunnel of Erlang Mountain road. Chin. J. Geotechnical Eng. 21 (5), 569–572. (in Chinese). doi:10.3321/j.issn:1000-4548.1999.05.009
Zhang, C. Q., Lu, J. J., Chen, J., Chen, J., Zhou, H., and Yang, F. J. (2017). Discussion on rock burst proneness indexes and their relation. Rock Soil Mech. 38 (5), 1397–1404. (in Chinese). doi:10.16285/j.rsm.2017.05.022
Zhao, J. S., Jiang, Q., Lu, J. F., Chen, B. R., and Wang, Z. L. (2022). Rock fracturing observation based on microseismic monitoring and borehole imaging: in situ investigation in a large underground cavern under high geostress. Tunn. Undergr. Space Technol. 126, 104549. doi:10.1016/j.tust.2022.104549
Zhao, J. S., Jiang, Q., Pei, S. F., Chen, B. R., Xu, D. P., and Song, L. B. (2023). Microseismicity and focal mechanism of blasting-induced block falling of intersecting chamber of large underground cavern under high geostress. J. Central South Univ. 30, 542–554. doi:10.1007/s11771-023-5259-y
Keywords: deep buried mine, rockburst criterion, microseismic monitoring, warning and mitigation rockburst, rockburst risk
Citation: Li P, Wang Z, Chen B, Peng J, Zhang B, Zhao J and Xie H (2024) Rockburst hazard assessment and prevention and control strategies in the Ruihai gold mine. Front. Earth Sci. 11:1348366. doi: 10.3389/feart.2023.1348366
Received: 02 December 2023; Accepted: 28 December 2023;
Published: 09 January 2024.
Edited by:
Jianyong Han, Shandong Jianzhu University, ChinaReviewed by:
Shufeng Pei, North China University of Water Conservancy and Electric Power, ChinaCopyright © 2024 Li, Wang, Chen, Peng, Zhang, Zhao and Xie. This is an open-access article distributed under the terms of the Creative Commons Attribution License (CC BY). The use, distribution or reproduction in other forums is permitted, provided the original author(s) and the copyright owner(s) are credited and that the original publication in this journal is cited, in accordance with accepted academic practice. No use, distribution or reproduction is permitted which does not comply with these terms.
*Correspondence: Bingrui Chen, YnJjaGVuQHdocnNtLmFjLmNu
Disclaimer: All claims expressed in this article are solely those of the authors and do not necessarily represent those of their affiliated organizations, or those of the publisher, the editors and the reviewers. Any product that may be evaluated in this article or claim that may be made by its manufacturer is not guaranteed or endorsed by the publisher.
Research integrity at Frontiers
Learn more about the work of our research integrity team to safeguard the quality of each article we publish.