 Xinyu Xia
 Yuan Gao
 Yue Wu
- Key Laboratory of Earthquake Prediction, Institute of Earthquake Forecasting, China Earthquake Administration, Beijing, China
The NE margin of the Tibetan plateau influenced by multiple blocks, the regional dynamic model and lithospheric deformation characteristics are still controversial. In this study, 15 years data from permanent broadband seismic stations of the seismic network in the study area were adopted for splitting analyses of teleseismic phases XKS (SKS PKS and SKKS, shortly named XKS) using a grid search method, longer observations provided each station with a large number of clear seismic phases. The results show that the fast wave directions of XKS splitting are oriented toward WNW or NW, with reference to the direction of absolute plate motion, the lithospheric deformation is dominantly driven by the asthenosphere, although there are local variations. On both sides of the Haiyuan fault zone, there is a noticeable variation in lithospheric azimuthal anisotropy, further enhances the possibility that it is an extended boundary of the Tibetan plateau. Rheological anisotropic features on the western side of the Ordos block emphasize the obstruction of the rigid Ordos lithosphere. The crust and mantle seem to be coupled below the Qinling orogen, possibly related to the lateral movement of lithospheric material. However, in the Hexi corridor, there may be layered anisotropy within the lithosphere, which is inferred to relate to the subductions of the Alxa block and the Qilian orogen. The thicker lithosphere on the southern margin of the Alxa block may influence the asthenospheric flow. In addition, anisotropy results at the southeastern edge of the Alxa block and the Yinchuan graben reflect the possibility that the lithosphere may be characterized by a combination of horizontal and vertical movements. These results have greatly improved our understanding of the dynamic models and lithospheric deformation characteristics of the northeastern margin of the Tibetan plateau and adjacent areas.
1 Introduction
The formation of the Tibetan plateau occurred approximately 70 Ma ago during the collision between the Indian and Eurasian plates. Around 50 million years ago, simultaneous crustal contraction took place along the northern Qilian zone and the northern margin of the Indian continent (Owens and Zandt, 1997), resulting in a north-south shortening of 1,400 km (Yin and Harrison, 2000). Scholars have proposed various dynamic models to explain the complex tectonic activities of the Tibetan plateau. Some researchers argue that the plateau’s uplift is a result of the continuous development of crustal thrust wedges, with the compressional action of numerous faults causing the eastward and northeastward development of the plateau (Tapponnier et al., 1982; Tapponnier et al., 2001). England and Houseman (1986) propose that uneven crustal shortening and thickening are the primary causes of the Tibetan plateau’s uplift. Another interpretation suggests that the deformation of the upper crust on the plateau is decoupled from the lower crust, and the flow of ductile material in the lower crust causes the uplift of the plateau and the thickening of the crust (Royden et al., 1997; Clark and Royden, 2000; Royden et al., 2008). As the frontal region of the collision between the Tibetan plateau, the Alxa Block, the Ordos Block, and the South China Block, the northeastern margin of the Tibetan plateau is densely populated with fault and exhibits complex deep structures. GPS data indicates a clockwise rotation in the velocity field of the study area (Li et al., 2023), with a gradual decrease in speed from west to east (Figure 1A). Influenced by plate collision, this region displays a strain pattern of NE-oriented shortening and NW-oriented extension within the interior of the Tibetan plateau (Wang and Shen, 2020; Li et al., 2023). The interplay of these deep geological forces contributes to the intricate tectonic dynamics observed in the northeastern margin of the Tibetan plateau.
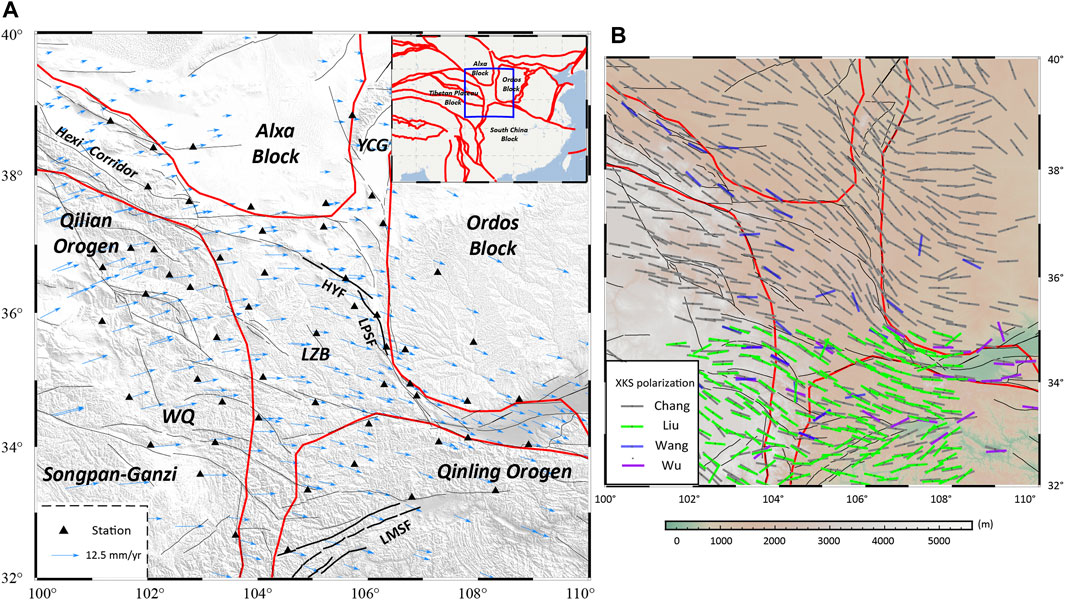
FIGURE 1. (A) Distribution of major faults and seismic stations in the study area. The stations used in this study are plotted with black triangles. The inset shows the study area. Faults are indicated in black lines. HYF, Haiyuan fault; LPSF, Liupanshan Fault; WQNF, Western Qinling Northern Margin Fault; LMSF, Longmenshan Fault zone; WQ, Western Qinling; YCG, Yinchuan graben. The emphasized faults are marked with thick black solid lines. Orchid-colored arrows indicate regional GPS velocity, with the Eurasian plate reference system (from Wang and Shen, 2020). Plate boundaries are shown by red solid lines. The inset in the upper right corner plots the location of the study area and the block boundaries. (B) The fast-wave polarization directions of previous SKS PKS and SKKS (shortly named XKS) splitting results. Data are from Wang et al. (2013); Chang et al. (2017); Liu et al. (2020); Wu et al. (2021).
Seismic anisotropy can be used to investigate the crust-mantle deformation mechanism. Shear waves, as they traverse an anisotropic medium, tend to split into two nearly orthogonal fast and slow waves—a phenomenon commonly observed within the continental lithosphere (Crampin, 1981; Crampin and Peacock, 2008). The commonly used parameters to describe anisotropic features include the fast wave polarization direction (FPD), denoted as φ, and the slow wave delay time (DT), denoted as δt (Savage et al., 1990; Silver and Chan, 1991; Savage, 1999; Erdman et al., 2013). Silver and Chan (1988) discovered that the SKS phase, which traverses the Earth’s core, undergoes a P-S conversion at the core-mantle boundary. This phenomenon eliminates the influence of the medium on the source side. Additionally, due to the approximate vertical propagation trace through the receiving side medium, the propagation direction is theoretically constant. In an Earth assumed to be isotropic and spherically symmetric, this method allows for a better differentiation of the effects of anisotropy. The primary cause of splitting is the preferred orientation of olivine mineral lattice in the lithospheric mantle due to deep dynamic forces. This phenomenon is often utilized to reflect the anisotropic characteristics of the lithospheric mantle, particularly the upper mantle (Silver and Chan, 1991; Gao et al., 2011).
Chang et al. (2017) conducted an investigation of shear wave splitting characteristics in the northeastern margin of the Tibetan plateau using observations from temporary stations in the ChinaArray and OrdosArray (Figure 1B), along with data from selected permanent stations. The results show that the study area is dominated by the Vertical Coherence deformation. Building on this, Wu et al. (2021) supplemented observations of lithospheric anisotropy in the Qinling orogen using a temporary seismic array, revealing the coupling within the Qinling orogen lithospheric. The analysis of phases XKS (SKS PKS and SKKS shortly named XKS), suggests the presence of layered anisotropic in the southern parts of the Qilian orogen, the Haiyuan fault zone, and the Yinchuan graben (Ye et al., 2016; Shen et al., 2022b). Despite the comprehensive spatial coverage achieved by extensive anisotropy studies using temporary seismic arrays in the northeastern margin of the Tibetan plateau, the XKS anisotropy method requires more comprehensive seismic event azimuthal coverage and an extended time span to gather a more significant number of reliable seismic phases. In this paper, approximately 15 years of data from permanent stations in the study area were selected. Teleseismic phases SKS were utilized, including phases PKS and SKKS, to increase the number of available seismic events. This resulted in a more accurate and reliable spatial distribution of lithospheric azimuthal anisotropy in the northeastern margin of the Tibetan plateau and adjacent area, and delves into the dynamic models and lithospheric deformation characteristics to the northeastern margin of the Tibetan plateau.
2 Data and method
2.1 Data
About 7,933 catalogs of M ≥ 5.5 earthquakes were collected from July 2007 to December 2022, the range of data spans approximately 15 years. Seismic waveforms are acquired from 60 broadband permanent stations in six seismic networks, including Qinghai, Gansu, Sichuan, Inner Mongolia, Ningxia, and Shanxi. The data with epicentral distances between the seismic stations and the seismic events in the range of 30–180° were selected to ensure that clear seismic phases were obtained for subsequent measurements, and cut the data according to the P-wave theory arrival time 30 s before and 2,100 s after to obtain the reliable event waveforms. The original sampling rate of all data was 100 Hz. It is noteworthy that four stations experienced shifts in their geographical coordinates in 2009 (SDT_GS shifted from 101.04°E to 101.33°E, XSH_NX from 37.25°N to 37.20°N, HUY_QH from 101.25°E to 101.19°E and 36.69°N to 36.66°N, ZHW_NX from 37.58°N to 37.59°N). The range of these changes varied from 1 to 30 km. Subsequent analyses unified and rectified the latitude and longitude of these stations to their post-2009 locations. In this study, 432 teleseismic events picked up clear phases XKS and were used to obtain anisotropic parameters. The teleseismic events are mainly distributed in the Indian Ocean, North American plate boundary, Tonga and New Zealand regions, although events are concentrated in these areas, the overall azimuthal coverage is more comprehensive (Figure 2).
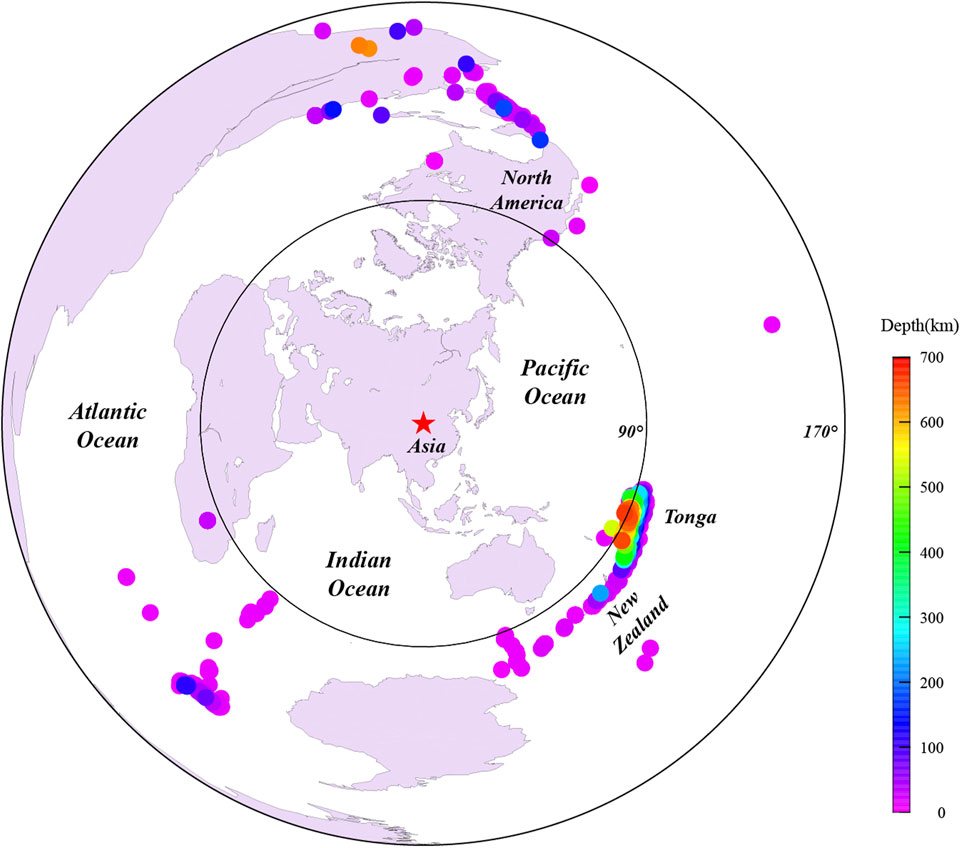
FIGURE 2. Distribution of events used in this study. Colorful circles indicate seismic events, with depths differentiated by color, and red stars indicate the study area of this paper. The two black circles indicate the distance between the epicenters at 90° and 170° from the center of the region, respectively.
2.2 Method
Screening SKS phases from events with epicentral distances of 84°–180°, PKS and SKKS phases correspond to events with epicentral distances of 120–180° and 90–180°, respectively. Resample the original data to 20 Hz, remove trend and rotate the waveform to radial and tangential components after using a band-pass filter of 0.04–0.5 Hz.
Eq. (1) is the seismic signal used for shear wave splitting:
where
Use
According to the corresponding seismic phases theory arriving time given by the IASP91 model, take 5s before (this point in time is called
In this study, a signal-to-noise ratio (shortly named S/N ratio) parameter
Where the
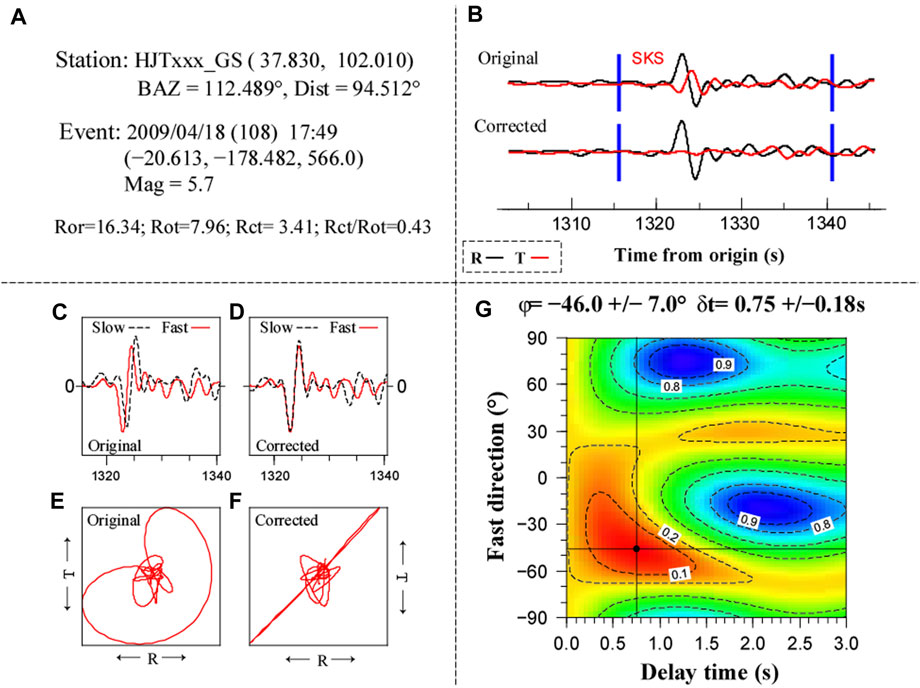
FIGURE 3. SKS splitting analysis. (A) From top to bottom are the station code and the seismic network code, location (latitude, longitude), back azimuth and epicenter distance between seismic event and station, the earthquake parameters (Date in Julian day, time, longitude, latitude, depth and magnitude), and the signal-to-noise ratio parameters used to compute anisotropy; (B) Original radial (black line) and tangential (red line) component seismic waveforms, corrected radial (black line) and tangential (red line) component seismic waveforms; (C) Original fast (red solid line) and slow (black dashed line) waveforms; (D) Corrected fast (red solid line) and slow (black dashed line) waveforms; (E) Original tracks of the particle motion; (F) Corrected tracks of the particle motion; (G) Energy map and contour of anisotropic parameters obtained by tangential energy minimization method, the optimal parameters is marked as a black dot. Parameters are displayed above the map.
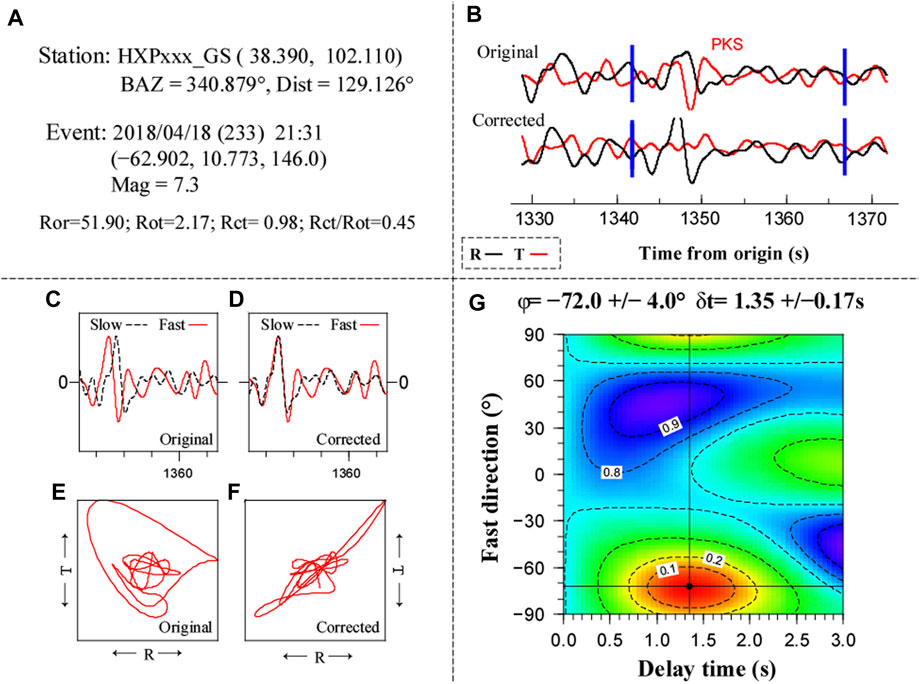
FIGURE 4. PKS splitting analysis. (A) From top to bottom are the station code and the seismic network code, location (latitude, longitude), back azimuth and epicenter distance between seismic event and station, the earthquake parameters (Date in Julian day, time, longitude, latitude, depth and magnitude), and the signal-to-noise ratio parameters used to compute anisotropy; (B) Original radial (black line) and tangential (red line) component seismic waveforms, corrected radial (black line) and tangential (red line) component seismic waveforms; (C) Original fast (red solid line) and slow (black dashed line) waveforms; (D) Corrected fast (red solid line) and slow (black dashed line) waveforms; (E) Original tracks of the particle motion; (F) Corrected tracks of the particle motion; (G) Energy map and contour of anisotropic parameters obtained by tangential energy minimization method, the optimal parameters is marked as a black dot. Parameters are displayed above the map.
3 Spatial distribution of anisotropy
A total of 1,126 splits results (a total of three phases) were obtained from 56 stations in the study area, among which 922 are SKS, 154 are PKS, and 50 are SKKS results (refer to the Supplementary Table S1). Notably, the TLE_NX station procured merely two instances of such splits, was deemed insufficient to revealing the intricate structural features of the lithosphere beneath the station. Despite the graphical representation of these two results on the piercing points distribution map (Figure 5), they were subsequently omitted from the mean results of the XKS single-station.
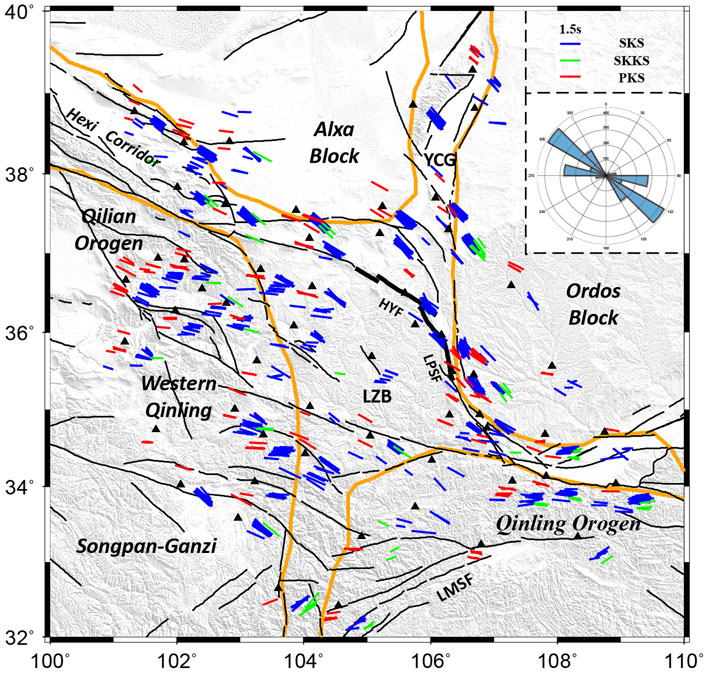
FIGURE 5. Anisotropy parameters of XKS at 200 km piercing points projected to the surface. Orange solid lines indicate the block boundaries. Specially emphasized faults are marked with thick gray solid lines. The rose diagram in the upper right corner counts the results of the fast wave direction, with the length counts the total number.
Comparing the XKS splitting results of this study (Figures 5, 6) with the previous study results (Figure 1C), there are large differences in tectonically complex regions such as the LZB, the WQNF, and within the Ordos Block. On the one hand, these differences come from the different methods used by scholars (minimum eigenvalue method and energy minimum method, etc.), on the other hand, they are related to the number of seismic phases obtained (the clearer seismic phases obtained at each station, the higher the confidence in the final anisotropy results) (Silver and Chan, 1991), which is why 15 years of data were used to carry out the study of shear wave splitting. The number of XKS seismic phases at each station in this study far exceeds the previous ones, so the results of this study are more reliable and reflect the real anisotropy characteristics in the study area, especially in areas with complex and controversial structures.
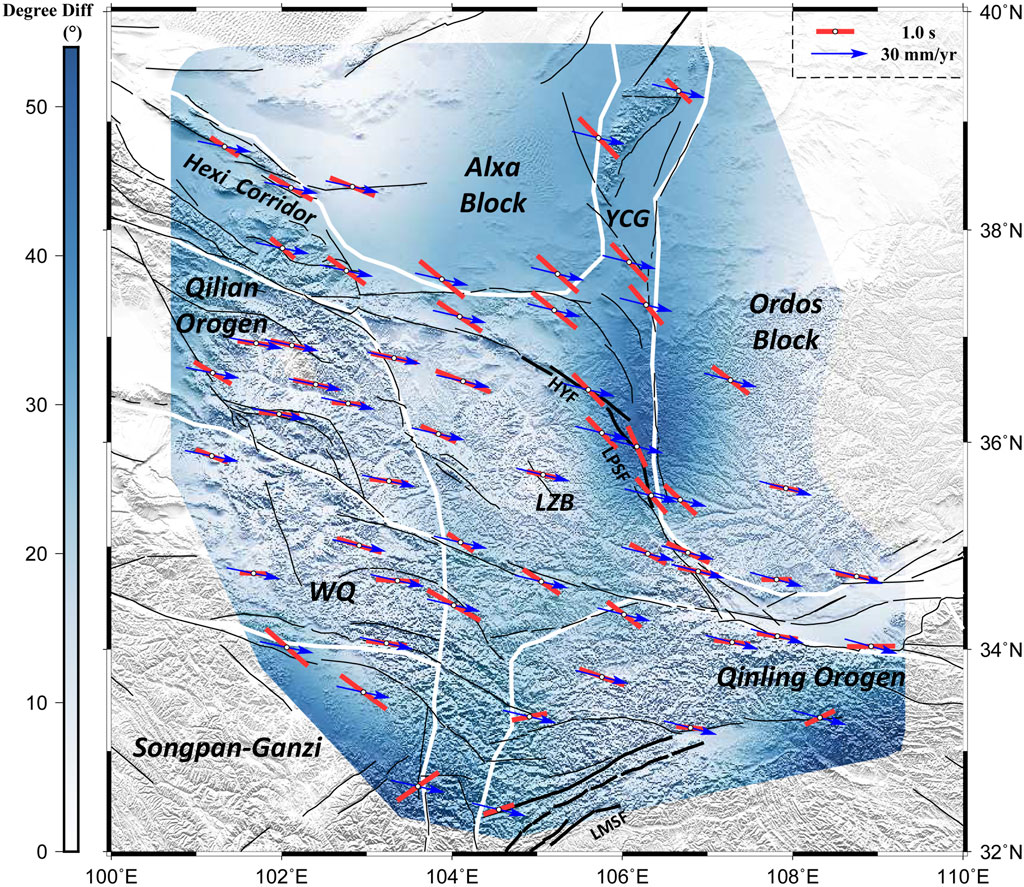
FIGURE 6. Degree difference between XKS anisotropic fast wave direction and Absolute Plate Motion direction, where the red vector bar indicates the XKS fast wave direction and the blue vector arrow indicates the APM direction, and the scale is plotted in the legend. White solid lines indicate the block boundaries. Specially emphasized faults are marked with thick black solid lines. The reference system for APM is the Eurasian plate, and the results are from Altamimin et al. (2016).
The results revealed a prevailing fast-wave direction of NW or WNW orientation across the study area, exhibiting delay time ranging from 0.45 to 2.05 s. Of significance, the delay time at the periphery of lithospheric blocks were conspicuously higher than those within the block interiors, indicating a considerable variation in magnitude. It becomes apparent that the FPD in the Haiyuan-Liupanshan fault zone, the Qinling orogen, and the Longmenshan fault zone exhibits a significant deviation from the average FPD in the study area. Yet, it bears a certain resemblance to the findings of previous researchers (Li et al., 2011; Chang et al., 2017; Wu et al., 2021). The Haiyuan-Liupanshan fault zone, situated in proximity to the western margin of the Ordos Block, demonstrates a noteworthy alteration in FPD along the block’s margin, deflecting gradually from NW to NNW, culminating in a nearly EW extension towards the Qinling orogen, consistent with the strike of the Qinling orogen. Along the Haiyuan fault to Yinchuan graben, although the direction of the FPD is consistent, there is a large delay time in all of them. The FPD in the Longmenshan fault zone takes on a distinctive NE direction and has shown this feature from within the Tibetan plateau block, it also exhibits a deflection along the strike of the Longmenshan fault zone, which gradually deflects to the ENE direction (Wang and Gao, 2024), with the delay time decreasing from west to east, a deviation that stands in contrast to the findings of Liu et al. (2020). However, in the absence of anisotropy results from other nearby stations, the origin and prevalence of this directional change remains elusive, and it is impossible to tell whether it is a localized phenomenon or a general feature of the region. Within the Tibetan plateau Block (the neighboring Qilian orogen and the western Qinling), the WNW oriented fast wave polarization direction draw a parallel with the strike of the faults and orogen, which consistent with previous results (Wang et al., 2013; Bao et al., 2020).
4 Discussions
Silver and Chan (1991) revealed two main causes for the generation of seismic anisotropy in the lithosphere: 1) Absolute Plate Motion (APM): Seismic anisotropy is a consequence of the absolute motion of tectonic plates. In this scenario, the predominant strain arises from the flow of the asthenosphere but manifests within the lithosphere. The resulting fast-wave polarization direction (XKS in this context) is expected to align parallel to the direction of Absolute Plate Motion. 2) Internal Coherent Deformation (ICD): Seismic anisotropy can also be attributed to tectonic processes such as mountain-building, rifting, and strike-slip deformation. This is associated with the Internal Coherent Deformation within the continental lithosphere. In this case, the fast-wave polarization direction is often expected to parallel major fault orientations or structural trends resulting from these tectonic activities. In this study, the average seismic anisotropy results from each station are compared with the ITRF2014 absolute plate motion model proposed by Altamimi et al. (2016) (Figure 6). This comparative analysis seeks to understand the relationship between the observed seismic anisotropy and the absolute motion of tectonic plates, as well as potential connections with internal deformation within the continental lithosphere.
The results reveal a noteworthy consistent between the fast-wave polarization direction (XKS) and the direction of APM in the study area. As proposed by the concept of ‘APM’, this consistent suggests that the predominant deformation within the lithosphere is largely driven by the flow of material in the asthenosphere and the absolute plate motion has a significant influence of on the observed seismic anisotropy. However, rather than displaying a uniform characteristic across the entire study area, the seismic anisotropy in the lithosphere exhibits a regional variability. The XKS fast-wave polarization direction within the Haiyuan-Liupanshan fault zone exhibits a distinctive shift along the margin of the Ordos Block. In this area, the degree difference between the Absolute Plate Motion (APM) and the XKS fast-wave polarization direction is notably large, reaching approximately 52.2°, making it the maximum degree difference within the scope of this study. Previous research has indicated that the lithospheric thickness of the Ordos Block is relatively substantial, estimated to be around 220 km (Zhang et al., 2012; Wang et al., 2016; Zhang et al., 2022). The proximity of XKS and GPS directions implies a certain level of consistency between seismic anisotropy and the observed surface motion. However, as GPS velocities decrease noticeably along the edge of the Ordos Block, it indicates a potential impediment to material transport at the lithospheric scale. This obstruction, caused by the thicker Ordos Block (Guo and Chen, 2017; Liu et al., 2021; Wu et al., 2023), appears to induce strong internal coherent deformation in the lithosphere on the western side of the Ordos Block. Yu and Chen (2016) have proposed that the corner flow along the southwest margin of the Ordos Block may indicate the potential erosion of the thick and cold lithospheric root due to lateral movement within the asthenosphere, and may have affected the lower crust, as evidenced by the multiple-peaks of the Pms signal of the receiver functions (Shen et al., 2022a). However, the Ordos Block exhibits distinct characteristics both internally and externally, with the GPS velocities within the block showing relatively lower values. The results from XKS measurements also reveal a diminutive delay time. The research conducted by Chang et al. (2017) further illustrates lower strain rates within the block, suggesting that the lithosphere within the Ordos Block retains a stable ancient craton structure (Zhu et al., 2012; Li et al., 2022). From the SW margin of the Ordos block to the Qinling orogen, the FPD shows a streamline feature that gradually changes to a near East-West direction along the margin of the Ordos block, which is approximately parallel to the APM direction in the Qinling orogen. This implies that the deformation of the lithosphere arises from the flow of material in the asthenosphere (Silver and Chan, 1991). The P-wave receiver function finds that the fast-wave direction of crustal anisotropy in this region also exhibits a near East-West direction (Lv et al., 2021), and the lithospheric thickness of the Weihe graben was substantially thinned by about 50 km (Zhang et al., 2022), which is further indicate the process of lateral migration of Cenozoic Tibetan plateau materials along the Qinling orogen (Zhang et al., 1998; Yu and Chen, 2016; Lv et al., 2021; Wu et al., 2021). In a more recent study, it is suggested that this migration process drove the intrusion of mantle thermal material into the lower crust of the Weihe graben (Shen et al., 2022a).
Within the interior of the Tibetan plateau block, particularly in the Qilian orogen and Western Qinling, the fast wave direction closely aligns with the APM. However, notable distinctions arise from the Qilian orogen to the Hexi Corridor, where the colors in the degree difference diagram gradually deepen. This suggests that, beyond the influence of asthenosphere, there may be exists deformation originating within the lithosphere. Previous studies have found that the Qilian orogen and Hexi corridor has layered anisotropy (Ye et al., 2016), which corresponds to our hypothesized pattern of deformation within the lithosphere. The deformation may be originated from the crustal and related to the multiple subductions of the Alxa block and its collision course with the Qilian orogen in the late Devonian (Xiao et al., 2009). The same layered anisotropy characteristics was found in the Haiyuan fault zone (Shi et al., 2020; Shi et al., 2021), mainly within the crust from north of the Haiyuan fault to the southern part of the Yinchuan graben, while Shen et al (2022a) propose lithospheric-scale layered anisotropic beneath the Haiyuan fault to the Yinchuan graben, and the SFS results further characterize the lateral mantle flow process from the Tibetan plateau to between Ordos Block and Alxa Block (Shen et al., 2016), with the flow direction is consistent with the direction of the lower fast wave of Shen et al (2022a). Although the present study does not directly discuss the issue of anisotropic layering, it does reveal the significant influence of the Haiyuan fault zone on lithospheric anisotropy, aligning with Shi et al. (2020) assertion that the Haiyuan fault zone serves as the northeastern crustal boundary of the Tibetan Block. In the Western Qinling, the dominant deformation driving force is attributed to the asthenosphere. The degree difference between XKS and APM results indicates the progression of this asthenosphere driving from the Tibetan plateau to the Longzhong basin. There is an approximate 11° deviation between the fast wave direction at the southern edge of the Alxa Block and the Qilian orogen. The lithospheric thickness of the Alxa Block is estimated to be around 150 km, less than that of the Ordos Block (Wang et al., 2023). Study suggested that the deviation in the fast wave direction and the significant delay time observed in the Alxa Block, similar to the Ordos Block, may reflect partial blocking of the asthenosphere by the Alxa Block. The XKS fast-wave direction and APM degree differences at the northeastern margin of the Songpan-Ganzi block and the Longmenshan fault zone domain may be related to local tectonic effects (Wang et al., 2013).
5 Conclusion
This study collected approximately 15 years of broadband permanent seismic station data in the research area, we obtained the lithospheric azimuthal anisotropy of the northeastern margin of the Tibetan plateau and the adjacent areas and revealed the spatial deformation characteristics of the region by using the analysis of teleseismic phases XKS splitting. The results indicate that the fast-wave polarization direction of XKS in the study area predominantly trends towards the NW or WNW, aligns with the absolute plate motion direction. However, notable discrepancies are observed on the western margin of the Ordos Block, including the Yinchuan graben and the southeastern corner of the Alxa Block, the degree difference between the FPD of XKS and the APM direction reveals that the lithospheric material movement in this area is not rigid, displaying characteristics of both horizontal shear and vertical motion differences. These findings are consistent with prior observations of layered anisotropic in the region. The Haiyuan fault zone, acting not only as the crustal boundary on the northeastern edge of the Tibetan Block but also influencing lithospheric anisotropy on both sides of the fault. From the southern part of the Yinchuan graben through the Haiyuan fault to the Longzhong basin, the lithospheric material in this region exhibits rheological characteristics, highlighting the blocking effect of the rigid lithosphere of the Ordos Block, but the southwestern corner of the Ordos Block has been eroded, with the lithosphere at the intersection of the Haiyuan fault zone and the Ordos Block displaying strong internal coherent deformation. Nevertheless, the interior of the Ordos Block remains relatively stable. The lithospheric material in the Qinling orogen exhibits movement along the margin of the Ordos Block, with the crust and mantle coupled. This region may be associated with the lateral transport of material from the Tibetan plateau. In the Western Qinling, Qilian orogen, and Longzhong basin, the lithosphere exhibits clear signs of asthenosphere driving. However, in the Hexi Corridor, there might be internal coherent deformation of the lithosphere, and the layered anisotropy might be related to the multiple subductions of the Qilian orogen and the Alxa Block. The anisotropy at the southern margin of the Alxa Block likely reflects interference from a thicker lithosphere on the flow of material in the asthenosphere.
Data availability statement
Publicly available datasets were analyzed in this study. This data can be found here: USGS (https://www.usgs.gov/), and the International Earthquake Science Data Center (http://esdc.ac.cn/).
Author contributions
XX: Visualization, Writing–original draft, Writing–review and editing, Data curation. YG: Funding acquisition, Writing–review and editing. YW: Writing–review and editing.
Funding
The author(s) declare financial support was received for the research, authorship, and/or publication of this article. This study is supported by the National Natural Science Foundation of China (Project 42074065) and the National Key R&D Project of China (2017YFC1500304).
Acknowledgments
Grateful the editor Chang Zhang, two reviewers and the editorial office for their helpful constructive comments. The teleseismic catalogs used in this study were obtained from USGS (https://www.usgs.gov/), and the waveform data were obtained from the International Earthquake Science Data Center (http://esdc.ac.cn/). Professors Stephan Gao, Kelly Liu, and Fansheng Kong are gratefully acknowledged with help of the computational programs for this study.
Conflict of interest
The authors declare that the research was conducted in the absence of any commercial or financial relationships that could be construed as a potential conflict of interest.
The reviewer LC declared a shared affiliation with the authors to the handling editor at the time of review.
Publisher’s note
All claims expressed in this article are solely those of the authors and do not necessarily represent those of their affiliated organizations, or those of the publisher, the editors and the reviewers. Any product that may be evaluated in this article, or claim that may be made by its manufacturer, is not guaranteed or endorsed by the publisher.
Supplementary material
The Supplementary Material for this article can be found online at: https://www.frontiersin.org/articles/10.3389/feart.2023.1342796/full#supplementary-material
References
Altamimin, Z., Rebischung, P., Métlvler., L., and Collilleux, X. (2016). ITRF2014: a new release of the International Terrestrial Reference Frame modeling nonlinear station motions. J. Geophys. Res. Solid Earth 121, 6109–6131. doi:10.1002/2016JB013098
Bao, X., Song, X., Eaton, D. W., Xu, Y., and Chen, H. (2020). Episodic lithospheric deformation in eastern Tibet inferred from seismic anisotropy. Geophys. Res. Lett. 47 (3). doi:10.1029/2019GL085721
Chang, L. J., Ding, Z. F., Wang, C. Y., and Lucy, M. F. (2017). Vertical coherence of deformation in lithosphere in the NE margin of the Tibetan plateau using GPS and shear-wave splitting data. Tectonophysics 699, 93–101. doi:10.1016/j.tecto.2017.01.025
Clark, M. K., and Royden, L. H. (2000). Topographic ooze: building the eastern margin of Tibet by lower crustal flow. Geology 28 (8), 703–706. doi:10.1130/0091-7613(2000)028<0703:tobtem>2.3.co;2
Crampin, S. (1981). A review of wave motion in anisotropic and cracked elastic-media. Wave Motion 3 (4), 343–391. doi:10.1016/0165-2125(81)90026-3
Crampin, S., and Peacock, S. (2008). A review of the current understanding of seismic shear-wave splitting in the Earth’s crust and common fallacies in interpretation. Wave Motion 45 (6), 675–722. doi:10.1016/j.wavemoti.2008.01.003
England, P., and Houseman, G. (1986). Finite strain calculations of continental deformation. l. Method and general results for convergent zones. 2.Comparison with the India- Asia collision zone. J. Geophys. Res. Solid Earth 91 (B3), 3651–3676. doi:10.1029/JB091iB03p03664
Erdman, M. E., Hacker, B. R., Zandt, G., and Seward, G. (2013). Seismic anisotropy of the crust: electron-backscatter diffraction measurements from the basin and range. Geophys. J. Int. 195 (2), 1211–1229. doi:10.1093/gji/ggt287
Gao, S. S., Liu, K. H., and Abdelsalam, M. G. (2010). Seismic anisotropy beneath the Afar Depression and adjacent areas: implications for mantle flow. J. Geophys. Res. Solid Earth 115, B12330. doi:10.1029/2009JB007141
Gao, Y., Wu, J., Fukao, Y., Shi, Y. T., and Zhu, A. (2011). Shear wave splitting in the crust in North China: stress, faults and tectonic implications. Geophys. J. Int. 187 (2), 642–654. doi:10.1111/j.1365-246x.2011.05200.x
Guo, Z., and Chen, Y. J. (2017). Mountain building at northeastern boundary of Tibetan Plateau and craton reworking at Ordos block from joint inversion of ambient noise tomography and receiver functions. Earth Planet. Sci. Lett. 463, 232–242. doi:10.1016/j.epsl.2017.01.026
Li, S., Guo, Z., Yu, Y., Wu, X., and Chen, Y. J. (2022). Imaging the Northeastern crustal boundary of the Tibetan Plateau with radial anisotropy. Geophys. Res. Lett. 49. doi:10.1029/2022GL100672
Li, S. Y., Gao, Y., and Jin, H. L. (2023). Upper crustal deformation characteristics in the northeastern Tibetan Plateau and its adjacent areas revealed by GNSS and anisotropy data. Earthq. Sci. 36 (4), 297–308. doi:10.1016/j.eqs.2023.05.003
Li, Y. H., Wu, Q. J., Zhang, F. X., Feng, Q. Q., and Zhang, R. Q. (2011). Seismic anisotropy of the North Eastern Tibetan Plateau from shear wave splitting analysis. Earth Planet. Sci. Lett. 304, 147–157. doi:10.1016/j.epsl.2011.01.026
Liu, J., Wu, J. P., Wang, W. L., Cai, Y., and Fang, L. H. (2021). Seismic anisotropy and implications for lithospheric deformation beneath the Ordos Block and surrounding regions. Geophys. J. Int. 226, 1885–1896. doi:10.1093/gji/ggab154
Liu, J., Wu, J. P., Wang, W. L., Fang, L. H., and Chang, K. (2020). Seismic anisotropy beneath the eastern margin of the Tibetan Plateau from SKS splitting observations. Tectonophysics 785, 228430. doi:10.1016/j.tecto.2020.228430
Liu, K. H., Gao, S., Gao, Y., and Wu, J. (2008). Shear wave splitting and mantle flow associated with the deflected Pacific slab beneath northeast Asia. J. Geophys. Res. Solid Earth 113 (B1), 1–15. doi:10.1029/2007JB005178
Lv, J. Y., Shen, X. Z., Huang, L. T., He, X. H., Huang, H., Zheng, W. J., et al. (2021). The crustal anisotropy of west Ordos block and its geodynamic implications. Geochem. Geophys. Geosystems 22. doi:10.1029/2020GC009553
Owens, T. J., and Zandt, G. (1997). Implications of crustal property variations for models of Tibetan plateau evolution. Nature 387, 37–43. doi:10.1038/387037a0
Royden, L. H., Burchfiel, B. C., and Hilst, R. D. (2008). The geological evolution of the Tibetan Plateau. Science 321 (5892), 1054–1058. doi:10.1126/science.1155371
Royden, L. H., Burchfiel, B. C., King, R. W., Wang, E., Chen, Z. L., Shen, F., et al. (1997). Surface deformation and lower crustal flow in eastern Tibet. Science 276 (5313), 788–790. doi:10.1126/science.276.5313.788
Savage, M. K. (1999). Seismic anisotropy and mantle deformation: what have we learned from shear wave splitting. Rev. Geophys. 37 (1), 65–106. doi:10.1029/98rg02075
Savage, M. K., Peppin, W. A., and Vetter, U. R. (1990). Shear wave anisotropy and stress direction in and near Long Valley Caldera, California, 1979–1988. J. Geophys. Res. Solid Earth 95, 11165–11177. doi:10.1029/JB095iB07p11165
Shen, S. Y., Gao, Y., and Liu, T. Z. (2022b). Two-layer anisotropy revealed by shear wave splitting beneath the NE margin of Tibetan Plateau: from Haiyuan fault to Yinchuan Graben. Chin. J. Geophys. 65 (5), 1595–1611. doi:10.6038/cjg2022O0340
Shen, X. Z., Liu, M., Gao, Y., Wang, W. J., Shi, Y. T., An, M. J., et al. (2016). Lithospheric structure across the northeastern margin of the Tibetan Plateau: implications for the plateau’s lateral growth. Earth Planet. Sci. Lett. 459, 80–92. doi:10.1016/j.epsl.2016.11.027
Shen, X. Z., Zhou, Q. M., Cheng, S. Y., Zheng, W. J., Zhang, P. Z., Zhang, D. L., et al. (2022a). Contrasting crustal structures crossing the boundary region of the southwest Ordos block and its tectonic implications revealed by dense seismic arrays. Tectonophysics 831, 229342. doi:10.1016/j.tecto.2022.229342
Shi, Y. T., Gao, Y., and Lu, L. Y. (2021). Receiver function structures beneath the Haiyuan fault on the northeastern margin of the Tibetan plateau. Earthq. Sci. 34 (4), 367–377. doi:10.29382/eqs-2020-0055
Shi, Y. T., Gao, Y., Shen, X. Z., and Liu, K. H. (2020). Multiscale spatial distribution of crustal seismic anisotropy beneath the northeastern margin of the Tibetan plateau and tectonic implications of the Haiyuan fault. Tectonophysics 774, 228274. doi:10.1016/j.tecto.2019.228274
Silver, P. G., and Chan, W. W. (1988). Implications for continental structure and evolution from seismic anisotropy. Nature 335 (6185), 34–39. doi:10.1038/335034a0
Silver, P. G., and Chan, W. W. (1991). Shear wave splitting and subcontinental mantle deformation. J. Geophys. Res. Solid Earth 96 (B10), 16429–16454. doi:10.1029/91jb00899
Tapponnier, P., Peltzer, G., Ledain, A. Y., Armijo, R., and Cobbold, P. (1982). Propagating extrusion tectonics in Asia - newinsights from simple experiments with plasticine. Geology 10 (12), 611–616. doi:10.1130/0091-7613(1982)10<611:petian>2.0.co;2
Tapponnier, P., Xu, Z., Roger, F., Meyer, B., Arnaud, N., Wittlinger, G., et al. (2001). Oblique stepwise rise and growth of the Tibet plateau. Science 294, 1671–1677. doi:10.1126/science.105978
Wang, A. J., and Gao, Y. (2024). Possible layered lithospheric anisotropy around Longmenshan faults by teleseismic S wave splitting and receiver functions. Front. Earth Sci. 11. doi:10.3389/feart.2023.1353050
Wang, M., and Shen, Z. K. (2020). Present-day crustal deformation of continental China derived from GPS and its tectonic implications. J. Geophys. Res. Solid Earth 125 (2). doi:10.1029/2019JB018774
Wang, Q., Gao, Y., Shi, Y. T., and Wu, J. (2013). Seismic anisotropy in the uppermost mantle beneath the northeastern margin of Qinghai-Tibet plateau: evidence from shear wave splitting of SKS PKS and SKKS. Chin. J. Geophys. 56 (3), 892–905. doi:10.6038/cjg20130318
Wang, Q., Niu, F., Gao, Y., and Chen, Y. T. (2016). Crustal structure and deformation beneath the NE margin of the Tibetan plateau constrained by teleseismic receiver function data. Geophys. J. Int. 204 (1), 167–179. doi:10.1093/gji/ggv420
Wang, W., Cai, G., Wu, J., and Fang, L. (2023). The lithospheric S-wave velocity structure beneath the NE Tibetan Plateau and its surrounding craton basins. Front. Earth Sci. 10. doi:10.3389/feart.2022.1066265
Wu, X., Guo, Z., Li, S., Yu, Y., Bai, Q., and Chen, Y. (2023). Seismic azimuthal anisotropy of northeastern Tibetan Plateau from ambient noise double beamforming tomography: implications for crustal deformation. J. Geophys. Res. Solid Earth 128 (6). doi:10.1029/2022JB026109
Wu, Y. Y., Deng, S. Z., Niu, F. L., He, W., and Wu, H. N. (2021). Crust-mantle coupling mechanism beneath the Qinling orogen Belt revealed by SKS-wave splitting. Chin. J. Geophys. 64 (5), 1608–1619. doi:10.6038/cjg2021O0390
Xiao, W. J., Windley, B. F., Yong, Y., Yan, Z., Yuan, C., Liu, C., et al. (2009). Early paleozoic to devonian multiple-accretionary model for the qilian Shan, NW China. J. Asian Earth Sci. 35 (3–4), 323–333. doi:10.1016/j.jseaes.2008.10.001
Ye, Z., Li, Q. S., Gao, R., Zhang, H. S., Shen, X. Z., Liu, X. Z., et al. (2016). Anisotropic regime across northeastern Tibet and its geodynamic implications. Tectonophysics 671, 1–8. doi:10.1016/j.tecto.2016.01.011
Yin, A., and Harrison, T. M. (2000). Geologic evolution of the Himalayan-Tibetan orogen. Annu. Rev. Earth Planet. Sci. 28, 211–280. doi:10.1146/annurev.earth.28.1.211
Yu, Y., and Chen, Y. J. (2016). Seismic anisotropy beneath the southern Ordos block and the Qinling-Dabie orogen, China: eastward Tibetan asthenospheric flow around the southern Ordos. Earth Planet. Sci. Lett. 455, 1–6. doi:10.1016/j.epsl.2016.08.026
Zhang, C., Guo, Z., Yu, Y., Yang, T., and Chen, Y. (2022). Distinct lithospheric structures of the Ordos block and its margins from P and S receiver functions and its implications for the Cenozoic lithospheric reworking. Geophys. Res. Lett. 49 (6). doi:10.1029/2021GL097680
Zhang, H. S., Teng, J. W., Tian, X. B., Zhang, Z. J., Gao, R., and Liu, J. Q. (2012). Lithospheric thickness and upper-mantle deformation beneath the NE Tibetan Plateau inferred from S receiver functions and SKS splitting measurements. Geophys. J. Int. 191 (3), 1285–1294. doi:10.1111/j.1365-246X.2012.05667.x
Zhang, Y. Q., Mercier, J. L., and Vergly, P. (1998). Extension in the graben systems around the Ordos (China), and its contribution to the extrusion tectonics of south China with respect to Gobi-Mongolia. Tectonophysics 285 (1), 41–75. doi:10.1016/s0040-1951(97)00170-4
Keywords: lithospheric deformation, anisotropy, teleseismic S wave splitting, NE Tibetan plateau, phases SKS PKS and SKKS
Citation: Xia X, Gao Y and Wu Y (2024) Lithospheric deformation revealed by teleseismic phases SKS PKS and SKKS splitting in the NE margin of the Tibetan plateau. Front. Earth Sci. 11:1342796. doi: 10.3389/feart.2023.1342796
Received: 22 November 2023; Accepted: 27 December 2023;
Published: 18 January 2024.
Edited by:
Chang Zhang, Chinese Academy of Sciences (CAS), ChinaReviewed by:
Lijun Chang, Institute of Geophysics, China Earthquake Administration, ChinaXuzhang Shen, Sun Yat-sen University, China
Copyright © 2024 Xia, Gao and Wu. This is an open-access article distributed under the terms of the Creative Commons Attribution License (CC BY). The use, distribution or reproduction in other forums is permitted, provided the original author(s) and the copyright owner(s) are credited and that the original publication in this journal is cited, in accordance with accepted academic practice. No use, distribution or reproduction is permitted which does not comply with these terms.
*Correspondence: Yuan Gao, cXpneXNlaXNAMTYzLmNvbQ==