
94% of researchers rate our articles as excellent or good
Learn more about the work of our research integrity team to safeguard the quality of each article we publish.
Find out more
ORIGINAL RESEARCH article
Front. Earth Sci., 22 January 2024
Sec. Geohazards and Georisks
Volume 11 - 2023 | https://doi.org/10.3389/feart.2023.1340484
 Yulong Qin1*Ze Jiang1Yongqiang Tian1Yuan Jiang1Guanyi Zhao1Jiang Yan1Zhentao Li1Ziwang Cui1Zihui Zhao1Linke Huang1Fuping Zhang1Junfeng Du2
 Zhongdi Rong2
In mountainous landscapes, the diverse geotechnical conditions amplify landslide susceptibility. Factors such as precipitation and seismic activity can trigger landslides, while inherent hazards such as voids, fissures, and compaction deficits jeopardize long-term slope stability. Detecting and forecasting these susceptibilities accurately is crucial. In this paper, the time-domain finite-difference approach and the gprMax software are used to conduct forward modeling of landslide susceptibility. An electrical model of subsurface aqueous structures is created, including water-filled and air-filled cavities, fracture zones, and fault lines. The distinctive radar signal responses within these environments are examined, and a dataset of B-scan images associated with their electrical models is constructed. By employing deep learning algorithms and the robust nonlinear mapping ability of convolutional neural networks in the Pix2Pix generative adversarial network, we accelerate the intelligent inversion of the geological radar data on landslide susceptibility. This innovative approach effectively reconstructs hazard models, offering a reliable basis for interpretation of radar signals.
Mountain landslides, as a typical geological disaster, often pose serious threats to the lives of people and the socio-economic development. Firstly, mountain landslides directly endanger human lives; the rapid descent of large amounts of soil and rocks during a landslide can lead to casualties (Bai et al., 2017; Alcántara-Ayala and Sassa, 2023). Secondly, mountain landslides can also cause damage to infrastructure such as houses, roads, bridges, and dams, resulting in significant economic losses (Zhang et al., 2020; Bao et al., 2022; Jiao et al., 2022). With the intensification of global climate change and the increase in human activities, the frequency and severity of mountain landslides are likely to rise. The internal structure and hidden dangers within landslides are major causes of their occurrence. Therefore, researching and surveying the internal hazardous conditions of landslides is crucial for preventing the impact of landslide disasters.
Geophysical probing has emerged as a crucial strategy for investigating the profound structure and material distribution of landslides. However, in complex mountainous terrain, the geophysical exploration of deep-seated landslide susceptibilities remains beset by inefficiency and limited accuracy. Ground-penetrating radar (GPR), an innovative instrument for geophysical exploration, is a maturing technology with a broadening application scope.
Compared to traditional methods of geophysical exploration, GPR has advantages such as a high detection efficiency, nondestructive probing, high precision, and robust interference resistance. It has been demonstrated to have an immense potential in applications such as landslide geological mapping, fault detection, and lithological identification (Hu and Shan, 2016; Hallal et al., 2019; Duffek et al., 2023). This noninvasive method can be used to rapidly and economically assess the internal conditions of landslides.
Moreover, to achieve a more holistic understanding of the subsurface conditions, GPR can be integrated with other geophysical methods. For example, as demonstrated by Leucci (Leucci, 2006), GPR can be combined with other geophysical methods such as seismic tomography and resistivity tomography. Such a multifaceted approach can enhance subsurface characterization and diminish the uncertainty associated with data interpretation.
The forward modeling of GPR data can be broadly classified into two categories: numerical simulations and physical model experiments. Numerical simulations, leveraging computer programming for direct modeling, have the benefits of convenience and cost-effectiveness during model adjustments. In contrast, physical model experiments demand a greater time investment for material preparation and model construction, whereas numerical simulations are more efficient and convenient.
There are several numerical simulation techniques for GPR, and each has its unique advantages and methodology. Ray tracing, a prominent method, involves plotting the paths of electromagnetic waves when they encounter interfaces and obstacles. The finite element method (FEM) is another widely used technique that discretizes the target area into different segments, permitting localized analysis of complex structures. The method of moments is derived from the integral form of functional theory. Moreover, the finite-difference time-domain (FDTD) method is recognized to have a good ability to discretize Maxwell’s equations in both space and time. The strength of the FDTD method lies in its ability to elaborate simulations of intricate subsurface structures and associated wave propagation phenomena.
gprMax, an open-source software package devised for the simulation of electromagnetic wave propagation in complex environments, was specifically designed for use with GPR data. Originally developed in 1996 by Antonis Gian-nopoulos at the University of Edinburgh, it employs the FDTD method for simulating GPR systems (Giannakis et al., 2016). Warren re-engineered it using Python and Cython to implement more detailed and complex simulations such as perfect matched layer (PML), diagonal anisotropic materials, dispersive media, and soil modeling (Warren et al., 2016). Feng proposed a novel hybrid algorithm that combines the finite element time-domain (FETD) and FDTD methods for fine GPR simulation of complex subsurface engineering defects (Feng et al., 2018). This method has improved the efficiency and accuracy of simulating electro-magnetic wave propagation in models with different defects, providing deeper insights and more precise technical guidance for defect interpretation and analysis. Lin employed the FDTD method for forward modeling and back-projection imaging and studied the rapid, nondestructive detection and assessment of common tunnel damage using GPR (Lin et al., 2019). GPR imaging effectively recognizes dielectric changes before and after grouting, providing valuable alternative solutions for detecting tunnel lining leakage and reinforcing structural defects in subsurface engineering. Lv introduced a reverse time migration (RTM) algorithm for GPR, which can be used to more accurately locate subsurface engineering cavities compared with traditional methods, and it offers higher resolution and superior interference suppression capabilities (Lv et al., 2020). The RTM algorithm has been demonstrated to have potent anti-interference capabilities, providing accurate radar section interpretations in high-interference environments. Luo utilized forward modeling, laboratory experiments, and numerical simulations to study GPR responses of voids in urban infrastructure, revealing various patterns in GPR B-scans based on the ratio of the void size to the signal wavelength and enhancing the accuracy of void identification in complex subsurface environments (Luo et al., 2020). Wu suggested a method for detecting voids using GPR and a forward model based on the FDTD method. It was observed that the response pattern of the voids depends on their width, and water-filling expands the response range and produces virtual images (Wu et al., 2022). Despite the interference from rein-forcement bars, the central location of the voids can still be precisely located using 3-D GPR.
In summary, numerous researchers have made significant contributions in the field of GPR forward modeling in recent years, and such modeling has been validated and applied within the sphere of engineering practice. However, there exists a conspicuous dearth of research related to the identification of landslide soil–rock body defects and damage such as fissures and voids, which are crucial aspects for the assessment of landslide stability and the implementation of safety measures.
GPR inversion plays a critical role in the detection of defects and damage in the fields of civil and geological engineering. GPR inversion techniques have been deployed to detect and monitor various engineering damage, including voids, cracks, and seepage. Koch analyzed the status quo of computer vision assessment of various types of civil infrastructure, including reinforced concrete bridges, precast concrete tunnels, and underground pipelines (Koch et al., 2015). Adler proposed a partial learning method to address ill-posed inverse problems of nonlinear forward operators. This method combines classic regularization theory and deep learning and performs better than filtered back projection and total variation reconstruction in nonlinear tomographic inversion problems (Adler and Oktem, 2017). Feng introduced a GPR full waveform inversion method that utilizes a total variation regularization and multi-scale inversion strategy to accurately reconstruct complex irregular defects in tunnels under complex geological conditions (Feng et al., 2019). Lei proposed a deep learning–based ap-proach using an adaptive target region detection algorithm and a convolutional neural network-long short-term memory (CNN-LSTM) framework to identify object diameters in GPR B-scans (Lei et al., 2020). This method achieved a 99.5% accuracy for simulated datasets and 92.5% accuracy for field datasets, offering a promising solution for GPR data interpretation. Qin introduced an automatic identification method based on deep learning using Mask R-CNN to identify tunnel reinforcements, voids, and initial lining from GPR images (Qin et al., 2021). By employing the FDTD method and deep convolutional generative adversarial network (DCGAN) for data augmentation, this method was demonstrated to have a decent identification accuracy in field GPR investigation experiments. Liu proposed a deep neural network (DNN) architecture, GPRInvNet, aimed at mapping GPR B-scan data to complex permittivity images (Liu et al., 2021). This method effectively reconstructs subsurface engineering defects with clear boundaries. Li developed a deep learning algorithm, GR-RCNN, which fuses the 2-D and 3-D features of GPR B-scans and C-scans and can reliably detect subsurface defects in airport runways even under noisy conditions (Li et al., 2021). Wang proposed a rebar clutter elimination-generative adversarial network (RCE-GAN) method to improve tunnel lining void recognition in GPR data by eliminating steel bar clutter using generative adversarial networks (Wang et al., 2022). This method has achieved good results for both generated and real-world images. Liu presented a method that uses a deep 3-D convolutional network and multiple mirror encoding to capture 3-D GPR data (Liu et al., 2023). This method improves the accuracy of subsurface object classification by capturing the spatiotemporal features between parallel B-scans, and it outperforms existing B-scan-based methods. Yang proposed a defect segmentation method for non-destructive testing of internal defects in subsurface engineering using GPR data (Yang et al., 2022). This method leverages a CNN called Segnet and a loss function to improve the accuracy, automation, and efficiency of defect recognition. Hou proposed a method for automatically detecting latent lining damage inside tunnels using GPR data. This method employs convolutional neural networks to suppress strong reflections from reinforcement bars and uses a support vector machine to extract multi-dimensional features in the time, frequency, and time-frequency domains (Hou et al., 2022). Liu developed a method for evaluating the overall condition of tunnel linings using GPR images, which was validated through numerical simulations, sandbox experiments, and field tests, and it was found to effectively identify defects and thickness sections from GPR B-scan images (Liu et al., 2022).
In conclusion, through the development of numerous techniques and methodologies, significant advancements have been made in recent years in GPR inversion research for tunnel damage detection. The ongoing integration of novel methods and machine learning technologies promises to foster further progress in this domain, with potential applications spanning various aspects of subsurface and geological engineering monitoring. However, research on landslide hazard damage inversion based on deep learning remains notably scarce.
In this paper, the TDFD method and the gprMax software were used to conduct forward modeling to realize the forward simulation of landslide susceptibility defects. An electrical model for water-filled and air-filled voids, fissures, and uncompacted areas is established, and the characteristic responses and patterns of radar signals within different constructs are researched and analyzed. Using the gprMax software, the forward simulation of numerous irregular lining defects is performed, and a dataset that correlates B-scan images of landslide defects with their corresponding electrical model imagery is established. Leveraging deep learning algorithms and utilizing the Pix2Pix generative adversarial network, we accomplish the intelligent inversion of GPR data. Based on the nonlinear mapping relationship of deep learning, effective landslide defect models are generated, providing a reference for the interpretation of radar signals.
The dimensions and distributions of soil–rock bodies differ significantly from traditional single target detection or uniform layered medium detection. In the case of such loose materials, conducting forward simulations with different parameters may lead to substantial disparities. The factors influencing the simulation results include the distance between the transmitting and receiving antennas, the center frequency of the antenna, and the step length of the spatial grid.
Given the characteristics of the gprMax software, its command can only create regular spatial geometric shapes, such as spheres, cuboids, and cylinders. However, irregular shapes such as soil–rock mixtures, cracks, and uncompacted areas are challenging to model directly using gprMax. Forward simulations that substitute regular shapes for complex shapes often result in excessive errors.
In this paper, we generate irregular rocks by writing Python scripts, saving them as HDF5 files, and using gprMax to read the HDF5 files for irregular rock modeling. We can control parameters such as the number of rock particles and the radius of the rocks through the script, thereby controlling the pixel occupancy ratio of the rocks in space. This control allows for the setting of different soil–rock ratios. The effect of the rock generation is shown in Figure 1A.
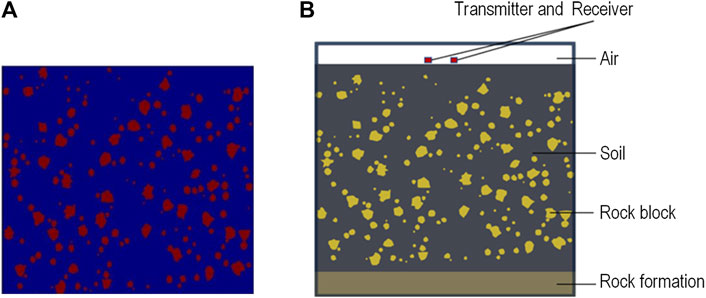
FIGURE 1. Schematic diagram of soil-rock mixed medium modeling: (A) Diagram of randomly generated rock fragments, (B) soil-rock medium model.
We import the rocks to create the geoelectric model depicted in Figure 1B to study the typical features of the GPR reflection signal of the soil-rock mixture with randomly distributed rocks. The upper layer of this model is air, the middle layer is a 3-m-thick soil–rock body, and the lower layer is a rock layer. The number and grain size of the rocks are adjusted to control the soil–rock ratio of the soil–rock mixture, and the relative permittivity of the soil is controlled to manage the water content. The model calculation parameters are listed in Table 1. The rock grain size, ranging from 4 to 50 cm, is arranged randomly.

TABLE 1. Parameters for forward modeling of the model.
The excitation source is a point source, and a Ricker wavelet is selected. The transmitting antenna and receiving antenna are 0.3 m apart. The computational load of the forward simulation model increases with enhancement of the grid accuracy. Considering the calculation accuracy and time, the grid cell length is set to 0.005. The soil and rocks are nonmagnetic materials, and their magnetic conductivity is typically assumed to be 1 H/m, with a magnetic loss factor of 0.
According to the principles of electromagnetism, the phase velocity of electromagnetic waves in a loss medium is a function of the frequency. The phase velocity of the electromagnetic pulse wave changes with the temporal discretization interval and the spatial discretization interval, and numerical dispersion can occur as the number of iterations increases. To ensure the stability of the numerical solution, the temporal discretization interval and spatial discretization interval are not arbitrarily selected. They must meet certain conditions to limit the numerical dispersion to the minimum range. Talflove (Umashankar and Taflove, 1982) conducted an in-depth study and research on the differential grid algorithm and provided the limiting conditions for the temporal discretization interval Δt and the spatial discretization intervals Δx, Δy, and Δz:
where c is the speed of light in vacuum (m/s).
Eq. 1 represents the Courant stability condition, which indicates the corresponding relationship between the spatial discretization and temporal discretization when the numerical dispersion is limited to the minimum range.
Generally, we divide the Yee grid evenly to simplify the calculations and select a discrete spatial step length. Eq. 1 can be simplified as follows:
The discretization of the continuous Maxwell’s equations inevitably results in electromagnetic pulse wave dispersion, leading to calculation errors or even divergence. To reduce the impact of the numerical dispersion, we typically select a spatial discretization step length of less than λ/10 of the electromagnetic wavelength to enhance the stability of the numerical solution.
In performing TDFD simulations of GPR data, the selection of an appropriate excitation source is critical. The Ricker wavelet is a pulse signal that is widely used in seismology and is suitable for detecting underground media with different permittivities. The Ricker wavelet is a broadband, nonperiodic pulse signal commonly employed in seismic prospecting and geological detection. The mathematical expression of the Ricker wavelet is as follows:
where f0 is the dominant frequency, and t0 is the central moment of the waveform. After Fourier transformation, it is as follows:
In the TDFD simulation of GPR data, absorbing boundary conditions (ABCs) are a technique used to handle reflections at the boundaries of the computational domain. Since the field values at the boundaries of the computational domain inevitably reflect back during the computation, if these reflected waves are not treated, they can lead to bias and instability in the simulation results. The PML is currently the most widely used ABC, and it is capable of effectively absorbing waves with all angles and frequencies and is suitable for various computational conditions and models.
In actual computations, the PML absorption boundary condition usually consumes more computational resources than other ABCs, but it can effectively reduce the size of the computational area while ensuring computational accuracy, thereby improving the computational efficiency. In this paper, the PML absorbing boundary condition is used in the numerical simulations.
Pix2Pix is a type of conditional generative adversarial network (cGAN) primarily aimed at learning the mapping relationship from input images to output images. The Pix2Pix network consists of two main components: a generator and a discriminator. These components work in coordination during the learning process to achieve the desired image-to-image transformation.
The objective in training the generator, denoted as G, is to produce outputs indistinguishable from real images for a discriminator, denoted as D, that has been trained adversarially. The discriminator, D, is tasked with maximizing its proficiency in identifying the fake images from the generator. This training process is illustrated in Figure 2.
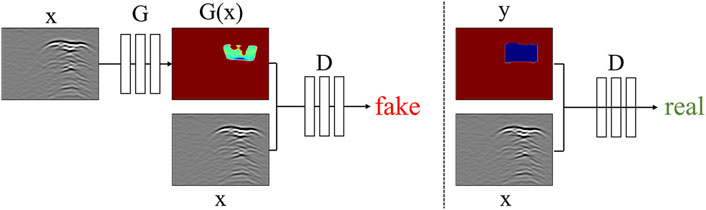
FIGURE 2. Training procedure.
The learning process in Pix2Pix involves training the generator and the discriminator in an adversarial manner. This learning process can be summarized as follows. The generator receives an input image and generates an output image. The discriminator handles the input image paired with the generated output image or the real output image. The generator is trained to minimize the likelihood that the discriminator can correctly identify its generated output image as a fake image. The discriminator is trained to maximize the probability of correctly classifying real and fake output images. This adversarial training process continues until a state of equilibrium is reached, at which point the output image generated by the generator is highly similar to the real output image, and the discriminator can no longer accurately distinguish between real and fake output images.
In the application of GPR image inversion, the Pix2Pix deep learning framework shown in Figure 3 can provide an effective means of learning the nonlinear mapping between the GPR data and the corresponding dielectric constant model, potentially enhancing the accuracy and efficiency of the inversion process.
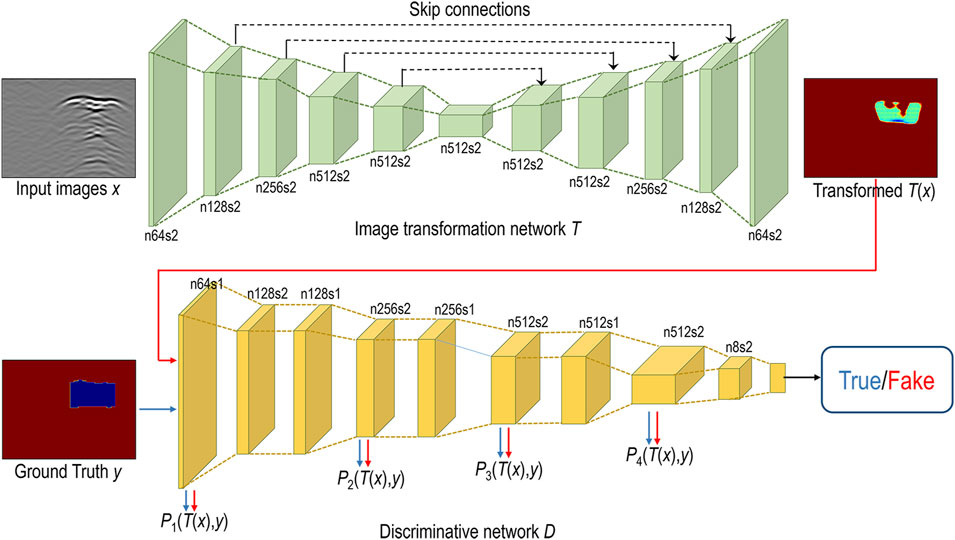
FIGURE 3. Pix2Pix network architecture.
As depicted in Figure 4, the generator in Pix2Pix employs U-Net (Ronneberger et al., 2015), a network structure extensively used in the field of image segmentation. The principal advantage of U-Net lies in its capability to fully incorporate features. This is achieved through its unique skip connections, which allow the model to capture both local and global context information. The utilization of U-Net within the Pix2Pix model enhances the image transformation capability as the generator can better retain the fundamental features and structures in the translated images.
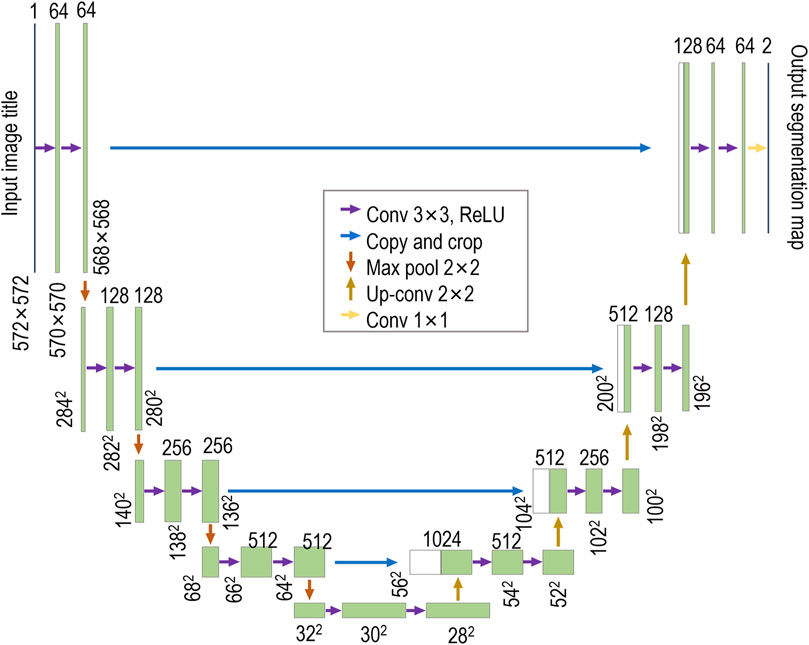
FIGURE 4. U-net network architecture.
The discriminator within the Pix2Pix model employs the PatchGAN architecture. In contrast to traditional discriminators that evaluate the authenticity of the entire input image, PatchGAN operates on a per-pixel basis and predicts the probability values for each N×N sized region of the input image (Figure 5). The primary advantage of PatchGAN is its ability to capture more detailed image nuances and maintain the local structures in the image. By assessing the authenticity of smaller image pixels, the discriminator can effectively enforce a higher level of consistency within the generated images while maintaining a computationally efficient architecture. This approach enables better differentiation between real and fake images, enhances the training stability, and increases the convergence speed.
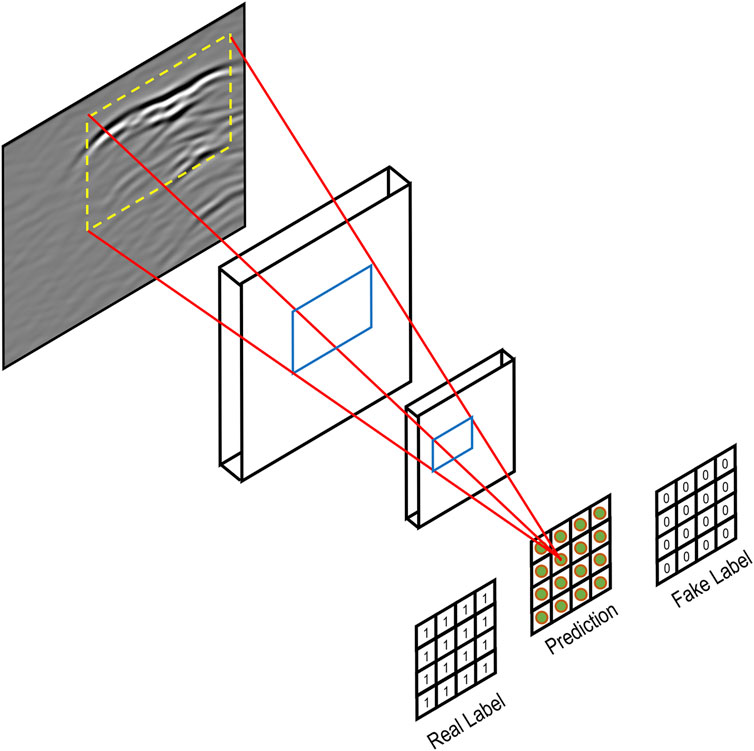
FIGURE 5. Schematic diagram of PatchGAN.
The production of the forward simulation dataset and the configuration of the relevant inversion learning training environment are depicted in Table 2. The performance of the graphics card significantly impacts the GPR forward simulation based on gprMax, the production of the related dataset, and the inversion of landslide hazard structure targets based on Pix2Pix. By employing the appropriate configuration for graphics processing unit (GPU) acceleration, the computational time can be substantially reduced.

TABLE 2. Configuration of the experimental environment.
The characteristics of GPR signals, particularly their amplitude, tend to decrease rapidly when penetrating the ground, which can negatively affect the visibility of deep and shallow reflections. Therefore, it is crucial to calibrate or apply time gain to these signals to maintain their visibility at various depths. Time-gain calibration methods based on models are essential for ensuring the fidelity of GPR data and minimizing potential signal confusion. After undergoing nonlinear time gain processing, the form of the signal significantly changes (Figure 6). Generally, the energy variation of electromagnetic waves obeys an exponential law. Therefore, the time gain function is chosen in the form of exponential gain:
where x is the sampling rate or time.
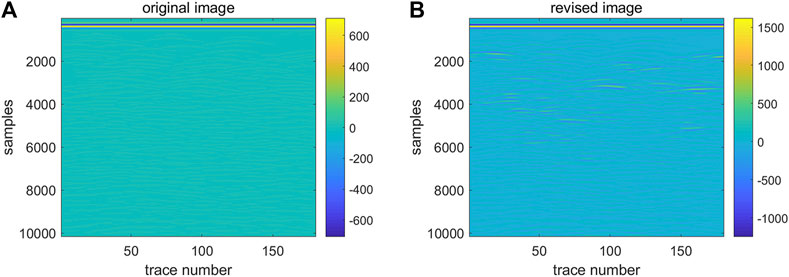
FIGURE 6. Comparison of signal before and after time gain application: (A) Before gain application, (B) before gain application.
Generally, an upper limit is set for the maximum value of the time gain function, which should not increase indefinitely. Figure 6 illustrates a case where the maximum gain is limited to 40.
As illustrated in Figure 6, the original radar signal waveform appeared relatively flat, with minimal variation in color, indicating a fairly uniform signal intensity across the entire detection range. However, after the application of time gain adjustments, the waveform exhibits more detailed and varied structural changes. The color variation becomes more pronounced, indicating significant changes in signal intensity. Moreover, the color scale of this image displays a signal intensity range from −1,000 to 1,500, which is broader than that of the original image, suggesting that the revised image offers greater signal contrast.
A common problem when analyzing GPR data is the presence of a direct wave. The direct wave is a signal that propagates directly from the transmitting antenna to the receiving antenna without interacting with the ground. The direct wave is usually the largest and strongest signal in the GPR data, and it masks other signals from underground features. To accurately analyze underground features using GPR, the direct wave must be deleted from or minimized in the GPR data. In this paper, the direct wave is physically eliminated by modifying the GPR system (Figure 7).
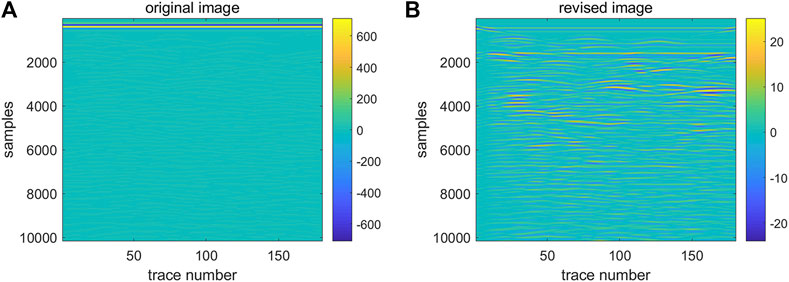
FIGURE 7. Comparison of the signal before and after the removal of the direct wavefront: (A) Before removal of the direct arrival wave, (B) After removal of the direct arrival wave.
As can be seen from Figure 7, by eliminating the direct wave, the signals from underground features become clearer and easier to identify, which leads to a more accurate and reliable interpretation. In addition, removing the direct wave helps reduce the noise and improve the signal-to-noise ratio of the GPR data, thereby enhancing the sensitivity of the GPR to subtle underground features. Overall, the removal of the direct wave is an important step in GPR data processing and can significantly improve the accuracy and reliability of underground surveys.
Void damage in landslides refers to the cavities or open spaces formed within the soil–rock mixture. The formation of voids in landslide is typically attributed to several factors: groundwater, excessive rainfall and snowmelt, and plant roots penetrating the rocks and soil. Differences in the inducing factors and environmental conditions lead to variations in the size, shape, and distribution of voids, the presence of which jeopardizes the structural stability and safety of landslides.
The forward model of the void is defined with dimensions of 2 m×1 m, a grid division of 0.002 m×0.002 m, a PML absorption boundary of 10 grids, and a time window of 20 ns The Ricker wavelet is selected, the antenna frequency is set to 800 MHz, the coordinates of the transmitting antenna are (0.02, 0.95), and the coordinates of the receiving antenna are (0.10, 0.95). The antenna movement step is 0.01 m, and the time step is 0.01 ns Two irregular circular voids area separately filled with air and water. The background soil material properties are ε=9 and σ=10−6; the air parameters are ε=1 and σ=0; and the stone parameters are ε=7 and σ=0.001. As previously discussed, the stone modeling method for soil–rock mixtures was leveraged for the stone modeling. The geoelectric model is depicted in Figure 8A.
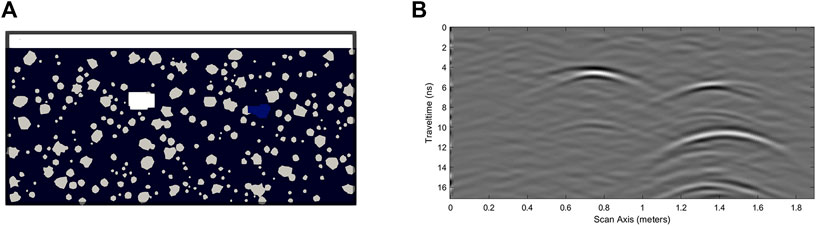
FIGURE 8. Schematic of landslide slope cavity model and B-scan: (A) Electrical model diagram of cavity, (B) B-scan grayscale image of cavity.
Figure 8B shows that in the corresponding GPR scan images, the forward simulation of the landslide cavities invariably manifests as hyperbolic waveforms that open downward. The apex of the hyperbolic waveform corresponds to the peak of the reflected amplitude, and the amplitude on both sides is relatively subdued. Owing to the disparities in the electromagnetic characteristics, different filling media result in significant differences in the cavity imaging results. For the cavities filled with air, the hyperbolic feature of the imaging and the echo feature corresponding to the upper and lower boundaries of the cavity are fairly conspicuous. This is because the relative permittivity of the air-filled target is relatively close to that of the soil and rock, resulting in a relatively weak reflection of the electromagnetic waves and thus a relatively low intensity on the B-scan echo graph. However, the water-filled cavities exhibit prominent imaging hyperbolic features and multiple wave reflections. This is because the vast difference in the dielectric properties of water and the geological environment lead to a stronger ability to reflect electromagnetic waves, which is manifested as prominent high intensity features in the radar cross-section.
Regarding the two types of cavities filled with different media, the reflection wave amplitude of the water-filled cavities is larger, and the reflection wave amplitude of the air-filled cavities is smaller. Moreover, when comparing the reflection waves of the water-filled cavities and air-filled cavities, a phase reversal occurs. It can also be observed that waveform trailing occurs after the cavity reflection wave. This is due to the scattering coherence caused by the defect’s edges, coupled with multiple reflections of the radar wave within the defect and their superposition.
By examining these amplitude and phase changes, we can assess the electrical differences and determine the nature of the cavity damage.
The loosening or nonadherence between disparate layers of lithic materials defines the lack of compactness within the slope, which jeopardizes the structural integrity of the landslide, thereby instigating potential safety hazards. The defects caused by non-compactness are epitomized by the creation of multiple randomly arrayed diminutive cuboidal cavities, which are areas filled with water or air. The associated geoelectric model is illustrated in Figure 9A, and the forward model and material parameters are the same as those of the cavity forward parameters. The resultant radar signal B-scan image after forward modelling is depicted in Figure 9B.

FIGURE 9. Schematic diagram of uncompacted electrical model and corresponding B-scan grayscale image of radar signal: (A) Electrical model of water-filled uncom-pacted zone, (B) B-scan grayscale image of wa-ter-filled uncompacted zone, (C) electrical model of air-filled uncom-pacted zone, (D) B-scan grayscale image of air-filled uncompacted zone.
The basic model parameters are set to the same values used for the previous looseness damage filled with water. The looseness damage was randomly imported and the filling medium was replaced with air. The corresponding geoelectric model is shown in Figure 9C, and the B-Scan image of the radar signal after forward modeling is shown in Figure 9D.
It was found that strong reflection signals appear in the loose areas of the slope body. Due to the differences in the electro-magnetic properties, the imaging results for the different filling media are significantly different. For the looseness area filled with air, the reflection effect of the electromagnetic waves is relatively weak, and the intensity displayed in the Bscan echo image is relatively weak. This is because the relative permittivity of the target body of the air is relatively small compared to the permittivity of the concrete. It was found that in the radar echo signal of the air-filled loose area, the signal intensity on both sides gradually decreases. In addition, the water-filled loose area exhibits more pronounced echo characteristics. The image is overall intertwined and chaotic, the damage distribution is irregular, e.g., resembling a honeycomb, and the reflection in the middle position is relatively strong. This is because in the dense bubble area, each air coordinate position produces diffraction and reflection in different directions, and the bubble position is irregular. The reflected signal undergoes several superpositions, and the area with more overlaps has more complex signals. At this time, the reflection coefficient of the electromagnetic waves passing through the water medium is less than 0, and the attenuation of the electromagnetic waves is more serious.
Landslide fractures, fissures, and interlayer separations within lithic materials pose potential threats to the landslide’s structural integrity and safety. The random distributions of the fracture width, length, and direction enable the categorization of such landslide fractures into distinct types based on their underlying causes. Irregular fractures are arbitrarily generated, filled with water, and depicted in the corresponding geoelectric model in Figure 10A. The forward model and material parameters are the same as those for the cavity forward parameters.
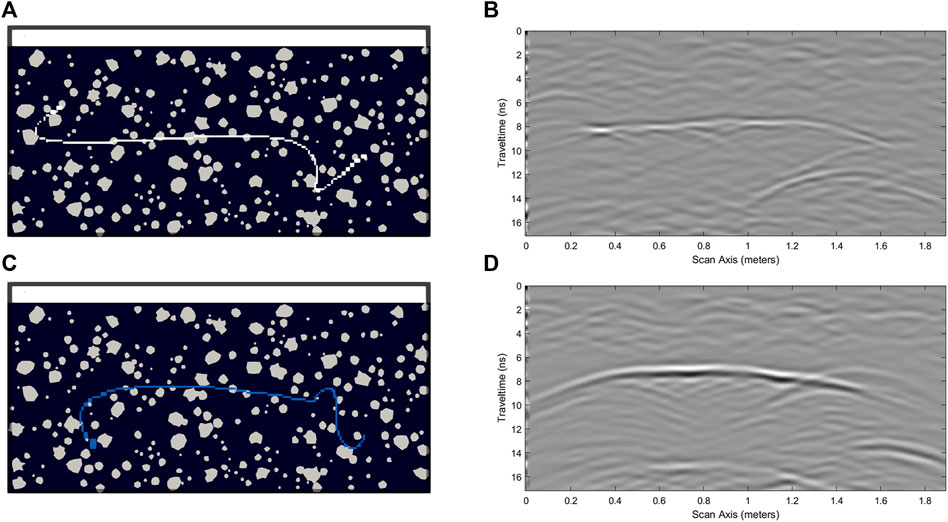
FIGURE 10. Schematic diagrams of fracture electrical model and corresponding B-scan grayscale images of radar signal: (A) Electrical model of air-filled fracture, (B) B-scan grayscale image of air-filled fracture, (C) electrical model of water-filled fracture, (D) electrical model of water filled fracture.
The model’s fundamental parameters are consistent with those of the fractures filled with water, as detailed previously. Irregular fractures are introduced randomly, but the filling medium is now air, as portrayed in the corresponding geoelectric model in Figure 10C. The radar signal’s B-scan image is depicted in Figure 10D.
Figures 10B, D illustrate the radar forward projection maps corresponding to fractures filled with water and air, respectively. Both models exhibit distinct reflection waves at 8 ns The phase characteristics manifest as continuous cophase axes with trends consistent with the primary horizontal fractures in the center of the fractures. The upper and lower interfaces of the fractures correspond to the strong reflection signals, and hyperbolic diffraction waves appear at both ends of the fractures, indicating conspicuous diffraction phenomena. The reflection wave amplitude of the water-filled fractures is larger, producing a strong radar signal, and the phase of the reflection wave from the water-filled fracture is inverted compared to that of the air-filled fracture.
In this study, we employed the GprMax software to simulate the response of Ground Penetrating Radar (GPR) to various subsurface anomalies. The process of dataset creation involved using Python to generate batch input files for GprMax and to execute these simulations in bulk. This method efficiently produced a comprehensive dataset, which can be utilized for training and validating machine learning models for landslide anomaly detection and characterization. The dataset comprises 700 models of different cavity shapes, 300 randomly generated models of unconsolidated anomalies, and 300 models of irregular fractures. Each model was processed accordingly, and pairs of model images and their corresponding echo maps were fed into the Pix2Pix network structure for training.
It is noteworthy that upon completion of batch simulation calculations for the corresponding damage models, synthesized radar data files were retrieved and subjected to pertinent pre-processing, such as the removal of direct waves, time gain, and contrast enhancement. As depicted in Figures 11–13, the red filling medium represents water, and the blue signifies air.
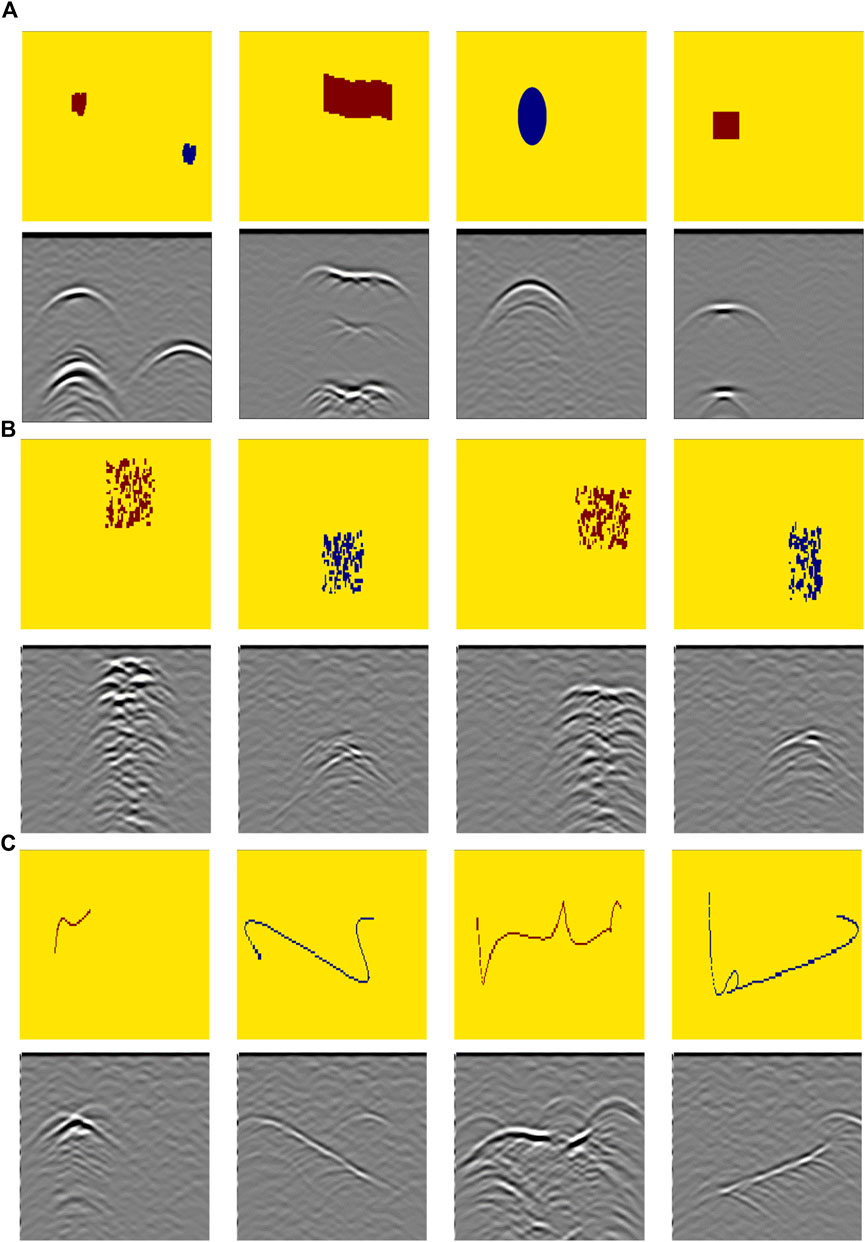
FIGURE 11. Examples from dataset. (A) Selection of examples from the cavity dataset, (B) Selection of examples from the fracture dataset, (C) Selection of examples from the fracture dataset.
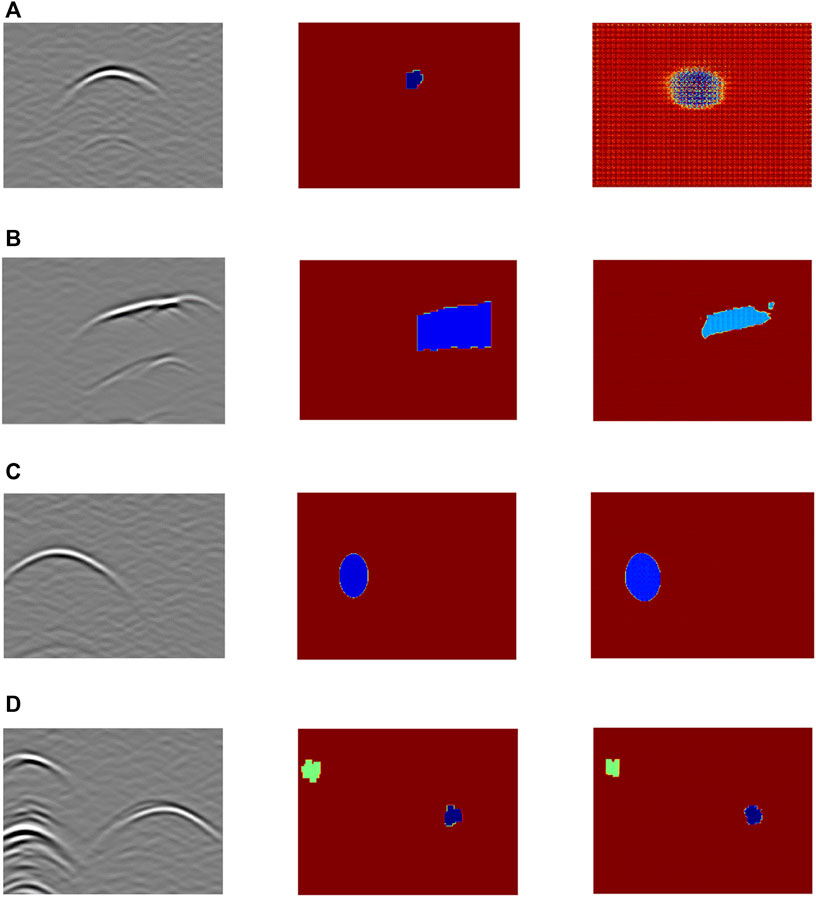
FIGURE 12. Schematic diagram of the training optimization process: (A) Epoch1, (B) Epoch50, (C) Epoch100, (D) Epoch200.
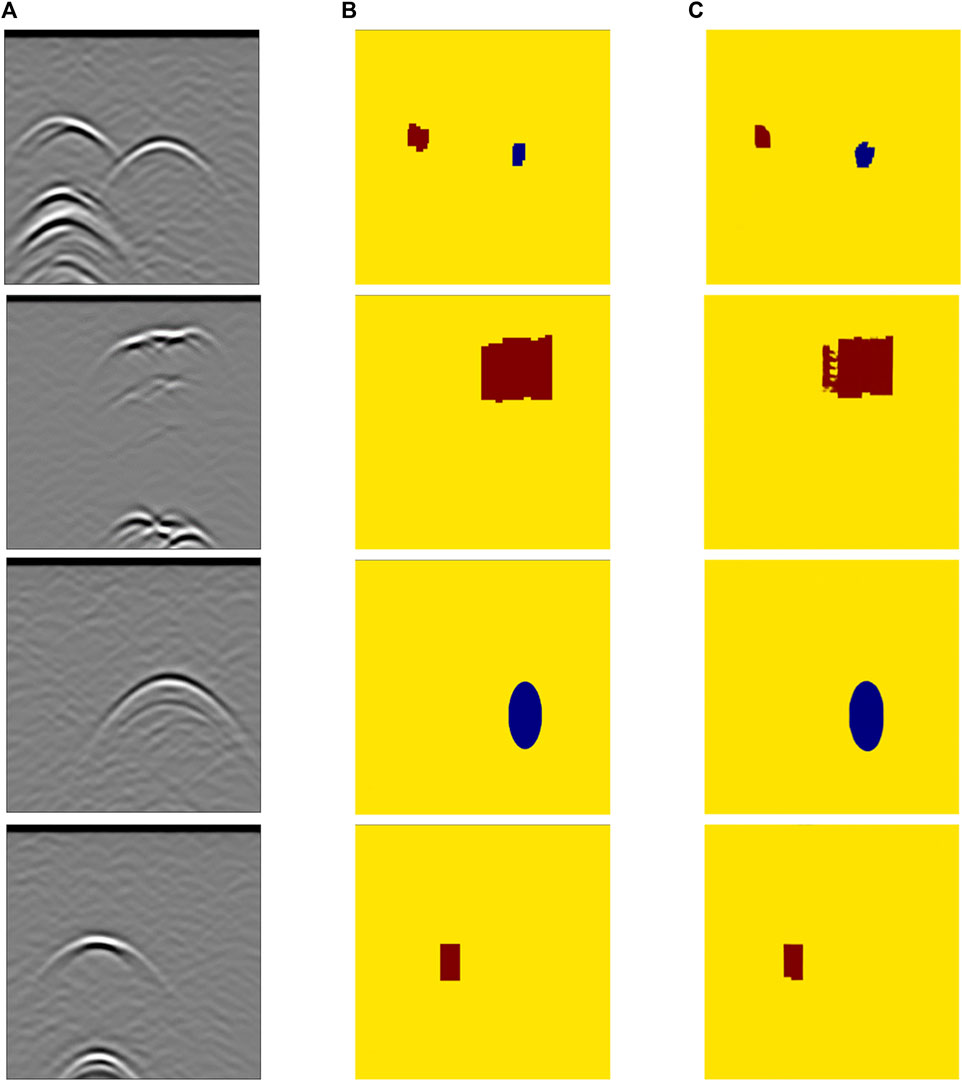
FIGURE 13. Cavity inversion results (epoch = 200): (A) B-scan images, (B) model images, (C) inversion results.
Upon completion of all of the simulations and the corresponding processing, the GPR data and associated damage parameters were compiled into a dataset for subsequent analysis, training, and validation of the machine learning model. By employing this method, we effectively generated an integrated dataset comprising various landslide hazards and their corresponding GPR responses. This dataset is a valuable resource for developing and evaluating advanced signal processing and inversion techniques and can be utilized for GPR-based detection and characterization of landslide hazards.
In this study, the Pix2Pix model was utilized to reconstruct voids of various shapes, thereby achieving our goal of inverse reconstruction pertaining to landslide cavity damage.
Figure 12 illustrates the void damage, manifesting the ongoing optimization of the learning process during training. It is discernible that at epoch = 1, even for singular void damage, the images generated remain relatively indistinct and significantly deviate from the model images. With increasing training iterations, the images produced by Pix2Pix begin to increasingly converge with the images used for the training, ultimately tending towards consistency, and they still yield a relatively precise outcome for dual void damage.
The inversion results for the landslide void damage are displayed in Figure 13. The corresponding model images of the landslide void damage are shown in Figure 13B, and the echo conditions of the void damage acquired through respective forward simulation using gprMax are illustrated in Figure 13A. Figure 13C depicts the inversion results derived from feeding the images in Figure 13A into the well-trained network. After 200 training iterations, it is evident that the Pix2Pix network model can precisely invert the target structure of the void damage while accurately inverting both the water and air within the voids. Nonetheless, it is not difficult to discern that the inversion effects of the irregular void damage are relatively subpar compared to those of regular voids, such as circular and rectangular shapes, and the inversion results exhibit more pronounced discrepancies from the original model. However, the overall inversion effect is commendable and effectively distinguishes the corresponding target structures and substance properties represented by the radar echo characteristics of the void damage.
The inversion results pertaining to unconsolidated damage are depicted in Figure 14. Figure 14B presents the model image of the unconsolidated damage, Figure 14A shows the echo characteristics of the unconsolidated damage obtained after forward simulation, and Figure 14C displays the inversion results. After 200 training iterations, it is apparent that the Pix2Pix network model can, with reasonable precision, invert the target structure of the landslide unconsolidated damage under water-rich conditions. However, the overall effect is not as satisfactory as the previously discussed results for the void damage, and the cause of such a discrepancy may lie in the relative complexity and irregular shape of the unconsolidated damage.
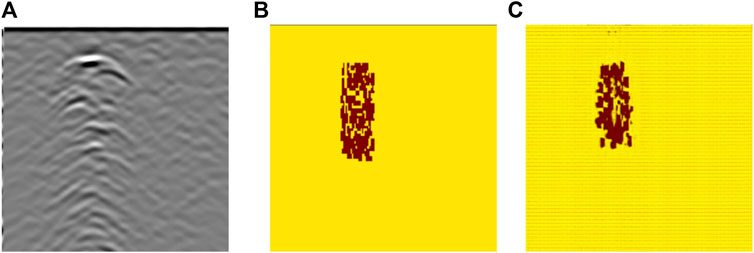
FIGURE 14. Uncompacted zone inversion result (epoch = 200): (A) B-scan images, (B) model images, (C) inversion results.
The inversion results pertaining to the fissure damage are presented in Figure 15. Figure 15B presents the model images of the inflated fissure damage, Figure 15A displays the corresponding B-scan radar echo characteristics of the fissures obtained after forward simulation, and Figure 15C shows the inversion results. After 200 training iterations, the Pix2Pix network model yields a notable inversion effect for the target structure of the landslide fissure damage. The fissure locations in the inversion images essentially coincide with those in the original images, and the shape structure of the obtained fissures also fundamentally aligns with the original model, yielding satisfactory inversion results.
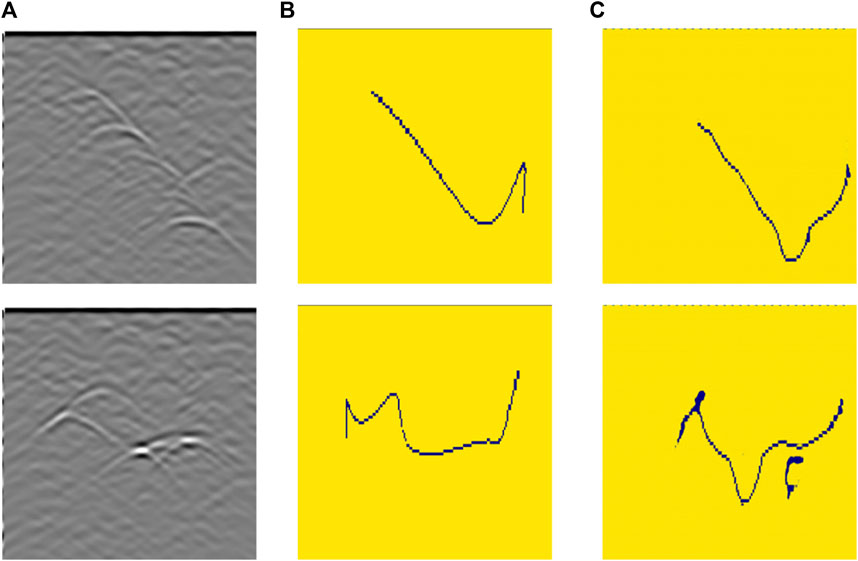
FIGURE 15. Fracture inversion result (epoch = 200): (A) B-scan images, (B) model images, (C) inversion results.
In this study, we addressed the detection of landslide damage via GPR, constructed geoelectrical models of landslide soil and rock mass damage, such as voids, unconsolidated materials, and fissures, based on heterogeneous media, and analyzed the forward radar signals under diverse working conditions. By employing deep learning techniques, the Pix2Pix generative adversarial network was utilized to intelligently invert the GPR data. The echo characteristics of the voids were manifested as downward-opening hyperbolas, with the water-filled voids reflected larger wave amplitudes and the air-filled voids exhibited smaller wave amplitudes. The phase of the reflection wave from the water-filled voids was inverted compared to that from the air-filled voids. The radar reflection waveforms of the unconsolidated damage crossed and disrupted, with cophase axes appearing discontinuously and being misaligned and deformed. The cophase axes of the fissure radar signals were continuous and exhibited a trend similar to that of the primary fissures, with strong reflections corresponding to the upper and lower boundaries and evident diffraction phenomenon occurring at both ends in the form of hyperbolic diffraction waves. The Pix2Pix network model was applied to investigate the correspondence between the landslide damage radar echo signals and the damage model structures, and the abstract radar echo signal images were translated into intuitive and vivid images of the damage model structures. The inversion effect was optimal for simple regularly shaped voids, while for more complex irregular voids, unconsolidated material, and fissure damage, certain discrepancies occurred between the inversion results and the model structures.
Nevertheless, this research has ample room for refinement in the future, such as the inclusion of additional damage types and the inversion of various combinations of damage. Furthermore, augmenting the dataset size, optimizing the network architecture, and incorporating a more extensive set of empirical data would enhance its practical applicability.
The raw data supporting the conclusion of this article will be made available by the authors, without undue reservation.
YQ: Methodology, Writing–original draft. ZJ: Methodology, Writing–original draft. YT: Methodology, Writing–original draft. YJ: Methodology, Writing–original draft. GZ: Methodology, Software, Writing–original draft. JY: Data curation, Software, Validation, Writing–original draft. ZL: Data curation, Software, Validation, Writing–review and editing. ZC: Software, Visualization, Writing–review and editing. ZZ: Data curation, Software, Visualization, Writing–review and editing. LH: Data curation, Software, Visualization, Writing–review and editing. FZ: Writing–original draft. JD: Writing–original draft. ZR: Writing–review and editing.
The author(s) declare financial support was received for the research, authorship, and/or publication of this article. This research was supported by Enterprise Authorized Project supported by State Grid Gansu Power Company Longnan Power Supply Company (SGGSLN00JSGC2310476), the Chongqing Technology Innovation and Application Development Special Key Project by Chongqing Science and Technology Bureau (CSTB2022TIAD-KPX0125), Chongqing Natural Science Foundation Project by Chongqing Science and Technology Bureau (CSTB2023NSCQ-MSX0980), Research and Development Project of the Ministry of Housing and Urban-Rural Development (Grant Nos. 2022-K-086 and 2022-K-040).
Authors YQ, ZJ, YT, YJ, GZ, JY, ZL, ZC, ZZ, LH, and FZ were employed by Longnan Power Supply Company of State Grid Gansu Electric Power Company.
The remaining authors declare that the research was conducted in the absence of any commercial or financial relationships that could be construed as a potential conflict of interest.
The authors declare that this study received funding from the Enterprise Authorized Project supported by State Grid Gansu Power Company Longnan Power Supply Company (SGGSLN00JSGC2310476). The funder was involved in the study design and data collection.
All claims expressed in this article are solely those of the authors and do not necessarily represent those of their affiliated organizations, or those of the publisher, the editors and the reviewers. Any product that may be evaluated in this article, or claim that may be made by its manufacturer, is not guaranteed or endorsed by the publisher.
Adler, J., and Oktem, O. (2017). Solving ill-posed inverse problems using iterative deep neural networks. Inverse Probl. 33 (12), 124007. doi:10.1088/1361-6420/aa9581
Alcántara-Ayala, I., and Sassa, K. (2023). Landslide risk management: from hazard to disaster risk reduction. Landslides 20, 2031–2037. doi:10.1007/s10346-023-02140-5
Bai, M. Z., Du, Y. Q., Chen, Y., Xing, Y. J., and Zhao, P. Y. (2017). Risk assessment of long gas and oil pipeline projects inducing landslide disasters during construction. J. Perform. Constr. Facil. 31 (5). doi:10.1061/(asce)cf.1943-5509.0000986
Bao, H. J., Zeng, C. Y., Peng, Y., and Wu, S. H. (2022). The use of digital technologies for landslide disaster risk research and disaster risk management: progress and prospects. Environ. Earth Sci. 81 (18), 446. doi:10.1007/s12665-022-10575-7
Duffek, V., Tábořík, P., Stacke, V., and Mentlík, P. (2023). Origin of block accumulations based on the near-surface geophysics. Open Geosci. 15 (1). doi:10.1515/geo-2022-0468
Feng, D., Wang, X., and Zhang, B. (2018). Specific evaluation of tunnel lining multi-defects by all-refined GPR simulation method using hybrid algorithm of FETD and FDTD. Constr. Build. Mater. 185, 220–229. doi:10.1016/j.conbuildmat.2018.07.039
Feng, D., Wang, X., and Zhang, B. (2019). Improving reconstruction of tunnel lining defects from ground-penetrating radar profiles by multi-scale inversion and bi-parametric full-waveform inversion. Adv. Eng. Inf. 41, 100931. doi:10.1016/j.aei.2019.100931
Giannakis, I., Giannopoulos, A., and Warren, C. (2016). A realistic FDTD numerical modeling framework of ground penetrating radar for landmine detection. IEEE J. Sel. Top. Appl. Earth Obs. Remote Sens. 9 (1), 37–51. doi:10.1109/jstars.2015.2468597
Hallal, N., Yelles Chaouche, A., Hamai, L., Lamali, A., Dubois, L., Mohammedi, Y., et al. (2019). Spatiotemporal evolution of the El Biar landslide (Algiers): new field observation data constrained by ground-penetrating radar investigations. Bull. Eng. Geol. Environ. 78 (8), 5653–5670. doi:10.1007/s10064-019-01492-4
Hou, L. L., Zhang, Q., and Zhang, R. X. (2022). Automatic detection of diseases in tunnel linings based on a convolution neural network and a support vector machine. Electronics 11 (20), 3290. doi:10.3390/electronics11203290
Hu, Z., and Shan, W. (2016). Landslide investigations in the northwest section of the lesser Khingan range in China using combined HDR and GPR methods. Bull. Eng. Geol. Environ. 75 (2), 591–603. doi:10.1007/s10064-015-0805-y
Jiao, R. C., Wang, S. Y., Yang, H. L., Guo, X. F., Han, J. F., Pei, X., et al. (2022). Comprehensive remote sensing technology for monitoring landslide hazards and disaster chain in the xishan mining area of beijing. Remote Sens. 14 (19), 4695. doi:10.3390/rs14194695
Koch, C., Georgieva, K., Kasireddy, V., Akinci, B., and Fieguth, P. (2015). A review on computer vision based defect detection and condition assessment of concrete and asphalt civil infrastructure. Adv. Eng. Inf. 29 (2), 196–210. doi:10.1016/j.aei.2015.01.008
Lei, W. T., Luo, J. B., Hou, F. F., Xu, L., Wang, R. Q., and Jiang, X. Y. (2020). Underground cylindrical objects detection and diameter identification in GPR B-scans via the CNN-LSTM framework. Electronics 9 (11), 1804. doi:10.3390/electronics9111804
Leucci, G. (2006). Contribution of ground penetrating radar and electrical resistivity tomography to identify the cavity and fractures under the main church in botrugno (lecce, Italy). J. Archaeol. Sci. 33 (9), 1194–1204. doi:10.1016/j.jas.2005.12.009
Li, H. F., Li, N. S., Wu, R. B., Wang, H. C., Gui, Z. C., and Song, D. Z. (2021). GPR-RCNN: an algorithm of subsurface defect detection for airport runway based on GPR. IEEE Rob. Autom. Lett. 6 (2), 3001–3008. doi:10.1109/lra.2021.3062599
Lin, C., Wang, X., Li, Y., Zhang, F., Xu, Z., and Du, Y. (2019). Forward modelling and GPR imaging in leakage detection and grouting evaluation in tunnel lining. KSCE J. Civ. Eng. 24 (1), 278–294. doi:10.1007/s12205-020-1530-z
Liu, B., Ren, Y. X., Liu, H. C., Xu, H., Wang, Z. F., Cohn, A. G., et al. (2021). GPRInvNet: deep learning-based ground-penetrating radar data inversion for tunnel linings. IEEE Trans. Geosci. Remote Sens. 59 (10), 8305–8325. doi:10.1109/tgrs.2020.3046454
Liu, B., Zhang, J. Q., Lei, M., Yang, S. L., and Wang, Z. F. (2023). Simultaneous tunnel defects and lining thickness identification based on multi-tasks deep neural network from ground penetrating radar images. Autom. Constr. 145, 104633. doi:10.1016/j.autcon.2022.104633
Liu, L., Yu, H., Xu, H., Wang, B. J., and Li, J. X. (2022). Underground object classification using deep 3-D convolutional networks and multiple mirror encoding for GPR data. IEEE Geosci. Remote Sens. Lett. 19, 1–5. doi:10.1109/lgrs.2022.3148797
Luo, T. X. H., Lai, W. W., and Giannopoulos, A. (2020). Forward modelling on GPR responses of subsurface air voids. Tunn. Undergr. Space Technol. 103, 103521. doi:10.1016/j.tust.2020.103521
Lv, Y.-Z., Wang, H. h., and Gong, J. b. (2020). Application of GPR reverse time migration in tunnel lining cavity imaging. Appl. Geophys. 17 (2), 277–284. doi:10.1007/s11770-020-0815-9
Qin, H., Zhang, D. H., Tang, Y., and Wang, Y. Z. (2021). Automatic recognition of tunnel lining elements from GPR images using deep convolutional networks with data augmentation. Autom. Constr. 130, 103830. doi:10.1016/j.autcon.2021.103830
Ronneberger, O., Fischer, P., and Brox, T. (2015). “U-net: convolutional networks for biomedical image segmentation,” in Medical image computing and computer-assisted intervention – MICCAI 2015 (Cham: Springer).
Umashankar, K., and Taflove, A. (1982). A novel method to analyze electromagnetic scattering of complex objects. IEEE Trans. Electromagn. Compat. 24 (4), 397–405. doi:10.1109/TEMC.1982.304054
Wang, Y. Z., Qin, H., Tang, Y., Zhang, D. H., Yang, D. H., Qu, C. X., et al. (2022). RCE-GAN: a rebar clutter elimination network to improve tunnel lining void detection from GPR images. Remote Sens. 14 (2), 251. doi:10.3390/rs14020251
Warren, C., Giannopoulos, A., and Giannakis, I. (2016). gprMax: open source software to simulate electromagnetic wave propagation for Ground Penetrating Radar. Comput. Phys. Commun. 209, 163–170. doi:10.1016/j.cpc.2016.08.020
Wu, X., Bao, X., Shen, J., Chen, X., and Cui, H. (2022). Evaluation of void defects behind tunnel lining through GPR forward simulation. Sensors 22 (24), 9702. doi:10.3390/s22249702
Yang, S. L., Wang, Z. F., Wang, J., Cohn, A. G., Zhang, J. Q., Jiang, P., et al. (2022). Defect segmentation: mapping tunnel lining internal defects with ground penetrating radar data using a convolutional neural network. Constr. Build. Mater. 319, 125658. doi:10.1016/j.conbuildmat.2021.125658
Keywords: landslide hazards, deep learning, inverse, forward simulation, neural networks
Citation: Qin Y, Jiang Z, Tian Y, Jiang Y, Zhao G, Yan J, Li Z, Cui Z, Zhao Z, Huang L, Zhang F, Du J and Rong Z (2024) Deep learning–based inverse analysis of GPR data for landslide hazards. Front. Earth Sci. 11:1340484. doi: 10.3389/feart.2023.1340484
Received: 18 November 2023; Accepted: 22 December 2023;
Published: 22 January 2024.
Edited by:
Xinyu Liu, Huazhong University of Science and Technology, ChinaReviewed by:
Lei Su, Qingdao University of Technology, ChinaCopyright © 2024 Qin, Jiang, Tian, Jiang, Zhao, Yan, Li, Cui, Zhao, Huang, Zhang, Du and Rong. This is an open-access article distributed under the terms of the Creative Commons Attribution License (CC BY). The use, distribution or reproduction in other forums is permitted, provided the original author(s) and the copyright owner(s) are credited and that the original publication in this journal is cited, in accordance with accepted academic practice. No use, distribution or reproduction is permitted which does not comply with these terms.
*Correspondence: Yulong Qin, MjJTMDMzMDY3QHN0dS5oaXQuZWR1LmNu
Disclaimer: All claims expressed in this article are solely those of the authors and do not necessarily represent those of their affiliated organizations, or those of the publisher, the editors and the reviewers. Any product that may be evaluated in this article or claim that may be made by its manufacturer is not guaranteed or endorsed by the publisher.
Research integrity at Frontiers
Learn more about the work of our research integrity team to safeguard the quality of each article we publish.