 Yuyue Jia1
 Shuyang Luan
 Mohsen Saleh Asheghabadi
 Junwei Liu
95% of researchers rate our articles as excellent or good
Learn more about the work of our research integrity team to safeguard the quality of each article we publish.
Find out more
ORIGINAL RESEARCH article
Front. Earth Sci. , 08 January 2024
Sec. Geohazards and Georisks
Volume 11 - 2023 | https://doi.org/10.3389/feart.2023.1335756
This article is part of the Research Topic Evolution Mechanism and Control Method of Engineering Disasters Under Complex Environment View all 30 articles
The primary factors responsible for inducing landslide disasters are earthquakes and rainfall. Using the strength reduction method within the finite element analysis software Abaqus, a study was conducted to analyze the stability of coastal geotechnical slopes. This investigation considered the combined influence of rainfall and earthquakes, taking into account the geological conditions and characteristics specific to these coastal areas. The results indicate that, under the same seismic acceleration amplitude, the shear strength of the slope soil gradually decreases as the water content increases, resulting in a decrease in the stability coefficient. Similarly, with a constant water content in the slope, an increase in seismic acceleration amplitude leads to heightened soil shear stress, consequently decreasing the stability coefficient. Maintaining constant water content while increasing seismic acceleration results in elevated soil shear stress, reduced shear strength, and a subsequent decrease in the stability coefficient. The simultaneous occurrence of intense rainfall and a strong earthquake pushes the slope to its most precarious state, causing the most significant reduction in the stability coefficient. Incorporating anti-slip piles substantially enhances the slope’s stability coefficient, and an optimal arrangement of anti-slip piles for the most unfavorable conditions is proposed.
Numerous studies (Chen and Meng, 1995; Lin, 2001; Chen et al., 2005) have provided substantial evidence indicating that rainfall, especially extreme rainfall events, is the primary factor responsible for inducing landslide disasters. Coastal geotechnical slopes, owing to their porous structure, loose composition, permeability, and susceptibility to deformation, are notably prone to erosion during rainfall conditions. This result in elevated soil water content, increased weight, and pore water pressure, subsequently reducing the shear strength of the soil. Furthermore, rainfall infiltration alters the slope’s water table, inducing changes in the stress field environment. The impermeable structural surfaces of slopes experience hydrostatic pressure, leading to a reduction in the normal stress generated by the weight of the sliding mass. This decrease in normal stress diminishes the soil’s resistance to sliding, heightening the slope’s susceptibility to instability.
Earthquakes, as indicated by Liangyu (2023), can profoundly affect slope stability. Unlike rainfall, which unfolds gradually, earthquakes exert a transient impact on slopes. In instances where slopes are already unstable and face an earthquake, the dynamic load from seismic waves intensifies shear stresses within the slope soil, thereby weakening its stability and reducing resistance to sliding forces.
When seismic loading is combined with the increased pore water pressure resulting from rainfall, it significantly reduces the slope’s stability (Pu, 2017; Xu, 2019). Consequently, when a slope encounters dynamic loading from seismic waves alongside heavy rainfall, this compounded dynamic effect can exacerbate the instability of the slope.
Deploying anti-slip piles is an crucial method to mitigate slope slippage, through the anti-slip piles through the sliding surface of the slope body so that it acts on the layer, to provide better anchorage for the slope. Strategically positioning these piles can better balance the forces acting on the slope, significantly increasing its stability coefficient (JIA et al., 2023; Sang, 2023).
To investigate the stability of coastal geotechnical slopes, the strength reduction dynamic analysis method is employed to conduct dynamic stability analyses under various seismic and rainfall scenarios. The objective is to evaluate slope stability under the most severe conditions resulting from the combined impacts of earthquakes and rainfall, and to identify the optimal positioning of anti-slip piles.
The Jiaodong Peninsula region features unique natural geography and engineering geological surroundings. In recent years, an escalation in extreme weather conditions has resulted in a noticeable rise in potential geological disasters, specifically an annual increase in coastal geotechnical slope instability events. This paper concentrates on the Fanlingqian slope in Laoshan District, Qingdao City, for its research. It conducts a comprehensive geological investigation of concealed coastal geotechnical slope disasters, intending to elucidate the regional geological conditions and fundamental characteristics of these disasters.
The landslide slope area in Laoshan District, Qingdao, covers approximately 1.5 km2 in geographic coordinates. Laoshan District, Qingdao, experiences a warm-temperate monsoon climate, characterized by distinctive temperature and rainfall patterns year-round. It boasts an extensive coastline and can reach winter minimum temperatures of about minus six degrees, with limited hot weather during the summer. In terms of rainfall patterns, there is a higher concentration of precipitation during the summer and fall seasons, heightening the risk of landslide geological disasters. Figure 1 illustrates the recent rainfall data for Laoshan District.
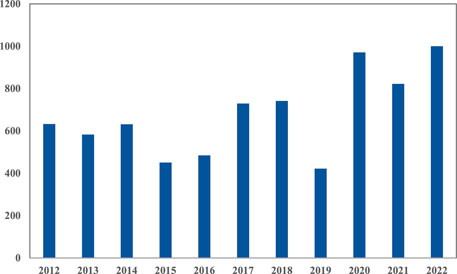
FIGURE 1. Historical precipitation histogram of Laoshan District (2012–2022).
The slopes in the landslide area are exposed in the following sequence, from oldest to newest: Mesozoic Cretaceous Lower Laiyang Group Zhifengzhuang Formation (KlZ) and Cenozoic Quaternary Holocene Shanqian Formation (QS). Bedrock outcrops are observable across the landslide area, characterized by Yanshan Late Granite (γ35) lithology. Site surveys indicate that the landslide area is covered with 3–6 m of slope residue, with well-established vegetation. Portions of the area feature terracing, with upper bedrock exposures. The distribution of rock stratigraphy is detailed in Table 1.
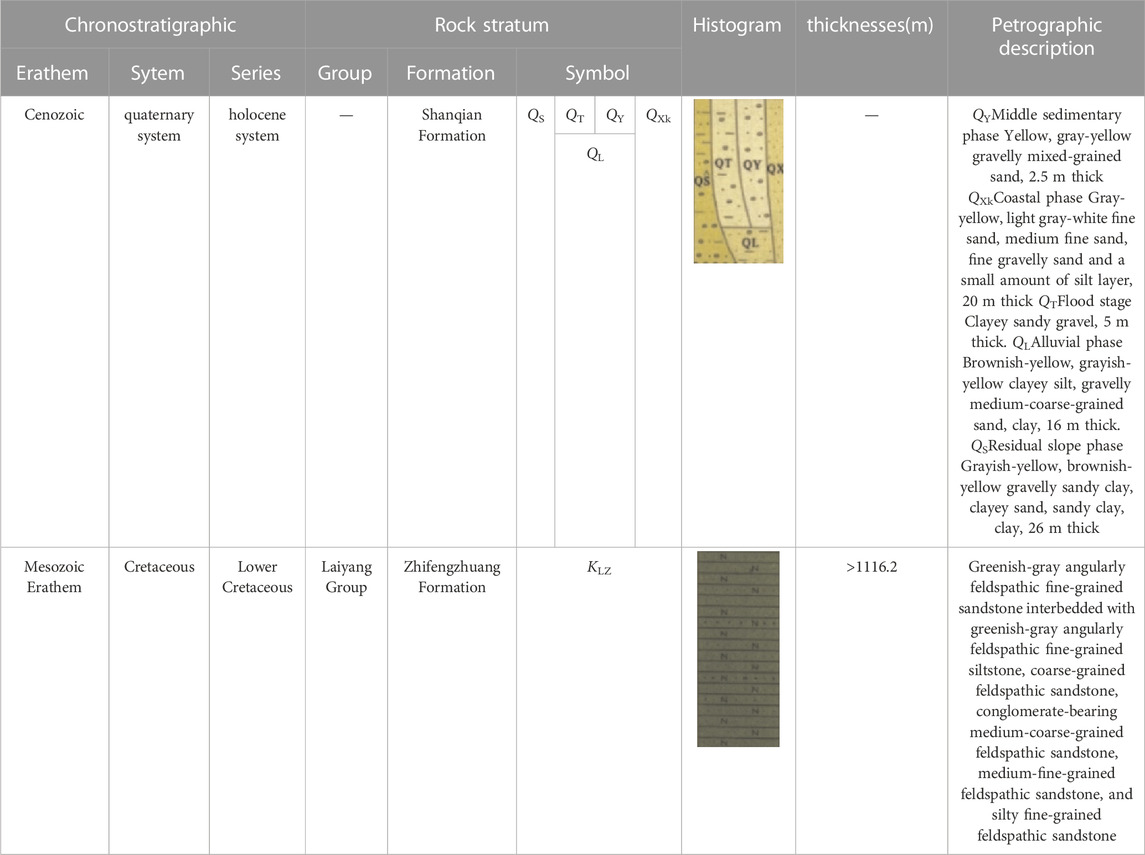
TABLE 1. Composite stratigraphic column profiles.
The Fanlingqian landslide comprises four distinct landslides: the main slipped landslide, along with landslides 1, 2, and 3, depicted in Figure 2. On the eastern side of the landslide area, the main slipped landslide has resulted in the formation of a gully, ranging in depth from 1 to 3 m, oriented approximately at 140°. As a consequence of erosive forces, the gully has accumulated numerous fragmented rocks, revealing localized bedrock exposures.

FIGURE 2. Location of landslides.
While the landslide area is a unified entity, continuous water flow over several years has divided it into two distinct sections. Consequently, during slope sliding, these two separate segments may slide independently, each having potentially distinct sliding characteristics. Landslide three is located on the southwest side of the main slipped landslide, exhibiting visible creeping deformation near the highway’s vicinity, specifically along the trailing edge.
Landslide 1 spans an estimated area of 6.7 × 10⁴ m2 with a depth of approximately 15 m, categorized as a medium-sized landslide. Positioned 10–20 m from the sea surface, it maintains a trailing edge elevation ranging between 150 and 170 m. Along the highway, its length measures 200 m, and along the perpendicular highway, it extends from 220 to 410 m, gradually increasing from west to east. On the other hand, Landslide 2 covers an approximate area of 4.8 × 10⁴ m2 with a depth of about 4 m, also categorized as a medium-sized landslide. The shear exit is located between 5 and 20 m from the sea surface, with a trailing edge elevation ranging from 150 to 170 m. The highway spans a length of 255 m, while the perpendicular highway measures 170 m. As for the third landslide, it encompasses an estimated area of approximately 3.4 × 10⁴ m2, with a depth of about 16 m, categorizing it as a medium-sized landslide. Positioned 5–10 m from the sea surface, it maintains a trailing edge elevation between 55 and 85 m. The highway length within this region extends for 246 m.
In the study area, the predominant material composition of the slide indicates higher consistency in the covering layer, while the primary rock beneath the slide primarily consists of granite with some sandstone. The weathered section of the slide exhibits complexity and lacks uniformity due to the diverse composition of the original rock. As a whole, it can be inferred that the study area is susceptible to landslides, especially during periods of heavy rainfall.
The implicit analysis module and the large deformation mode of the Abaqus finite element software have been chosen. A two-dimensional plane strain model is assumed for calculating and analyzing slope stability issues. The slope model is meshed using the CPE4R reduced integration unit (Asheghabadi et al., 2020a; Asheghabadi et al., 2020b) (Figure 3). The significance of boundary conditions in soil-structure seismic behavior cannot be overstated. Properly defined and implemented boundary conditions serve as a critical link between the modeled system and its real-world environment, influencing the accuracy and reliability of seismic simulations (Asheghabadi and Ali, 2019). In this study, for boundary conditions, infinite elements have been used to prevent the reflection of seismic waves into the model. This boundary condition effectively regulates seismic effects at the model boundaries, ensuring that they do not influence the results obtained from the analysis (Asheghabadi et al., 2019). These specialized elements, often employed in numerical simulations, possess unique characteristics that extend infinitely, facilitating a seamless transition between the modeled domain and its surroundings. Utilizing such elements enables the model to encapsulate seismic dynamics effectively, preventing undesired interactions and enhancing the accuracy of analytical outcomes.
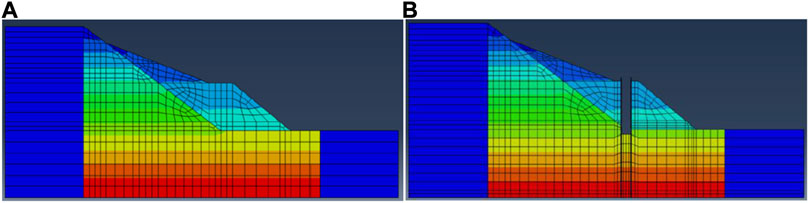
FIGURE 3. Numerical calculation model. (A) Free-field model. (B) Pile-soil model.
Slope modeling will use a model capable of accurately simulating the configuration of each geotechnical layer under diverse loading conditions. In this study, considering the model conditions and materials (soil and pile), we employ the elastic-plastic consiyutive model for the soil, the linear-elastic model for the piles, and choose the M-C criterion as the damage criterion. As depicted in Figure 4, the shear strength of the soil correlates with the normal stresses acting on the potential damage surface within the soil. This model is particularly suitable for cohesionless soils (e.g., sandy soils) and partially cohesive soils (e.g., silts) where the cohesion between soil particles is relatively low.
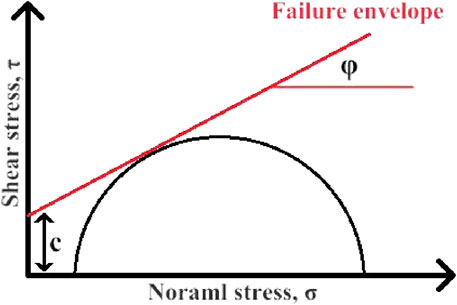
FIGURE 4. Mohr-Coulomb criterion diagram.
M- C Failure Criterion Eq:
where
The calculation of the slope stability coefficient involves employing the strength reduction method to analyze the structure’s stability. The analysis includes incrementally raising the reduction factor and iterating the process until reaching the limit state of damage. This state is identified when the slope displacement abruptly increases or when the maximum slope displacement undergoes a sudden change alongside variations in the reduction factor. At this point, the slope stability coefficient is determined.
For Mohr-Coulomb materials, the strength-based factor of safety can be expressed as follows:
So there’s
In the formula,
The model in this study is a pile-soil model, consisting of two layers of soil with different geotechnical properties. Table 2 lists the physico-mechanical parameters for each layer of the geotechnical material.
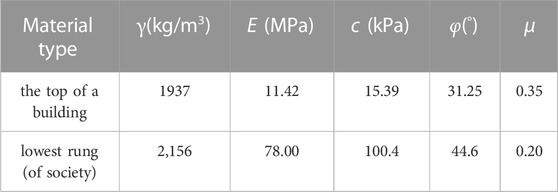
TABLE 2. Soil properties.
Studies (Dang et al., 2007) have demonstrated that rainfall influences the geotechnical slope by infiltrating rainwater, consequently altering the water content, cohesion, and internal friction angle. As the water content increases, both cohesion and the internal friction angle non-linearly decrease. At a water content of 26%, the rate of cohesion reduction slows down while the internal friction angle experiences a noticeable decrease with further increases in water content.
To investigate the pattern of stability changes in slopes affected by the combined influence of earthquakes and rainfall, numerical simulations were conducted using soil with varying water content levels: 19%, 21%, 26%, 31%, 33%, and 39%. The relevant soil parameters for different water content levels were specified as detailed in Table 3. In accordance with the guidelines outlined in the ‘People’s Republic of China Industry Standard (JTGB02-2013, 2014) Seismic Design Code for Highway Engineering,’ slope acceleration amplitudes of 0.05 g, 0.1 g, 0.15 g, and 0.20 g were applied to assess slope stability under diverse combinations of earthquake and rainfall conditions.

TABLE 3. List of parameters related to different water contents of the soil.
Seismic loading is applied by introducing seismic waves with acceleration amplitudes varying from 0.05 g to 0.20 g into the ABAQUS finite element analysis software. The seismic acceleration-time curves for the model’s base inputs are illustrated in Figure 5.
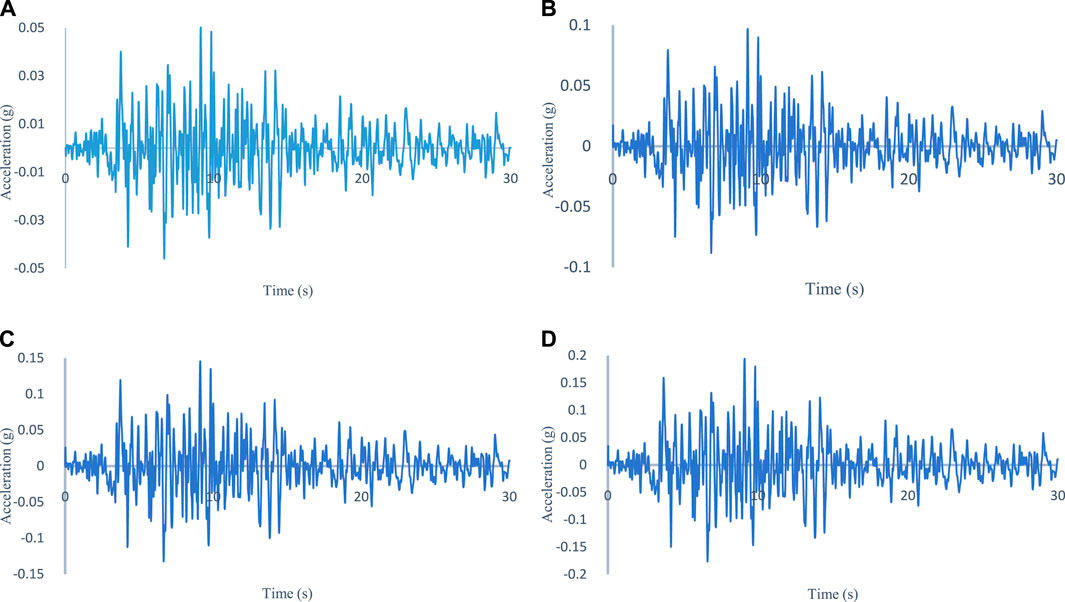
FIGURE 5. Input basement seismic acceleration-time curve (A) Free-field model (B) Pile-soil modeling. (A) PGA = 0.05 g. (B) PGA = 0.1 g. (C) PGA = 0.15 g. (D) PGA = 0.2 g.
Key features and considerations of the dynamic implicit approach in ABAQUS for seismic pile-soil modeling include:
Time Integration: the implicit time integration scheme used in ABAQUS ensures the attainment of accurate and stable solutions over a range of time steps, thereby enabling the simulation of earthquakes with various frequencies and magnitudes (as depicted in Figure 6).
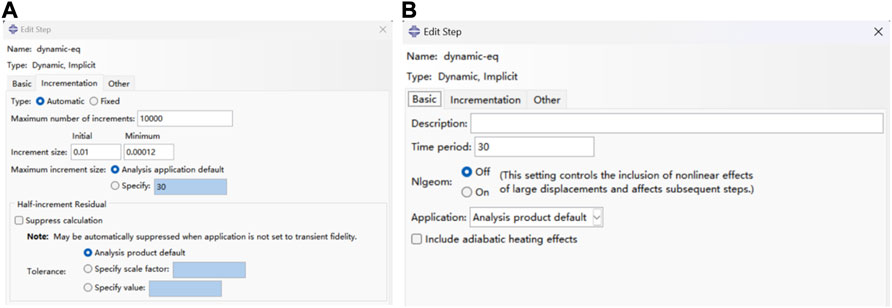
FIGURE 6. Time credit settings. (A) Free-field model. (B) Pile-soil modeling.
Material Models: ABAQUS provides a variety of material models to represent the behavior of soils, piles, and interfaces under dynamic loading. These constitutive models capture effects such as plasticity, damping, and nonlinear behavior.
Contacts and Interactions: This method models the interactions between the soil and the pile, considering factors such as pile-soil interactions, as well as soil liquefaction. Figure 7 illustrates the definition of contact and interaction between the soil and the pile.
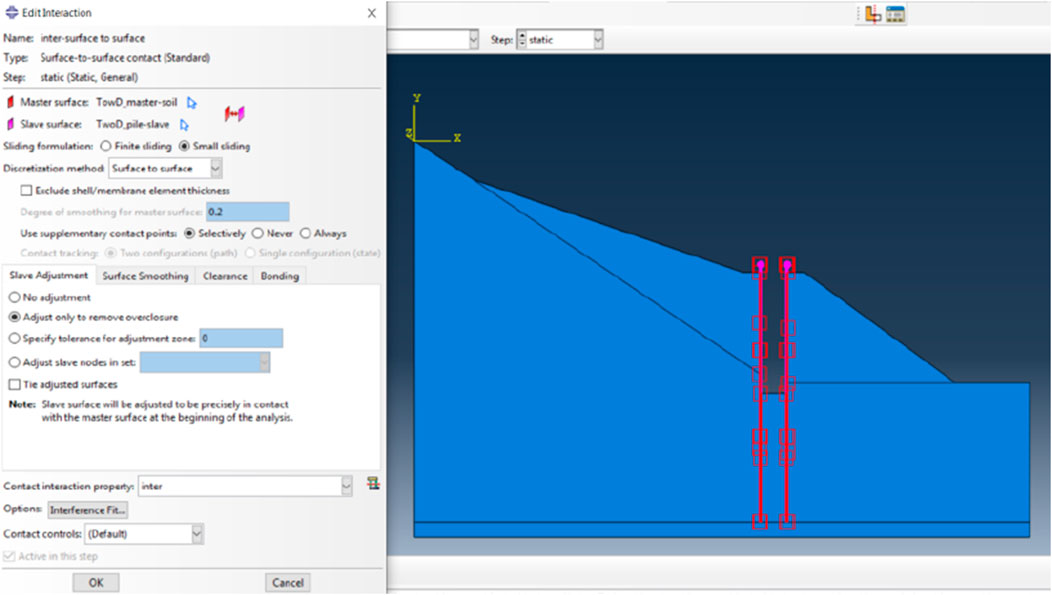
FIGURE 7. Interaction between soil and anti-slide pile through nodes and surface.
Boundary conditions: appropriate boundary conditions are defined to represent the constraints of the soil-anti-slide pile system in the actual project (Figure 8).
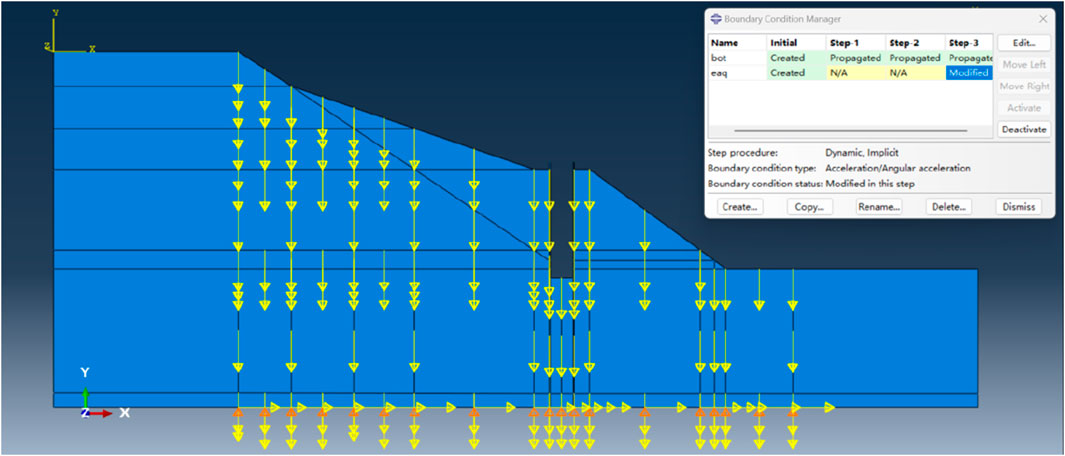
FIGURE 8. Boundary conditions of the model.
Damping: The dynamic implicit method allows the inclusion of damping effects, which are essential for accurately modeling the energy dissipation and damping mechanisms in pile-soil systems during earthquakes.
In ABAQUS, meshing is a crucial step in the Finite Element Analysis (FEA) process. Although ABAQUS lacks a dedicated ‘meshing’ module, meshing operations form the bedrock for generating precise and efficient simulations. Generally classified as part of the preprocessing phase, the meshing process is indispensable for converting intricate geometries and structures into discrete finite element sets. This representation allows for an approximation of the system’s physical behavior during analysis. An appropriate mesh structure, element type, and density are crucial for achieving accurate simulation results. The mesh quality directly affects the precision of stresses, strains, displacements, and other simulation outcomes. Furthermore, the meshing process significantly influences the convergence of the analysis. A refined mesh promotes convergence in nonlinear and dynamic simulations, ensuring stable and accurate numerical solutions.
Meshing impacts model contacts and interactions, making properly meshed models easier to visualize and comprehend. ABAQUS visualization tools allow users to scrutinize meshes, detect potential issues, and make informed decisions regarding refinements.
By analyzing the graphs (Figure 9) depicting the change in the slope’s plastic zone for different water contents (19%, 21%, 26%, 31%, 33%, and 39%), it is evident that water content has a highly significant effect on the development of the slope’s plastic zone. As water content increases, there is a clear tendency for the slope’s plastic zone to expand. When the water content is low, a small plastic zone forms from the base of the slope to the middle, and it is not widely connected. With the increase of water content, the plastic zone extends from the sliding area to the top of the slope. The equivalent plastic strain increases from 0.075 to 0.12, eventually forming a continuous plastic zone, with the equivalent plastic strain reaching 0.152. This closely aligns with the test results, and the location of fissures corresponds to the location of the plastic zone.
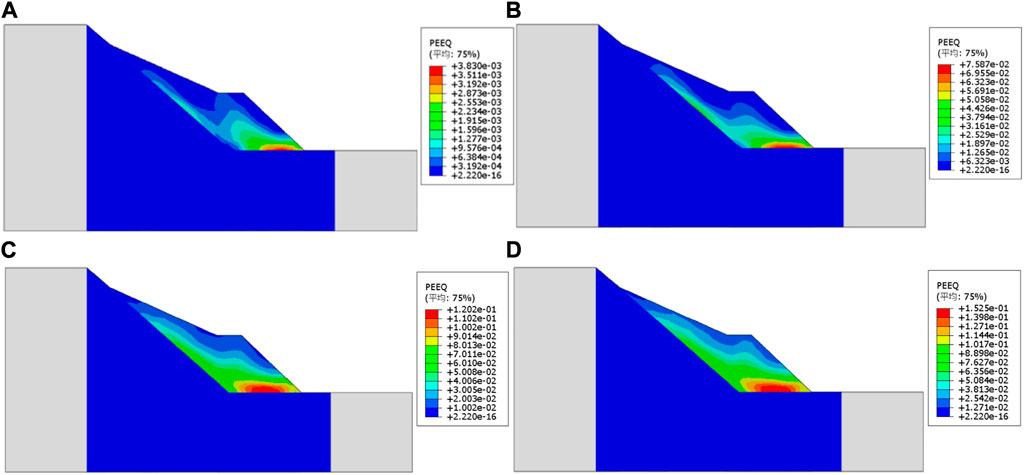
FIGURE 9. Variation of plastic zone of soil with difficult water content. (A) 19% water content (B) 26% water content (C) with 33% water content (D) 39% water content.
This section analyzes the variations in displacement at specific representative points along the slope (points 9, 25, 28, 30, 36), as depicted in Figure 10. Figure 11 showcases the displacement changes observed at these five points. The descending order of displacement change among these points is as follows: point 28 > point 9 > point 30 > point 36 > point 25. This ranking suggests that the central area of the slope experiences the most significant displacement, followed by the trailing edge, while the leading edge shows the least displacement. Consequently, point 28, which exhibits the largest slope displacement, is selected for further analysis.
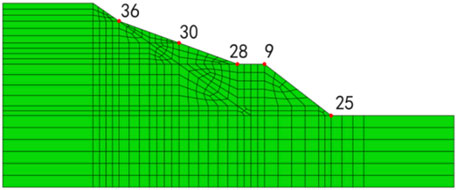
FIGURE 10. Map of observed point locations on the slope.
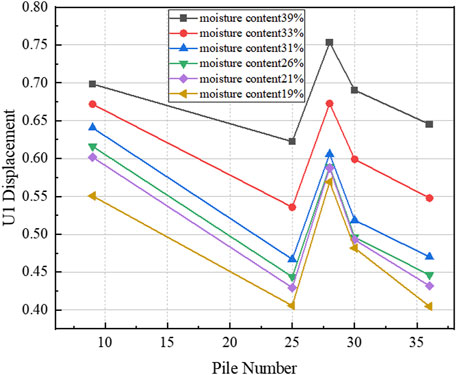
FIGURE 11. Curve of displacement with water content at different points on the slope.
The displacement change curve at point 28 on the slope, with a water content of 39% and a seismic acceleration amplitude of 0.20 g, is plotted in Figure 12. It is apparent that the displacement at point 28 rises with increasing seismic acceleration magnitude, maintaining the same water content of 39%. The most significant increase occurs when the seismic acceleration magnitude varies from 0.05 g to 0.10 g. Figure 13 also illustrates the displacement at point 28. Under a consistent seismic acceleration magnitude of 0.20 g, the displacement at point 28 increases with higher water content. The most noticeable increase in displacement occurs when the slope water content varies from 31% to 39%.
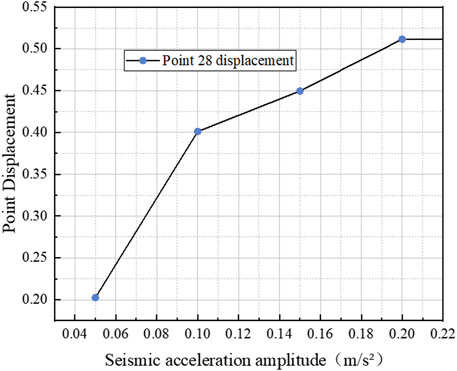
FIGURE 12. Curve of displacement as a function of seismic acceleration.
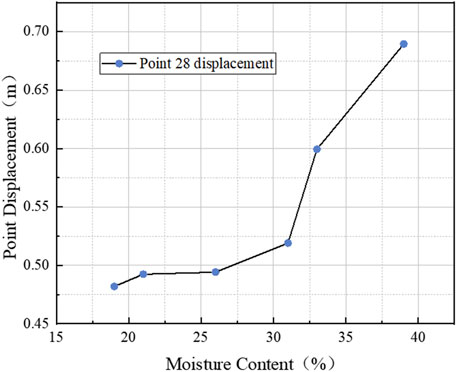
FIGURE 13. Curve of displacement as a function of moisture content.
A total of 24 sets of loading conditions were established for various rainfall conditions (water content of 19%, 21%, 26%, 31%, 33%, 39%) and seismic conditions (seismic acceleration amplitude of 0.05 g, 0.1 g, 0.15 g, 0.20 g). These conditions enabled us to derive the stability coefficient change patterns of coastal geotechnical slopes under various combinations, as depicted in Table 4.
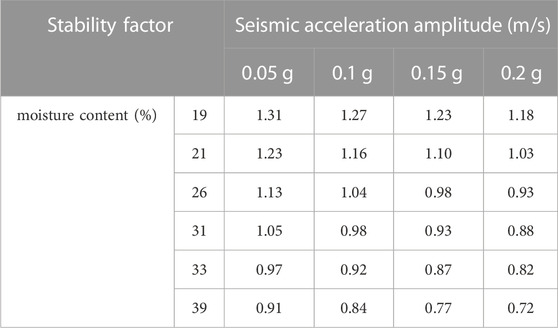
TABLE 4. Slope stability coefficients under different combinations of working conditions.
As shown in Figure 14, under the same seismic acceleration amplitude (0.05 g, 0.10 g, 0.15 g, 0.20 g), the slope’s shear strength decreases gradually as the water content increases, leading to a subsequent reduction in the stability coefficient. The stability coefficient decreases by 30.53%, 33.86%, 37.40%, and 38.98%, respectively, as the slope’s water content increases from 19% to 39%. Similarly, as presented in Figure 15, under constant slope water content, the soil’s shear stress on the slope rises with increasing seismic acceleration amplitude, causing a progressive decline in the stability coefficient. The stability coefficients decreased by 9.92%, 16.26%, 17.70%, 16.19%, 15.46%, and 20.88% sequentially as the acceleration amplitude increased from 0.05 g to 0.20 g for slope water contents of 19%, 21%, 26%, 31%, 33%, and 39%, respectively.
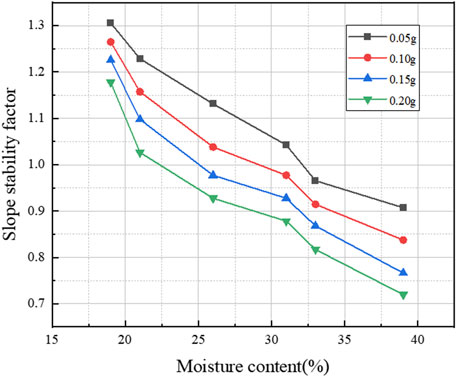
FIGURE 14. Variation curve of slope stability coefficient for different seismic acceleration amplitude conditions.
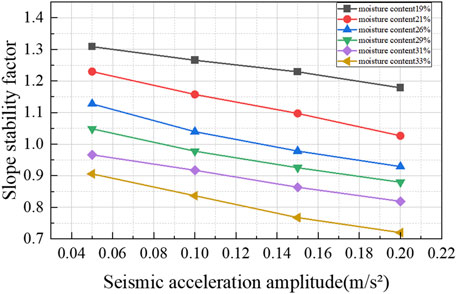
FIGURE 15. Variation curve of slope stability coefficient for different water content conditions.
Based on the analysis results presented in Figures 14, 15, it is observed that the slope stability coefficient is at its lowest when subjected to a seismic acceleration amplitude of 0.20 g and a water content of 39%. Hence, this condition can be designated as the most unfavorable working condition. The equivalent plastic strain, lateral displacement, minimum stress distribution, and maximum stress distribution of the slope under this most unfavorable condition are illustrated in Figure 16.
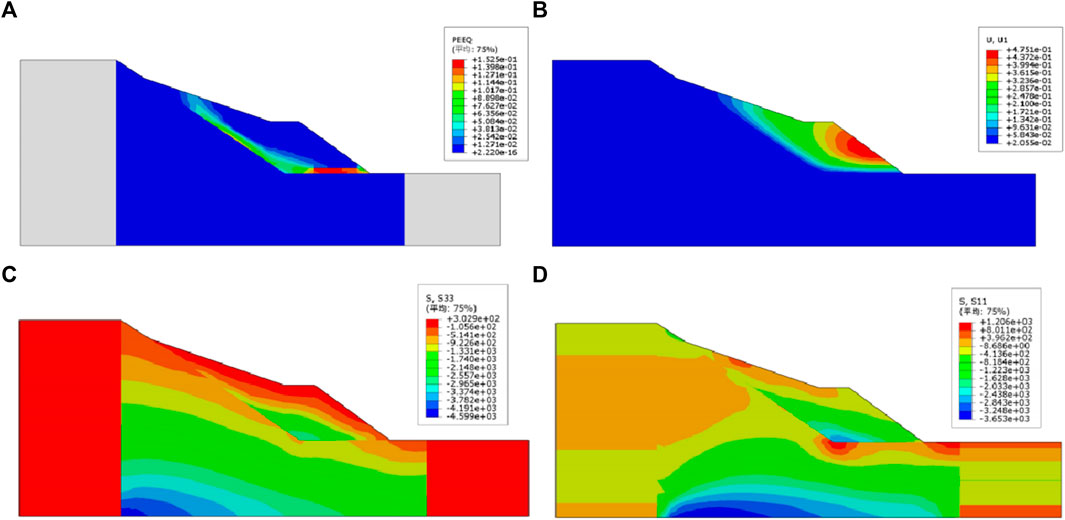
FIGURE 16. Characterization of stress field and strain field for the most unfavorable condition of the slope. (A) Equivalent plastic strain diagram (B) Lateral displacement map (C) Minimum stress distribution (D) Maximum stress distribution.
Under the most unfavourable condition combination, the plastic zone of the slope gradually expands from the top to the base of the slope, and the equivalent plastic strain at the base of the slope is the highest, reaching 0.152. In instances of slope instability, the plastic zone extends gradually from the base to the top of the slope. Lateral displacement predominantly occurs in the middle and lower sections of the slope, with the surface layer experiencing a maximum lateral displacement of 0.475 m. As the slope progresses towards its inner part, the lateral displacement steadily decreases. The maximum and minimum principal stresses along the longitudinal direction of the slope are 1206 N and 302.9 N, respectively. Additionally, the maximum lateral displacement of the slope surface is 0.475 m, which gradually reduces as it extends towards the interior of the slope.
In slope engineering management, anti-slip piles wield significant influence and are widely employed across various projects. In recent decades, they’ve been effectively used to stabilize numerous slopes. However, geological conditions in different landslide-prone areas can vary significantly. Particularly in the presence of sudden events such as earthquakes and heavy rainfall, the effectiveness of anti-slip piles and the overall stability coefficients of slopes can dynamically fluctuate. Moreover, traditional anti-slip pile design often involves a level of subjectivity and arbitrariness when determining design parameters. In specific slope lands, this design approach might pose potential risks to slope stability due to insufficient safety margins, while in other cases, it could result in unnecessary project costs due to excessive safety margins. Consequently, the theory and methodology of anti-slip pile design are not yet fully developed, especially lacking a unified standard for selecting principles and calculation methods for anti-slip pile design parameters. Moreover, the wide array of slope geotechnical parameters, slope types, and slope hydrogeology, among other factors, presents numerous variations that must be considered in the decision-making process to derive the most viable solutions. Thus, a comprehensive understanding of the mechanics of anti-slip piles becomes crucial for the specific slope environment. It involves elucidating the authentic pile-soil synergistic effects on internal displacement, plastic zone, and variations in the stability coefficient change patterns of the slope, thereby determining the optimal approach to anti-slip pile design. Of all the design aspects of anti-slip piles, the positioning of these piles stands out as the most crucial design parameter. This section delves into an analysis using the coastal geotechnical slope near Laoshan Railing in Qingdao as an example to explore the selection of different configurations for anti-slip piles. This investigation focuses on the most adverse conditions, encompassing the combined effects of rainfall and earthquakes. Specifically, the investigation involves a slope exposed to a seismic acceleration of 0.20 g and a soil water content of 39%. The study evaluates the impact of these factors on the plastic zone, displacement, and slope stability to determine the optimal design for anti-slip piles. To facilitate in the selection of the most suitable positioning for anti-slip piles under these extreme conditions and provide guidance for analogous designs of coastal geotechnical slopes, we have developed the following methodology for anti-slip pile design in such settings.
In this section, we consider the most extreme conditions involving the combined influence of earthquakes and rainfall, where the slope experiences a seismic acceleration amplitude of 0.20 g and maintains a soil water content of 39%. We investigate the optimal locations for anti-slip piles and propose three different pile positions, spanning from the foot to the lower part of the slope for the study (refer to Figure 17). Table 5 and Figures 18, 19 present the slope stability coefficients, maximum transverse displacements, and distribution regions of the plastic zone for the three types of pile positions, respectively.
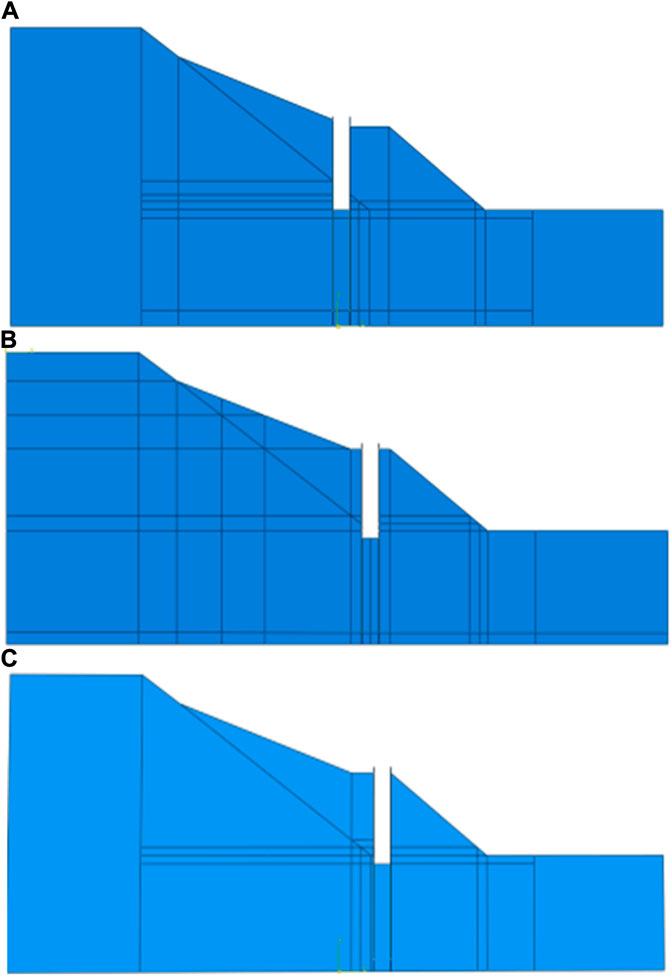
FIGURE 17. Schematic diagram of different pile designs. (A) Slip-resistant pile position occurs when l/L is 0.441. (B) Slip-resistant pile position occurs when l/L is 0.355. (C) Slip-resistant pile position occurs when l/L is 0.321.
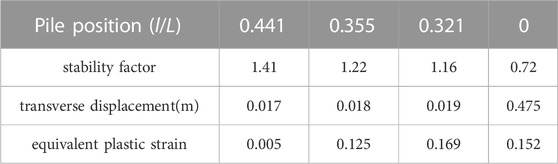
TABLE 5. Table of simulation results for pile changes.
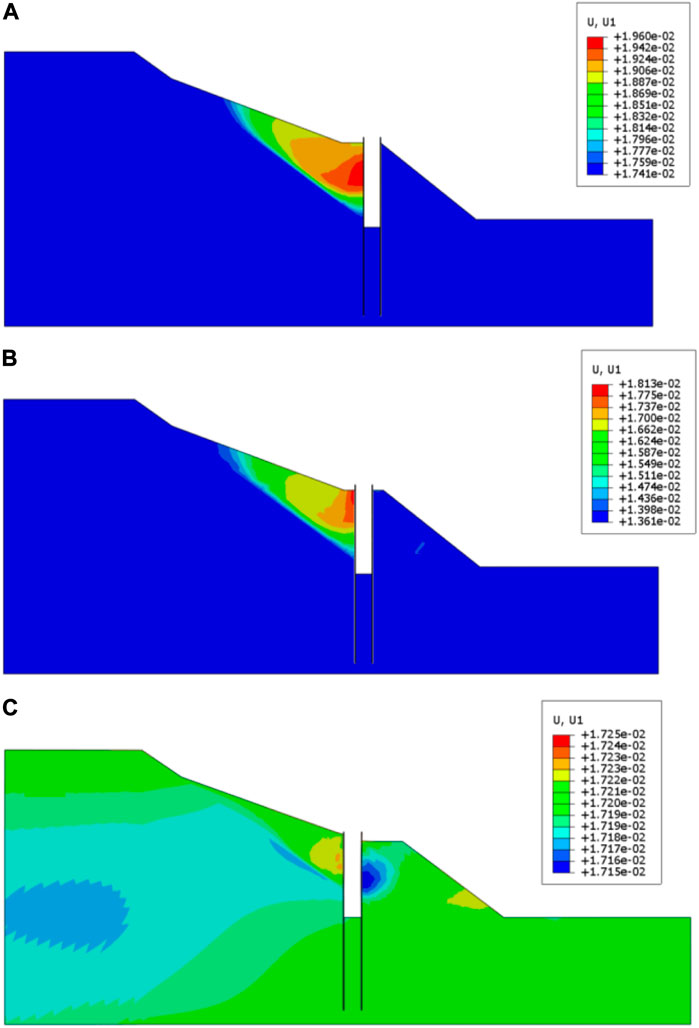
FIGURE 18. Lateral displacement of the slope for the most unfavorable condition when l/L change. (A) l/L = 0.321. (B) l/L = 0.355. (C) l/L = 0.441.
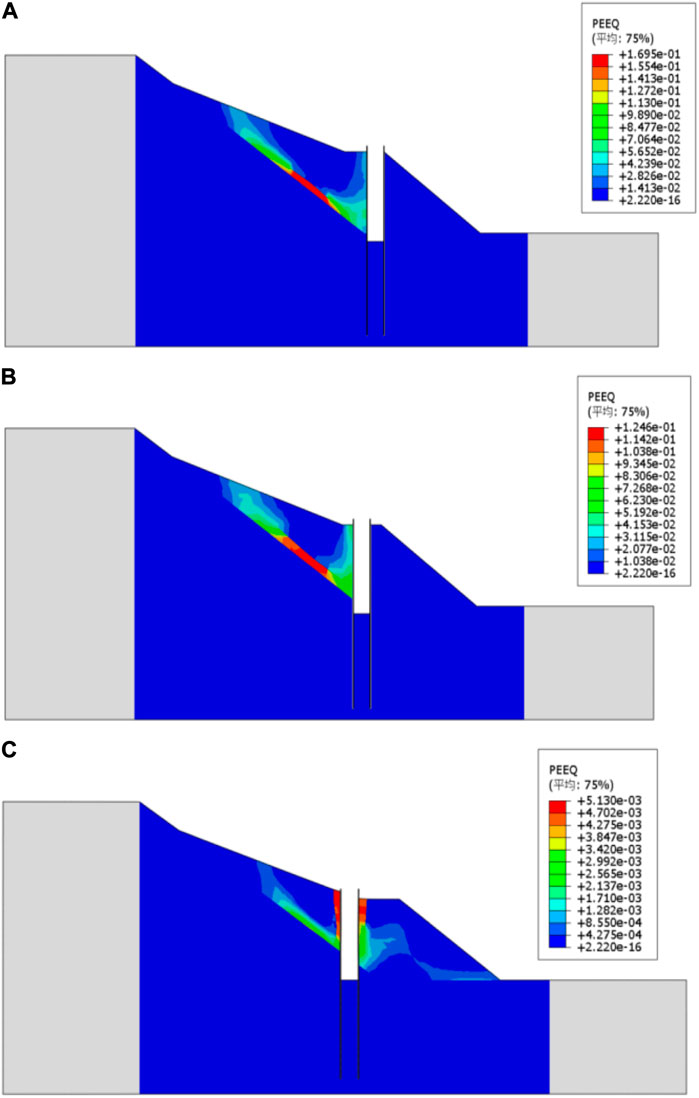
FIGURE 19. Distribution of slope plasticity zones for l/L is change. (A) l/L=0.321. (B) l/L = 0.355. (C) l/L = 0.441.
As shown in Figure 18A and Figure 19A, when l/L is 0.321, the anti-slip pile is positioned very close to the slope. This positioning places the anti-slip pile too far forward, leaving a substantial area of unreinforced soil at the slope’s rear vulnerable to potential sliding surfaces generated under external dynamic loads like earthquakes or rainfall. The slope’s stability coefficient stands at 1.16, marking a 61.11% increase over the value of 0.72 without piles. The maximum lateral displacement of the slope measures 0.019 m, accompanied by a maximum equivalent plastic strain of 0.169. Despite minimal slope displacement, the improper location design underutilizes the reinforcing capacity of the anti-slip piles, constraining their effectiveness.
At l/L = 0.355 (Figure 18B; Figure 19B), the slope’s stability coefficient increases by 69.44% compared to the slope without piles, reaching a value of 1.22. The maximum lateral displacement measures 0.018 m, accompanied by a maximum equivalent plastic strain of 0.125. However, the slightly increased distance from the front leaves some unconsolidated soil similar to the scenario at l/L = 0.321. This unconsolidated soil may result in a new plastic zone in the rear of the slope, potentially forming a new sliding surface. Nonetheless, this solution represents an improvement over the previous one as it reinforces a larger area of the affected soil.
At l/L = 0.441 (Figure 18C; Figure 19C), with the anti-slip pile positioned at the back of the leading edge of the slope, the stability coefficient reaches 1.41. This marks a 95.83% increase in slope stability compared to the condition without piles. The maximum lateral displacement measures 0.017 m, with an equivalent plastic strain of only 0.005. This placement maximizes the strengthening effect of the anti-slip piles, resulting in the highest stability coefficient for the slope.
To summarize, it can be concluded that anti-slip piles enhance the stability coefficient of the slope. Overall slope stability improves with an increase in the distance between the anti-slip pile location and the leading edge of the slope. The optimal pile position is near the back of the leading edge with l/L equal to 0.441. At this point, the anti-slip pile’s supporting effect is most effective, resulting in the highest slope stability.
After analyzing the calculation results, significant changes in the slope stability coefficient due to the combined effects of rainfall and earthquakes are evident. It is inferred that rainfall primarily impacts landslides in several ways. Firstly, rainfall exerts a load-boosting effect on landslide soils by increasing water infiltration, consequently raising the moisture content of rocks and soil, resulting in higher density. This, in turn, results in an increase in shear stress on the sliding surface. Secondly, rainfall infiltration affects the strength parameters of the landslide, as higher soil moisture content reduces matrix suction, consequently lowering the strength parameters.
The effects of seismic activity on landslides include the following phenomena: seismic loading induces significant disturbances within the landslide, leading to the enlargement of geotechnical cracks, increased permeability of the landslide, and subsequent plastic deformation. Additionally, seismic forces cause a sudden increase in pore water pressure within the geotechnical material, resulting in a decrease in effective stress. Both of these situations contribute to the reduction of geotechnical strength.
In this chapter, the stability of coastal geotechnical slopes under the combined effects of earthquakes and rainfall is analyzed based on actual conditions. Simultaneously, an optimal design study for anti-slip pile positioning is conducted by selecting the most unfavorable combination of conditions. The main conclusions are as follows.
(1) As the water content increases, the shear strength of the slope decreases, leading to an expansion of the plastic zone. When the water content is low, a small and disjointed plastic zone forms from the base of the slope to the middle of the slide. However, with an increase in water content, the plastic zone extends from the sliding area to the top of the slope, gradually forming a continuous plastic zone.
(2) Analyzing the displacement patterns of representative key points on the slope while discounting the slope’s shear strength parameters reveals that the central region of this coastal geotechnical slope experiences the greatest displacement, followed by the trailing edge, while the leading edge exhibits the least displacement. When focusing on the central point as the subject of analysis, it is observed that, at the same water content (39%), the displacement at the central point increases as the seismic acceleration amplitude rises. The most significant increase is noted when the seismic acceleration amplitude ranges from 0.05 g to 0.10 g. At the same seismic acceleration amplitude (0.20 g), the displacement at the central point increases with higher water content, particularly in the range from 31% to 39%, resulting in a notable rise in displacement. Similarly, for the equivalent seismic acceleration magnitude (0.20 g), an increase in water content leads to an increase in displacement at the central point. The most pronounced increase in displacement is observed when the water content varies from 31% to 39%.
(3) The combined influence of rainfall and earthquakes significantly impacts slope stability. With the same seismic acceleration amplitude, an increase in water content results in a decrease in slope shear strength and a subsequent gradual decline in its stability coefficient. Similarly, maintaining the same water content within the slope, an increase in seismic acceleration amplitude leads to heightened shear stress in the soil, consequently causing a gradual decrease in the slope’s stability coefficient. Remarkably, the most substantial reduction in the slope stability coefficient happens when intense rainfall, marked by elevated water content within the slope, aligns with a high seismic acceleration amplitude, placing the slope in its most unfavourable working condition.
(4) The stability coefficient significantly increases with the installation of anti-slip piles on the slope. As the distance between the anti-slip pile and the leading edge of the slope increases, the stability coefficient of the slope gradually improves. Based on the project’s conditions, the optimal location for the anti-slip pile is near the leading edge of the slope at the rear, with l/L equal to 0.441.
The original contributions presented in the study are included in the article/Supplementary material, further inquiries can be directed to the corresponding author.
YJ: Methodology, Software, Writing–original draft, Writing–review and editing. SL: Writing–original draft, Writing–review and editing. MA: Software, Writing–original draft, Writing–review and editing. DX: Writing–review and editing. HY: Writing–review and editing. JL: Supervision, Writing–review and editing.
The authors declare financial support was received for the research, authorship, and/or publication of this article. Supported by the Shandong Provincial Natural Science Foundation (Grant No. ZR2021YQ31); Taishan Scholars Program (Grant No. tsqn202211176); National Nature Science Foundation of China (Grant No. 42277135); Joint Funds of the National Natural Science Foundation of China (Grant No. U2006225).
Author HY was employed by Qingdao Port International Co., Ltd.
The remaining authors declare that the research was conducted in the absence of any commercial or financial relationships that could be construed as a potential conflict of interest.
All claims expressed in this article are solely those of the authors and do not necessarily represent those of their affiliated organizations, or those of the publisher, the editors and the reviewers. Any product that may be evaluated in this article, or claim that may be made by its manufacturer, is not guaranteed or endorsed by the publisher.
Asheghabadi, M. S., and Ali, Z. (2019). Infinite element boundary conditions for dynamic models under seismic loading. Indian J. Phys. 94 (6), 907–917. doi:10.1007/s12648-019-01533-4
Asheghabadi, M. S., and Cheng, X. (2020a). Analysis of undrained seismic behavior of shallow tunnels in soft clay using nonlinear kinematic hardening model. Appl. Sci. 10 (8), 2834. doi:10.3390/app10082834
Asheghabadi, M. S., and Cheng, X. (2020b). Investigation of seismic behavior of clay-pile using nonlinear kinematic hardening model. Adv. Civ. Eng. 2020, 1–15. doi:10.1155/2020/9617287
Asheghabadi, M. S., Sahafnia, M., Bahadori, A., and Bakhshayeshi, N. (2019). Seismic behavior of suction caisson for offshore wind turbine to generate more renewable energy. Int. J. Environ. Sci. Technol. 16 (16), 2961–2972. doi:10.1007/s13762-018-2150-8
Chen, J., Yang, Z., and Li, X. (2005). Relationship between landslide occurrence probability and precipitation conditions in the Three Gorges reservoir area. J. Rock Mech. Eng. 24 (17), 3052–3056.
Chen, Z., and Meng, B. (1995). Spatial and temporal distribution and correlation of rainfall-type landslide debris flows and their rainfall factors in Hubei Province. Geotechnics 16 (3), 62–69. doi:10.16285/j.rsm.1995.03.010
Dang, J., Hu, L., and Nan, S. (2007). Study on the effect of water content and natural density on shear strength parameters of soil. West. China Sci. Technol. 7 (5), 14–15.
Jia, Y., Lv, W., He, K., et al. (2023). Experimental study on slope stability of accumulation layer under traffic load. J. Water Resour. Archit. Eng. 21 (03), 65–73. doi:10.3969/j.lssn.1672-1144.2023.03.010
JTGB02-2013 (2014). Seismic design Code for highway engineering [S]. Beijing: People’s Transportation Press.
Liangyu, C. (2023). Stability analysis of slopes under the combined effect of rainfall and earthquake[D]. Zhenjiang, Jiangsu, China: Jiangsu University.
Pu, X. (2017). Study on the instability of loess slope under earthquake and rainfall coupling action based on large shaking table model test[D]. Lanzhou, Gansu, China: Lanzhou Institute of Seismology.
Sang, G. (2023). Study on the stability influencing factors and optimization analysis of slope reinforced by anti-slip pile[D]. Hefei, Anhui, China: Anhui Jianzhu University.
Keywords: slope stability, seismic effects, rainfall, anti-slide piles, coastal geotechnical structures
Citation: Jia Y, Luan S, Asheghabadi MS, Xing D, Yuan H and Liu J (2024) Slope stability analysis of coastal geotechnical structures under combined effects of earthquake and rainfall. Front. Earth Sci. 11:1335756. doi: 10.3389/feart.2023.1335756
Received: 09 November 2023; Accepted: 08 December 2023;
Published: 08 January 2024.
Edited by:
Jianyong Han, Shandong Jianzhu University, ChinaCopyright © 2024 Jia, Luan, Asheghabadi, Xing, Yuan and Liu. This is an open-access article distributed under the terms of the Creative Commons Attribution License (CC BY). The use, distribution or reproduction in other forums is permitted, provided the original author(s) and the copyright owner(s) are credited and that the original publication in this journal is cited, in accordance with accepted academic practice. No use, distribution or reproduction is permitted which does not comply with these terms.
*Correspondence: Junwei Liu, bGl1anVud2VpQHF1dC5lZHUuY24=
Disclaimer: All claims expressed in this article are solely those of the authors and do not necessarily represent those of their affiliated organizations, or those of the publisher, the editors and the reviewers. Any product that may be evaluated in this article or claim that may be made by its manufacturer is not guaranteed or endorsed by the publisher.
Research integrity at Frontiers
Learn more about the work of our research integrity team to safeguard the quality of each article we publish.